



SUMMARY
Metastasis to vital organs remains the leading cause of cancer-related deaths, emphasizing an urgent need for actionable targets in advanced-stage cancer. The role of mitochondrial Rho GTPase 2 (MIRO2) in prostate cancer growth was recently reported; however, whether MIRO2 is important for additional steps in the metastatic cascade is unknown. Here, we show that knockdown of MIRO2 ubiquitously reduces tumor cell invasion in vitro and suppresses metastatic burden in prostate and breast cancer mouse models. Mechanistically, depletion of MIRO2’s binding partner—unconventional myosin 9B (MYO9B)—reduces tumor cell invasion and phenocopies MIRO2 depletion, which in turn results in increased active RhoA. Furthermore, dual ablation of MIRO2 and RhoA fully rescues tumor cell invasion, and MIRO2 is required for MYO9B-driven invasion. Taken together, we show that MIRO2 supports invasion and metastasis through cooperation with MYO9B, underscoring a potential targetable pathway for patients with advanced disease.
Graphical Abstract

In brief
Boulton et al. report that MIRO2 is required for breast and prostate cancer invasion and metastasis. This role is mediated via interaction with MYO9B and repression of RhoA activation. This signaling may be relevant in patients, as higher MIRO2 expression is associated with downregulation of RhoA-specific genes.
INTRODUCTION
Tumor progression to metastasis involves multiple steps starting with primary tumor growth, invasion into the local tissue, dissemination of cancer cells via the hematogenous and lymphatic systems, and survival and reprogramming of the secondary sites with eventual overt growth of metastatic tumors.1 While current therapies have increased prognosis for patients, overall survival for patients with metastases remains low,2,3 underscoring the importance of understanding the mechanisms of metastatic dissemination. In this context, mitochondria have recently emerged as critical organelles for the promotion of tumorigenesis.4 These multifunctional organelles can support cell survival, metabolic reprogramming, drug resistance, cell motility, and metastasis; thus, mitochondria are emerging as therapeutic targets in cancer.5
Mitochondrial Rho GTPases (MIRO1/2) are a family of atypical GTPases with mitochondrial localization.6 MIRO1 has been extensively studied in neurons for its role in mitochondrial trafficking, where it connects mitochondria to kinesin and dynein motors through adapter proteins.7–9 While the role of MIRO1 in mitochondrial trafficking is conserved, we and others have shown that MIRO2 is dispensable for mitochondrial subcellular distribution in non-neuronal cells, with the notable exception of oncogenic Myc-driven cancers.10–12 Previously, we demonstrated that MIRO2 is required for prostate cancer (PCa) growth in vitro and in vivo and that MIRO2 mRNA is overexpressed in cancer versus normal tissues across multiple tissues, positively correlating with poorer patient survival.11,13 We and others have provided limited evidence that MIRO2 modulates tumor cell motility and invasion; however, conclusions were derived from a single cell line, and there are contradictory reports as to whether MIRO2 is enabling12,13 or suppressing14 cell motility. While this early evidence suggests an important role for MIRO2 in tumor progression, we still lack a comprehensive knowledge of the role of MIRO2 in the metastatic cascade.15
In this study, we explored the functional and mechanistic role MIRO2 plays in the context of tumor cell invasion and metastasis. We observed a universal requirement of MIRO2 for efficient tumor cell invasion in prostate, breast, skin, and pancreatic cancer cells. Furthermore, we showed that MIRO2 is necessary for metastasis in breast syngeneic orthotopic or prostate xenogeneic mouse models. At the mechanistic level, we identified a signaling node in which MIRO2 interacts with the small GTPase RhoA and its regulatory protein, MYO9B, leading to inactivation of RhoA and increased tumor cell invasion. This signaling may be relevant in patients, as we show: (1) MIRO2 is expressed almost exclusively in the epithelium of primary and metastatic tumors of the prostate and breast and (2) higher MIRO2 expression is associated with downregulation of RhoA-specific genes. In summary, we propose a signaling pathway that supports metastatic potential of multiple cancer types and may provide therapeutic targets for advanced disease.
RESULTS
MIRO2 depletion universally impairs tumor cell invasion
We examined the role of MIRO2 in tumor cell invasion using a panel of highly invasive human cell lines, including breast cancer (BCa; MDA-MB-231, MDA-MB-468, BT-20, and BT-549), PCa (PC3, DU145, and C4–2), melanoma (RPMI-7951 and SK-MEL-28), and pancreatic cancer (MIA PaCa-2 and PANC-1). These tumor types were selected based on prior evidence connecting them with overexpression of MIRO2 compared to normal tissues and association with poorer patient survival.13 We performed transwell invasion assays and found that transient depletion of MIRO2 in every cell line tested via two independent small interfering RNAs (siRNAs) significantly reduced the invasive capacity compared to control cells (Figures 1A–1C and S1A–S1C). Importantly, multiple independent short hairpin RNA (shRNA) sequences were used to deplete MIRO2 stably, and they all consistently reduced tumor cell invasion in comparison to control cells (Figures S1F–S1H). Furthermore, transient transfection of MIRO2 cDNA into MIRO2-depleted cells rescued tumor cell invasion to ~80% of the control levels (Figures S1I–S1K). One of the drawbacks of transwell invasion assays is the confounding influence of cell growth; thus, we sought to determine if MIRO2 affected growth over the length of our invasion assays. While we found that ablation of MIRO2 had marginal effects on short-term cell growth (Figures 1D and S1D), the magnitude of change in growth caused by depletion of MIRO2 was far smaller than the changes in invasive capacity (Figures 1E and S1E). This finding suggests that the changes in invasion caused by depletion of MIRO2 cannot be explained by growth defects. In summary, we find that MIRO2 is a positive regulator of tumor cell invasion in a broad panel of cell lines from disparate tissues.
Figure 1. MIRO2 depletion universally impairs BCa and PCa tumor cell invasion.

The indicated cell lines were transfected with control (C) or MIRO2-targeting siRNA (M2a and M2b, two independent sequences) and used for downstream assays at 72 h post-transfection.
(A) Western blot was carried out to confirm MIRO2 knockdown. Representative blots from n = 3 experiments are shown.
(B and C) Cells were seeded in transwell invasion assays and allowed to invade for 16–24 h. (B) Representative images of invasive cells stained with DAPI. (C) Quantification of invaded cells/field, relative to control. Data are represented as the mean ± SEM (n = 3), and means were compared by one-way ANOVA and Dunnett’s post-test.
(D) Cell growth was determined by CyQUANT cell proliferation assay measured at the time of plating and at 24 h post-plating. Data were calculated as the differential growth relative to control and are represented as the mean ± SEM (n = 3). Means were compared by one-way ANOVA and Dunnett’s post-test.
(E) Comparison of the changes in invasion and growth in MIRO2 knockdown cells relative to control cells from (C) and (D), respectively. Data are represented as the mean ± SEM (n = 3), and means were compared by two-tailed unpaired t test.
For (C)–(E), p values are represented as ns, not significant (p > 0.05), or *p < 0.05, **p < 0.01, ***p < 0.001, or ****p < 0.0001.
See also Figure S1.
MIRO2 depletion dampens metastatic burden in prostate and breast cancer
We next sought to evaluate the importance of MIRO2 in metastasis using in vivo models. To model late-stage PCa metastasis, we injected PC3 cells stably expressing red-shifted luciferase (Luc) plus either control or MIRO2 targeting shRNA (Figure 2A) into the tail vein of male NSG mice and evaluated metastatic burden over time via IVIS imaging. While control PC3 cells were able to form Luc+ metastatic disease that increased over time, we found that depletion of MIRO2 virtually eliminated metastatic burden in mice (Figures 2B and 2C). Histology analysis of liver and kidney—the primary sites of metastasis within this model—revealed metastatic foci in tissue sections of mice injected with control PC3 cells, while mice injected with the MIRO2-knockdown cells had very small or no visible metastatic foci (Figures 2D–2F). A caveat with this model is that cells injected into the circulation may be subject to suspension and sheer stresses; thus, metastatic burden could be confounded by cell death caused by suspension stress. To address this possibility, we examined cell viability under prolonged suspension induced by ultra-low attachment (ULA) conditions. MIRO2 depletion did not further reduce cell viability in ULA conditions (Figure S2A), suggesting that reduced metastatic burden in MIRO2-knockdown groups is not caused by differences in cell death upon injection into the circulation.
Figure 2. MIRO2 depletion dampens metastatic burden in vivo.

(A–F) PC3 cells stably expressing luciferase (Luc) and either control (C) or MIRO2-targeting shRNA (M2b and M2d, two independent sequences) were injected into the tail vein of male NSG mice (n = 12), and metastatic burden was determined via bioluminescence IVIS imaging. (A) Efficiency of knockdown at the time of injection was analyzed via western blot. (B) Representative IVIS images of mice at the endpoint (day 50 post-injection). (C) Quantification of Luc signal throughout the study. Data are represented as the mean ± SEM (n = 12), and means were compared by two-way ANOVA and Dunnett’s post-test. (D–F) Target organs containing Luc+ signal were analyzed histologically in hematoxylin and eosin-stained sections for the presence of metastatic foci. (D) Representative images of hematoxylin and eosin stains. Metastatic foci are outlined with black dashed lines. Quantification of metastatic burden in liver (E) and kidney (F) is represented as the mean ± SEM (n = 12), and means were compared by one-way ANOVA and Dunnett’s post-test.
(G–L) 4T1 cells stably expressing Luc and either control (C) or MIRO2-targeting shRNA (M2a and M2b, two independent shRNA sequences) were injected into the mammary fat pad of female BALB/c mice (n = 10). (G) Efficiency of knockdown at the time of injection was analyzed via western blot. (H) Primary tumors were measured with calipers to quantitate tumor volume. Data are represented as the mean ± SEM (n = 10), and means were compared by two-way ANOVA and Dunnett’s post-test. (I) Primary tumors were removed at around 450 mm3 and metastatic disease was tracked via IVIS imaging. Representative images of mice at the endpoint (day 14 post-primary tumor removal). Red boxes highlight the region where the Luc signal was measured to avoid the location of primary tumors that were resected. (J) Quantification of Luc signal, with data represented as the mean ± SEM (see STAR Methods for group size explanation; n = 9 for shC and shM2b and n = 7 for shM2a). Means were compared by two-way ANOVA and Dunnett’s post-test. (K) Target organs containing Luc+ signal were analyzed histologically in hematoxylin and eosin-stained sections for the presence of metastatic foci. Representative images of lungs are provided, with metastatic foci outlined with black dashed lines. (L) Quantification of metastatic burden in lungs. Data are represented as the mean ± SEM (see STAR Methods for group size explanation; n = 10 for control, n = 6 for shM2a, and n = 8 for shM2b), and means were compared by one-way ANOVA and Dunnett’s post-test.
For (C), (E), (F), (H), (J), and (L), p values are represented as ns, not significant (p > 0.05), or *p < 0.05, **p < 0.01, ***p < 0.001, or ****p < 0.0001.
See also Figure S2.
As a complementary model that allows for examination of all steps of the metastatic cascade, we used a syngeneic model where 4T1 cells were orthotopically injected into the mammary fat pad of female BALB/c mice. After implantation of 4T1 cells stably expressing Luc and either a control or a MIRO2-targeting shRNA (Figure 2G), tumors were allowed to grow until an average size of 450 mm3 (approximately 3 weeks) and surgically resected. Animals were allowed to recover for 4 days, and metastatic burden was tracked over time via IVIS imaging (Figure S2B). Primary tumor growth of 4T1 cells was not affected by MIRO2 depletion (Figure 2H). On the other hand, we found that MIRO2 knockdown significantly reduced spontaneous Luc+ metastatic disease from the orthotopic site compared to control (Figures 2I and 2J). Consistent with our IVIS results, histology analysis of lung sections—the primary site of metastasis within this model—showed a reduction in total metastatic burden (Figures 2K and 2L). Taken together, we conclude from these results that MIRO2 is critical for cancer metastasis in multiple contexts.
MIRO2 expression in primary and metastatic tumors
Limitations of previous studies examining MIRO2 mRNA expression in cancer13 include: (1) sequencing was performed on bulk tumor samples, thus profiling both tumor and stromal cells, and (2) samples predominantly represented primary tumors, with few tumors from metastatic sites profiled. To address these limitations, we examined MIRO2 protein expression comparing the epithelial and the stromal compartments of primary and metastatic tumors. Using a cancer universal tissue microarray (TMA), we found that MIRO2 was expressed in all tumor types tested, including primary bladder, breast, colorectal, gastric, endometrial, ovary, prostate, and non-small cell lung cancer (NSCLC; Figure S3A). We next turned to a PCa progression TMA that included primary tumors from patients with non-recurrent (NR) or recurrent (R) disease as well as visceral and bone metastases. Analysis of MIRO2 expression in these TMAs revealed that the stromal compartment in virtually all cases had negative staining (immunohistochemistry [IHC] score 0) (Figures 3A–3C and S3B). In contrast, most of the cases in the epithelial compartments contained low to moderate (IHC score 1–2) staining intensity. While there was an increase in cases with negative staining in the metastatic tissues (34%) in comparison to primary NR (8%) and primary R (15%) tumors, the average MIRO2 expression between primary and metastatic tissues was almost identical (Figure 3C). Interestingly, we found similar trends in MIRO2 expression comparing bone to visceral metastases, with most cases staining negative for MIRO2 for the stroma and with low to moderate staining intensity in the metastases (Figure S3C). Furthermore, we found that MIRO2 expression did not correlate with Gleason grade or prostate-specific antigen levels (Figures S3D and S3E).
Figure 3. MIRO2 is expressed in the epithelium of human primary and metastatic tumors.

(A–C) A PCa progression TMA was stained for MIRO2 via IHC and analyzed for expression. NR, non-recurrent; R, recurrent. (A) Representative images of MIRO2 stains in primary and metastatic PCa tumors. (B) Distribution of MIRO2 expression scores. (C) Average MIRO2 expression in stromal and epithelial compartments. Data are represented as the mean ± SEM (n = 127 for primary tumors and n = 181 for metastatic tumors). *p = 0.0189 and ****p < 0.0001 by one-way ANOVA and Tukey’s post-test.
(D–F) A BCa TMA was stained for MIRO2 via IHC and analyzed for expression. (D) Representative images of MIRO2 stains in primary and metastatic BCa tumors. (E) MIRO2 expression according to nodal status (N0–N3) of primary tumors. Data are represented as the mean ± SEM (n = 53 for N0 tumors, n = 46 for N1 tumors, and n = 21 for N2–3 tumors). ns, not significant (p > 0.05), and ****p < 0.0001 by one-way ANOVA and Tukey’s post-test. (F) MIRO2 expression according to tumor grade. Data are represented as box and Tukey whiskers (n = 16 for tumor grade 1, n = 67 for tumor grade 2, and n = 43 for tumor grade 3). p = 0.7087 by one-way ANOVA.
See also Figure S3.
We next evaluated MIRO2 expression in a BCa progression TMA that contained node-negative or node-positive primary tumors, lymph node metastases, and metastases from distal sites, including the brain, liver, lung, and bone. In this BCa cohort, we found limited staining of MIRO2 in the stromal compartment, with low to moderate MIRO2 expression in the epithelial compartment (Figures 3D and 3E). In addition, we find that MIRO2 expression does not correlate with many clinical attributes, including tumor grade (Figure 3F), histological features (Figure S3F), or receptor status (Figure S3G). Of note, MIRO2 expression was significantly higher in breast tissues in comparison to disseminated tumors in other tissues (Figure S3H).
Finally, we examined MIRO2 expression in an NSCLC series that includes primary lung and brain metastases.16 In this cohort, there was an increase in MIRO2 expression in brain metastases in comparison to the primary tumors (Figures S3I and S3J). Interestingly, MIRO2 expression was similar between primary tumors regardless of metastasis status (Figure S3J). Taken together, we find that MIRO2 is expressed in many tumor types and stages of tumor progression and is more specific to the tumor epithelial cells than the normal stromal compartment. While the proportion of MIRO2-positive tissues decreased in PCa and BCa metastasis compared to primary tumors, most primary and metastatic tumors are positive for MIRO2.
MYO9B binds MIRO2 and is critical for tumor cell invasion
Next, we explored the mechanisms by which MIRO2 facilitates tumor cell invasion. We previously generated an interactome for MIRO2 with the goal of identifying signaling effectors for MIRO2.11 Using this dataset, we looked for MIRO2 binding partners that are also known to positively regulate tumor cell motility and invasion. We decided to explore the role of unconventional myosin 9b (MYO9B), which plays important roles in migration and invasion of macrophages,17 PCa,18 and NSCLC cells.19 The MIRO2-MYO9B interaction remains uncharacterized, so we sought to address if this complex could be an important signaling node in cancer. Like MIRO2, depletion of MYO9B using two independent siRNAs universally reduced invasion in BCa, PCa, and melanoma cells (Figures 4A–4C and S4A–S4C). Further, knockdown of MYO9B had little to no effect on short-term cell growth (Figures 4D and S4D). Thus, changes in invasion are due to factors outside of growth differences (Figures 4E and S4E).
Figure 4. MYO9B positively regulates BCa and PCa tumor cell invasion.

The indicated cell lines were transfected with control (C) or MYO9B-targeting siRNA (M9B-a and M9B-b, two independent sequences) and used for downstream assays at 72 h post-transfection.
(A) Western blot was carried out to confirm MIRO2 knockdown. Representative blots from n = 3 experiments are shown.
(B) Cells were seeded in transwell invasion assays and allowed to invade for 18–24 h. Representative images of invasive cells stained with DAPI are provided.
(C) Quantification of invasive cells/field relative to control. Data are represented as the mean ± SEM (n = 3), and means were compared by one way ANOVA and Dunnett’s post-test.
(D) Cell growth was determined by CyQUANT cell proliferation assay measured at the time of plating and at 24 h post-plating. Data were calculated as the differential growth relative to control. Data are represented as the mean ± SEM (n = 3), and means were compared by one-way ANOVA and Dunnett’s post-test.
(E) Comparison of the changes in invasion and growth in MYO9B-knockdown cells relative to control cells from (C) and (D), respectively. Data are represented the mean ± SEM (n = 3), and means were compared by two-tailed unpaired t test.
For (C)–(E), p values are represented as ns, not significant (p > 0.05), or *p < 0.05, **p < 0.01, ***p < 0.001, or ****p < 0.0001.
See also Figure S4.
While small GTPases have intrinsic activity that allows them to hydrolyze GTP to GDP, this is a kinetically slow reaction than can be accelerated by GTPase-activating proteins (GAPs).20 MYO9B is a single-headed atypical myosin with a GAP domain in the C-terminal region.21,22 It has been proposed that MYO9B enables cell motility by inactivating RhoA, a small GTPase that is well established as controlling cytoskeleton dynamics and cell motility.17,23 Interestingly, RhoA was also found in our MIRO2 interactome11; thus, we asked whether MIRO2 would form a complex with MYO9B and RhoA. We performed co-immunoprecipitation (coIP) of MIRO2-FLAG, EGFP-MYO9B, or EGFP-RhoA and found that the precipitated protein complexes contained all three proteins, suggesting that these proteins may exist together in a complex (Figures 5A–5C). These complexes were independent of the GAP activity of MYO9B, as a GAP-deficient mutant of MYO9B (GD; R1695M) co-precipitated with similar levels of MIRO2 or RhoA compared to wild type (WT; Figure 5B). On the other hand, co-precipitation of MIRO2 was increased when a dominant-negative RhoA mutant (T19N) was pulled down, compared to either a constitutively active RhoA mutant (Q63L) or the WT RhoA (Figure 5C).
Figure 5. MYO9B and RhoA are binding partners of MIRO2.

(A) Protein lysates from PC3 or MDA-MB-231 cells transiently overexpressing FLAG-entry vector (EV) or FLAG-MIRO2 were immunoprecipitated with anti-FLAG beads and analyzed by western blot for coIP with MYO9B and RhoA. Representative blots from n = 3 experiments are shown.
(B) Protein lysates from PC3 or MDA-MB-231 cells transiently overexpressing EGFP-empty vector (EV), EGFP-MYO9B-wild type (WT), or EGFP-MYO9B-R1695M (GAP deficient, GD) were immunoprecipitated with GFP-trap beads and analyzed by western blot for coIP with MIRO2 and RhoA. Representative blots from n = 3 experiments are shown.
(C) Protein lysates from PC3 or MDA-MB-231 cells transiently overexpressing EGFP-EV, EGFP-RhoA-wild type (RAWT), EGFP-RhoA-T19N (RA19N), or EGFP-RhoA-Q63L (RA63L) were immunoprecipitated with GFP-trap beads and analyzed by western blot for coIP with MIRO2 and MYO9B. Representative blots from n = 3 experiments are shown.
(D) MIRO2-myc truncation constructs.
(E and F) Protein lysates from PC3 cells co-expressing MIRO2-myc truncation constructs and either EGFP-MYO9B (E) or EGFP-RhoA (F) were immunoprecipitated with GFP-trap beads and analyzed by western blot for coIP with myc-tagged proteins. Representative blots from n = 3 experiments are shown.
(G) Quantification of relative immunoprecipitated binding of MYO9B or RhoA with the MIRO2 truncations from blots in (E) and (F). Data are represented as the mean ± SEM (n = 3), and means were compared by one-way ANOVA and Dunnett’s post-test.
(H) EGFP-MYO9B truncation constructs.
(I and J) Protein lysates from PC3 cells co-expressing EGFP-MYO9B truncation constructs and either MIRO2-FLAG (I) or RhoA-FLAG (J) were immunoprecipitated with anti-FLAG beads and analyzed by western blot for coIP with EGFP-tagged proteins. Representative blots from n = 3 experiments are shown. ns, non-specific bands appear at the indicated molecular weight.
(K) Quantification of relative immunoprecipitated binding of MIRO2 or RhoA with the MYO9B truncations from blots in (I) and (J). Data are represented as the mean ± SEM (n = 3), and means were compared by one-way ANOVA and Dunnett’s post-test.
For (G) and (K), p values are represented as *p < 0.05, **p < 0.01, ***p < 0.001, or ****p < 0.0001. All other comparisons were not significant (p > 0.05).
Next, we sought to characterize the relative contribution of individual functional domains/motifs to complex formation. We co-expressed MIRO2-myc truncations (Figure 5D) and EGFP-MYO9B (Figure 5E) or EGFP-RhoA (Figure 5F) in cells and purified protein complexes with GFP-trap beads. While deleting the transmembrane (TM) domain of MIRO2 did not change coIP with MYO9B or RhoA, truncation of the GTPase II domain of MIRO2 (ΔG-II) led to an increase in coIP with MYO9B and RhoA (Figure 5G). Furthermore, when examining coIP of MIRO2-myc truncations to EGFP-RhoA, we found that the GTPase I domain of MIRO2 (G-I) had increased binding to RhoA in comparison to WT (Figure 5G). To examine functional domains of MYO9B contributing to complex formation, we co-expressed EGFP-MYO9B truncations (Figure 5H) with MIRO2-FLAG (Figure 5I) or RhoA-FLAG (Figure 5J) and performed FLAG IP. Expression of the Δtail MYO9B increased, while expression of the MYO9B tail slightly decreased, binding to MIRO2. Furthermore, deletion of the IQ motifs (ΔIQ) or GAP domain (ΔGAP) in MYO9B led to an increase in binding to MIRO2 (Figure 5K). In contrast, we found that RhoA is bound similarly to all truncations of MYO9B tested (Figure 5K). In sum MYO9B and RhoA are MIRO2 binders, where the MIRO2-RhoA interaction is mediated by the GTPase I of MIRO2 and increased by the inactive conformation of RhoA. On the other hand, multiple functional domains appear to be involved in facilitating the MIRO2-MYO9B and MYO9B-RhoA interactions, which are independent of the GAP activity of MYO9B.
MIRO2 controls tumor cell invasion via MYO9B-dependent inactivation of RhoA
Based on the interaction of MIRO2 with MYO9B and RhoA, we postulated that MIRO2 may be mediating tumor cell invasion by MYO9B-dependent modulation of RhoA. To test if MIRO2 modulates Rho GTPase activity, we examined translocation of a Rho sensor that binds the active conformation of the GTPase (dTomato-2xrGBD) to the plasma membrane as a proxy for activity.24 Knockdown of MIRO2 led to an increase in active Rho at ruffles, phenocopying MYO9B knockdown (Figures 6A, 6B, and S5A–S5C). As a result of this finding, we wanted to determine if RhoA was required for the loss of invasive capacity in MIRO2-depleted cells. Double knockdown of MIRO2 and RhoA restored tumor cell invasion to basal levels, suggesting that MIRO2 and RhoA functionally cooperate to regulate tumor cell invasion (Figures 6C–6E). As ROCK1/2 are two of the main downstream effectors of RhoA signaling, we next asked if inhibition of ROCK could also rescue tumor cell invasion in MIRO2-depleted cells. Surprisingly, the ROCK inhibitor Y27632 had minimal effects on the invasive capacity in MIRO2-depleted cells (Figures S5D and S5E), suggesting that an alternate RhoA signaling pathway is being utilized in these cells.
Figure 6. MIRO2 and MYO9B control tumor cell invasion via inactivation of RhoA.
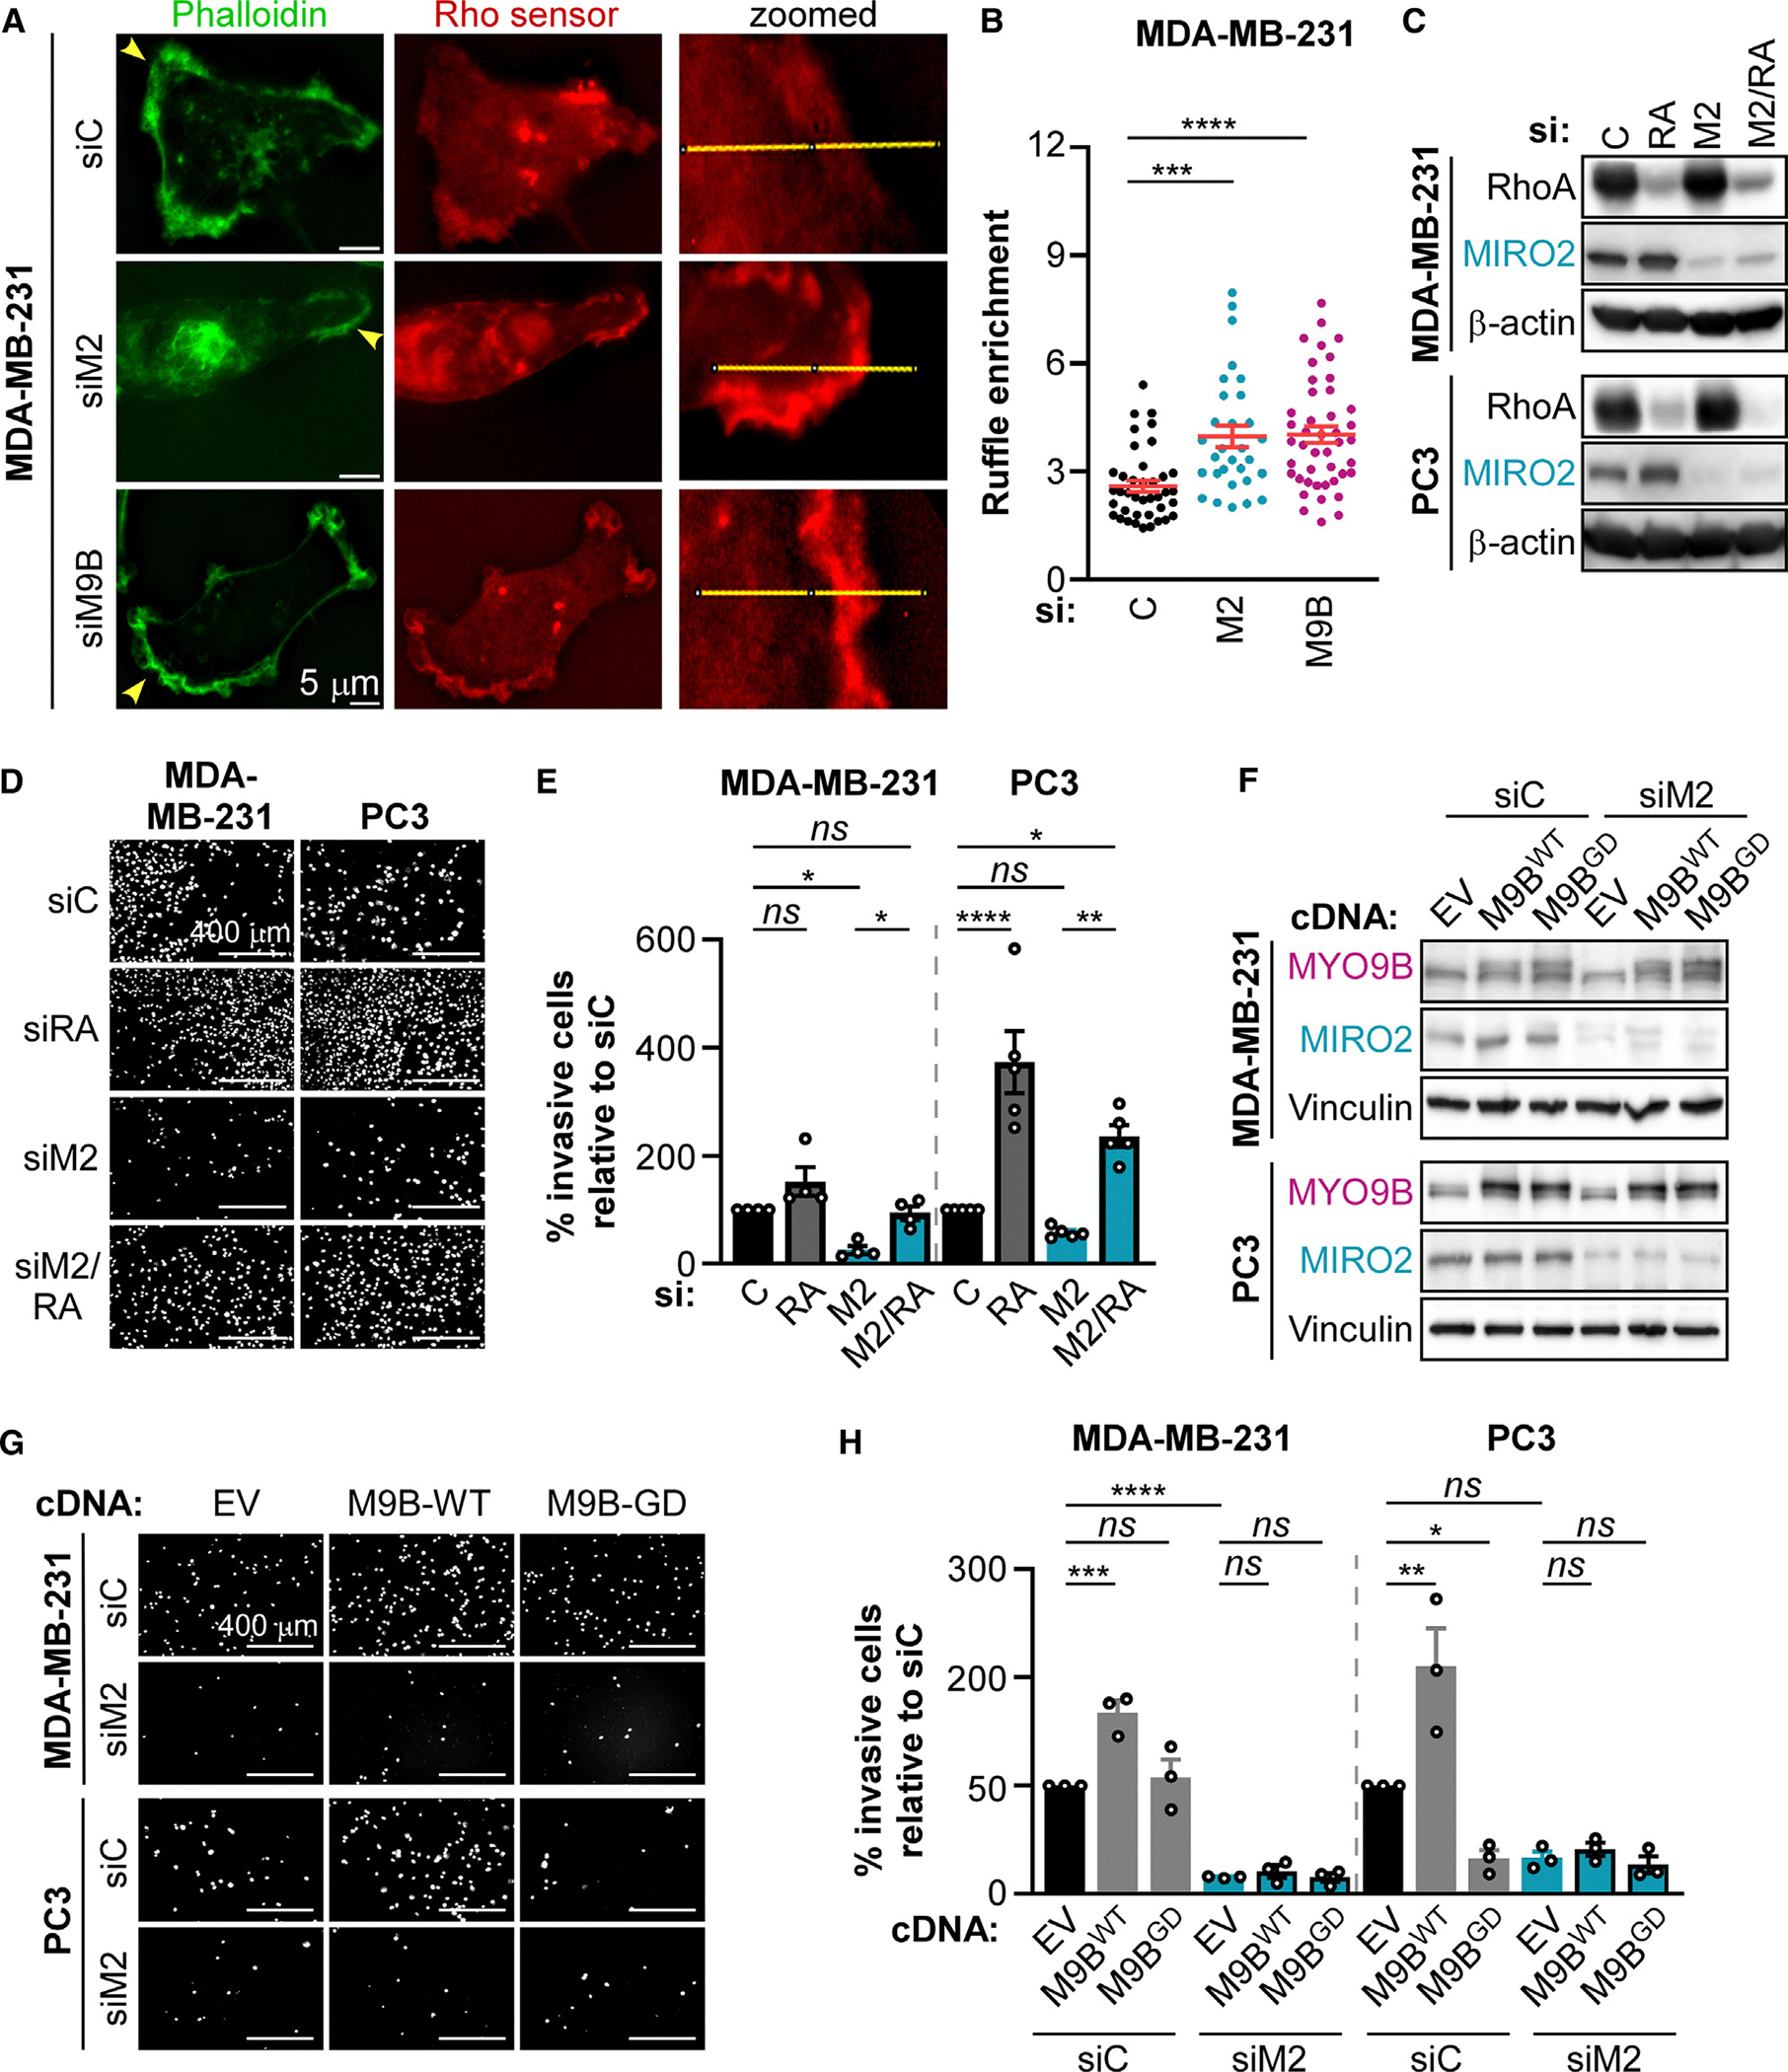
(A) MDA-MB-231 cells were transfected with control, MYO9B (M9B), or MIRO2 (M2) pooled siRNA in combination with a Rho sensor (dTomato-2xrGBD), plated into collagen-coated slides, and analyzed via fluorescence microscopy. Arrows point to ruffles selected for analysis and zoomed panels include region of line scans.
(B) Quantification of Rho sensor signal enrichment at the ruffles. Data are represented as the mean ± SEM, and means were compared by one-way ANOVA and Dunnett’s post-test.
(C–E) The indicated cell lines were transfected with control, MIRO2 (M2), RhoA (RA), or a combination of both MIRO2 and RhoA (M2/RA) pooled siRNA and used for downstream assays at 72 h post-transfection. (C) Representative blots showing the efficiency of knockdown. (D) Cells were seeded in transwell invasion chambers and allowed to invade for 18–24 h. Representative images of invasive cells stained with DAPI are shown. (E) Quantification of invasive cells/field, relative to control. Data are represented as the mean ± SEM (n = 4 for MDA-MB-231 and n = 5 for PC3), and means were compared by one-way ANOVA and Dunnett’s post-test.
(F–H) The indicated cell lines were transfected with either control or MIRO2 (M2) pooled siRNA for 24 h, followed by cDNA transfection of either EGFP-empty (EV), EGFP-MYO9B-wildtype (WT), or EGFP-MYO9B-R1695M (GAP deficient, GD) for 48 h. (F) Representative western blots at time of plating. (G) Cells were seeded in transwell invasion chambers and allowed to invade for 18–24 h. Representative images of invasive cells stained with DAPI are shown. (H) Quantification of invasive cells/field, relative to control. Data are represented as the mean ± SEM (n = 3), and means were compared by one-way ANOVA and Dunnett’s post-test.
For (B), (E), and (H), p values are represented as ns, not significant (p > 0.05), or *p < 0.05, **p < 0.01, ***p < 0.001, or ****p < 0.0001.
See also Figures S5 and S6.
To test whether MYO9B’s GAP function was required for tumor cell invasion, we expressed WT or GD MYO9B in cells transfected with control or MIRO2-targeting siRNA. Overexpression of WT MYO9B, but not GD MYO9B, resulted in an increase in tumor cell invasive capacity compared to empty vector (EV) control cells (Figures 6F–6H). Depletion of MIRO2 abolished tumor cell invasion and prevented the MYO9B-dependent increase in tumor cell invasion. As noted earlier, overexpression of GD MYO9B did not change the binding to either MIRO2 or RhoA, suggesting that the differential effects on invasion between WT and GD MYO9B stem from the loss of MYO9B’s GAP activity and not from the loss of binding to MIRO2 or RhoA. Taken together, this suggests that overexpression of MYO9B drives increased tumor cell invasion in a manner that is reliant on its GAP activity and MIRO2 expression. As a complementary way to demonstrate that MIRO2 and MYO9B may be working together to drive tumor cell invasion, we determined changes in invasive capacity induced by either single or double knockdown of MIRO2 and MYO9B. Dual depletion of MYO9B and MIRO2 showed no additive or synergistic effects on reducing invasion (Figures S6A–S6C), suggesting that these two proteins collaborate to facilitate efficient tumor cell invasion.
In addition to the GAP function, it has been proposed that MYO9B localizes to the leading edge of moving cells to support efficient cell movement.23 Thus, we asked if there were any spatial changes in MYO9B localization upon MIRO2 depletion. Subcellular distribution of EGFP-MYOB was identical in control and MIRO2-depleted cells (Figure S6D). Similarly, the distribution of endogenous MIRO2 was identical in control and MYO9B-depleted cells (Figure S6E). Furthermore, total protein levels of MYO9B remained unchanged in MIRO2-depleted cells, and total levels of MIRO2 did not change upon MYO9B knockdown (Figures S6F and S6G). Thus, expression and localization of MYO9B are independent of MIRO2 and vice versa. In sum, MIRO2 and GAP-proficient MYO9B maintain low levels of active RhoA at cell protrusions and cooperate to support tumor cell invasion.
MIRO2 expression correlates with Rho GTPase signaling in patient cohorts
Finally, to gain insight into whether this signaling node could be relevant in patients, we analyzed RNA sequencing (RNA-seq) datasets from large patient cohorts (Prostate TCGA, Breast TCGA, and Breast METABRIC). Tumors with MIRO2 high (Q4) versus MIRO2 low (Q1) expression were subjected to differential gene expression using KEGG, Reactome, and CORUM pathway databases. Among the top 20 differentially expressed pathways in MIRO2 Q4 versus Q1 tumors, we found pathways involved in tumor cell motility and invasion, including focal adhesion, extracellular matrix organization, Hippo and integrin signaling, and Rho family GTPase pathways (Figures 7A, 7B, and S7A). Several of our differentially regulated pathways include Rho family GTPase signaling; however, these include Rho family members that promote tumor cell motility (Cdc42 and Rac) and others that may have a context-dependent effect on tumor cell motility (RhoA, B, and C). Thus, we next sought to focus our analysis on RhoA-dependent gene expression enrichment in the patient cohorts. To do this, we generated a gene set named “RhoA specific genes” using microarray data from primary keratinocytes isolated from WT (RhoAWT) or RhoA−/− mice.25 We categorized genes as RhoA specific if their mRNA decreased at least 1.5-fold in RhoA−/− compared to RhoAWT, with a p < 0.05 (Figure S7B). Using this gene set, we then performed gene set enrichment analysis (GSEA) comparing MIRO2 Q4 versus Q1 tumors on the Prostate TCGA, Breast TCGA, and METABRIC datasets. In all three patient cohorts, RhoA-specific genes were downregulated in MIRO2 Q4 compared to MIRO2 Q1 samples (Figures 7C, 7D, and S7C), highlighting an inverse correlation between MIRO2 and RhoA-dependent gene expression. Overall, higher expression of MIRO2 is associated with modulation of pathways associated with tumor cell motility and invasion and decreased expression of RhoA-specific genes in patients.
Figure 7. MIRO2 suppresses RhoA-dependent gene expression in patient cohorts.

(A and B) The top 1,000 genes differentially expressed in MIRO2 high (Q4) versus MIRO2 low (Q1) samples from the Prostate TCGA (A) and Breast TCGA (B) datasets were subjected to pathway analysis. The top 20 pathways are shown with Rho family GTPase-related pathways highlighted.
(C and D) Gene set enrichment analysis of RhoA-specific genes in MIRO2 high (Q4) and low (Q1) samples from the Prostate TCGA (C) and Breast TCGA (D) databases. NES, normalized enrichment score; FDR, false discovery rate.
See also Figure S7.
DISCUSSION
In this study, we found that MIRO2 is necessary for tumor cell invasion in BCa, PCa, melanoma, and pancreatic cancer cell lines, demonstrating a broad importance for this protein in tumor cell invasion. Previous works proposed a controversial role for MIRO2 in tumor cell invasion and migration. While some showed that MIRO2 was necessary for oncogenic or therapy resistance stress-induced tumor cell invasion in PCa cells,12,13 others found MIRO2 to be inhibitory in colorectal cancer cell migration.14 As these studies have been limited to in vitro systems and a single cell line to derive conclusions, we provide a comprehensive examination of the functional importance of MIRO2 in metastatic dissemination. Furthermore, in the PCa late-stage metastasis model, MIRO2 depletion shows an almost complete elimination of metastatic foci. Of note, we reported that PCa xenograft growth was severely impaired by MIRO2 knockdown11; thus, reduction of the metastatic burden of PC3 cells may be compounded by defects in the outgrowth of disseminated cells by MIRO2 knockdown. Using 4T1 syngeneic orthotopic mouse models, we were able to separate the confounding factor of growth on metastasis. In this model, MIRO2 depletion does not cause any growth defects of primary breast tumors; however, MIRO2 depletion inhibits metastatic burden and colonization of lungs. In this context, more work will need to be done to understand the disparate effects of MIRO2 knockdown in primary tumor growth in our PC3 versus 4T1 model. These differences may be explained by tissue-specific factors or species-specific roles of MIRO2.
Using BCa and PCa patient cohorts, we have interrogated the expression of MIRO2 at the protein level across multiple steps in tumor progression. MIRO2 expression is almost exclusively restricted to the epithelial compartment of tumors of the prostate and breast, with the stroma being largely negative. This is in concordance with the reported upregulation of MIRO2 mRNA in cancer versus normal tissues,13 and it suggests that enhanced MIRO2 expression in tumors may be largely driven by increased expression of MIRO2 in the epithelial cancer cells. Of note, MIRO2 retains relatively similar protein expression in the epithelial compartment of PCa primary tumors and in visceral and bone metastases. However, we note that approximately a third of metastatic tumors do not express MIRO2. In contrast to our previous studies, which showed that MIRO2 mRNA expression is increased in patients with recurred/progressed PCa,11 our studies found that MIRO2 protein expression did not have any correlation with this clinical attribute in that context. This may be due to mRNA and protein expression often having poor correlations in cancer-related public datasets.26 Our results highlight disparate regulation of MIRO2 expression in the tumor progression cohorts, with PCa primary and metastatic tumors showing similar levels of stain, BCa trending to lower MIRO2 expression in lymphatic or metastatic tissues, and the NSCLC tumors showing increased MIRO2 expression in brain metastases versus primary tumors. We postulate that these differences may reflect the influence of disparate genetic, epigenetic, and metabolic drivers associated with these tumors, as well as the tumor microenvironment. The brain-specific tumor microenvironment may drive increased MIRO2 expression of cancer cells disseminated to the brain; alternatively, high expression of MIRO2 in NSCLC cells may be selected throughout the metastatic cascade to brain. Future studies will need to be performed to distinguish between these two possibilities. All together, these insights suggest MIRO2 may constitute an attractive target that may selectively affect cancer epithelial cells in MIRO2+ primary and metastatic tumors, which are found in the majority of patients in the PCa, BCa, and NSCLC cohorts. Furthermore, targeting MIRO2 may have minimal side effects on normal tissues, as MIRO2 is not expressed in the vast majority of stromal cells, and previous studies have found germline-knockout MIRO2 mice to be viable and fertile.27
The role of the MIRO family of GTPases in cellular signaling remains largely unexplored, specifically in the context of cancer, where both MIRO1 and MIRO2 are emerging as important regulators of tumor biology.11,15,28 To fill this gap, here, we characterize a MIRO2-dependent signaling mechanism promoting cellular invasion that involves MYO9B. In agreement with prior reports,18,19,29,30 we find that depletion of MYO9B has a broad impact on reducing tumor cell invasion across disparate tumor types, including PCa, BCa, and skin cancer.
MYO9B has been extensively studied in the context of macrophages, where it exerts control on cell motility via its motor domain, which permits subcellular localization to lamellipodia, and its GAP domain, which inactivates RhoA.23 In terms of localization, MYO9B is distributed to the leading edge of fibroblasts, with some cytosolic localization.31 In contrast, we found that MYO9B primarily localized to the cytosol, with perinuclear accumulation and lesser signal localized to the cortical regions in PC3 cells. This agrees with another study that found similar subcellular localization of MYO9B in PCa cells.18 At present, the limited number of cell lines and primary cells used precludes generalizations on potential differences in MYO9B’s localization or function in primary non-transformed versus cancer cells. In this study, we found that knockdown of MIRO2 did not change MYO9B localization but altered the amount of active RhoA at cell protrusions, providing evidence that MIRO2 controls Rho GTPase signaling. At the mechanistic level, we found that MIRO2, MYO9B, and RhoA form protein complexes and that MYO9B required both a functional GAP domain and MIRO2 expression to drive increases in cell invasion. Initial characterization of the MIRO2/MYO9B/RhoA complex indicated that RhoA binds to the GTPase I domain of MIRO2, while the GTPase II domain of MIRO2 negatively regulates the interaction with both MYO9B and RhoA. MYO9B truncations containing the head region led to higher binding to MIRO2, and the MYO9B tail slightly decreased binding to MIRO2, suggesting that MIRO2 preferentially binds the head region of MYO9B. On the other hand, most of the MYO9B truncations tested bind similarly to RhoA. While it has been reported that RhoA binds to a truncated MYO9B construct that contains only the GAP domain,19 the binding of RhoA to full-length MYO9B was not evaluated. In our studies, deletion of the GAP domain of MYO9B is not sufficient to prevent the interaction with RhoA, which suggests that additional binding interfaces exist. While this serves as an initial characterization of protein regions participating in complex formation, further studies using higher-resolution structural techniques will need to be utilized to define the binding interfaces. Finally, while the requirement of a functional GAP domain on MYO9B to promote cell motility has been well established in other cell types,23 the requirement for MIRO2 described here adds an additional level of regulatory control over MYO9B signaling.
Our studies also revealed that RhoA is critical for inhibition of cell invasion downstream of MIRO2 depletion, as double knockdown of RhoA and MIRO2 fully rescued the invasive capacity of cancer cells. Along these lines, we showed that high MIRO2 mRNA expression is associated with differential regulation of Rho family GTPase pathways in PCa and BCa patient cohorts. Further, we found that RhoA-specific genes were downregulated in MIRO2 high tumors, supporting the relevance of MIRO2 suppressing RhoA signaling in a clinical context. An open question that stems from our studies is whether MIRO2 globally inhibits RhoA signaling or instead turns off specific RhoA effectors. Of note, inhibition of RhoA’s effector ROCK was ineffective at rescuing tumor cell invasion in MIRO2-depleted cells, suggesting other RhoA effectors are involved in MIRO2-dependent cell invasion.
In our studies, RhoA exerts an anti-invasive role in PCa and BCa cells. The role of RhoA in cancer remains contended, with some studies supporting a role for RhoA in metastasis,32–35 while others suggest an anti-invasive role of RhoA in tumors.36–39 This discrepancy may be explained by the complexity of the metastatic cascade. Adding to this complexity, negative feedback loops exist between RhoA and other pro-migratory Rho GTPase family members that can promote cell motility.40 For instance, RhoA suppresses skin tumorigenesis and tumor cell invasion via downregulation of RhoB expression and activity.39 One possibility is that differential expression of RhoB may explain the field’s confounding results in RhoA function. Whether these compensatory mechanisms are at play downstream of MIRO2 remains to be tested.
In summary, we describe a function of MIRO2 in cooperation with MYO9B to suppress RhoA activity, which results in MIRO2 promotion of tumor cell invasion and metastasis across multiple tumor types in vitro and in vivo. We find that MIRO2 is expressed throughout tumor progression in patient samples and that MIRO2 higher expression correlates with dampened expression of RhoA-specific genes in patient cohorts. Given that MIRO2 depletion nearly blocks metastatic burden in mouse models and is specifically expressed in tumor epithelial cells in patients, we speculate that MIRO2 may be a good therapeutic target for patients with advanced disease.
Limitations of the study
Our study focused on the role of MIRO2 and MYO9B in tumor cell invasion without examining other steps of the metastatic cascade, including survival of circulating tumor cells, extravasation, or survival at the secondary site. MYO9B is a RhoA-specific GAP; thus, we examined MYO9B-dependent signaling events controlling invasion via RhoA. However, MIRO2-associated gene expression in patient cohorts includes Rac and Cdc42 pathways. Future studies should examine if there is a functional relationship between MIRO2 and Rac or Cdc42 GTPases in cancer. While our data suggest that MIRO2 is required for MYO9B inactivation of RhoA, we did not perform in vitro GAP assays. Thus, follow-up studies will need to examine if MIRO2 acts as a scaffold for the MYO9B/RhoA complex and/or is required for MYO9B’s GAP activity. Finally, RhoA depletion rescues tumor cell invasion defects in MIRO2-depleted cells in vitro; whether this holds true in in vivo contexts remains to be tested.
RESOURCE AVAILABILITY
Lead contact
Requests for further information and resources and reagents should be directed to and will be fulfilled by the lead contact, M. Cecilia Caino (Cecilia.caino@cuanschutz.edu).
Materials availability
This study did not generate new unique reagents. Stable cell lines generated in this study are available from the lead contact with a completed materials transfer agreement.
Data and code availability
This study did not generate new omics datasets or unique codes. The data analyzed in this study were obtained and are publicly available from cBioPortal (METABRIC, BCa TCGA, PCa TCGA), Gene Expression Omnibus (GEO) at GEO: GSE64714, and ProteomeXchange Consortium via the PRIDE partner repository, ProteomeXchange: PXD029490. All other datatypes will be shared by the lead contact upon request after publication.
STAR★METHODS
Detailed methods are provided in the online version of this paper and include the following:
EXPERIMENTAL MODEL AND STUDY PARTICIPANT DETAILS
Cell lines
Human cells lines representing BCa (BT20, ATCC, catalog# HTB-19; BT549, ATCC, catalog# HTB-122; MDA-MB-231, ATCC, catalog# HTB-26; and MDA-MB-468, ATCC, catalog# HTB-132), PCa (C4–2, ATCC, catalog# CRL-3314; DU145, ATCC, catalog# HTB-81; and PC3, ATCC, catalog# CRL-1435), melanoma (RPMI-7951, ATCC, catalog# HTB-66; and SK-MEL-28, ATCC, catalog# HTB-72), and pancreatic cancer (MIA PaCa-2, ATCC, catalog# CRL-1420; and PANC-1, ATCC, catalog# CRL-1469) were obtained from the American Type Culture Collection (ATCC) or The University of Colorado Cancer Center Cell Culture Core (Aurora, CO).
Mice
Adult NOD.Cg-Prkdcscid Il2rgtm1Wjl/SzJ (8 week old, strain# 005557) male mice and BALB/c (8 week old, strain# 000651) female mice were acquired through The Jackson Laboratory. Mice were housed at a maximum of 3 animals per cage (males) or 5 animals per cage (females) in temperature-controlled rooms under a 12-hour light/dark cycle and provided water and chow ad libitum. All mouse procedures were performed with approval from the Institutional Animal Use and Care committee of the University of Colorado (protocol # 00581).
METHOD DETAILS
Cell culture
All cell lines were grown at 37°C in 5% CO2 and were cultured as follows. PC3, DU145, C4–2, MDA-MB-468 and MDA-MB-231 were grown in RPMI 1640 medium supplemented with L-glutamine and 10% FBS. BT-549 were grown in RPMI 1640 medium supplemented with L-glutamine, 7.5 μg/mL Insulin and 10% FBS. RPMI-7951 and SK-MEL-28 were grown in DMEM high glucose medium supplemented with L-glutamine, sodium pyruvate and 10%FBS. BT20, MIA PaCa-2 and PANC-1 were grown in MEM with Earle’s salts medium supplemented with L-glutamine and 10% FBS. Benchmark FBS was purchased from GeminiBio (catalog# 100–106). Master stocks of cell lines were authenticated using short tandem repeat (STR) analysis (The University of Colorado Cancer Center Cell Culture Core, Aurora, CO) and tested for Mycoplasma with the ATCC Universal Mycoplasma Detection Kit (ATCC, catalog # 301012K). Cells were cultured for a maximum of 12 weeks and Mycoplasma testing was repeated upon freezing stable short hairpin RNA (shRNA) cell lines or Red-shifted luciferase encoding cell lines.
Gene silencing and stable cell line generation
For transient knockdown experiments, siRNA nucleotides were reverse transfected at 15 nM concentration with 7.5 μl of Lipofectamine RNAiMAX (ThermoFisher, catalog# 13778075). The following Ambion Select Silencer RNAi (ThermoFisher) were used: negative control no.1, (catalog# 4390844), siMIRO2 a (catalog# 4392420; siRNA ID: s40209), siMIRO2 b (catalog# 4392420; siRNA ID: s40210), siMYO9B-a (catalog# 4392420; siRNA ID: s715), siMYO9B-b (catalog# 4392420; siRNA ID: s716), siRhoA (catalog# 4390824; siRNA ID: s758 and s759). Where “pooled siRNA” was transfected, two siRNA per target were pooled at equimolar ratio prior to transfection: s40209/s40210 (MIRO2), s715/s716 (MYO9B), or s758/s759 (RhoA). After 72 hours, cells were validated for target protein knockdown by Western blotting and processed for subsequent experiments. For stable knockdown experiments, 2–4 independent shRNA (acquired from the University of Colorado Cancer Center Functional Genomics Core) were used. For human PC3 and DU145 cells: MIRO2 sh a (TRCN0000072918), MIRO2 sh b (TRCN0000072919), MIRO2 sh c (TRCN0000072922), MIRO2 sh d (TRCN0000072921) were used. For mouse 4T1 cells: MIRO2 sh a (TRCN0000077642) and MIRO2 sh b (TRCN0000328896) were used. A non-mammalian targeting shRNA (SHC002) was used as a control. PC3, DU145, or 4T1 cells stably expressing shRNA were generated by infection with lentiviral particles, followed by at least 2 weeks of selection in the presence of puromycin at 2 μg/mL (PC3 and DU145) or 2.5 μg/mL (4T1). For in vivo experiments, luciferase expressing cells were used. These cells were generated by infection with Red-shifted Firefly Luciferase lentiviral particles (AMSBIO, catalog# LVP-1232) at 100 particles/cell, followed by at least 2 weeks of selection in the presence of Blasticidin S at 2.5 μg/mL (4T1) or 10 μg/mL (PC3).
Antibodies
Antibodies for MIRO2 (Cell Signaling Technology, catalog# 14016, diluted 1:1000; Proteintech, catalog# 11237–1-AP, diluted 1:5000; or ThermoFisher, catalog# PA5–52960, diluted 1:2000), MYO9B (Proteintech, catalog # 12432–1-AP, diluted 1:4000), RhoA (clone 67B9, Cell Signaling Technology, catalog# 2117, diluted 1:1000), Vinculin (clone E1E9V, Cell Signaling Technology, catalog# 13901, diluted 1:100,000), β-actin (clone AC-15, Sigma-Aldrich, catalog# A5441, diluted 1:400,000), GFP (clone 4B10, Cell Signaling Technology, catalog# 2955, diluted 1:1000), and Myc-Tag (clone 9B11, Cell Signaling Technology, catalog# 2276, diluted 1:10,000) were used for western blotting.
Western blotting
Protein lysates were prepared in 25 mM Tris HCl (pH 7.5), 100 mM NaCl, 5 mM EDTA, 10% glycerol, 1% Triton X-100 containing EDTA-free Protease inhibitor cocktail (ThermoFisher, catalog# 78438). Lysates were sonicated and precleared by centrifugation at 17,000 × g for 10 minutes at 4°C. Protein concentrations were determined via Pierce 660nm Protein Assay (ThermoFisher, catalog# 22660). Equal amounts of protein lysates were separated by SDS gel electrophoresis, transferred to polyvinylidene difluoride membranes, blocked in 5% non-fat milk (Cell Signaling Technology, catalog# 9999) diluted in TBST buffer (20 mM Tris HCl, pH 7.5, 150 mM NaCl, 0.1% Tween-20), and further incubated with primary antibodies diluted in 5% BSA/TBST overnight at 4°C. After washing in TBST, membranes were incubated with HRP-conjugated secondary antibodies (anti-mouse IgG, Cell Signaling Technology, catalog# 7076; or anti-rabbit IgG, Cell Signaling Technology, catalog# 7074, diluted 1:1000 in 5% Milk/TBST) for 1 hour at room temperature. Membranes were washed with TBST and proteins were visualized via chemiluminescence in a KwikQuant Imager system (Kindle Biosciences LLC) using Ultra Digital-ECL Substrate Solutions (Kindle Biosciences, catalog# R1002). Intensity of bands was quantitated with the FIJI Image J software, background subtracted and normalized as indicated in the Figure legends.
Invasion assay
Invasion experiments were performed by plating 5×10⁴–1.5×10⁵ cells in duplicate onto growth factor reduced Matrigel coated invasion transwell chambers (Corning, catalog# 08–774-193). Cells were plated in media containing 0.1% BSA on the top compartment and media containing 10% FBS was placed in the lower chamber as a chemoattractant. Cells were allowed to invade for 16–24 hours, at which time cells on the top side of the chambers were scraped off and inserts with the invaded cells were fixed in methanol. Inserts were next washed in diH2O, allowed to air dry and mounted in media containing DAPI (Vector Laboratories, catalog# H-1200–10). Five random fields were imaged per membrane at 10X magnification on EVOS XL Core Imaging System and DAPI FL LED cube (Ex=357/44 nm). Images were imported as a stack into Fiji ImageJ, thresholded, and analyzed with the Analyze Particles function.
Cell growth and viability assays
For suspension viability assays, cells (5×10³ cells/well) were plated in 3–6 replicates in 96-well plates (regular tissue culture treatment: Greiner bio-one, catalog# 655090; ultra-low attachment, Corning, catalog# 4591). Cells were incubated for 72 hours at 37°C in a 5% CO2 incubator and metabolic viability was determined using the RealTime-Glo™ MT Assay (Promega, Madison, WI), using a FilterMax F5 Multi-Mode Microplate reader (Molecular Devices, San Jose, CA). For cell growth assays, 1×10⁴ cells/well were plated in 4 replicates in 96-well plates and cell quantity was determined at time of initial plating (t=0h) and 24 hours later (t=24h) using the CyQUANT NF Cell Proliferation Assay (ThermoFisher, catalog# C35007), in a FilterMax F5 Multi-Mode Microplate reader (Molecular Devices, San Jose, CA). Relative changes in growth were determined by normalizing the final values by the initial values. For C4–2 cells, we observed high intrinsic variability of this cell line due to tendency to form clumps that resulted in uneven seeding; thus outliers wells were determined by Grubbs’ test at the time of seeding and excluded from the graph and statistical analysis.
Plasmids, mutagenesis and transfections
pCMV6-MIRO2-myc-FLAG was from Origene Technologies (catalog# RC204823). GFP-MYO9B (Addgene, plasmid# 134907) and GFP-MYO9B-R1695M (Addgene, plasmid# 134911) were a gift from Martin Bähler41. pcDNA3-EGFP-RhoA-WT (Addgene, plasmid# 12965), pCDNA3-EGFP-RhoA-T19N (Addgene, plasmid# 12967), and pcDNA3-EGFP-RhoA-Q63L (Addgene, plasmid# 12968) were a gift from Gary Bokoch42. dTomato-2xrGBD (Addgene plasmid# 129625) was a gift from Dorus Gadella24. Empty vectors were matched to the backbone of the constructs, either pCMV6-entry (Origene Technologies) or pEGFP (Clontech). Site directed mutagenesis of pCMV6-MIRO2-myc-FLAG (ΔTM, G-I, ΔG-I, Mid, G-II, ΔG-II), or EGFP-MYO9B (tail, Δtail, ΔIQ, ΔGAP) were carried out using QuikChange II XL site-directed mutagenesis kits (Agilent, catalog# 200522). MIRO2-Mid construct required a two-step mutagenesis protocol using primers for MIRO2ΔG-I followed by primers for MIRO2ΔG-II. See Table S2 for full list of mutagenesis primer sequences. For transient transfection of pDNA in PC3 and MDA-MB-231 cells, cells were plated at 2.5 × 10⁵ cells/well in 6-well plates and 24 h later transfected with 2 μg plasmid and 4 μL of XtremeGENE HP DNA transfection reagent (Sigma Aldrich, catalog# 06366236001). For transient transfection of pDNA in DU145 cells, 2.5 × 10⁵ cells/well in 6-well plates were transfected with 2.5 μg plasmid, 5 μL P3000 reagent and 7.5 μL of Lipofectamine 3000 transfection reagent (ThermoFisher, catalog# L3000008). Cells were incubated for 24–48 hours before using for downstream experiments.
FLAG immunoprecipitation
Cells were plated in 15-cm culture dishes at 4 × 10⁶ cells/plate in growth media without antibiotics and allowed to adhere overnight at 37°C in a 5% CO2 incubator. Transfection complexes containing 18 μg of pDNA (FLAG-MIRO2 or FLAG-empty vector), 36 μL of XtremeGENE HP DNA transfection reagent (Sigma Aldrich, catalog# 6366546001) and 3.6 mL Opti-MEM were incubated for 30 min at room temperature and added to cells. Cells were returned to the incubator for 48 hours. Protein lysates were prepared in IP buffer containing 25 mM Tris-HCl (pH 7.5), 100 mM NaCl, 5 mM EDTA, 10% glycerol, 1% Triton X-100 containing EDTA-free Protease inhibitor cocktail, by rotating for 1 hour at 4°C. Lysates were precleared by centrifugation at 17,000 × g for 10 minutes at 4°C and protein concentrations were determined via Pierce 660nm Protein Assay. Anti-FLAG M2 beads (Sigma-Aldrich, catalog# A2220, 30μL per sample) were equilibrated in IP buffer and added to 1700–2800 μg of protein lysates. Protein-bead mixtures were rotated for 2h at 4°C. Beads were washed 3 times in IP buffer and protein was eluted in 150 ng/μL 3X FLAG-peptide (Sigma-Aldrich, catalog# F4799)/TBS. Beads were eluted in 3X FLAG peptide/TBS for 30 minutes on ice, vortexing for 1–2 seconds every 5 minutes. Eluted proteins were denatured with 1/3 volume of 4X Laemmli buffer (200 mM Tris-ClH pH 6.8, 40% (v/v) glycerol, 8% SDS, 0.02% bromophenol blue, 8% β-mercaptoethanol). Samples were then analyzed via Western blotting as described above.
GFP immunoprecipitation
Cells were plated in 15-cm culture dishes at 4 × 10⁶ cells/plate in growth media without antibiotics and allowed to adhere overnight at 37°C in a 5% CO2 incubator. Transfection complexes containing 18 μg of pDNA (pEGFP-empty, EGFP-MYO9B-WT, EGFP-MYO9B-R1695M, EGFP-RhoA-WT, EGFP-RhoA-T19N, or EGFP-RhoA-Q63L), 36 μL of XtremeGENE HP DNA transfection reagent (Sigma Aldrich, catalog# 6366546001) and 3.6 mL Opti-MEM were incubated for 30 min at room temperature and added to cells. Cells were transfected for 24 hours (for RhoA) or 48 hours (for MYO9B) prior to harvesting. Protein lysates were prepared in IP buffer containing 25 mM Tris-HCl (pH 7.5), 100 mM NaCl, 5 mM EDTA, 10% glycerol, 1% Triton X-100 containing EDTA-free Protease inhibitor cocktail, by rotating for 1 hour at 4°C. Lysates were precleared by centrifugation at 17,000 × g for 10 minutes at 4°C and protein concentrations were determined via Pierce 660nm Protein Assay. GFP-Trap Agarose beads (Proteintech, catalog# gta, 25 μL per sample) were equilibrated in IP buffer and added to 1500–2700 μg of protein lysates. Protein-bead mixtures were rotated for 2h at 4°C. Beads were washed 4 times in IP buffer and protein was eluted in 1X Laemmli buffer (50 mM Tris-HCl pH 6.8, 10% glycerol, 2% SDS, 0.005% bromophenol blue, 2% β-mercaptoethanol). Samples were then analyzed via Western blotting as described above.
Rho sensor assay
Cells were reverse transfected with siRNA for 48 hours and then transfected for 24 hours with dTomato-2xrGBD before plating on collagen coated coverslips. Coverslips were prepared by adding collagen isolated from rat tails (diluted in PBS with 0.1% acetic acid) to glass coverslips in 6-well plates for 1 minute. Collagen was then removed, and plates were allowed to sit exposed to UV light for a minimum of 30 minutes to ensure collagen crosslinking to the coverslip. Cells were seeded on top of coverslips to achieve 50% confluency and were allowed to adhere overnight. Cells were fixed with 4% paraformaldehyde for 15 minutes before removing and adding quenching buffer (0.1 M glycine/PBS) for 5 minutes. Quenching buffer was removed and incubation buffer (2% FBS/0.0002% BSA/0.4% saponin/PBS) was added to cells for 30 mins. Incubation buffer was removed and Phalloidin Alexa488 (diluted 1:500 in incubation buffer) was added to the cells for 30 minutes in a dark humidified chamber. Cells were then incubated in Hoescht 33342 stain (diluted 1:5000 in PBS; Anaspec Catalog#AS-83218) for 5 minutes and washed twice with PBS before coverslips were mounted on slides with Vectashield antifade mounting media and sealed with nail polish. Images were acquired on an inverted Zeiss Axiovert 200M microscope using a 63× oil objective, QE charge-coupled device camera (Sensicam), and Slidebook v. 6.0 software (Intelligent Imaging Innovations). Cells highly expressing the dTomato-2xrGBD fluorescent sensor that exhibited minimal plasmid protein aggregates were imaged. Exposure time was adjusted for the Texas Red channel as automatically determined by Slidebook software to account for changes in intensity from transient transfection. A z-stack was taken with 0.5 μm intervals. To minimize background noise, images were treated with a nearest neighbor deconvolution filter (Slidebook). Images were transferred to ImageJ and a max projection was taken of the 2–3 stacks where actin ruffles were in focus. A line was drawn through the area of actin ruffles, and the plot profile function was used to take a line scan of the intensity of the dTomato-2xrGBD signal across that line. The signal peak was defined as the highest grey value observed in the line scan that corresponded with actin ruffles, and a signal valley was defined as the lowest grey value observed after a peak when the signal stabilized before increasing again due to diffuse cytoplasmic signal. RhoA enrichment in ruffles was then defined as the ratio of the peak over the valley. Single cells from 2 independent experiments were combined, outliers were determined by Grubbs’ test and excluded from the graph and statistical analysis.
Immunofluorescence
Cells were subjected to transient siRNA knockdown and/or transient plasmid overexpression, and grown on Laminin (15μg/mL, ThermoFisher, catalog# 23017015) coated glass coverslips. All steps from here were performed at room temperature. Cells were fixed in formalin/PBS (4% final concentration) for 15 minutes, permeabilized with 0.1% Triton X-100/PBS for 5 minutes and blocked in 5% goat serum (Gibco, catalog# 16–210-064) diluted in 0.3 M glycine/PBS for 1 hour. For experiments observing MIRO2 localization: cells were incubated with MIRO2 antibody (diluted 1:500 in blocking buffer, Proteintech) overnight at 4°C. Cells were then incubated with anti-rabbit Alexa-594 (diluted 1:500 in blocking buffer, ThermoFisher, catalog# A32740) for 45 minutes at room temperature. For experiments observing EGFP-MYO9B localization: after blocking, cells were incubated with GFP-Booster ATTO488 (diluted 1:200 in blocking buffer, Chromotek, catalog# gba488) for 1 hour. Finally, all slides were mounted in 4,6-diamidino-2-phenyl-indole (DAPI)-containing Prolong Gold mounting medium (ThermoFisher, catalog# P36931). Images were acquired using Zeiss LSM780 confocal microscope with a 63X oil objective and a pinhole of 1 AU.
Animal studies
The size of experimental groups was calculated to detect a minimal difference of 40% between control and experimental groups, taking into account the observed variability from a pilot experiment. Under these conditions, optimal group sizes of 12 animals per group for PC3 and 10 animals per group for 4T1 results in 80% power at the two-sided 0.05 significance level. Experimenters were blinded until the end of the study, with one person preparing the cell suspensions, a second person assigning groups to letters, and a third person injecting animals. For PC3 late-stage metastasis experiments, groups of 8-week-old outbred male immunocompromised NOD scid gamma (NSG, The Jackson Laboratory, NOD.Cg-Prkdcscid Il2rgtm1Wjl/SzJ, strain# 005557, 12 mice per group) were injected into the tail vein with 2.5 × 10⁵ PC3 cells. At the end of the experiment, animals were euthanized, and one of the kidneys and one of the liver lobes were dissected and processed for IHC. For 4T1 metastasis experiments, groups of 8-week-old outbred female BALB/c (The Jackson Laboratory, BALB/cJ, strain# 000651) were injected in the fourth mammary fatpad with 2 × 10⁵ 4T1 cells. Primary tumor growth was measured via caliper measurement and quantified using the formula π*2W*L/6. When the average tumor volume for all animals in the experiment reached 450mm3, animals received peri-operative analgesia and primary tumors were surgically resected under anesthesia and processed for IHC. Mice were allowed to recover for 4 days with post-operative analgesia, after which metastatic outgrowth was tracked via IVIS imaging. A few animals on the 4T1 model died of peri-operative complications (n=3 in shM2a and n=1 in shM2b), which prevented tracking of metastatic disease. One animal on the shC group died immediately prior to visualization in IVIS at the endpoint, thus the shC group has n=9 group size for IVIS (but n=10 for IHC as lungs were removed and collected post-mortem). To visualize metastatic growth in either animal model, mice were injected intraperitoneally with 200μL of 15mg/mL D-Luciferin/PBS (PerkinElmer, catalog# 122799) and imaged using the IVIS Spectrum (PerkinElmer). At the end of the experiment, animals were euthanized, and target organs containing metastatic (Luc+) signal were dissected and processed for metastatic burden quantification as described below.
Metastatic burden quantification
Organs were rinsed in PBS and were fixed in neutral formalin (Fisher Scientific, catalog# SF93–4) overnight at 4°C, then processed at University of Colorado Cancer Center Pathology Shared Resource for paraffin embedding. Tissue slices (5μm thick sections) were then stained with Hematoxylin and Eosin (Vector Laboratories, catalog# H-3502) according to manufacturer’s protocol. Briefly, slides were warmed at 50°C for 30 minutes; deparaffinized in xylene for 15 minutes; then moved to xylene/ethanol 1:1 for 5 minutes; and rehydrated through an alcohol series for 5 minutes each (100%, 95%, 90%, 70%, 50%, 30% ethanol, diH2O). Tissue sections were covered in Hematoxylin for 5 minutes and washed twice in diH2O. Bluing reagent was added to sections, incubated for 15 seconds and washed twice in diH2O and once in 100% ethanol. Eosin Y solution was added to sections, incubated for 2–3 minutes and washed once in 100% ethanol. Slides were dehydrated in three changes of 100% ethanol for 2 minutes each, xylene/ethanol 1:1 for 5 minutes, xylene for 10 minutes, and allowed to air dry. Stained tissue sections were mounted with VectaMount Permanent Mounting Medium (Vector Laboratories, catalog# H-5000). Slides were scanned using Aperio-AT2 slide scanner (Leica) at a 40X magnification or Olympus IX83 at a 20X magnification. Metastatic burden was visualized and determined by calculating the total sum area of all outlined metastatic foci through Aperio ImageScope (version 12.4.6) or through cellSens (Olympus Life Sciences version 1.18). Outliers were determined by Grubbs’ test and excluded from the graph and statistical analysis.
Immunohistochemistry of patient biospecimens
A BCa TMA (Version CHTN_BrCaStg1) was obtained from the Cooperative Human Tissue Network (CHTN). This BCa TMA contained 60 cases of node-negative invasive breast carcinoma, 60 cases of node-positive invasive breast carcinoma, 20 cases of lymph nodes involved by metastatic breast carcinoma and 20 metastatic breast carcinomas. A PCa progression TMA was obtained from the University of Washington. The PCa TMA contains 127 cases representing primary tumors (64 are derived from non-recurrent disease and 63 are derived from recurrent disease), and 58 cases where metastatic PCa visceral tissues and bone tissues from the same patient are matched (92 visceral tissues and 89 bone tissues are included). The NSCLC TMA represents a cohort of 44 patients with single brain metastases from NSCLC who underwent surgical resection for curative purposes between 2010 and 2015 was retrieved from the archives of Fondazione IRCCS Ca’ Granda Ospedale Maggiore Policlinico16. The NSCLC TMA also includes primary NSCLC tissues from 17 patients of which 3 developed brain metastases. A Cancer Universal TMA (CaU-TMA) representative of 13 different cancer types (10 cases for each tumor type) was described previously43. For immunohistochemistry, four-μm-thick sections from each tissue block were stained with an antibody to MIRO2 (Protein Tech#11237–1-AP), using the Ventana BenchMark Ultra immunostainer (Roche Diagnostics) and diaminobenzidine as chromogen. Stained slides were independently evaluated and scored by two pathologists (VV and ADG), who were blinded to clinical data. When discrepancies occurred, the case was further reviewed to reach an agreement score. In all cases the stroma and the tumor areas were scored separately. For NSCLC and brain metastasis MIRO2 was scored both for the percentage of positive tumor cells and the intensity of the stain, where 1 is mild, 2 is intermediate and 3 is strong. For the prostate and breast cancer series the stain was more homogeneous within the cell types and only the intensity was recorded.
Bioinformatics analyses
METABRIC (Molecular Taxonomy of Breast Cancer International Consortium) dataset44 was downloaded from cBioPortal (https://www.cbioportal.org/study/summary?id=brca_metabric). BCa and PCa TCGA datasets were downloaded using the R package TCGAbiolinks45. Normal tissue samples were removed from the analysis. Normalized count matrices were generated using DESeq246. From the normalized counts, the samples with the highest MIRO2 expression (Q4 - over the 75% percentile) and those with the lowest (Q1 - under the 25% percentile) were identified. Using the raw count matrix in DESeq2 and the Q1 and Q4 samples, a differential gene expression analysis was performed. Pathway enrichment analysis was performed using Gene Set Expression Analysis47 and Metascape48. A “RhoA-specific genes” gene set was derived from the published dataset GSE6471425 that contains microarray data from primary keratinocytes isolated from wildtype (RhoAWT) or RhoA−/− mice. We categorized genes as RhoA-specific if their mRNA decreased at least 1.5-fold in RhoA−/− compared to RhoAWT, with p <0.05. Using this list, we performed GSEA comparing MIRO2 Q4 versus Q1 samples on the PCa TCGA, BCa TCGA, and METABRIC datasets.
Study approval
Studies involving vertebrate animals (rodents) were carried out in accordance with the Guide for the Care and Use of Laboratory Animals (National Academies Press, 2011). The Institutional Animal Care and Use Committee (IACUC) of the University of Colorado (Aurora, CO) approved all animal experiments under Protocol # 00581. Studies using human deidentified tissues were considered exempt from human subject research by the Colorado Institutional Review Board. PCa rapid autopsy tissues were collected from patients under the aegis of the PCa Donor Program at the University of Washington IRB#2341. Formalin-fixed, paraffin-embedded primary PCa tumors from 127 patients and metastatic castration-resistant PCa tumors from 58 patients were used to construct tissue microarrays. BCa TMA samples were obtained from the CHTN which operates with the review and approval of their local Institutional Review Board (IRB). All NSCLC and CaU-TMA patient-related studies were reviewed and approved by an Institutional Review Board at Fondazione IRCCS Ca’ Granda Ospedale Maggiore Policlinico Milan, Italy.
QUANTIFICATION AND STATISTICAL ANALYSIS
Experiments were carried out in triplicates and data are expressed as mean ± SEM of multiple independent experiments (at least three independent experiments, n = 3). Student t-test was used for two group comparative analyses. For multiple-group comparisons, means were compared with ANOVA and the indicated post-test. All statistical analyses were performed using GraphPad Prism version 8.2 for Windows. A p <0.05 was considered statistically significant.
Supplementary Material
KEY RESOURCES TABLE.
| REAGENT or RESOURCE | SOURCE | IDENTIFIER |
|---|---|---|
|
| ||
| Antibodies | ||
|
| ||
| Rabbit polyclonal anti-MIRO2 | Proteintech | Cat#11237-1-AP; RRID:AB_2179539 |
| Rabbit polyclonal anti-MIRO2 | Cell Signaling Technology | Cat#14016; RRID:AB_2798361 |
| Rabbit polyclonal anti-MIRO2 | ThermoFisher | Cat#PA5-52960; RRID:AB_2646541 |
| Rabbit polyclonal anti-MYO9B | Proteintech | Cat#12432-1-AP; RRID:AB_2148635 |
| Rabbit monoclonal anti-RhoA (clone 67B9) | Cell Signaling Technology | Cat#2117; RRID:AB_10693922 |
| Rabbit monoclonal anti-Vinculin (clone E1E9V) | Cell Signaling Technology | Cat#13901; RRID:AB_2714181 |
| Mouse monoclonal anti-β-actin (clone AC-15) | Sigma-Aldrich | Cat#A5441; RRID:AB_476744 |
| Mouse monoclonal anti-GFP (clone 4B10) | Cell Signaling Technology | Cat#2955; RRID:AB_1196614 |
| Mouse monoclonal anti-Myc-Tag (clone 9B11) | Cell Signaling Technology | Cat#2276; RRID:AB_1281342 |
| Anti-mouse IgG HRP-linked | Cell Signaling Technology | Cat#7076; RRID:AB_330924 |
| Anti-rabbit IgG HRP-linked | Cell Signaling Technology | Cat#7074; RRID:AB_2099233 |
| Goat anti-Rabbit IgG (H+L) Highly Cross-Adsorbed Secondary Antibody, Alexa Fluor™ Plus 594 | ThermoFisher | Cat# A32740; RRID:AB_2762824 |
| GFP-Booster ATTO488 | Chromotek | Cat#gba488; RRID: AB_2631386 |
| Rabbit IgG, Control | Vector Laboratories | Cat#I-1000; RRID:AB_2336355 |
|
| ||
| Bacterial and virus strains | ||
|
| ||
| Red-shifted Firefly Luciferase lentivirus | AMSBIO | Cat#LVP-1232 |
|
| ||
| Biological samples | ||
|
| ||
| Breast cancer Tissue Microarray | University of Virginia CHTN | CHTN_BrCaStg1-Breast Cancer Progression |
| Prostate cancer Tissue Microarray | University of Washington | UWTMA53 and UWTMA100 |
| Non-small cell lung cancer Tissue Microarray | Fondazione IRCCS Ca’ Granda Ospedale Maggiore Policlinico | N/A |
| Cancer Universal Tumor Microarray | Fondazione IRCCS Ca’ Granda Ospedale Maggiore Policlinico | N/A |
|
| ||
| Chemicals, peptides, and recombinant proteins | ||
|
| ||
| 3XFLAG peptide | Sigma-Aldrich | Cat#F4799 |
|
| ||
| Critical commercial assays | ||
|
| ||
| ATCC Universal Mycoplasma Detection Kit | ATCC | Cat#301012K |
| RealTime-Glo™ MT Cell Viability Assay | Promega | Cat#G9713 |
| CyQUANT™ NF Cell Proliferation Assay | ThermoFisher | Cat# C35007 |
| Rho Activation Assay Biochem Kit | Cytoskeleton | Cat#BK036 |
|
| ||
| Deposited data | ||
|
| ||
| METABRIC dataset | cBioPortal | https://www.cbioportal.org/study/summary?id=brca_metabric |
| Breast cancer TCGA dataset | cBioPortal | https://www.cbioportal.org/study/summary?id=brca_tcga_pub |
| Prostate cancer TCGA dataset | cBioPortal | https://www.cbioportal.org/study/summary?id=prad_tcga_pan_can_atlas_2018 |
| MIRO2 binding partners | Furnish et al.11 | PRIDE: Project PDX029490 |
| “RhoA-specific genes” dataset | Garcia-Mariscal et al.25 | GEO: GSE64714 |
|
| ||
| Experimental models: Cell lines | ||
|
| ||
| Human: DU145 | ATCC | Cat#HTB-81; RRID:CVCL_0105 |
| Human: PC3 | ATCC | Cat#CRL-1435; RRID:CVCL_0035 |
| Human: C4-2 | ATCC | Cat#CRL-3314; RRID:CVCL_4782 |
| Human: MDA-MB-231 | ATCC | Cat#HTB-26; RRID:CVCL_0062 |
| Human: MDA-MB-468 | ATCC | Cat#HTB-132; RRID:CVCL_0419 |
| Human: BT-20 | ATCC | Cat#HTB-19; RRID:CVCL_0178 |
| Human: BT-549 | ATCC | Cat#HTB-122; RRID:CVCL_1092 |
| Human: RPMI-7951 | ATCC | Cat#HTB-66; RRID:CVCL_1666 |
| Human: SK-MEL-28 | ATCC | Cat#HTB-72; RRID:CVCL_0526 |
| Human: MIA PaCa-2 | ATCC | Cat#CRL-1420; RRID:CVCL_0428 |
| Human: PANC-1 | ATCC | Cat#CRL-1469; RRID:CVCL_0480 |
|
| ||
| Experimental models: Organisms/strains | ||
|
| ||
| Mouse: NOD.Cg-Prkdcscid Il2rgtm1Wjl/SzJ | The Jackson Laboratory | Strain#005557; RRID:IMSR_JAX:005557 |
| Mouse: BALB/cJ | The Jackson Laboratory | Strain#000651; RRID:IMSR_JAX:000651 |
|
| ||
| Oligonucleotides | ||
|
| ||
| See Table S2 for siRNA, shRNA, and mutagenesis primers | – | N/A |
|
| ||
| Recombinant DNA | ||
|
| ||
| pCMV6-entry-myc-FLAG | Origene Technologies | Cat#PS100001 |
| pCMV6-MIRO2-myc-FLAG | Origene Technologies | Cat#RC204823 |
| pCMV6-MIRO2-ΔTM-myc-FLAG | This paper | N/A |
| pCMV6-MIRO2-G-I-myc-FLAG | This paper | N/A |
| pCMV6-MIRO2-ΔG-I-myc-FLAG | This paper | N/A |
| pCMV6-MIRO2-Mid-myc-FLAG | This paper | N/A |
| pCMV6-MIRO2-G-II-myc-FLAG | This paper | N/A |
| pCMV6-MIRO2-ΔG-II-myc-FLAG | This paper | N/A |
| pEGFP-C1-empty | Clontech | N/A |
| GFP-MYO9B | Muller et al.41 | Addgene Plasmid #134907 |
| GFP-MYO9B-R1695M | Muller et al.41 | Addgene Plasmid #134911 |
| GFP-MYO9B-Δtail | This paper | N/A |
| GFP-MYO9B-tail | This paper | N/A |
| GFP-MYO9B-ΔIQ | This paper | N/A |
| GFP-MYO9B-ΔGAP | This paper | N/A |
| pcDNA3-EGFP-RhoA-WT | Subauste et al.42 | Addgene Plasmid #12965 |
| pcDNA3-EGFP-RhoA-T19N | Subauste et al.42 | Addgene Plasmid #12967 |
| pcDNA3-EGFP-RhoA-Q63L | Subauste et al.42 | Addgene Plasmid #12968 |
| dTomato-2xrGBD | Mahlandt et al.24 | Addgene Plasmid #129625 |
|
| ||
| Software and algorithms | ||
|
| ||
| ImageJ | – | https://imagej.nih.gov/ij/ |
| GraphPad Prism v. 8.2 | – | https://www.graphpad.com/ |
Highlights.
MIRO2 supports the metastatic potential of breast and prostate epithelial cancer cells
MIRO2 forms a complex with MYO9B and RhoA and suppresses RhoA activity
MYO9B-dependent cell invasion requires its GAP activity and MIRO2 expression
RhoA knockdown restores cell invasion of MIRO2-depleted cancer cells
ACKNOWLEDGMENTS
The authors thank Cristina Avena-Roman for assistance with animal experiments and E. Erin Smith for tissue embedding and sectioning. This work was supported by American Cancer Society IRG-16–184-56 (M.C.C.); Boettcher Foundation AWD-193249 (M.C.C.); Department of Defense W81XWH-21–1-0408 (M.C.C.); National Institutes of Health R35 GM142774 (M.C.C.), T32 GM007635 (D.P.B.), T32 GM136444 (A.J.N. and R.L.), F31 CA271652 (D.P.B.), and R01 GM122768 (R.P.); and Lietuvos Mokslų Akademija P-MIP-22–25 (R.P.). Cancer Center Support Grant P30 CA046934 to the University of Colorado Cancer Center provided partial support for Core Facilities utilized in this study. Breast tissue samples were provided by the CHTN, which is funded by the National Cancer Institute. We thank the patients and their families, Heather Cheng, Peter Nelson, Bruce Montgomery, Evan Yu, Mike Schweizer, Jessica Hawley, Andrew Hsieh, Daniel Lin, Funda Vakar-Lopez, Martine Roudier, Michael Haffner, Lawrence True, and the rapid autopsy teams for their contributions to the University of Washington Medical Center PCa Donor Program. This work was supported by the Department of Defense PCa Biorepository Network (PCBN) (W81XWH-14–2-0183), the Pacific Northwest PCa SPORE (P50CA97186), and the Institute for PCa Research. The graphical abstract was created in BioRender. Caino, C. (2024) BioRender.com/c37j874.
Footnotes
DECLARATION OF INTERESTS
The authors declare no competing interests.
SUPPLEMENTAL INFORMATION
Supplemental information can be found online at https://doi.org/10.1016/j.celrep.2024.115120.
REFERENCES
- 1.Valastyan S, and Weinberg RA (2011). Tumor metastasis: molecular insights and evolving paradigms. Cell 147, 275–292. 10.1016/j.cell.2011.09.024. [DOI] [PMC free article] [PubMed] [Google Scholar]
- 2.Riley RS, June CH, Langer R, and Mitchell MJ (2019). Delivery technologies for cancer immunotherapy. Nat. Rev. Drug Discov. 18, 175–196. 10.1038/s41573-018-0006-z. [DOI] [PMC free article] [PubMed] [Google Scholar]
- 3.Gross S, Rahal R, Stransky N, Lengauer C, and Hoeflich KP (2015). Targeting cancer with kinase inhibitors. J. Clin. Invest. 125, 1780–1789. 10.1172/JCI76094. [DOI] [PMC free article] [PubMed] [Google Scholar]
- 4.Scheid AD, Beadnell TC, and Welch DR (2021). Roles of mitochondria in the hallmarks of metastasis. Br. J. Cancer 124, 124–135. 10.1038/s41416-020-01125-8. [DOI] [PMC free article] [PubMed] [Google Scholar]
- 5.Caino MC, and Altieri DC (2016). Molecular Pathways: Mitochondrial Reprogramming in Tumor Progression and Therapy. Clin. Cancer Res. 22, 540–545. 10.1158/1078-0432.CCR-15-0460. [DOI] [PMC free article] [PubMed] [Google Scholar]
- 6.Fransson A, Ruusala A, and Aspenström P (2003). Atypical Rho GTPases have roles in mitochondrial homeostasis and apoptosis. J. Biol. Chem. 278, 6495–6502. 10.1074/jbc.M208609200. [DOI] [PubMed] [Google Scholar]
- 7.Fransson S, Ruusala A, and Aspenström P (2006). The atypical Rho GTPases Miro-1 and Miro-2 have essential roles in mitochondrial trafficking. Biochem. Biophys. Res. Commun. 344, 500–510. 10.1016/j.bbrc.2006.03.163. [DOI] [PubMed] [Google Scholar]
- 8.MacAskill AF, Brickley K, Stephenson FA, and Kittler JT (2009). GTPase dependent recruitment of Grif-1 by Miro1 regulates mitochondrial trafficking in hippocampal neurons. Mol. Cell. Neurosci. 40, 301–312. 10.1016/j.mcn.2008.10.016. [DOI] [PubMed] [Google Scholar]
- 9.Wang X, and Schwarz TL (2009). The mechanism of Ca2+-dependent regulation of kinesin-mediated mitochondrial motility. Cell 136, 163–174. 10.1016/j.cell.2008.11.046. [DOI] [PMC free article] [PubMed] [Google Scholar]
- 10.Lopez-Domenech G, Covill-Cooke C, Ivankovic D, Halff EF, Sheehan DF, Norkett R, Birsa N, and Kittler JT (2018). Miro proteins coordinate microtubule- and actin-dependent mitochondrial transport and distribution. EMBO J. 37, 321–336. 10.15252/embj.201696380. [DOI] [PMC free article] [PubMed] [Google Scholar]
- 11.Furnish M, Boulton DP, Genther V, Grofova D, Ellinwood ML, Romero L, Lucia MS, Cramer SD, and Caino MC (2022). MIRO2 Regulates Prostate Cancer Cell Growth via GCN1-Dependent Stress Signaling. Mol. Cancer Res. 20, 607–621. 10.1158/1541-7786.mcr-21-0374. [DOI] [PMC free article] [PubMed] [Google Scholar]
- 12.Agarwal E, Altman BJ, Ho Seo J, Bertolini I, Ghosh JC, Kaur A, Kossenkov AV, Languino LR, Gabrilovich DI, Speicher DW, et al. (2019). Myc Regulation of a Mitochondrial Trafficking Network Mediates Tumor Cell Invasion and Metastasis. Mol. Cell Biol. 39, e00109–19. 10.1128/MCB.00109-19. [DOI] [PMC free article] [PubMed] [Google Scholar]
- 13.Caino MC, Seo JH, Aguinaldo A, Wait E, Bryant KG, Kossenkov AV, Hayden JE, Vaira V, Morotti A, Ferrero S, et al. (2016). A neuronal network of mitochondrial dynamics regulates metastasis. Nat. Commun. 7, 13730. 10.1038/ncomms13730. [DOI] [PMC free article] [PubMed] [Google Scholar]
- 14.Zhuang A, Zhuang A, Chen Y, Qin Z, Zhu D, Ren L, Wei Y, Zhou P, Yue X, He F, et al. (2023). Proteomic characteristics reveal the signatures and the risks of T1 colorectal cancer metastasis to lymph nodes. Elife 12, e82959. 10.7554/eLife.82959. [DOI] [PMC free article] [PubMed] [Google Scholar]
- 15.Boulton DP, and Caino MC (2024). Emerging roles for Mitochondrial Rho GTPases in tumor biology. J. Biol. Chem. 300, 107670. 10.1016/j.jbc.2024.107670. [DOI] [PMC free article] [PubMed] [Google Scholar]
- 16.Seo JH, Rivadeneira DB, Caino MC, Chae YC, Speicher DW, Tang HY, Vaira V, Bosari S, Palleschi A, Rampini P, et al. (2016). The Mitochondrial Unfoldase-Peptidase Complex ClpXP Controls Bioenergetics Stress and Metastasis. PLoS Biol. 14, e1002507. 10.1371/journal.pbio.1002507. [DOI] [PMC free article] [PubMed] [Google Scholar]
- 17.Hanley PJ, Xu Y, Kronlage M, Grobe K, Schön P, Song J, Sorokin L, Schwab A, and Bähler M (2010). Motorized RhoGAP myosin IXb (Myo9b) controls cell shape and motility. Proc. Natl. Acad. Sci. USA 107, 12145–12150. 10.1073/pnas.0911986107. [DOI] [PMC free article] [PubMed] [Google Scholar]
- 18.Makowska KA, Hughes RE, White KJ, Wells CM, and Peckham M (2015). Specific Myosins Control Actin Organization, Cell Morphology, and Migration in Prostate Cancer Cells. Cell Rep. 13, 2118–2125. 10.1016/j.celrep.2015.11.012. [DOI] [PMC free article] [PubMed] [Google Scholar]
- 19.Kong R, Yi F, Wen P, Liu J, Chen X, Ren J, Li X, Shang Y, Nie Y, Wu K, et al. (2015). Myo9b is a key player in SLIT/ROBO-mediated lung tumor suppression. J. Clin. Invest. 125, 4407–4420. 10.1172/JCI81673. [DOI] [PMC free article] [PubMed] [Google Scholar]
- 20.Hodge RG, and Ridley AJ (2016). Regulating Rho GTPases and their regulators. Nat. Rev. Mol. Cell Biol. 17, 496–510. 10.1038/nrm.2016.67. [DOI] [PubMed] [Google Scholar]
- 21.Post PL, Bokoch GM, and Mooseker MS (1998). Human myosin-IXb is a mechanochemically active motor and a GAP for rho. J. Cell Sci. 111, 941–950. 10.1242/jcs.111.7.941. [DOI] [PubMed] [Google Scholar]
- 22.Post PL, Tyska MJ, O’Connell CB, Johung K, Hayward A, and Mooseker MS (2002). Myosin-IXb is a single-headed and processive motor. J. Biol. Chem. 277, 11679–11683. 10.1074/jbc.M111173200. [DOI] [PubMed] [Google Scholar]
- 23.Hemkemeyer SA, Vollmer V, Schwarz V, Lohmann B, Honnert U, Taha M, Schnittler HJ, and Bähler M (2021). Local Myo9b RhoGAP activity regulates cell motility. J. Biol. Chem. 296, 100136. 10.1074/jbc.RA120.013623. [DOI] [PMC free article] [PubMed] [Google Scholar]
- 24.Mahlandt EK, Arts JJG, van der Meer WJ, van der Linden FH, Tol S, van Buul JD, Gadella TWJ, and Goedhart J (2021). Visualizing endogenous Rho activity with an improved localization-based, genetically encoded biosensor. J. Cell Sci. 134, jcs258823. 10.1242/jcs.258823. [DOI] [PMC free article] [PubMed] [Google Scholar]
- 25.Garcia-Mariscal A, Peyrollier K, Basse A, Pedersen E, Ruhl R, van Hengel J, and Brakebusch C (2018). RhoA controls retinoid signaling by ROCK dependent regulation of retinol metabolism. Small GTPases 9, 433–444. 10.1080/21541248.2016.1248272. [DOI] [PMC free article] [PubMed] [Google Scholar]
- 26.Jarnuczak AF, Najgebauer H, Barzine M, Kundu DJ, Ghavidel F, Perez-Riverol Y, Papatheodorou I, Brazma A, and Vizcaíno JA (2021). An integrated landscape of protein expression in human cancer. Sci. Data 8, 115. 10.1038/s41597-021-00890-2. [DOI] [PMC free article] [PubMed] [Google Scholar]
- 27.Nguyen TT, Oh SS, Weaver D, Lewandowska A, Maxfield D, Schuler MH, Smith NK, Macfarlane J, Saunders G, Palmer CA, et al. (2014). Loss of Miro1-directed mitochondrial movement results in a novel murine model for neuron disease. Proc. Natl. Acad. Sci. USA 111, E3631–E3640. 10.1073/pnas.1402449111. [DOI] [PMC free article] [PubMed] [Google Scholar]
- 28.Furnish M, and Caino MC (2020). Altered mitochondrial trafficking as a novel mechanism of cancer metastasis. Cancer Rep. 3, e1157. 10.1002/cnr2.1157. [DOI] [PMC free article] [PubMed] [Google Scholar]
- 29.van Eijck CWF, Sabroso-Lasa S, Strijk GJ, Mustafa DAM, Fellah A, Koerkamp BG, Malats N, and van Eijck CHJ (2024). A liquid biomarker signature of inflammatory proteins accurately predicts early pancreatic cancer progression during FOLFIRINOX chemotherapy. Neoplasia 49, 100975. 10.1016/j.neo.2024.100975. [DOI] [PMC free article] [PubMed] [Google Scholar]
- 30.Yi FS, Zhang X, Zhai K, Huang ZY, Wu XZ, Wu MT, Shi XY, Pei XB, Dong SF, Wang W, et al. (2020). TSAd Plays a Major Role in Myo9b-Mediated Suppression of Malignant Pleural Effusion by Regulating T(H)1/T(H)17 Cell Response. J. Immunol. 205, 2926–2935. 10.4049/jimmunol.2000307. [DOI] [PubMed] [Google Scholar]
- 31.van den Boom F, Düssmann H, Uhlenbrock K, Abouhamed M, and Bähler M (2007). The Myosin IXb motor activity targets the myosin IXb RhoGAP domain as cargo to sites of actin polymerization. Mol. Biol. Cell 18, 1507–1518. 10.1091/mbc.e06-08-0771. [DOI] [PMC free article] [PubMed] [Google Scholar]
- 32.Kamai T, Yamanishi T, Shirataki H, Takagi K, Asami H, Ito Y, and Yoshida KI (2004). Overexpression of RhoA, Rac1, and Cdc42 GTPases is associated with progression in testicular cancer. Clin. Cancer Res. 10, 4799–4805. 10.1158/1078-0432.CCR-0436-03. [DOI] [PubMed] [Google Scholar]
- 33.Chan CH, Lee SW, Li CF, Wang J, Yang WL, Wu CY, Wu J, Nakayama KI, Kang HY, Huang HY, et al. (2010). Deciphering the transcriptional complex critical for RhoA gene expression and cancer metastasis. Nat. Cell Biol. 12, 457–467. 10.1038/ncb2047. [DOI] [PMC free article] [PubMed] [Google Scholar]
- 34.Adua SJ, Arnal-Estapé A, Zhao M, Qi B, Liu ZZ, Kravitz C, Hulme H, Strittmatter N, López-Giráldez F, Chande S, et al. (2022). Brain metastatic outgrowth and osimertinib resistance are potentiated by RhoA in EGFR-mutant lung cancer. Nat. Commun. 13, 7690. 10.1038/s41467-022-34889-z. [DOI] [PMC free article] [PubMed] [Google Scholar]
- 35.Pille JY, Denoyelle C, Varet J, Bertrand JR, Soria J, Opolon P, Lu H, Pritchard LL, Vannier JP, Malvy C, et al. (2005). Anti-RhoA and anti-RhoC siRNAs inhibit the proliferation and invasiveness of MDA-MB-231 breast cancer cells in vitro and in vivo. Mol. Ther. 11, 267–274. 10.1016/j.ymthe.2004.08.029. [DOI] [PubMed] [Google Scholar]
- 36.Kalpana G, Figy C, Yeung M, and Yeung KC (2019). Reduced RhoA expression enhances breast cancer metastasis with a concomitant increase in CCR5 and CXCR4 chemokines signaling. Sci. Rep. 9, 16351. 10.1038/s41598-019-52746-w. [DOI] [PMC free article] [PubMed] [Google Scholar]
- 37.Vega FM, Fruhwirth G, Ng T, and Ridley AJ (2011). RhoA and RhoC have distinct roles in migration and invasion by acting through different targets. J. Cell Biol. 193, 655–665. 10.1083/jcb.201011038. [DOI] [PMC free article] [PubMed] [Google Scholar]
- 38.Simpson KJ, Dugan AS, and Mercurio AM (2004). Functional analysis of the contribution of RhoA and RhoC GTPases to invasive breast carcinoma. Cancer Res. 64, 8694–8701. 10.1158/0008-5472.CAN-04-2247. [DOI] [PubMed] [Google Scholar]
- 39.Garcia-Mariscal A, Li H, Pedersen E, Peyrollier K, Ryan KM, Stanley A, Quondamatteo F, and Brakebusch C (2018). Loss of RhoA promotes skin tumor formation and invasion by upregulation of RhoB. Oncogene 37, 847–860. 10.1038/onc.2017.333. [DOI] [PubMed] [Google Scholar]
- 40.Guilluy C, Garcia-Mata R, and Burridge K (2011). Rho protein crosstalk: another social network? Trends Cell Biol. 21, 718–726. 10.1016/j.tcb.2011.08.002. [DOI] [PMC free article] [PubMed] [Google Scholar]
- 41.Muller RT, Honnert U, Reinhard J, and Bahler M (1997). The rat myosin myr 5 is a GTPase-activating protein for Rho in vivo: essential role of arginine 1695. Mol. Biol. Cell 8, 2039–2053. 10.1091/mbc.8.10.2039. [DOI] [PMC free article] [PubMed] [Google Scholar]
- 42.Subauste MC, Von Herrath M, Benard V, Chamberlain CE, Chuang TH, Chu K, Bokoch GM, and Hahn KM (2000). Rho family proteins modulate rapid apoptosis induced by cytotoxic T lymphocytes and Fas. J. Biol. Chem. 275, 9725–9733. 10.1074/jbc.275.13.9725. [DOI] [PubMed] [Google Scholar]
- 43.Vaira V, Faversani A, Dohi T, Maggioni M, Nosotti M, Tosi D, Altieri DC, and Bosari S (2011). Aberrant overexpression of the cell polarity module scribble in human cancer. Am. J. Pathol. 178, 2478–2483. 10.1016/j.ajpath.2011.02.028. [DOI] [PMC free article] [PubMed] [Google Scholar]
- 44.Curtis C, Shah SP, Chin SF, Turashvili G, Rueda OM, Dunning MJ, Speed D, Lynch AG, Samarajiwa S, Yuan Y, et al. (2012). The genomic and transcriptomic architecture of 2,000 breast tumours reveals novel subgroups. Nature 486, 346–352. 10.1038/nature10983. [DOI] [PMC free article] [PubMed] [Google Scholar]
- 45.Colaprico A, Silva TC, Olsen C, Garofano L, Cava C, Garolini D, Sabedot TS, Malta TM, Pagnotta SM, Castiglioni I, et al. (2016). TCGAbiolinks: an R/Bioconductor package for integrative analysis of TCGA data. Nucleic Acids Res. 44, e71. 10.1093/nar/gkv1507. [DOI] [PMC free article] [PubMed] [Google Scholar]
- 46.Love MI, Huber W, and Anders S (2014). Moderated estimation of fold change and dispersion for RNA-seq data with DESeq2. Genome Biol. 15, 550. 10.1186/s13059-014-0550-8. [DOI] [PMC free article] [PubMed] [Google Scholar]
- 47.Zhu A, Srivastava A, Ibrahim JG, Patro R, and Love MI (2019). Nonparametric expression analysis using inferential replicate counts. Nucleic Acids Res. 47, e105. 10.1093/nar/gkz622. [DOI] [PMC free article] [PubMed] [Google Scholar]
- 48.Zhou Y, Zhou B, Pache L, Chang M, Khodabakhshi AH, Tanaseichuk O, Benner C, and Chanda SK (2019). Metascape provides a biologist-oriented resource for the analysis of systems-level datasets. Nat. Commun. 10, 1523. 10.1038/s41467-019-09234-6. [DOI] [PMC free article] [PubMed] [Google Scholar]
Associated Data
This section collects any data citations, data availability statements, or supplementary materials included in this article.
Supplementary Materials
Data Availability Statement
This study did not generate new omics datasets or unique codes. The data analyzed in this study were obtained and are publicly available from cBioPortal (METABRIC, BCa TCGA, PCa TCGA), Gene Expression Omnibus (GEO) at GEO: GSE64714, and ProteomeXchange Consortium via the PRIDE partner repository, ProteomeXchange: PXD029490. All other datatypes will be shared by the lead contact upon request after publication.