

SUMMARY
The most severe form of α-thalassemia results from loss of all four copies of α-globin. Postnatally, patients face challenges similar to β-thalassemia, including severe anemia and erythrotoxicity due to the imbalance of β-globin and α-globin chains. Despite progress in genome editing treatments for β-thalassemia, there is no analogous curative option for α-thalassemia. To address this, we designed a Cas9/AAV6-mediated genome editing strategy that integrates a functional α-globin gene into the β-globin locus in α-thalassemia patient-derived hematopoietic stem and progenitor cells (HSPCs). Incorporation of a truncated erythropoietin receptor transgene into the α-globin integration cassette significantly increased erythropoietic output from edited HSPCs and led to the most robust production of α-globin, and consequently hemoglobin tetramers. By directing edited HSPCs toward increased production of clinically relevant erythroid cells, this approach has the potential to mitigate the limitations of current treatments for the hemoglobinopathies, including low genome editing and low engraftment rates.
In brief
Chu et al. present a universal correction strategy for α-thalassemia major using Cas9/AAV6 to integrate a functional α-globin gene and hypermorphic erythropoietin receptor into the β-globin locus in hematopoietic stem and progenitor cells. The approach restores the hemoglobin production and enhances erythropoietic output, offering a potential curative therapy for α-thalassemia.
Graphical Abstract

INTRODUCTION
α-Thalassemia is one of the most common monogenic diseases in the world. It is currently estimated that 5% of the world’s population harbors an α-thalassemia variant.1 While the carrier frequency is highest in those with southeast Asian heritage, data suggests that these rates are rising due to population growth, human migration, and advances in treating milder forms of the disease.2 Humans harbor four copies of α-globin genes (a direct tandem repeat on chromosome 16), and disease severity directly correlates with the number of mutated or deleted alleles. The most severe form of the disease, in which all four copies are disrupted, is called α-thalassemia major (αTM). While this disease has historically been lethal in utero, patients may now survive to birth after in utero blood transfusions, often with excellent neurologic outcomes.3,4 Postnatally, these patients present with a disease similar to β-thalassemia, with the absence of α-globin leading to an inability to form hemoglobin heterotetramers and subsequent severe anemia. Moreover, the accumulation of orphan β-globin chains, which form oxidized, covalently linked dimers and an unstable homotetramer (hemoglobin H), leads to erythrotoxicity and hemolysis.5 As a consequence, these patients require chronic transfusions, which often results in iron overload and need for iron chelation therapy.6 Although allogeneic-hematopoietic stem cell transplantation (HSCT) may provide a cure, suitable matched donors are only available in a minority of cases and carry a risk of immune rejection and graft-versus-host disease (GvHD).7 Furthermore, while numerous gene therapy and genome editing strategies have been developed for patients with β-thalassemia,8–10 there are no such therapies for the most severe forms of α-thalassemia, indicating a major unmet medical need for this patient population.
In this work, we developed a Cas9/adeno-associated virus type 6 (AAV6)-mediated genome editing strategy to integrate a functional copy of the α-globin gene into the β-globin locus in αTM patient-derived hematopoietic stem and progenitor cells (HSPCs) as a universal treatment strategy for the disorder—an approach that could be curative for any αTM patient regardless of the specific causative mutations or deletions. This approach allows both correction of the underlying disease and restoration of the β-globin:α-globin imbalance by placing the α-globin transgene under erythroid-specific expression of the β-globin locus. Taking a cue from human genetics, we also incorporated a naturally occurring truncated erythropoietin receptor (tEPOR) cDNA into the α-globin integration cassette, allowing for simultaneous correction of α-thalassemia and increased erythropoietic output from edited HSPCs.11 By directing edited HSPCs toward increased production of clinically relevant erythroid cells instead of other divergent cell types, this approach has the potential to overcome many of the clinical challenges of HSCT for the treatment of the hemoglobinopathies, including low editing and engraftment rates and high morbidity from prerequisite myeloablative regimens.12–14 Similar to our prior work with β-thalassemia,8 this strategy could be used to develop an autologous-HSCT treatment for αTM, overcoming the shortage of matched donors and ameliorating the risk of immune rejection and GvHD for patients suffering from this disease.
RESULTS
Efficient Cas9 cleavage with HBB intron-targeting gRNAs
Due to the high editing frequencies achieved in primary HSPCs in prior work,8,15 we sought to use a Cas9/AAV6-mediated genome editing strategy to knock an α-globin (HBA) transgene into the β-globin (HBB) locus in patient-derived HSPCs. To do so, we first designed and screened Cas9 guide RNAs (gRNAs) at the HBB locus. So that cleavage alone without homology-directed repair (HDR) would not disrupt β-globin production, we chose 22 candidate gRNAs located in intron 1 or intron 2 as well as the 3′ UTR (Figure 1A; Table S1). To determine cleavage frequencies, we delivered candidate gRNAs pre-complexed with Cas9 protein to the human HUDEP-2 cell line16 via transfection. Genomic DNA was harvested several days post-editing and subjected to PCR amplification of the region surrounding the expected cleavage site. Insertion and deletion (indel) frequencies of the corresponding Sanger sequences were then quantified using inference of CRISPR edits (ICE) analysis.17 We found that editing the 5′ and 3′ UTR regions of HBB proved not to be feasible, as the former had significant homology to δ-globin and the latter had no gRNAs with detectable cleavage. We found that the most efficient gRNAs corresponded to sg7 in intron 1 and to sg11 and 13 in intron 2 (Figures 1A and S1A).18 In silico off-target analysis of these guides using COSMID (CRISPR Off-Target Sites with Mismatches, Insertions, and Deletions)19,20 revealed that sg7 had the most favorable predicted off-target profile (Figure 1B). On further evaluation of the 19 predicted off-target sites for sg7, all were found to reside in non-coding regions of the genome (Figure 1C).
Figure 1. Efficient integration of HDR templates at HBB locus.

(A) Schematic of HBB-targeting gRNAs and resulting indel frequencies in HUDEP-2 cells following electroporation-mediated delivery of Cas9 protein:gRNA complexes. The dotted line indicates indel frequencies at 75% threshold. Bars represent mean ± standard error of the mean (SEM).
(B) In silico off-target analysis of gRNA 7, 11, and 13 using COSMID.
(C) Pie chart displaying genomic features at 19 predicted off-target sites for sg7.
(D) Schematic of custom AAV6 DNA repair donors designed to mediate integration at intron 1 using sg7 or intron 2 using sg11 or 13. The bracket indicates the approximate distance between left and right homology arms.
(E) Schematic of Cas9/AAV6 genome editing workflow in primary HSPCs.
(F) Percentage of GFP+ cells following editing in WT HSPCs was determined at day 5 post-editing using flow cytometry. “sg7+i1” shorthand refers to gRNA 7 (shown in A) paired with intron 1 donor (shown in D). Bars represent mean ± SEM. *p < 0.05 by unpaired two-tailed t test.
(G) Mean fluorescence intensity (MFI) of GFP+ cells (from F) was determined by flow cytometry. Bars represent mean ± SEM.
Efficient integration of HDR templates at HBB locus
Following the identification of effective HBB intron-targeting gRNAs, we developed DNA repair templates packaged in AAV6 delivery vectors that could effectively mediate HDR at these cleavage sites (termed intron 1 and intron 2 donors; Figure 1D). Each integration cassette comprised a spleen focus-forming virus (SFFV) promoter driving the expression of a GFP reporter to allow rapid readout of integration frequencies via flow cytometry. While the right homology arm of each DNA repair template corresponded to the ~900 bp immediately downstream of the intron 1 or intron 2 Cas9 cut site, the left homology arm was split away from the cleavage sites to correspond to the ~900 bp immediately upstream of the start codon of the endogenous HBB gene. As in a prior study,8 this split homology arm strategy is expected to allow promoterless integration cassettes—ultimately, an α-globin transgene in this work—to be driven by the regulatory machinery of the endogenous locus.
Once DNA repair templates were assembled and packaged into AAV6 vectors, we tested each integration strategy by delivering the most effective gRNAs (sg7, sg11, or sg13) complexed with high-fidelity Cas9 protein21 to wild-type (WT) human primary CD34+-enriched HSPCs via electroporation. Immediately following electroporation, we transduced cells with AAV6 vectors corresponding to either intron 1 or intron 2 integration schemes. Five days later, we analyzed editing frequencies by flow cytometry (Figures 1E and S2A). We aimed to determine the effectiveness of transgene knockin with various gRNA and homology arm combinations using the most effective gRNAs defined in Figure 1A. We found that the intron 1 integration strategy was significantly more efficient (median of 17.1% GFP+ cells) compared to intron 2 integration (median of 12.5% for sg11 and 13.3% for sg13; p < 0.05) (Figure 1F), perhaps due to the shorter distance that the left homology arm was split away from the Cas9 cleavage site. In addition, both integration strategies yielded a high mean fluorescence intensity (MFI) per edited cell (Figure 1G). Given the high cleavage and integration frequency, as well as the favorable off-target profile of sg7, we proceeded with further testing in primary WT HSPCs using the intron 1 integration strategy.
Integration at HBB drives erythroid-specific expression of transgenes
A key goal of this work is to achieve erythroid-specific expression of an α-globin transgene. To test whether the HBB intron 1 integration strategy is able to achieve this, we designed custom promoterless integration cassettes that included either the full-length HBA1 or HBA2 transgene (i.e., including all UTRs, exons, and introns) linked to a 2A cleavage peptide derived from Thosea asigna virus (T2A)-yellow fluorescent protein (YFP) reporter to allow quantification of HDR frequency by flow cytometry and to serve as a surrogate for α-globin protein production (Figure 2A). Because the specific UTRs flanking an integrated transgene can have a great bearing on expression,8 we also designed integration strategies that would allow our HBA transgene to be flanked by HBB, HBA1, and HBA2 5′ and 3′ UTRs. Importantly, the left homology arm does not contain the HBB 5′ UTR, resulting in integrations with only a single 5′ UTR corresponding to HBB, HBA1, or HBA2 for each respective vector.
Figure 2. Integration at HBB drives erythroid-specific expression of transgenes.
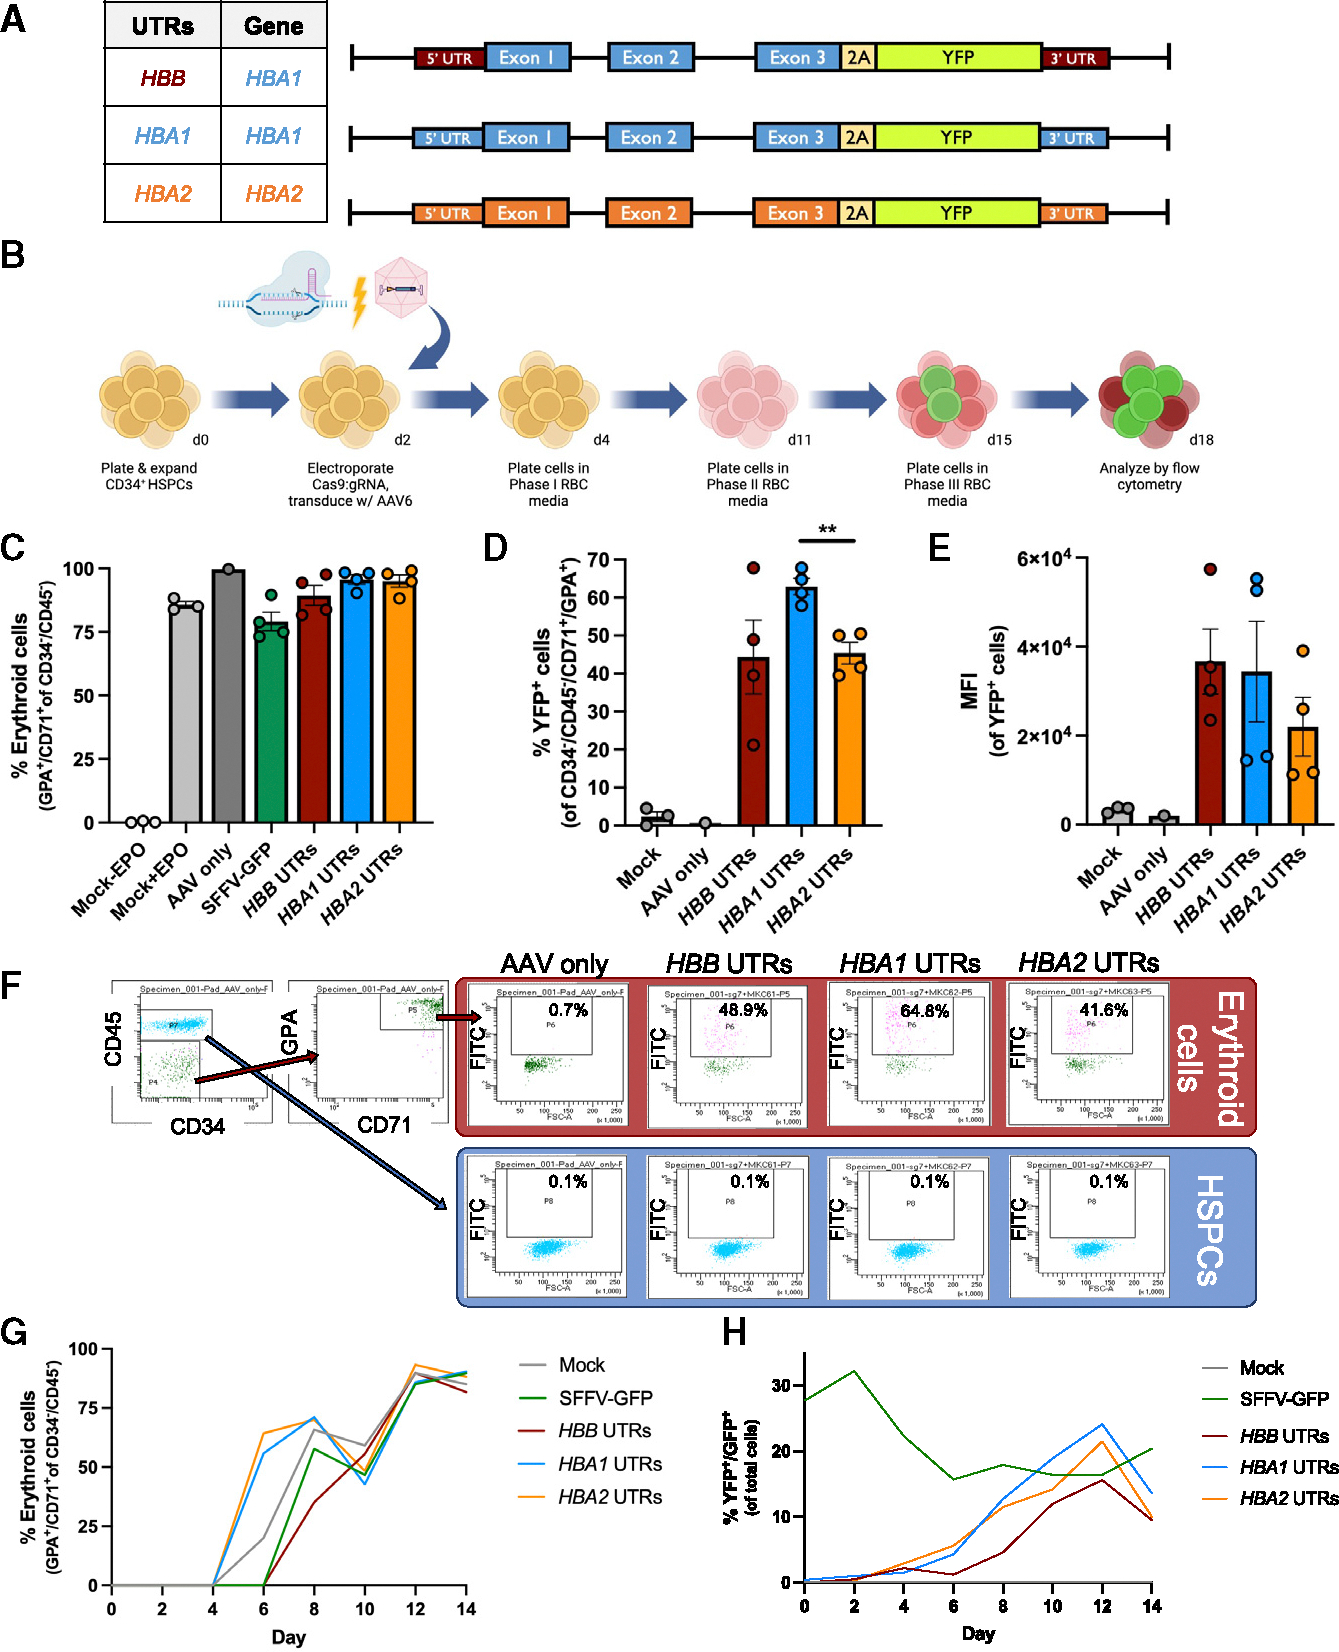
(A) Schematic of custom AAV6 DNA repair donors designed to integrate promoterless HBA-2A-YFP transgenes at the start codon of HBB. The table to the left indicates whether cassette integrated HBB, HBA1, or HBA2 UTRs, as well as HBA1 or HBA2 transgene.
(B) Schematic of Cas9/AAV6 genome editing workflow in primary HSPCs followed by in vitro erythroid differentiation.
(C) Percentage of CD34−/CD45− HSPCs acquiring erythroid cell surface markers GPA and CD71 as determined by flow cytometry. Bars represent mean ± SEM.
(D) Percentage of YFP+ cells among CD34−/CD45−/CD71+/GPA+ cells was determined at day 14 of erythroid differentiation using flow cytometry. Bars represent mean ± SEM. **p < 0.005 by unpaired two-tailed t test.
(E) MFI of YFP+ cells (from D) was determined by flow cytometry. Bars represent mean ± SEM.
(F) At day 11 of erythroid cell differentiation, cells were stained for HSPC/erythroid markers and analyzed by flow cytometry. The percentage of YFP+ cells are noted (n = 1).
(G) The percentage of CD34−/CD45− cells that acquired CD71 and GPA erythroid cell markers are plotted over the course of erythroid differentiation (n = 1).
(H) The percentage of YFP+ or GFP+ cells are plotted over the course of erythroid differentiation (n = 1).
To determine whether integration of these promoterless α-globin cassettes at HBB yielded erythroid-specific expression, we edited WT HSPCs using electroporation-mediated delivery of Cas9 protein:sg7 gRNA ribonucleoprotein (RNP) followed by transduction with AAV6 vectors containing each repair template. We then performed an established, 14-day erythroid differentiation protocol22 and quantified YFP expression and erythroid differentiation (staining with antibodies for CD34, CD45, CD71, and GPA) via flow cytometry (Figures 2B and S2B). We examined the percentage of CD34−/CD45− cells that acquired the erythroid cell surface markers GPA and CD71 on day 14 of erythroid differentiation, when erythroid cells are expected to be at their most mature stage. Our results demonstrated efficient acquisition of erythroid markers across all experimental conditions, with the exception of unedited (mock) cells cultured in the absence of EPO (Figure 2C). However, we did observe differences among the integration vectors in terms of HDR frequency and MFI of edited cells. We found that the vector integrating the HBA1 transgene and HBA1 UTRs achieved the most highly HDR-edited population of erythroid cells (median of 63% YFP+ cells; Figure 2D) and the second highest MFI of the HDR-edited cell population (Figure 2E), although these changes did not reach statistical significance. As confirmation that these integration strategies achieved erythroid-specific transgene expression, we observed high YFP fluorescence in cells that acquired erythroid cell markers (CD71+/GPA+) toward the end of erythroid differentiation in all editing conditions but no fluorescence above background in cells retaining HSPC markers (CD34+/CD45+) (Figure 2F). We also tracked differentiation and YFP expression kinetics and found that all editing conditions proceed through erythroid differentiation at a similar rate (Figure 2G). When monitoring the expression of fluorescent reporters, we find that cells edited with the constitutive SFFV-GFP integration vector maintain high expression over the course of erythroid differentiation, whereas all three conditions edited with HBA-2A-YFP constructs display increasing fluorescence that dovetails with erythroid differentiation (Figure 2H). Collectively, these results indicate that integration of the HBA transgene at HBB achieves high levels of erythroid-specific transgene expression.
α-Globin integration in αTM HSPCs yields low levels of hemoglobin
While T2A-YFP reporters allow rapid readout of HDR-editing frequency, to generate clinically relevant constructs, we created HBA1 integration vectors without T2A-YFP that were flanked by either HBB or HBA1 UTRs (Figure 3A). To test these additional vectors, we edited WT HSPCs as before and found that both vectors mediate high frequencies of HDR (median of 36.6% and 42.3% HDR-edited alleles for HBB and HBA1 UTR vectors, respectively), as measured by a custom droplet digital PCR (ddPCR) assay (Figure 3B).
Figure 3. α-Globin integration in αTM HSPCs yields low levels of hemoglobin.

(A) Schematic of custom AAV6 DNA repair donors designed to integrate promoterless HBA transgenes at the start codon of HBB. Table to the left indicates whether the cassette integrated HBB or HBA1 UTRs along with HBA1 transgene.
(B) The percentage of edited alleles in WT HSPCs at day 14 of erythroid differentiation. Bars represent mean ± SEM.
(C) Percentage of CD34−/CD45− αTM HSPCs acquiring erythroid cell surface markers as determined by flow cytometry. Bars represent mean ± SEM.
(D) The percentage of edited alleles in αTM HSPCs at day 14 of erythroid differentiation. Bars represent mean ± SEM.
(E) HPLC elution chromatogram displaying the hemoglobin tetramer profile from WT healthy control HSPCs following in vitro erythroid differentiation. Time displayed on the x axis represents retention time in minutes for each hemoglobin tetramer type to elute. Absorbance on the y axis indicates the concentration of a particular hemoglobin tetramer.
(F–H) HPLC elution chromatograms displaying the hemoglobin tetramer profile from αTM HSPCs that have undergone editing and erythroid differentiation. Chromatograms represent two different donors (F and G) and a technical replicate from donor 2 (H) that was edited independently.
We next sought to determine whether α-globin integration can restore hemoglobin tetramer production in patient-derived HSPCs following erythroid differentiation. We isolated CD34+ HSPCs from a bone marrow aspirate that was taken from a ~1-year-old patient with αTM. Clinical information regarding αTM donors, including information regarding genotype and age of the patient at the time of bone marrow aspirate are provided in Table S2. We then edited and differentiated HSPCs as before and found that all conditions were able to effectively acquire erythroid markers by day 14 of erythroid differentiation (Figure 3C). Following ddPCR analysis, we found that cells were edited at a median of 25.8% and 20.1% HDR-edited alleles for HBB and HBA1 UTR vectors, respectively (Figure 3D). We then performed hemoglobin tetramer high-performance liquid chromatography (HPLC) analysis on edited patient-derived αTM cells at the end of erythroid differentiation and found that edited cells displayed a modest increase in all three α-containing hemoglobins (fetal hemoglobin [HbF], adult hemoglobin [HbA], and hemoglobin A2 [HbA2]) compared to WT umbilical cord blood-derived cells (Figures 3E–3H and S3A). While these results demonstrate for the first time that gene therapy or genome editing may be used to increase α-globin production in αTM patient-derived erythroid cells, it is unlikely that this low level of α-globin production will yield significant clinical benefit.
Dual integration of α-globin and tEPOR in αTM HSPCs increases hemoglobin production
Given that α-globin integration into HBB does not substantially restore hemoglobin production, we sought alternative strategies to increase the therapeutic potential of this approach. As described in a cohort that included an Olympic gold medal-winning cross-country skier,23 a premature stop codon in the EPO receptor (EPOR) was linked with a condition called congenital erythrocytosis, which is characterized by non-pathogenic hyper-production of red blood cells (RBCs). In subsequent work,11 we demonstrated that genome editing-mediated integration of a truncated EPOR (tEPOR)-coding cDNA could increase erythropoietic output from primary human HSPCs. Thus, we hypothesized that co-expression of tEPOR cDNA from our α-globin integration cassette could lend a selective advantage to genome-edited and, therefore, α-globin-expressing erythroid cells. To test this, we added a tEPOR cDNA at the C terminus of the α-globin integration cassette with HBA1 UTRs, with expression linked by an internal ribosome entry site (Figure 4A). The tEPOR variant used is W439X, which was reported in the original publication.23 We then performed editing via HDR in WT HSPCs with our HBA1-UTRs α-globin cassette from Figure 3 and compared it against the bicistronic HBA+tEPOR cassette in WT HSPCs. Sanger sequencing of the HBA+tEPOR vector in edited cells at the 5′ and 3′ ends confirmed correct integration and the absence of inverted terminal repeats from the AAV vector (Figure S1B). In both instances, edited cells efficiently acquired erythroid markers by day 14 of erythroid differentiation (Figure 4B) and maintained viability comparable to that of unedited cells cultured with EPO (Figure S1C). While cells edited with the HBA integration cassette maintained a constant editing rate (median of 39.2% edited alleles at day 0 and 38.4% at day 14), HDR frequencies increased significantly over the course of erythroid differentiation in cells edited with the HBA+tEPOR cassette, rising from a median of 29.3% edited alleles at day 0 to 69.9% at day 14 (***p = 0.0004) (Figure 4C). In addition to the increase in editing frequencies, cell counts at the end of erythroid differentiation increased as well (Figure S1D). As in prior work, this suggests that cells expressing a tEPOR have a significant competitive advantage over unedited cells during erythroid differentiation. We next tested these vectors in αTM patient-derived HSPCs and again observed that edited and unedited cells effectively acquired erythroid markers, as assessed by flow cytometry on day 14 of erythroid culture (Figure 4D). As with WT cells, we found that HDR-editing frequencies among cells edited with the HBA vector maintained a consistent editing rate over the course of erythroid differentiation (Figure 4E). However, we again observed a dramatic increase in HDR frequencies in cells edited with the HBA+tEPOR cassette, rising from a median of 40.5% HDR-edited alleles at day 4 to 60.5% at day 14 (*p = 0.02). Similar to the increase in cell counts observed in WT HSPCs, we also observed a 2-fold increase in cell counts at the end of erythroid differentiation in conditions edited with the HBA+tEPOR cassette compared to cells edited with the α-globin vector (**p = 0.007) (Figure 4F), indicating that tEPOR expression is driving increased erythropoietic output from genome-edited HSPCs.
Figure 4. Dual integration of α-globin and tEPOR in αTM HSPCs increases hemoglobin production.

(A) Schematic of custom AAV6 donors designed to integrate promoterless HBA and HBA+tEPOR transgenes at the start codon of HBB. Both vectors are flanked by HBA1 UTRs.
(B) The percentage of CD34−/CD45− WT HSPCs acquiring erythroid cell surface markers as determined by flow cytometry. Bars represent mean ± SEM.
(C) The percentage of edited alleles in WT HSPCs over the course of erythroid differentiation. Bars represent mean ± SEM. *p = 0.01 comparing editing frequencies of HBA-edited cells at day 14 vs. HBA+tEPOR-edited cells at day 14 of differentiation by unpaired two-tailed t test; ***p = 0.0004 comparing editing frequencies of HBA+tEPOR-edited cells at day 0 vs. day 14 of differentiation by unpaired two-tailed t test.
(D) The percentage of CD34−/CD45− αTM HSPCs acquiring GPA and CD71 as determined by flow cytometry. Bars represent mean ± SEM.
(E) The percentage of edited alleles in αTM HSPCs over the course of erythroid differentiation. Bars represent mean ± SEM. *p = 0.02 comparing editing frequencies of HBA+tEPOR-edited cells at day 0 vs. day 14 of differentiation by unpaired two-tailed t test; **p = 0.009 comparing editing frequencies of HBA-edited cells at day 14 vs. HBA+tEPOR-edited cells at day 14 of differentiation by unpaired two-tailed t test.
(F) Cell count at day 14 of erythroid cell differentiation with fold change normalized to HBA. Bars represent mean ± SEM. **p = 0.007 by unpaired two-tailed t test.
(G–I) Hemoglobin tetramer HPLC plots from two different donors (G and H) and a technical replicate from donor 2 (I) that was edited independently. For comparison purposes, the HPLC plots for HBA-edited cells, originally shown in Figures 3F–3H, are also presented here.
(J) Western blot of mock and edited αTM HSPCs at the end of erythroid cell differentiation compared to WT umbilical cord blood-derived erythroid cells. The western blot image was taken from a single gel that was cropped to place the WT control next to edited conditions, as indicated by the black line. Loading was standardized by using the same number of cells for input.
(K) Ratio of α-globin to dimeric β-globin quantification from western blot. Bars represent mean ± SEM.
To further characterize cells edited with our two clinical editing strategies, HBA and HBA+tEPOR, we performed deeper characterization and morphological analysis of edited HSPCs at the end of erythroid differentiation. Staining for CD36, a marker of early erythroid differentiation, revealed no difference between unedited cells compared to those edited with the HBA vector (Figures S4A and S4B). However, we did observe a significant increase in the proportion of CD36+ cells in the HBA+tEPOR editing condition. We also stained cells with DRAQ5, a marker of enucleated erythrocytes, which revealed that our in vitro differentiation is able to achieve terminal differentiation of mature erythroid cells (Figures S4C and S4D). We did find that the proportion of enucleated cells was significantly lower among HBA+tEPOR-edited cells compared to unedited and HBA-edited cells. However, when considering the total cell counts, since cell counts were significantly increased among HBA+tEPOR-edited conditions (Figure S4E), we do not observe a significant decrease in the total number of enucleated cells within this condition. These data indicate that tEPOR is leading to increased proliferation among early erythroid progenitors (indicated by an increased proportion of CD36+ cells and decreased proportion of DRAQ5− enucleated cells), without impeding terminal maturation as the total numbers of enucleated cells are comparable to numbers yielded by unedited and HBA-edited conditions. No discernible differences in cell morphology were observed by cresyl blue staining among the HBA-edited and HBA+tEPOR-edited cells compared to unedited cells cultured with EPO, indicating that the vast majority of cells in all conditions had reached terminal differentiation, becoming either normoblasts, reticulocytes, or enucleated erythrocytes (Figures S5A and S5B).
To determine whether this strategy was able to restore α-globin production in the context of αTM, we performed hemoglobin tetramer HPLC on edited patient-derived HSPCs following erythroid differentiation. We found that the addition of tEPOR to the α-globin integration cassette dramatically increased the formation of hemoglobin tetramers, with a substantial increase in HbF, HbA, and HbA2 (Figures 4G–4I). Single globin chain HPLC confirmed that α-globin production was indeed elevated in HDR-edited samples (Figures S3B–S3D), likely driving the observed increases in hemoglobin tetramer formation. We next validated these results using western blot for α-globin and β-globin and found that not only do cells edited with HBA+tEPOR show a dramatic increase in α-globin compared to unedited and HBA-edited patient-derived erythroid cells but also that HBA+tEPOR-edited cells show a decrease in the formation of toxic β-globin dimers to nearly WT levels (Figures 4J, 4K, and S3E).
RNA sequencing demonstrates restoration of α-globin expression in αTM HSPCs
We next used RNA sequencing (RNA-seq) to reveal the transcriptional profile of αTM patient-derived HSPCs edited with α-globin as well as HBA+tEPOR integration cassettes in comparison to WT unedited HSPCs. Following editing and in vitro erythroid differentiation, total RNA was isolated from edited αTM patient cells as well as a healthy WT control. Bulk RNA-seq was then performed, followed by quality control and statistical analysis (Figures 5A and S6A–S6-E; STAR Methods). Total normalized read counts across samples ranged from 17.6 to 22.0 million and mapped to 17,776 unique genes. The high sequence similarity between HBA1 and HBA2 precluded clear differentiation; however, reads were exclusively assigned to one gene or another without overlap. For the EPOR gene, the alignment was unable to differentiate between the endogenous EPOR and our tEPOR transgene, leading to a combined set of reads from both. In analyzing the data, we observed consistent expression across erythroid-associated genes in both healthy control and patient-derived cells, which is expected given the efficient acquisition of erythroid cell surface markers in edited and unedited samples (Figure S6F). While the most highly expressed genes by WT erythroid cells are the adult globins (HBA1, HBA2, and HBB), unedited (mock) αTM erythroid cells expressed no detectable HBA1 or HBA2 (Figure 5B) as expected due to confirmation of four-gene α-globin deletion in this patient. When investigating the genes with the greatest rank change between WT erythroid cells compared to αTM erythroid cells, it is unsurprising that the top genes are HBA1 and HBA2 (Figure 5C). Despite the modest increase in α-globin production by α-globin integration alone according to HPLC, we observed substantial restoration of HBA1 and HBA2 expression compared to mock (HBA1 and HBA2 rising from undetectable in αTM mock to the 99.9th and 71.7th percentiles of expressed genes by rank order, respectively) (Figure 5B). Comparing HBA-edited αTM cells to mock, we found that HBA1 is the gene that displays the greatest rank change (Figure 5C). Predictably, this restoration of α-globin gene expression was further amplified in cells edited with the dual HBA+tEPOR vector, with HBA1 and HBA2 expression increasing to the 98.9th and 99.9th percentiles, respectively (Figure 5B). Because this editing strategy places tEPOR under the strong, erythroid-specific HBB promoter, we also found that EPOR expression was elevated compared to all other conditions. These elevated expression levels are confirmed by the fact that HBA1, HBA2, and EPOR are among the top four genes with the greatest rank change over unedited αTM cells (Figure 5C).
Figure 5. RNA sequencing of edited αTM HSPCs demonstrates restoration of α-globin gene expression and oxygen transport and iron ion metabolic processes.

(A) Schematic of bulk RNA sequencing workflow.
(B) Normalized reads across all samples displayed, with specific genes HBA1, HBA2, HBB, and EPOR highlighted. A count of “0.1” was assigned to HBA1 and HBA2 for display purposes, although they had 0 detectable reads.
(C) Table displaying top five genes with the greatest rank change comparing WT and edited αTM cells to mock αTM cells.
(D) Normalized read counts for all genes across editing conditions; displayed with fetal and embryonic globin genes (HBG1, HBG2, HBE1, and HBZ) highlighted.
(E) Table displaying top five genes with the greatest rank change comparing mock and edited αTM cells to WT.
(F) Heatmap of false discovery rate (FDR) q values across nine commonly enriched GO processes across conditions. Input for GO analysis was the top 0.001% most highly expressed genes within each condition.
(G–I) Bubble plots depicting enriched GO processes across treatment comparisons; y axis displays significance by −log10(FDR q value) and x axis displays enrichment score. Bubble color pertains to GO process and bubble size pertains to number of genes represented in the respective GO process. Input for GO analysis was the top 0.001% of genes showing greatest rank change for each comparison.
In addition, we found that γ-globin genes (HBG1 and HBG2) were more highly expressed in all αTM samples, regardless of editing, compared to the WT control (Figure 5D). This was expected as the αTM HSPCs were derived from an ~1-year-old patient, whereas the WT HSPCs were derived from an adult donor. Although ζ-globin (HBZ) is normally expressed only during the first 3 months of gestation, we found that this gene was highly elevated in all αTM cells (among the eight most highly expressed genes) compared to WT cells (Figure 5D). z-Globin was also the gene with the greatest rank change in expression in all αTM conditions compared to WT control cells (Figure 5E).
To identify large-scale changes in biological processes, Gene Ontology (GO) enrichment analysis was performed across the top 0.001% (18) most highly expressed genes across all samples. Compared to unedited mock αTM cells, HBA-edited cells displayed an enrichment of various iron ion-associated pathways to levels equivalent to the WT control (Figure 5F; STAR Methods). Further improvements were observed in αTM cells edited with the dual HBA+tEPOR integration strategy, showing enrichment of oxygen and gas transport as well as hydrogen peroxide (H2O2)-associated pathways to levels observed in the WT control (Figure 5F). In addition to assessing GO enrichment on the most highly expressed genes within a given sample, we also performed this analysis on the top 0.001% of genes with the greatest rank change across samples. Unsurprisingly, we found that gas transport and gas metabolism were the most significantly enriched pathways when comparing WT to unedited αTM cells (Figure 5G). When performing the opposite comparison, for genes with the greatest rank change in unedited αTM vs. WT cells, we found that the most significantly enriched pathways corresponded to the incorrect/unfolded protein response (Figure 5H), likely representing the cellular response to the formation of toxic β-globin aggregates in the absence of α-globin. Interestingly, when comparing HBA+tEPOR-edited αTM cells to WT cells, we saw no significantly enriched GO pathways, indicating that this editing strategy yielded cells that were not appreciably different from erythroid cells derived from a healthy donor. Along with our western blot data (Figure 4J), these findings suggest that while unedited αTM cells have highly elevated β-globin dimers, even a modest increase in α-globin is able to mitigate the unfolded protein response that occurs in the context of αTM pathology. As with WT cells, we found no significantly upregulated GO pathways when comparing HBA-edited αTM cells to unedited αTM cells. However, when comparing HBA+tEPOR-edited cells to unedited αTM cells, we found a number of upregulated GO pathways, the most significantly enriched being associated with cytokine-mediated signaling (likely a result of elevated EPOR signaling) and H2O2 catabolism (Figure 5I).
Transplantation of edited HSPCs into NBSGW mice demonstrates engraftment and multilineage reconstitution
To determine the long-term impact of our editing strategy on the ability of edited HSPCs to engraft and recapitulate various lymphoid and myeloid lineages, we performed xenotransplantation experiments in immunodeficient NBSGW mice. Due to the limited availability of donor bone marrow, we performed editing and transplantation experiments in WT human HSPCs, obtained commercially from a healthy donor. At 16 weeks post-transplantation, we harvested bone marrow and determined engraftment and edited allele frequencies by flow cytometry and ddPCR, respectively (Figures 6A and S2C). We found that WT HSPCs edited with our clinical vectors were capable of engraftment and multilineage reconstitution in CD19+ lymphoid and CD33+ myeloid subpopulations (Figures 6B–6D). While all treatment groups were able to engraft into the bone marrow, we observed lower engraftment among HBA+tEPOR-edited HSPCs, although this trend did not reach statistical significance. However, this could indicate a limitation of our approach that requires further investigation prior to clinical translation. We next used ddPCR to quantify the percentage of edited alleles within our bulk population of edited HSPCs, which was consistent across all editing conditions pre-transplant (24.8% GFP-control, 30.2% HBA, and 25.9% HBA+tEPOR) and in engrafted HSPCs post-transplant (8.8%, 6.1%, and 9.1%, respectively) (Figure 6E).
Figure 6. Engraftment of edited αTM HSPCs into NBSGW mice.

(A) Schematic of editing, xenotransplantation, and mouse harvest workflow. n = 7 for GFP-control group, n = 6 for HBA-edited group, and n = 7 for HBA+tEPOR-edited group.
(B) The percentages of hHLA+ cells that were mCD45+ and hCD45+ among mTer119− cells. Bars represent median ± interquartile range.
(C) The percentages of hCD19+ cells of hHLA+ cells. Bars represent median ± interquartile range.
(D) The percentages of hCD33+ cells of hHLA+ cells. Bars represent median ± interquartile range.
(E) Edited allele frequency determined by ddPCR among engrafted HSPCs. Bars represent median ± interquartile range.
DISCUSSION
Given the increasing global burden of αTM and the tremendous cost of disease management for patients and health care systems, there is an urgent need for curative treatments for this disease. To our knowledge, these results demonstrate for the first time that gene therapy or genome editing may be used to restore hemoglobin production to αTM patient-derived erythroid cells. This approach addresses the two major elements contributing to molecular pathology of the disease in a single genome editing event: successfully increasing α-globin production and reducing the formation of toxic β-globin dimers without noticeably disrupting β-globin production. While the cells in this work were derived from patients with four-gene deletion αTM, our editing strategy may also be effective in other transfusion-dependent phenotypes of α-thalassemia, such as in patients with inactivation of three α-globin genes or hemoglobin H disease.24
In addition to these protein-level changes, deeper analysis reveals several interesting findings at a transcriptional level. The enrichment of pathways associated with various oxidative pathways in HBA+tEPOR-edited cells suggests an improvement in the stability and function of edited erythroid cells. Most notably, H2O2 catabolism and metabolism has been identified as a critical process in preventing cellular injury in β-thalassemic erythrocytes,25 as the auto-oxidation of unpaired globin chains results in the generation and release of significant amounts of superoxide (O2−) and H2O2. These observations suggest that our genome editing strategy not only restores α-globin gene expression but also re-establishes essential antioxidant pathways that may be critical in addressing the pathophysiology of α-thalassemia.
Interestingly, while our genome editing approach using the HBA vector alone achieved an editing frequency of ~25% of alleles, it did not yield high levels of HbF or HbA production. Given this editing rate, it is unlikely that a high frequency of bi-allelic integration is occurring to account for the low amounts of hemoglobin production. This is because high frequencies of bi-allelic editing would be expected to yield a substantial HbF peak (as restored α-globin would pair with significant levels of γ-globin from this 1-year-old patient), which we do not observe in our HPLC data. Still, without comprehensive genotyping analysis, we cannot rule out the possibility that some bi-allelic editing is occurring. Nonetheless, we believe that the relatively low levels of HbF and HbA are more likely attributed to the complex regulatory landscape of the globin loci as crucial enhancer regions reside within the HBB introns.26 Consequently, integration of HBA1 with its introns at the HBB locus may not support high levels of transgene expression.
As a solution, we discovered that pairing the α-globin transgene with a naturally occurring EPOR variant substantially increased erythropoietic output of α-globin-expressing αTM patient-derived cells. While we observed significantly higher production of HbA tetramers from our HBA+tEPOR edited conditions, it is clear from our HPLC analysis that HbF-to-HbA switching is still underway. Because we are knocking our transgene cassette into the HBB locus that is only expressed later in development, we expect the results to be further amplified as hemoglobin switching is completed. This method has the potential to resolve clinical challenges previously encountered in HSCT for the hemoglobinopathies by lowering editing and engraftment frequencies needed to correct RBC disorders. In doing so, this strategy has the capacity to reduce or eliminate the need for high-morbidity myeloablation currently required to clear the bone marrow niche, which stands as a major barrier to safe and effective HSCT. Moreover, as patients with severe anemia, such as those with αTM, have increased levels of circulating erythropoietin,27 a tEPOR-based genome editing strategy may be especially potent in this context.
Finally, we believe this work stands as a compelling proof of concept. However, before this editing strategy is ready for translation into patients, further preclinical studies are needed. This may be difficult due to the limited availability of αTM patient HSPCs, given the historical prenatal lethality of the disorder as well as the inability of existing mouse models to effectively model human erythropoiesis in vivo. To circumvent this, we performed transplantation experiments of edited WT HSPCs into NBSGW mice to evaluate the impact of our editing strategy on long-term engraftment and multilineage cell reconstitution of edited cells. While cells from all editing conditions persisted, we observed lower engraftment in HBA+tEPOR-edited cells, although this trend did not reach statistical significance. This reduced engraftment may be attributed to elements of the editing process itself, such as variations in the purity or titer of separately prepared AAV vectors. Future clinical adoption of this editing approach will depend on expanded animal model studies and further investigation to elucidate the precise mechanisms impacting the engraftment of edited cells.
In summary, we present the results of a comprehensive genome editing approach for the treatment of α-thalassemia that restores α-globin production, reduces the formation of toxic unpaired β-globin aggregates, and restores the transcriptional profile akin to that of healthy erythroid cells. Thus, we believe these findings support the development of a definitive ex vivo autologous genome editing strategy that may be curative for patients with α-thalassemia.
Limitations of the study
This work defines a potentially curative universal genome editing strategy for the treatment of αTM, regardless of the deletions or mutations responsible for the disorder. However, several limitations exist that would need to be addressed before this strategy is ready for clinical translation. For instance, we observed differences in erythroid development in our editing condition that incorporated a tEPOR transgene. While this is a naturally occurring variant, expression from a strong globin promoter departs native regulation and could lead to an abnormal erythroid phenotype. We also observed lower engraftment frequencies among HSPCs edited with the HBA+tEPOR cassette, which could be due to negative effects of Cas9-mediated DNA double-strand breaks, transduction with AAV vectors, and/or tEPOR expression. Future experiments will need to more deeply characterize function of HBA+tEPOR-edited HSPCs, and better understand their behavior in vivo. More broadly, there are concerns about the time- and cost-intensive nature of ex vivo genome editing. In vivo genome editing emerges as a potentially scalable and accessible solution, however, editing HSPCs in vivo at frequencies required to correct the hemoglobinopathies remains challenging. Future work is needed to improve delivery and expression of genome editing machinery to HSPCs in vivo, which may one day enable adaptation of potentially curative ex vivo editing strategies to edit HSPCs directly where they reside in the bone marrow.
STAR★METHODS
RESOURCE AVAILABILITY
Lead contact
Further information and requests for resources and reagents should be directed to and will be fulfilled by the lead contact, Kyle Cromer (kyle.cromer@ucsf.edu).
Materials availability
Plasmids used to generate DNA repair templates packaged in AAV will be deposited with Addgene. No other unique reagents were generated during the course of this work.
Data and code availability
Data: RNA-seq data have been deposited in the NCBI Sequence Read Archive database (accession no. PRJNA1193132) and are publicly available as of the date of publication.
Code: no novel code was generated during the course of this work.
Other items: any additional information required to reanalyze the data reported in this paper is available from the lead contact upon request.
EXPERIMENTAL MODEL AND STUDY PARTICIPANT DETAILS
Healthy donor human primary HSPCs
HSPCs were isolated from healthy human donors either from umbilical cord blood (provided by Stanford Binns Program) or Plerixafor- and/or G-CSF-mobilized peripheral blood (AllCells, STEMCELL Technologies, and Fred Hutchinson Cancer Center Hematology Core). CD34+ HSPCs were isolated from umbilical cord blood using a EasySep Human CD34 Positive Selection Kit II according to the manufacturer’s protocol; mobilized peripheral blood HSPCs were purchased as CD34-enriched aliquots. All patients provided informed consent and samples were de-identified after collection. HSPCs derived from both male and female donors were included in this study with no exclusion criteria applied regarding ethnicity.
αTM donor human primary HSPCs
Bone marrow aspirates were taken from patients with αTM (Table S2) under protocol no. 16–21157, which was approved by the NHLBI Institutional Review Board. CD34+ HSPCs were isolated using a EasySep Human CD34 Positive Selection Kit II according to the manufacturer’s protocol. Patients provided informed consent and samples were de-identified after collection. HSPCs derived from both male and female donors were included in this study with no exclusion criteria applied regarding ethnicity.
NBSGW mice
Immuno-deficient NBSGW mice (strain # 026622, The Jackson Laboratory) were used for xenotransplantation experiments. Only female mice were used in order to determine differences in engraftment frequencies among editing conditions and to limit influences of sex in these experiments.
METHOD DETAILS
In vitro culture of primary HSPCs
CD34+ HSPCs were cultured at 105 cells/mL in StemSpan SFEM II Medium supplemented with 100 ng/mL SCF, 100 ng/mL TPO, 100 ng/mL FLT3L, 100 ng/mL IL6, 20 mg/mL streptomycin, and 20 U/mL penicillin/streptomycin; 35nM UM171 was included in HSPC culture media during ex vivo culture of cells prior to mouse transplantation experiments. Incubator conditions were 37°C, 5% CO2, and 5% O2.
Genome editing of HSPCs
Cas9 protein was purchased from Integrated DNA Technologies or Aldevron. Preceding electroporation, ribonucleoproteins (RNPs) were complexed with guide RNAs (gRNAs) at a Cas9:gRNA molar ratio of 1:2.5 (6 μg Cas9:3.2 μg gRNA per electroporation) at 25°C for 10–20mins. HSPCs were then resuspended in Lonza P3 buffer with Cas9 RNPs and subsequently electroporated using a Lonza 4D Nucleofector (program DZ-100). Electroporated cells were then plated at 105 cells/mL in HSPC media and AAV6 was added at 5×10³ vector genomes/cell based on titers determined by droplet digital PCR (ddPCR). The small molecule AZD-7648 was also added to cells to improve HDR frequencies as previously reported.28
In vitro differentiation of HSPCs into erythrocytes
2–3d post-editing, HSPCs were transitioned into StemSpan SFEM II Medium supplemented with 100 U/mL penicillin–streptomycin, 10 ng/mL SCF, 1 ng/mL IL3, 3U/mL EPO, 200 μg/mL transferrin, 3% antibody serum, 2% human plasma, 10 μg/mL insulin, and 3 U/mL heparin and maintained at 105 cells/mL. At d7 of culture, cells were transitioned to the above media without IL3 and maintained at 105 cells/mL. At d11, cells were transitioned to the above media without IL3 and with transferrin increased to 1 mg/mL and maintained at 106 cells/mL.
HUDEP-2 cell culture and nucleofection
HUDEP-2 cells were grown in StemSpan SFEM Medium supplemented with 50 ng/mL SCF, 3U/mL EPO, 10−6M DMSO, 1 μg/mL doxycycline, 1× penicillin/streptomycin, and L-glutamine. Cells were maintained at a concentration of 5×10⁵ cells/mL. Cells were transfected with 100pmol of Cas9 RNPs by nucleofection using a Neon Transfection System. 105 cells were resuspended in nucleofection buffer T (Neon Transfection Kit) and given one pulse of 1100V for 20ms. Cells were harvested 72h after nucleofection for downstream experiments. Synthetic chemically modified gRNAs used to edit HSPCs were purchased from Synthego and purified by HPLC. Modifications include 2′-O-methyl-3′-phosphorothioate at the three terminal nucleotides of the 5′ and 3′ ends described previously.29
Indel frequency analysis by ICE
HUDEP-2 cells were washed with PBS and DNA extracted using QuickExtract DNA extraction solution (LGC Biosearch Technologies) following the manufacturer’s instructions. To quantify genome editing outcomes, a PCR was performed across the HBB gene spanning the gRNA cut sites. Amplicons were Sanger sequenced and indels quantified using ICE software.17
Genome editing analysis by flow cytometry
5d post-editing with fluorescent reporter vectors (Figures 1D–1G), CD34+ HSPCs were harvested and the percentage of edited cells was determined by flow cytometry. This analysis was performed using either the Accuri C6 flow cytometer and software (v.9.4.11) or the FACS Aria II cytometer and FACS Diva software (v.8.0.3). The data were subsequently analyzed using FlowJo (v.10.6.1).
Editing analysis by ddPCR
Genome-edited HSPCs were harvested within 2d-4d post-electroporation and analyzed for modification frequencies of the alleles of interest. Our custom ddPCR analysis utilized a two-probe set where one probe binds the WT sequence (WT) and another binds unedited reference (REF) sequence outside of DNA repair template homology arms but residing on the same BamHI-digested gDNA fragment. Quantification of WT alleles, rather than HDR alleles, was necessary due to the large amplicons that would be required for in-out PCR given the long (~900bp) homology arms of our DNA repair templates. To calculate allele frequencies, we divided the WT copies/μL by the REF copies/μL to yield frequency of unedited WT alleles. The inverse of our WT allele frequencies yielded our HDR editing frequencies. The following primers and probes were used in the ddPCR reaction.
HBB WT unedited alleles
Forward primer: 5′-ACGTGGATGAAGTTGGTGGT-3′
Reverse primer: 5′-CAGCATCAGGAGTGGACAGA-3′
Probe: 5′–6-FAM/AGAAACTGGGCATGTGGAGA/3IABkFQ-3′
HBB REF alleles
Forward primer: 5′-CGATCACGTTGGGAAGCTAT-3′
Reverse primer: 5′-GAGTGTCTGGGGGAACAAAA-3′
Probe: 5′–6-FAM/CTTTTCCCCTCCTACCCCTA/3IABkFQ-3′
AAV6 vector design, production, and purification
Adeno-associated virus, serotype 6 (AAV6) vector plasmids were cloned into the pAAV-MCS plasmid, comprised of inverted terminal repeats (ITRs) derived from AAV2. Gibson Assembly Mastermix (New England Biolabs, Ipswich, MA) was used for the creation of all DNA repair vectors according to manufacturer’s instructions. Once cloned, plasmids were transformed into Stable Competent E. coli (New England Biolabs) and amplified using Plasmid Plus Midi Kits (QIAGEN N.V., Hilden, Germany). AAV6 vector was produced with little variation as previously described.30 293T cells (ATCC, Manassas, VA) were seeded in five 15cm2 dishes with 1.3–1.5×10⁷ cells per plate 24h pre-transfection. Each dish was then transfected with 112μg polyethylenimine, 6μg ITR-containing plasmid, and 22μg pDGM6 (gift from David Russell, University of Washington), which expresses AAV6 cap, AAV2 rep, and Ad5 helper genes. Following a 48–72h incubation, cells were harvested, and vectors were purified using the Takara Bio AAVpro purification kit as per manufacturer’s instructions and stored at −80°C until further use. AAV6 vectors were titered using a Bio-Rad QX200 ddPCR machine and QuantaSoft software (v.1.7) to measure the number of vector genomes, as described previously.31
The length in base pairs of the exogenous fragments inserted into the AAV vector (not including homology arms) are:
HBB UTRs (with 2A YFP): 1,598bp.
HBA1 UTRs (with 2A-YFP): 1,643bp.
HBA2 UTRs (with 2A-YFP): 1,635bp.
HBB UTRs (without 2A-YFP): 827bp.
HBA1 UTRs (without 2A-YFP; “HBA”): 872bp
HBA+tEPOR: 2,776bp.
Immunophenotyping of differentiated erythroid cells
Differentiated erythroid cells were analyzed by flow cytometry for lineage-specific markers using a FACS Aria II. Edited and unedited cells were analyzed using the following antibodies: hCD45 V450 (HI30; BD Biosciences), CD34 APC (561; BioLegend), CD71 PE-Cy7 (OKT9; Affymetrix), and CD235a PE (GPA) (GA-R2; BD Biosciences). To measure viability, cells were also stained with Ghost Dye Red 780 (Tonbo Biosciences).
Hemoglobin tetramer analysis
Frozen pellets of approximately 106 cells in vitro-differentiated erythrocytes were thawed and lysed in 30μL of RIPA buffer with 1x Halt Protease Inhibitor Cocktail for 5mins on ice. The mixture was vigorously vortexed and cell debris were removed by centrifugation at 13,000 RPM for 10mins at 4°C. HPLC analysis of hemoglobins in their native form was performed on a cation-exchange PolyCAT A column (35 × 4.6mm2, 3μm, 1,500Å; PolyLC Inc.) using a PerkinElmer Flexar HPLC system at room temperature with detection at 415nm. Mobile phase A consisted of 20mM Bis-tris and 2mM KCN at pH 6.94, adjusted with HCl. Mobile phase B consisted of 20mM Bis-tris, 2mM KCN, and 200mM NaCl at pH 6.55. Hemolysate was diluted in buffer A prior to injection of 20μL onto the column with 8% buffer B and eluted at a flow rate of 2 mL/min with a gradient made to 40% B in 6mins, increased to 100% B in 1.5mins, and returned to 8% B in 1min, and re-equilibrated for 3.5mins. Quantification of the area under the curve of the peaks were performed with TotalChrom software and raw values were exported to GraphPad Prism (v.9) for plotting and further analysis.
Single globin chain analysis
Frozen pellets of approximately 106 cells in vitro-differentiated erythrocytes were thaw and lysed in 30μL of RIPA buffer with 1x Halt Protease Inhibitor Cocktail for 5mins on ice. The mixture was vigorously vortexed and cell debris were removed by centrifugation at 13,000 RPM for 10 mins at 4°C. Analysis of globin chains was performed by reverse-phase PerkinElmer Flexar HPLC system with a Vydac 214TP C4 column (250 × 4.6mm2, 5μm, 300Å; Avantor, Inc.) at 20°C and detection at 280nm. Mobile phase A consisted of 10% methanol made in acetonitrile and mobile B of 0.5% trifluoroacetic acid in water adjusted at pH 2.9 with NaOH. Hemolysate was diluted in B prior injection at a flow rate of 1 mL/min in 49% A for 2mins, followed by 2mins in 50% A, and a 20min gradient to 60% A. The column was then equilibrated to 49% A for 6mins. Quantification of the area under the curve of the peaks was performed with TotalChrom software and raw values were exported to GraphPad Prism (v.9) for plotting and further analysis.
Western blot to quantify globin protein
Samples were subjected to electrophoresis on 14% SDS-polyacrylamide gel electrophoresis under denaturing conditions. A WT umbilical cord blood-derived sample was included as a positive control. Following electrophoresis, proteins were transferred to polyvinylidene difluoride membranes and blocked for 1h at room temperature using TBS-Tween 20 (0.1%) containing 5% non-fat dry milk to prevent non-specific binding. The blocked membranes were then incubated with primary antibodies diluted in TBS-Tween 20 (0.1%) containing 1% non-fat dry milk. The antibodies used were mouse anti-human α-globin (sc-514378) and β-globin (sc-21757) (Santa Cruz Biotechnology). All primary antibodies were diluted at 1:1,000 and incubated with membranes for 4h at room temperature with gentle shaking. After primary antibody incubation, membranes were washed 3x with TBS-Tween 20 (0.1%) for 10mins each to remove any unbound primary antibodies. Membranes were then incubated with the secondary antibody, anti-mouse m-IgG1 (sc-525408), diluted 1:2,000 in TBS-Tween 20 (0.1%) containing 1% non-fat dry milk. This incubation lasted for 1h at room temperature with gentle shaking. Post-secondary antibody incubation, membranes were washed 3x with TBS-Tween 20 (0.1%) for 10mins each to remove any unbound secondary antibodies. Protein bands were visualized using a classic ECL detection system and chemiluminescent signal was captured on X-ray film. The intensity of the protein bands was quantified by Quantity One 1-D Analysis Software. β-globin dimers were detected using the previously referred to anti-β-globin antibody (sc-21757, Santa Cruz Biotechnology). β-globin monomers and dimers were detected based on the molecular weight of the band.
RNA-sequencing of edited erythroid cells
Total RNA was extracted from frozen pellets of approximately 106 cells in vitro-differentiated erythrocytes using RNeasy Plus Micro Kit according to the manufacturers’ instructions. Sequencing was provided by Novogene. Raw sequencing reads were analyzed with FastQC (https://www.bioinformatics.babraham.ac.uk/projects/fastqc) to ensure adequate data quality. Reads were mapped to the GRCh38.p14 human genome assembly using the pseudo-alignment tool Salmon (https://github.com/COMBINE-lab/salmon).32 After pseudo-alignment, transcript levels count estimates were collapsed to the gene level, and then transformed using a regular log transformation. Relative expression levels of genes of interest were compared using these normalized values.
Gene ontology enrichment analysis
Gene sets were submitted to the GOrilla gene ontology (GO) enrichment analysis tool (https://cbl-gorilla.cs.technion.ac.il/)33 for pathway analysis. GOrilla reports the FDR q-value of each GO term following Benjamini-Hochberg correction for multiple testing, and those GO processes with FDR ≤0.01 were considered to be highly significant. For heatmap generation, the top 0.001% most highly expressed genes were analyzed for enriched GO processes across all samples. To generate the bubble plot, the top 0.001% of genes with the greatest rank change in expression were identified in each comparison group, using mock or WT as the denominator. Enrichment is defined by GOrilla using the formula (b/n)/(B/N) where N is the total number of genes, B is the total number of genes associated with a specific GO term, n is the number of genes in the top of the target gene set, and b is the number of genes in the intersection. Values were exported to GraphPad Prism (v.9) for plotting and further analysis.
Mouse conditioning and transplant
Twenty 6–8week old female NBSGW mice (strain # 026622, The Jackson Laboratory) were conditioned with 10 mg/kg of Busulfan (B2635, Sigma Aldrich) 48h and 24h before engraftment with edited human CD34+ HSPCs. Busulfan was dissolved in 100% DMSO, then diluted 1:2 in PBS and kept at 37°C until injection. Immediately prior to injection, Busulfan was diluted once more at 1:10 in warm PBS to bring the DMSO concentration to 5%. 24h after the second Busulfan injection, 0.5×10⁶ HSPCs were injected retro-orbitally per mouse. Mice were then fed moist chow for the first 2d post-engraftment and closely monitored for the 2wks following engraftment. Mice were sacrificed 16wks after engraftment.
Bone marrow isolation and flow
Femurs and tibias were collected for bone marrow isolation. Bone marrow collection tubes were prepared by punching a hole at the bottom of a 0.5mL Eppendorf tube using an 18G needle and placed in a 1.5mL siliconized Eppendorf tube. 100μL of bone marrow harvest media (RPMI, 10% FBS ES, 33.3 U/mL DNase, 4 U/mL heparin) was added to the 1.5mL tube for collection. Epiphyses were removed from each side of the bone and the exposed shaft was placed in a prepared 0.5mL Eppendorf tube for each mouse. Bones were spun at 10,000 × g for 20–30s. Cells were immediately resuspended in 1mL of bone marrow harvest media and passed through a prewashed 30μM filter. The filter was then washed with 5mL of bone marrow harvest media. Samples were then spun at 500 × g for 5mins and supernatant removed. Cells were then resuspended in 2.5mL of bone marrow harvest media, followed by 2.5mL of dilution buffer (1x PBS, 2% FBS ES, 2mM EDTA) and spun at 500 × g for 5mins. The supernatant was removed, and cells were washed one final time in dilution buffer at 500 × g for 5mins. Cells were resuspended in dilution buffer for flow cytometry. 1×10⁶ cells/mouse were incubated with TruStain FcX Plus (anti-mouse CD16/32) for 10mins before staining. Without washing, the following antibodies were added and incubated in the dark at room temperature for 20mins: anti-mouse Cd45.1 PE-Cy7 (110730, BioLegend), anti-mouse TER-119 BUV395 (563827, BD Biosciences), anti-human HLA-ABC APC (555555, BD Biosciences), anti-human CD19 PE (555413, BD Biosciences), anti-human CD33 BV421 (562854, BD Biosciences), anti-human CD45 PerCP (368505, BioLegend), and anti-human CD235a Pacific Blue (306612, BioLegend). Samples were run on a 5-laser Cytek Aurora and data was analyzed using FlowJo version 10.10.0.
QUANTIFICATION AND STATISTICAL ANALYSIS
Throughout the study, when comparing two treatment groups we used unpaired two-tailed t-tests to determine p-values and assess statistical significance. P-values generated from these statistical tests are reported in Figures 1, 2, and 4. When comparing across multiple treatment groups, we used 2-way analysis of variance (ANOVA) for multiple comparisons to determine p-values and assess statistical significance. P-values generated from these statistical tests are reported in Figure S6. GraphPad Prism 9 software was used for all statistical analysis.
Supplementary Material
KEY RESOURCES TABLE.
| REAGENT or RESOURCE | SOURCE | IDENTIFIER |
|---|---|---|
|
| ||
| Antibodies | ||
|
| ||
| Human CD45 V450 | BD Biosciences | Clone HI30; RRID: AB_1645573 |
| Human CD34 APC | BioLegend | Clone 561; RRID: 343607 |
| Human CD71 PE-Cy7 | Invitrogen | Clone OKT9; RRID: AB_2573366 |
| Human CD235a (GPA) PE | BD Biosciences | Clone GA-R2; RRID: AB_395949 |
| Human CD36 APC | BioLegend | Clone 5-271; RRID: AB_1279224 |
| Mouse anti-human α-globin | Santa Cruz Biotechnology | Cat. sc-514378; RRID: AB_2716828 |
| Mouse anti-human β-globin | Santa Cruz Biotechnology | Cat. sc-21757; RRID: AB_627713 |
| Mouse anti-IgG1 | Santa Cruz Biotechnology | Cat. sc-525408; RRID: N/A |
| TruStain FcX Plus (anti-mouse CD16/32) | BioLegend | Clone S17011E; RRID: AB_2783137 |
| Mouse Cd45.1 PE-Cy7 | BioLegend | Clone A20; RRID: AB_1134170 |
| Mouse TER-119 BUV395 | BD Biosciences | Cat. 563827; RRID: AB_2738438 |
| Human HLA-ABC APC | BD Biosciences | Cat. 555555; RRID: AB_398603 |
| Human CD19 PE | BD Biosciences | Cat. 555413; RRID: AB_395813 |
| Human CD33 BV421 | BD Biosciences | Cat. 562854; RRID: AB_2737405 |
| Human CD45 PerCP | BioLegend | Cat. 368505; RRID: AB_400307 |
| Human CD235ab (GPA) Pacific Blue | BioLegend | Cat. 306612; RRID: AB_2248153 |
|
| ||
| Bacterial and virus strains | ||
|
| ||
| Stable Competent E. coli | New England Biolabs | C3040I |
| Adeno-associated virus, serotype 6 | Gift from David Russell | N/A |
|
| ||
| Biological samples | ||
|
| ||
| Heat-inactivated human serum | Sigma-Aldrich | H3667 |
| Human plasma | Innovative Research | IPLAWBCATNAC |
|
| ||
| Chemicals, peptides, and recombinant proteins | ||
|
| ||
| Human SCF | PeproTech | 300–07 |
| Human TPO | PeproTech | 300–18 |
| Human FLT3L | PeproTech | 300–19 |
| Human IL6 | PeproTech | 200–06 |
| Human IL3 | PeproTech | 200–03 |
| Human EPO | PeproTech | 100–64 |
| Human insulin | Sigma-Aldrich | 91077C |
| Human holo-transferrin | Sigma-Aldrich | T0665 |
| Heparin sodium salt | Sigma-Aldrich | H3393 |
| Dimethyl sulfoxide (DMSO) | Sigma-Aldrich | 67-68-5 |
| Phosphate buffered saline (PBS) | Thermo-Fisher Scientific | 10010001 |
| Doxycycline hyclate | Sigma-Aldrich | PHR1145 |
| Penicillin/streptomycin | Thermo-Fisher Scientific | 15140148 |
| L-glutamine | Thermo-Fisher Scientific | 35050061 |
| Polyethylenimine (PEI) | Polysciences | 23966 |
| KCN | Sigma-Aldrich | 207810 |
| NaCl | Sigma-Aldrich | 433209 |
| Bis-tris | Sigma-Aldrich | B9754 |
| NaOH | Sigma-Aldrich | 655104 |
| Trifluoroacetic acid | Sigma-Aldrich | 74564 |
| Busulfan | Sigma-Aldrich | B2635 |
| Ethylenediaminetetraacetic acid (EDTA) disodium salt dihydrate | Sigma-Aldrich | E4884 |
| UM171 | MedChemExpress | HY-12878 |
| HSPC base media | STEMCELL Technologies | 09655 |
| Cas9 protein | Aldevron, Integrated DNA Technologies | 9214, 1081059 |
| AZD-7648 | MedChemExpress | HY-111783 |
|
| ||
| Deposited data | ||
|
| ||
| RNA-sequencing data | NCBI Sequence Read Archive | PRJNA1193132 |
|
| ||
| Experimental models: Cell lines | ||
|
| ||
| HUDEP-2 cell line | RIKEN Institute | RCB4557 |
| 293T cell line | ATCC | CRL-3216 |
|
| ||
| Experimental models: Organisms/strains | ||
|
| ||
| Human CD34+-enriched HSPCs derived from Plerixafor and/or G-CSF-mobilized peripheral blood from healthy donors | STEMCELL Technologies, AllCells, Fred Hutchinson Cancer Center Hematology Core | 70073.2 |
| Human CD34+-enriched HSPCs derived from bone marrow aspirates from αTM donors | IRB Protocol | 16–21157 |
| NBSGW mice | The Jackson Laboratory | 026622 |
|
| ||
| Oligonucleotides | ||
|
| ||
| HBB gRNA sg1-22 | Synthego | Synthetic sgRNA |
| ddPCR primers & probes | Integrated DNA Technologies | Custom probe-based qPCR assays |
|
| ||
| Recombinant DNA | ||
|
| ||
| AAV6 DNA repair templates | Cloned in-house & purified using Takara Bio AAVpro Purification Kit | 6675 |
|
| ||
| Software and algorithms | ||
|
| ||
| HPLC analysis software | PerkinElmer | TotalChrom |
| Data visualization and statistical analysis software | GraphPad | Prism v.9 |
| Western blot analysis software | Bio-Rad | Quantity One 1-D |
| RNA-sequencing quality control software | Babraham Bioinformatics | FastQC |
| RNA-sequencing analysis software | Open source | Salmon |
| Flow cytometry visualization and analysis software | FlowJo | v10.10.0 |
| DNA sequence visualization software | SnapGene | V8.0 |
|
| ||
| Other | ||
|
| ||
| Human CD34+ selection kit | STEMCELL Technologies | 17856 |
| Electroporation kit | Lonza Bioscience | V4XP-3032 |
| Transfection kit | Invitrogen | MPK10096 |
| DNA extraction solution | LGC Biosearch Technologies | SS000035-D2 |
| Gibson assembly mix | New England Biolabs | E2611L |
| Deposited data | NCBI Sequence Read Archive | PRJNA1193132 |
Highlights.
Cas9/AAV6 genome editing effectively integrates α-globin gene into the β-globin locus
Genome editing restores hemoglobin production to α-thalassemia patient-derived HSPCs
Addition of hypermorphic EPO receptor enhances erythropoietic output of edited HSPCs
Edited HSPCs engraft long-term in xenotransplantation models
ACKNOWLEDGMENTS
The authors thank the following funding sources that made this work possible: S.N.C. was supported by the University of California, San Francisco NIH T32 Research Training in Transplant Surgery Fellowship; T.M. was supported by the California Institute for Regenerative Medicine Bridges Program; B.J.L. was supported by the National Science Foundation Graduate Research Fellowship Program; B.R.C. was supported by the National Institutes of Health (R01-AG072052, R01-HL130533, R01-HL13535801, and P01-HL146366), the California Institute for Regenerative Medicine (INFR6.2–15527), the Charcot-Marie-Tooth Association, and support through a gift from the Roddenberry Foundation and Pauline and Thomas Tusher; T.C.M. was supported by the UCSF Center for Maternal-Fetal Precision Medicine; M.K.C. was supported by the American Society of Gene & Cell Therapy Career Development Award; and T.C.M., M.H.P., and M.K.C. were supported by the National Institutes of Health (R01-HL161291). We thank Emma Canepa and Billie Lianoglou for their assistance with patient sample collection and our patients for their gracious participation in the research.
Footnotes
DECLARATION OF INTERESTS
B.R.C. is a founder and holds equity in Tenaya Therapeutics. T.C.M. is on the scientific advisory board of Acrigen and receives grant funding from Novartis, BioMarin, and Biogen. M.H.P. is a member of the scientific advisory board of Allogene Therapeutics, is on the Board of Directors of Graphite Bio, and has equity in CRISPR Therapeutics. B.W., T.C.M., M.H.P., and M.K.C. hold patents related to this work (WO/2023/060059 and WO/2021/022189).
DECLARATION OF GENERATIVE AI AND AI-ASSISTED TECHNOLOGIES IN THE WRITING PROCESS
During the preparation of this work, the authors used ChatGPT-4 by OpenAI and Claude Haiku by Anthropic PBC solely to improve language and readability. After using these tools, the authors reviewed and edited the content as needed and take full responsibility for the content of the publication.
SUPPLEMENTAL INFORMATION
Supplemental information can be found online at https://doi.org/10.1016/j.celrep.2024.115141.
REFERENCES
- 1.Vichinsky E (2010). Complexity of alpha thalassemia: growing health problem with new approaches to screening, diagnosis, and therapy. Ann. N. Y. Acad. Sci. 1202, 180–187. [DOI] [PubMed] [Google Scholar]
- 2.Piel FB, and Weatherall DJ (2014). The α-thalassemias. N. Engl. J. Med. 371, 1908–1916. [DOI] [PubMed] [Google Scholar]
- 3.Kreger EM, Singer ST, Witt RG, Sweeters N, Lianoglou B, Lal A, Mackenzie TC, and Vichinsky E (2016). Favorable outcomes after in utero transfusion in fetuses with alpha thalassemia major: a case series and review of the literature. Prenat. Diagn. 36, 1242–1249. [DOI] [PubMed] [Google Scholar]
- 4.Schwab ME, Lianoglou BR, Gano D, Gonzalez Velez J, Allen IE, Arvon R, Baschat A, Bianchi DW, Bitanga M, Bourguignon A, et al. (2023). The impact of in utero transfusions on perinatal outcomes in patients with alpha thalassemia major: The UCSF registry. Blood Adv. 7, 269–279. [DOI] [PMC free article] [PubMed] [Google Scholar]
- 5.Schrier SL, Centis F, Verneris M, Ma L, and Angelucci E (2003). The role of oxidant injury in the pathophysiology of human thalassemias. Redox Rep. 8, 241–245. [DOI] [PubMed] [Google Scholar]
- 6.Baird DC, Batten SH, and Sparks SK (2022). Alpha- and beta-thalassemia: Rapid evidence review. Am. Fam. Physician 105, 272–280. [PubMed] [Google Scholar]
- 7.Fleischhauer K, Locatelli F, Zecca M, Orofino MG, Giardini C, De Stefano P, Pession A, Iannone AM, Carcassi C, Zino E, and La Nasa G (2006). Graft rejection after unrelated donor hematopoietic stem cell transplantation for thalassemia is associated with nonpermissive HLA-DPB1 disparity in host-versus-graft direction. Blood 107, 2984–2992. [DOI] [PubMed] [Google Scholar]
- 8.Cromer MK, Camarena J, Martin RM, Lesch BJ, Vakulskas CA, Bode NM, Kurgan G, Collingwood MA, Rettig GR, Behlke MA, et al. (2021). Gene replacement of α-globin with β-globin restores hemoglobin balance in β-thalassemia-derived hematopoietic stem and progenitor cells. Nat. Med. 27, 677–687. [DOI] [PMC free article] [PubMed] [Google Scholar]
- 9.Thompson AA, Walters MC, Kwiatkowski J, Rasko JEJ, Ribeil JA, Hongeng S, Magrin E, Schiller GJ, Payen E, Semeraro M, et al. (2018). Gene therapy in patients with transfusion-dependent β-thalassemia. N. Engl. J. Med. 378, 1479–1493. [DOI] [PubMed] [Google Scholar]
- 10.Frangoul H, Altshuler D, Cappellini MD, Chen YS, Domm J, Eustace BK, Foell J, de la Fuente J, Grupp S, Handgretinger R, et al. (2021). CRISPR-Cas9 gene editing for sickle cell disease and β-thalassemia. N. Engl. J. Med. 384, 252–260. [DOI] [PubMed] [Google Scholar]
- 11.Luna SE, Camarena J, Hampton JP, Majeti KR, Charlesworth CT, Soupene E, Selvaraj S, Jia K, Sheehan VA, Cromer MK, and Porteus MH (2024). Enhancement of erythropoietic output by Cas9-mediated insertion of a natural variant in haematopoietic stem and progenitor cells. Nat. Biomed. Eng. 8(12):1540–1552. 10.1038/s41551-024-01222-6. [DOI] [PMC free article] [PubMed] [Google Scholar]
- 12.Chakraborty N, Bilgrami S, Maness L, Guo C, Perez-Diez A, Mukherji B, and Tutschka P (1999). Myeloablative chemotherapy with autologous peripheral blood stem cell transplantation for metastatic breast cancer: Immunologic consequences affecting clinical outcome. Bone Marrow Transplant. 24, 837–843. [DOI] [PubMed] [Google Scholar]
- 13.Bhatia S (2011). Long-term health impacts of hematopoietic stem cell transplantation inform recommendations for follow-up. Expert Rev. Hematol. 4, 437–454. [DOI] [PMC free article] [PubMed] [Google Scholar]
- 14.Inamoto Y, Shah NN, Savani BN, Shaw BE, Abraham AA, Ahmed IA, Akpek G, Atsuta Y, Baker KS, Basak GW, et al. (2015). Secondary solid cancer screening following hematopoietic cell transplantation. Bone Marrow Transplant. 50, 1013–1023. [DOI] [PMC free article] [PubMed] [Google Scholar]
- 15.Dever DP, Bak RO, Reinisch A, Camarena J, Washington G, Nicolas CE, Pavel-Dinu M, Saxena N, Wilkens AB, Mantri S, et al. (2016). CRISPR/Cas9 β-globin gene targeting in human haematopoietic stem cells. Nature 539, 384–389. [DOI] [PMC free article] [PubMed] [Google Scholar]
- 16.Kurita R, Suda N, Sudo K, Miharada K, Hiroyama T, Miyoshi H, Tani K, and Nakamura Y (2013). Establishment of immortalized human erythroid progenitor cell lines able to produce enucleated red blood cells. PLoS One 8, e59890. [DOI] [PMC free article] [PubMed] [Google Scholar]
- 17.Conant D, Hsiau T, Rossi N, Oki J, Maures T, Waite K, Yang J, Joshi S, Kelso R, Holden K, et al. (2022). Inference of CRISPR edits from Sanger trace data. CRISPR J. 5, 123–130. [DOI] [PubMed] [Google Scholar]
- 18.Brinkman EK, Chen T, Amendola M, and van Steensel B (2014). Easy quantitative assessment of genome editing by sequence trace decomposition. Nucleic Acids Res. 42, e168. [DOI] [PMC free article] [PubMed] [Google Scholar]
- 19.Cradick TJ, Qiu P, Lee CM, Fine EJ, and Bao G (2014). COSMID: A web-based tool for identifying and validating CRISPR/Cas off-target sites. Mol. Ther. Nucleic Acids 3, e214. [DOI] [PMC free article] [PubMed] [Google Scholar]
- 20.Cromer MK, Majeti KR, Rettig GR, Murugan K, Kurgan GL, Bode NM, Hampton JP, Vakulskas CA, Behlke MA, and Porteus MH (2023). Comparative analysis of CRISPR off-target discovery tools following ex vivo editing of CD34+ hematopoietic stem and progenitor cells. Mol. Ther. 31, 1074–1087. [DOI] [PMC free article] [PubMed] [Google Scholar]
- 21.Vakulskas CA, Dever DP, Rettig GR, Turk R, Jacobi AM, Collingwood MA, Bode NM, McNeill MS, Yan S, Camarena J, et al. (2018). A high-fidelity Cas9 mutant delivered as a ribonucleoprotein complex enables efficient gene editing in human hematopoietic stem and progenitor cells. Nat. Med. 24, 1216–1224. [DOI] [PMC free article] [PubMed] [Google Scholar]
- 22.Dulmovits BM, Appiah-Kubi AO, Papoin J, Hale J, He M, Al-Abed Y, Didier S, Gould M, Husain-Krautter S, Singh SA, et al. (2016). Pomalidomide reverses γ-globin silencing through the transcriptional reprogramming of adult hematopoietic progenitors. Blood 127, 1481–1492. [DOI] [PMC free article] [PubMed] [Google Scholar]
- 23.de la Chapelle A, Träskelin AL, and Juvonen E (1993). Truncated erythropoietin receptor causes dominantly inherited benign human erythrocytosis. Proc. Natl. Acad. Sci. USA 90, 4495–4499. [DOI] [PMC free article] [PubMed] [Google Scholar]
- 24.Vichinsky EP (2013). Clinical manifestations of α-thalassemia. Cold Spring Harb. Perspect. Med. 3, a011742. [DOI] [PMC free article] [PubMed] [Google Scholar]
- 25.Scott MD (2006). H2O2 injury in beta thalassemic erythrocytes: protective role of catalase and the prooxidant effects of GSH. Free Radic. Biol. Med. 40, 1264–1272. [DOI] [PubMed] [Google Scholar]
- 26.Bartman CR, Hsu SC, Hsiung CCS, Raj A, and Blobel GA (2016). Enhancer regulation of transcriptional bursting parameters revealed by forced chromatin looping. Mol. Cell 62, 237–247. [DOI] [PMC free article] [PubMed] [Google Scholar]
- 27.Nisxli G, Kavakli K, Aydinok Y, Oztop S, and Cetingül N (1997). Serum erythropoietin levels in patients with beta thalassemia major and intermedia. Pediatr. Hematol. Oncol. 14, 161–167. [DOI] [PubMed] [Google Scholar]
- 28.Selvaraj S, Feist WN, Viel S, Vaidyanathan S, Dudek AM, Gastou M, Rockwood SJ, Ekman FK, Oseghale AR, Xu L, et al. (2024). High-efficiency transgene integration by homology-directed repair in human primary cells using DNA-PKcs inhibition. Nat. Biotechnol. 42, 731–744. [DOI] [PubMed] [Google Scholar]
- 29.Hendel A, Bak RO, Clark JT, Kennedy AB, Ryan DE, Roy S, Steinfeld I, Lunstad BD, Kaiser RJ, Wilkens AB, et al. (2015). Chemically modified guide RNAs enhance CRISPR-Cas genome editing in human primary cells. Nat. Biotechnol. 33, 985–989. [DOI] [PMC free article] [PubMed] [Google Scholar]
- 30.Khan IF, Hirata RK, and Russell DW (2011). AAV-mediated gene targeting methods for human cells. Nat. Protoc. 6, 482–501. [DOI] [PMC free article] [PubMed] [Google Scholar]
- 31.Aurnhammer C, Haase M, Muether N, Hausl M, Rauschhuber C, Huber I, Nitschko H, Busch U, Sing A, Ehrhardt A, and Baiker A (2012). Universal real-time PCR for the detection and quantification of adeno-associated virus serotype 2-derived inverted terminal repeat sequences. Hum. Gene Ther. Methods 23, 18–28. [DOI] [PubMed] [Google Scholar]
- 32.Patro R, Duggal G, Love MI, Irizarry RA, and Kingsford C (2017). Salmon provides fast and bias-aware quantification of transcript expression. Nat. Methods 14, 417–419. [DOI] [PMC free article] [PubMed] [Google Scholar]
- 33.Eden E, Navon R, Steinfeld I, Lipson D, and Yakhini Z (2009). GOrilla: a tool for discovery and visualization of enriched GO terms in ranked gene lists. BMC Bioinf. 10, 48. [DOI] [PMC free article] [PubMed] [Google Scholar]
Associated Data
This section collects any data citations, data availability statements, or supplementary materials included in this article.
Supplementary Materials
Data Availability Statement
Data: RNA-seq data have been deposited in the NCBI Sequence Read Archive database (accession no. PRJNA1193132) and are publicly available as of the date of publication.
Code: no novel code was generated during the course of this work.
Other items: any additional information required to reanalyze the data reported in this paper is available from the lead contact upon request.