



Abstract
Arginine, glutamic acid and selenocysteine based codon bias has been shown to regulate the translation of specific mRNAs for proteins that participate in stress responses, cell cycle and transcriptional regulation. Defining codon-bias in gene networks has the potential to identify other pathways under translational control. Here we have used computational methods to analyze the ORFeome of all unique human (19,711) and mouse (22,138) open-reading frames (ORFs) to characterize codon-usage and codon-bias in genes and biological processes. We show that ORFeome-wide clustering of gene-specific codon frequency data can be used to identify ontology-enriched biological processes and gene networks, with developmental and immunological programs well represented for both humans and mice. We developed codon over-use ontology mapping and hierarchical clustering to identify multi-codon bias signatures in human and mouse genes linked to signaling, development, mitochondria and metabolism, among others. The most distinct multi-codon bias signatures were identified in human genes linked to skin development and RNA metabolism, and in mouse genes linked to olfactory transduction and ribosome, highlighting species-specific pathways potentially regulated by translation. Extreme codon bias was identified in genes that included transcription factors and histone variants. We show that re-engineering extreme usage of C- or U-ending codons for aspartic acid, asparagine, histidine and tyrosine in the transcription factors CEBPB and MIER1, respectively, significantly regulates protein levels. Our study highlights that multi-codon bias signatures can be linked to specific biological pathways and that extreme codon bias with regulatory potential exists in transcription factors for immune response and development.
Keywords: Codon bias, codon re-engineering, development, gene expression, ORFeome, transcription factors, translation, tRNA modification, queuosine
Graphical Abstract

Introduction
The cytoplasmic translational machinery can use 1 to 6 synonymous codons to decode each of 21 amino acids. Genome sequencing projects have provided significant data to characterize codon usage using metrics that include Isoacceptor Codon Frequencies (ICF), Total Codon Frequency (TCF), Relative Synonymous Codon Usage (RSCU), Codon Adaptation Index (CAI), tRNA Adaptation Index (tAI) and Supply Demand Adaptation (SDA), among many other measures.1–5 Codon usage metrics were broadly developed to answer questions related to evolution or protein synthesis, with some also utilizing tRNA gene or expression levels to inform on translation.1 Most codon usage metrics detail or can be processed to describe gene-based codon usage bias, which in some cases describe a preference for specific synonymous codons for an amino acid. The functional genomic rules governing codon bias and genome-wide trends are still being determined and are an important area of research.3,6–9 Synonymous codons have inherent translational regulatory features due to their sequence variations at the third position, also known as the mRNA wobble base. Studies using reporter or synthetic genes have demonstrated that swapping synonymous codons can alter protein levels significantly (250-fold for GFP, other)6,10, but maintaining a balance between codon usage and tRNA abundance is an important parameter for maintaining efficient translation.
Classically, the efficiency of codon decoding was attributed to the pool of available cognate tRNAs, and codon usage was considered a static metric. Positions 34 and 37 of the tRNA anticodon are hot spots for RNA modifications that can regulate codon-anticodon interactions. Multiple studies have recently demonstrated that the tRNA epitranscriptome can be dynamically re-programmed in response to changing cellular physiology and stress, and shown that codon usage preference and decoding can be modulated during cellular responses.11–21 tRNA modifications whose decoding potential matches the codon biased mRNAs are key regulators of translation, with the translationally regulated mRNAs termed modification tunable transcripts (MoTTS).22 In yeast, pathways enriched with MoTTs have been identified using ORFeome wide gene-specific codon bias measures and comprise mRNAs encoding proteins participating in DNA damage and stress response, protein synthesis, energy and metabolism.15,17,23
Here we have used ORFeome wide analysis and comparison of codon usage and bias data between humans and mice to identify similar and distinct pathways housing potential MoTTs. We have shown that there are global similarities in codon usage between humans and mice and some overlapping biological processes that have distinct codon-bias signatures. Each species has exploited codon bias in different pathways though, with humans using multi-codon bias signatures in genes linked to skin development and mice using it for olfactory transduction genes linked to smell, among others. We have also demonstrated that extreme codon bias can be identified in human and mice genes, with mRNAs for some transcription factors (i.e., CEBPB and MIER1) and histone proteins totally or mostly committed to specific synonymous codons. We used re-engineering of the extremely codon biased CEBPB and MIER1 to demonstrate that exchanging C-ending for -U ending synonymous codons for asparagine, aspartic acid, histidine and tyrosine, and vice versa, can dramatically regulate protein levels and highlight extreme codon usage as potential regulatory mechanism for transcription factors.
Materials and Methods
Codon Counting, Frequency and Z-score calculations
Complete open reading frames (ORFs) for all human coding sequences was downloaded from NCBI (GRCh38) at https://ftp.ncbi.nlm.nih.gov/genomes/refseq/vertebrate_mammalian/Homo_sapiens/all_assembly_versions/GCF_000001405.39_GRCh38.p13/.
Mouse coding sequences were downloaded from NCBI (GRCm39) at https://ftp.ncbi.nlm.nih.gov/genomes/refseq/vertebrate_mammalian/Mus_musculus/all_assembly_versions/GCF_000001635.27_GRCm39/.
Gene sequences were analyzed using our gene specific codon counting (GSCU) algorithm,15,17,24 to obtain codon counts, ICF and Z-scores. Briefly, ICF inform on the use of a synonymous codon for a specific amino acid, with the number of synonymous codons ranging from 2 to 6 for each amino acid. ICF was chosen as it has proven to predict protein levels during stress responses, is a driver of codon biased translational regulation observed in many species and can normalize for amino acid bias.8,13,15,17,23–30 Z-scores detail whether a gene is over- or under-using a synonymous codon for a specific amino acid, relative to genome averages. Corresponding codon data for all human and mouse genes was compiled and analyzed using Python based methods, as described below and available on Github.
Scripts to Characterize Codon Bias
All analysis was performed using Python 3.8.5, Jupyter 1.0.0, and Pandas 1.2.3. ICF and Z-score plots were generated using matplotlib 3.3.4. All code can be found and accessed in the below folder. https://www.dropbox.com/scl/fo/f79mi1damm7d01y4rhvoo/AIA-bsagh-VLYEF18_Jh5xo?rlkey=9hktrl4vocj1pv3duqcu3ka7b&st=qxb28bhq&dl=0
Number of codons enriched in each gene data matrix.
A gene-specific multi-codon Z-score compiler function analyzed all genes in a species, generated a list of genes over- or under-using a specific codon at the specified Z-score threshold, iterated this process for all codons, and then was collated to generate a dictionary of genes over-using multiple codons. The dictionary was then used to identify the number of genes over- or under-using N codons (N = 2 to 62) at a specified Z-score threshold. Gene lists were specified from the dictionary and then analyzed using STRING to perform gene ontology analysis.31 The gene-specific multi-codon Z-score compiler function was also used to generate a dictionary detailing the number of genes that over- or under-use each specific codon (N = 62) at discrete Z-score thresholds (Z=> 1.0, 1.5, 2.0, 2.5, 3.0, 3.5, 4.0, 4.5, 5.0 and Z <= −1.0, −1.5, −2.0, −2.5, −3.0, −3.5, −4.0, −4.5 and −5.0). Codon specific data tables were developed from the dictionary detailing the number of genes meeting the Z-score threshold for all codons, with the corresponding data matrix used to generate heatmap in Morpheus.32
Codon over-use ontology mapping.
Lists describing genes that over-use a specific codon (Z => 2) were assessed for gene ontology enrichment (biological and KEGG functions using Selenium 3.141.0 to access the STRING database). If a term description was observed in more than one gene list, the associated codon, term description and FDR value were used to construct a data matrix. Once all codons and term descriptors were retrieved, the −log10(FDR) was calculated for each value and the resulting table was used to construct a heatmap in Morpheus with hierarchical clustering on rows and columns.
Gene-specific summed Z-score (GSZ-score) calculation.
The absolute value of each codon-specific Z-score for each gene was used to calculate the GSZ-score. Genes were then sorted to generate gene lists for the top 50, 1% and 2.5% scoring genes and then analyzed in the STRING database for gene ontology enrichment. In addition, the ICF for each codon for the top 50 scoring genes were analyzed using hierarchical clustering in Morpheus.32
Cell studies and gene engineering.
HepG2 cells were seeded in 6-well plates at 5 × 10⁵ cells/well and transfected with TransfeX™ Transfection Reagent (ATCC, Manassas, VA) with pCMV 3xFLAG vector (Agilent, Santa Clara, CA) expressing either engineered CEPBP or MIER1 constructs. Genes were synthesized and cloned by Genescript (Piscataway NJ). Briefly, 2.5 μg of plasmid DNA and 5 μl of Transfection Reagent, were diluted in 250 μl of Opti-MEM™ Reduced Serum Medium (Gibco, Thermo Fisher Scientific, Waltham, MA) according to manufacturer’s protocol. For CEBPB studies, 24 H after transfection cells were left untreated or treated with 0.12 mM [LD20] NaAsO2 (Sigma-Aldrich, St. Louis, MO) for 2 hours in complete growth media. Cells were then harvested after 48 hours of transfection and lysed in RIPA buffer (50mM Tris-HCl pH 7.4. 150mM NaCl, 1% Triton-X 100, 1% Sodium deoxycholate, 0.1% SDS, 1mM EDTA with Protease Inhibitors) at 4 °C for 30 min, after which the lysates were cleared of cell debris by using centrifugation at 2000× g for 5 min. The protein concentrations of the samples were quantitated using Bradford Protein Assay (Bio-Rad, Hercules, CA). Protein lysates were analyzed using WES Simple Western™ instrument (ProteinSimple®, Bio-Techne, Minneapolis, MN). Samples were mixed with 1x fluorescent master mix (EZ standard pack I; ProteinSimple®) according to protocol and 2.88 μg total protein in a 3 μl volume was loaded into each well. Monoclonal ANTI-FLAG® M2 antibody produced in mouse (Sigma-Aldrich, St. Louis, MO) was used at a 1:1000 dilution in Milk-Free Ab diluent (Bio-Techne), whereas the loading control Anti-Neomycin Phosphotransferase II Antibody produced in rabbit (Sigma-Aldrich, St. Louis, MO) was used at a 1:10 dilution in Milk-Free Ab diluent (Bio-Techne). The secondary antibodies (anti-mouse and anti-rabbit HRP) and enhanced chemiluminescence (ECL) reagents were used according to the kit’s instructions (ProteinSimple®, Bio-Techne). Either the 13 or 25 capillary cartridges (12–230 kDa separation module, ProteinSimple®, Bio-Techne) were used for protein analysis. WES Simple Western™ data were analyzed using Compass for Simple Western software.
Calculation of free energy RNA structures for wild-type and codon engineered constructs.
RNA structure calculations detailing minimum free energy structure (MFE) of the wild-type and codon engineered constructs of CEPBP and MIER1 were calculated using three different tools; RNAfold (http://rna.tbi.univie.ac.at/cgi-bin/RNAWebSuite/RNAfold.cgi), UNAfold (http://www.unafold.org/mfold/applications/rna-folding-form.php) and Sfold (https://sfold.wadsworth.org/cgi-bin/srna.pl).33–36 In the case of RNAfold, the following default parameters were used: no folding constraints specified, avoid isolated base pairs, dangling energies on both sides of the helix, RNA parameters from the 2004 Turner model, rescaling energy parameters to 37°C and using 1M salt concentration. In the case of UNAfold, the default parameters were the same temperature and salt concentration as that used by RNAfold and maximum of 50 computed folded structures with maximum interior bulge loop size and asymmetry set to 30. The same default temperature of 37°C and salt concentration of 1 M was used in Sfold server.
Results
Each codon displays distinct gene-specific patterns of usage in the human and mouse ORFeome.
We generated ICF and Z-scores (Fig. 1A–B) for 62 codons in each of 19,711 human and 22,138 mouse genes comprising their respective ORFeomes (Supplemental Fig. S1, Supplemental Tables S1). ICF values describe if a synonymous codon is preferred in a gene sequence, and it is a measure that normalizes for amnio acid bias. For each codon we binned the number of genes that had a codon-specific ICF range from 0 to 1, at 0.1 intervals, to identify codons with distinct usage characteristics (Fig. 1C, left). Z-scores detail how many standard deviations away from the genomic mean a codon frequency is in a specific gene, and we have labeled Z=> 2 as over-use and Z=< −2 as under-use. Z-score histograms were generated to identify the number of genes that over- or under-use a codon, as well as the distribution (Fig. 1C, right). Genes over-using a codon (Z >= 2 or 4) were identified in humans and mice for 62 codons (Supplemental Tables S2). 15,300 genes in humans and 15,284 genes in mice overuse 1 – 2 codons with a Z => 2. 3,562 human genes and 3,258 mouse genes over-use 1 – 2 codons when we increased Z => 4. We identified 389 human genes (N = 13 or more codons) and 367 mouse genes (N = 12 or more codons) that over-use N-codons at a Z =>2, and the corresponding gene lists were analyzed for gene ontology enrichments (Supplemental Table S3). Both organism-specific gene lists over-using N-codons (13 for humans and 12 for mice) showed enrichment of mitochondrial related genes, which should be expected as the mitochondria is an A/T rich genome relative to the nuclear genome. The mouse ontologies of beta defensin and Parkinson’s disease were also identified.
Figure 1. ORFeome Wide Codon Metrics for Human Genes.
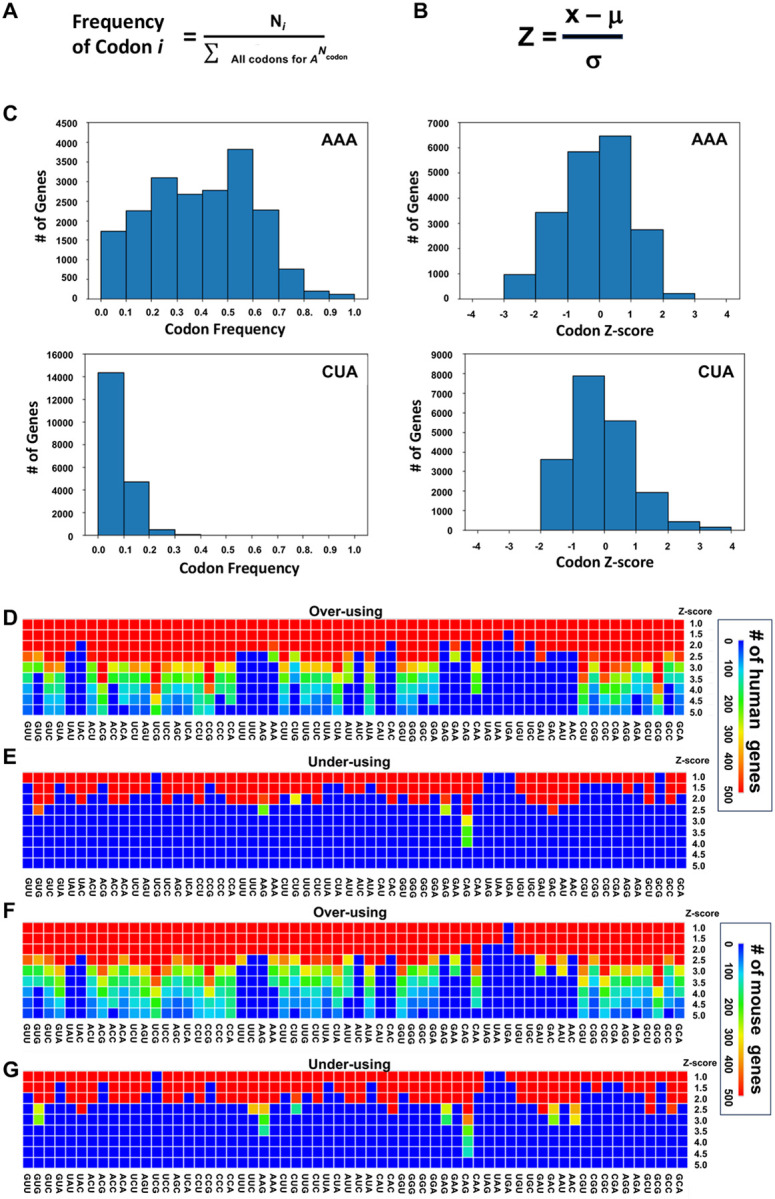
A. Gene-specific ICF formula, where Ni is the number of times codon i appears in the mRNA sequence. Σall codons for is the sum of all occurrences of codons that encode that amino acid A. B. Gene-specific codon Z-score formula uses frequency (x), average frequency of the genome (μ), and standard deviation of the genome average (σ). C. Representative plot for human genes at each codon frequency (left) or Z-score (right) for AAA (top) and CTA (bottom). The number of genes over-using or under-using a codon at different Z-score thresholds in humans (D-E) and mice (F-G).
Human and mouse genes have overlapping and species-specific patterns of codon bias
Heatmaps were used to visualize the number of genes that over- or under-use each codon at different Z-score thresholds for both the human and mouse data sets (Fig. 1D–G, Supplemental Tables S4A–D). As Z-score thresholds were increased fewer human and mouse genes over-use a codon (Fig. 1D & F). We identified 200+ genes (green color) in both species over-using the UCG (Ser) codon at a Z => 5. Using a Z-score => 3.0 we identified 8 codons in humans and in 8 mice that were over-used in => 200 genes (Fig. 1D & F) and they were GCG (Ala), CCA (Pro), CCG (Pro), UCG (Ser), CGA (Arg), CGU (Arg), CUA (Leu) and ACG (Thr). There were fewer under-used codons in the analysis of human and mouse genes, with neither species having any genes with Z =< −5. (Fig. 1E & G). Interestingly for both humans and mice, the codons CAG (Gln), AAG (Lys) and GAG (Glu) were distinctly under-used in some genes (Z < = −2.5, gene counts => 200). In addition, mouse genes more frequently under-use the GUG (Val), GAC (Asp) and AAC (Asn) codons relative to humans. Our findings highlight that some codons bias is generally conserved between humans and mice, with some species-specific differences in the extent (i.e., number of genes meeting Z-score thresholds) of codon bias.
Gene-specific ICF highlight a stratified ORFeome enriched in distinct biological networks.
Gene-specific ICF data for each of 59 codons was used to stratify the 19,711 human (Fig. 2, Supplemental Table S5A) and 22,138 mouse genes (Fig. 3, Supplemental Table S5B). All species specific ICF data was hierarchically clustered and visualized, with clear patterns of codon usage observed in large groups of genes for both humans and mice (Fig. 2 & 3). The patterning in the human verse mouse map is different (Fig. 2 & Fig. 3), with humans having 5 (+2 sub-groups) and mice having 8 distinct clusters. For humans, a distinct codon pattern highlights the Group A cluster with ICF values between ~0.6 and 0.8 for U/A-ending codons (Fig. 2) for UGU (Cys), CAU (His), AAU (Asn), GAA (Glu), AAA (Lys), UUU (Phe) and UAU (Tyr). Human group A is the extreme U/A-ending cluster. The human Group B cluster had decreased ICF values for codons described for group A (~0.4 to 0.6), but also had increased ICF values (~0.6 to 0.8) for many C/G-ending codons (Fig. 2). Human group B is the intermediary C/G/U/A-ending group. The human Group C cluster has high ICF-values for C-ending codons and intermediate ICF-values for U-ending codons (Fig. 2), with this cluster being a more extreme variation of group B. Human Group D has the highest ICF values for many C- and G-ending codons and is the extreme C/G-ending cluster (Fig. 2). Human group E is a small group of genes with ICF values in ~0.5 to 0.8 ranges for many U/A-ending codons and very low values ~0.0 to 0.2 for C/G-ending codons (Fig. 2). Group E genes are linked to the mitochondria. Some specific sub-groups for B and D (B1 & D1) were also identified as distinct codon users. Sub-group B1 was enriched for processes linked to the detection of chemical stimulus and immune system components. Subgroup D1 had the highest CGC (Arg) ICF values (~0.4 to 0.8) in the genome and was enriched in development process linked to tissues, cells and the nervous system.
Figure 2. Gene-Specific Codon Frequency Maps for the Human ORFeome.

ICF data for 19,711 human genes was clustered into five groups (A-E). Sub-patterns of codon usage were analyzed for enriched gene ontology.
Figure 3. Gene-Specific Codon Frequency Maps for the Mouse ORFeome.

ICF data for 22,138 unique mouse genes. Eight general clusters were identified (A-H) representing different patterns of gene-specific codon usage. Enriched gene-ontologies for groups A, B, D and H were identified.
We also analyzed the 22,138 mouse (Fig. 3) genes to show that ICF values could be used to stratify into codon-defined patterns. Mouse gene-specific ICF data stratified more groups than the human data (8 groups of A - H vs 5 groups of A - E), but there were some similarities between the two species. Both species had genes that use the CAG (Gln) codon at very high ICF levels, relative to its synonymous partner CAA (Gln). In addition, variations of high and low ICF values for C/G-ending and U/A-ending codons are prime drivers for stratification in both species. Specific to mice, high ICF values (~0.6 to 0.9) for some U- and A-ending codons highlight a mouse group A representing an extreme U/A-ending group (Fig. 3). Mouse group A genes are linked to spermatid, reproduction and innate immune responses. Mouse group B genes have high ICF values (~0.7 to 1.0) for specific C- or G-ending codons (Fig. 3). The biological processes of chromatin assembly, development (epithelium, animal organ, and tissue), and transcriptional regulation are linked to mouse group B, with it being an extreme C/G group. There were ontological similarities related to development between mouse group B and human group D1. Mouse group C is a less extreme version of group B. Mouse group D has the most distinct pattern in the heat map and has very low ICF values for many codons, notably Cys UGU (< 0.2) which contrasted by an extremely high (> 0.7) ICF value for Cys UGC. Mouse group D represents genes linked to biological processes related to sexual reproduction and RNA synthesis (Fig. 3). Other ICF defining groups were also identified in mice (Fig. 3, groups E-H). Notably ICF values of ~0.3 to 0.6 for GGC (Gly), GCC (Ala), CUG (Leu), ACC (Thr), CCC (Pro) and GUG (Val) define mouse group H, which is enriched for biological process linked to innate immunity and translation.
Codon over-usage patterns are linked to distinct biological functions
We and others have previously reported that codon over-use can be regulatory, and that specific codon biases in the mRNA of functionally related proteins supports a mechanism of translational regulation where key tRNA modifications regulate protein synthesis.8,13–15,23,24,26,28 Our goal here was to determine if any ontologies were comprised of genes that over-use a specific codon, and then determine if these ontologies could be linked to multiple codons and have a codon bias signature. We began codon over-use ontology mapping by generating 59 lists of human or mouse genes over-using (Z => 2) each codon (Fig. 4A). We analyzed each of 59 gene lists for enriched ontologies and detailed biological processes enriched in only 1 gene list (i.e., linked to only 1 codon) (Supplemental Tables S6A–B). We also identified ontologies that were identified in => 2 lists of genes over-using a specific codon (Supplemental Tables 7A–B). The False Discovery Rate (−log10 of FDR) data for each codon-linked ontology was recorded in a matrix and clustered and visualized as heatmaps for humans (Fig. 4B) and mice (Fig. 5) to highlight gene ontologies linked to patterns of multi-codon bias. In the heat map specific to humans (Fig. 4B), ontologies represented by the general descriptors signaling & development, skin differentiation, ion homeostasis, antimicrobial defense & immune response, mitochondria & disease, nucleoside and transport, mRNA, metabolism, translation & targeting, detection of chemical stimulus, and cell cycle are linked to specific patterns of multi-codon bias, with the exact ontologies numerous and shown in Supplemental Figure S2. In humans, gene ontologies whose gene list are enriched with seven or more codons are highlighted by regulation of signaling receptor activity, keratinization and skin development (Supplemental Table 8A). Ontologies that included keratinization, skin development, and epithelial cell differentiation, among others, are grouped under the heading skin differentiation (Fig. 4B) and have their corresponding genes over-using many codons, most notably ACC (Thr), CTG (Leu), GAC (Asp) and GCG (Ala), among others. The metabolism (Fig. 4B) cluster is dominated by the corresponding genes that over-use AUU (Ile), ACU (Thr) and CUU (Leu) codons, among others, and includes many ontologies similar to biosynthetic processes, RNA metabolic processes, macromolecular metabolic processes and nitrogen compound metabolic processes. The detection of chemical stimulus cluster is linked to smell and includes the ontologies olfactory transduction, sensory perception of smell, and detection of chemical stimulus, with the corresponding genes primarily over using AGG (Lys) and UCG (Ser) codons. We also parsed the input list to identify only those ontologies linked to gene lists that overuse at least 5 distinct codons (−log10 of FDR values > 2), clustered this restricted list and visualized as a heatmap (Fig. 4C). The two most codon distinct human ontologies are (1) regulation of signaling receptor activity and (2) keratinization, as they are both are linked to 6 codon-defined gene lists (−log10 of FDR => 5) (Fig. 4C).
Figure 4. Specific codon biases are linked to distinct biological functions in humans.

(A) methodology to (1) link genes that over-use a codon with biological process and (2) identify biological process linked multiple codons. (B) Gene ontology enriched (FDR < 0.05, −log10 FDR-values > 1.3) in each list of codon-biased genes (Z => 2) was identified for 59 codons. Ontologies not found were assigned −log10 FDR -values = 0. Data was hierarchically clustered and visualized. Summarized ontologies are listed on the Y-Axis, with exact ontologies shown in supplementary figure S2. (C) Data from panel B was filtered to identify ontologies with at least 5 codon linked −log10 FDR-values > 2.
Figure 5. Specific codon biases are linked to distinct biological functions in mice.

Gene ontology annotations enriched (FDR < 0.05, −log10 FDR > 1.3) in each list of codon-biased genes (Z => 2) was identified for 59 codons. Data was compiled to identify ontologies similarly identified in multiple codons. General ontology categories are shown on far left in black font, with exact ontologies noted in red font.
In mice, ontologies that were identified in at least seven or more lists of genes over-using a specific codon were olfactory transduction, ribosome and oxidative phosphorylation (Supplemental Table S8B). Clusters linked to cancer, olfactory transduction, ribosome, mitochondria & disease, macromolecular processes, signaling & development and diseases were identified (Fig. 5, Supplemental Table S8B). Overall, the number of mouse ontologies having genes that over-use a codon was much less than observed in humans (Fig. 5 vs Fig. 4). For mice, the olfactory transduction ontology is comprised of genes that when combined over-use 15 individual codons, which greatly exceeds the 4 over-used codons found in the identical ontology in humans. Olfactory transduction is represented by genes that over-use 11 codons corresponding to −log10 of FDR values => 5, the maximum value on the heat map, and include AGA (Arg), GGA (Gly), CCC (Pro), AGG (Arg), AAA (Lys), CGU (Arg), CAA (Gln), GAA (Glu), GCU (Ala), UCU (Ser), and AUU (Ile). Olfactory transduction is the most codon-distinct ontology identified in mice.
Some human and mouse genes are extremely biased for many codons
After identifying ontologies that are linked to multiple codons, we investigated if specific genes would have distinct codon bias signatures. ORFs with a high GSZ-score over- and under-use multiple codons and represent the most biased genes in the genome. GSZ-scores and distributions were plotted for human and mouse genes (Supplemental Table S9A–B, Supplemental Fig. 3A–B). The top 1% and 2.5% of the codon biased genes were subjected to gene ontology (GO) analysis and the extreme codon biased genes in humans are linked to transcriptional regulation and mitochondria (Supplemental Table 10A–B). In mice the extreme codon biased genes are linked to the spliceosome, beta defensins and defense response to bacterium (Supplemental Table 10C–D). We also analyzed the ICF’s for the top 50 most extreme codon biased human and mouse genes using hierarchical clustering, with the corresponding heat maps identifying two clusters (C/G-ending vs. U/A-ending) in each species (Fig. 6A–B). The most striking clusters in each species (Fig. 6A–B, black bars) are highlighted by some genes that are completely committed to specific synonymous codons, being that they only use one codon from the synonymous options for some amino acids. We identified 6 genes in humans (CTXN1, FNDC10, SMIM10L2A, TMEM238, SOX1, C11ORF96) that are completely committed to specific synonymous codons [CAG (Gln), GAG (Glu), UAC (Tyr) AUC (Ile), UGC (Cys), UUC (Phe)] for each of 6 amino acids in their gene sequence, with 14 other genes 90% committed to using these 6 codons. In mice, 9 genes encoding histone proteins are 100% committed to a single codon for each of 6 amino acids [UUC (Phe), CAC (His), GAC (Asp), CAG (Gln), AUC (Ile), GAG (Glu)].
Fig. 6. There are two types of extremely biased human and mouse genes.

Heat maps detailing the codon frequencies of top 50 biased human (A) and mouse (B) genes. The black bar denotes clusters populated by genes that over-use synonymous codons mostly ending in G or C.
Codon re-engineering can regulate the levels of specific transcription factors
The amino acids Asn, Asp, His and Tyr are each specified by two codons (C- or U-ending) that are decoded by tRNAs that contain a wobble queosine (Q34). CEPBP is totally committed to AAC (Asn), GAC (Asp), CAC (His), and UAC (Tyr) codons in both humans and mice (Fig. 7A). CEBPB is a transcription factor that regulates immune and inflammatory responses, with the conserved codon usage between human and mouse genes suggesting a regulatory role. While CEBPB is representative of genes over-using codons that end in C or G, the top 50 most biased genes in both organisms also have entries, represented by MIER1, that can be generalized as over-using codons that end in U or A. MIER1 is a transcriptional regulator that is a homolog of the mesoderm induction early response protein characterized in Xenopus laevis. Mouse and human MIER1 have similar codon usage patterns, and both are very committed to CUA (6 of 7 His codons), UAU (11 of 15 Tyr codons), GAU (33 of 42 Asp codons) and AAU (18 of 23 Asn codons) (Fig. 7B). We tested the regulatory effects of extreme codon bias in human CEBPB and MIER1, with a focus on the Asn, Asp, His and Tyr codons. Human CEBPB is completely committed to the C-ending codons for Asn (AAC), Asp (GAC), His (CAC) and Tyr (UAC), and contains 41 in total. We generated a synthetic gene for CEBPB, (41Q-CEBPB) that had the 41 C-ending codons changed to 41 U-ending counterparts, which will produce identical proteins at the amino acid level while testing the importance of codon usage on output. After transfecting the plasmid that expressed CEBPB variants, we analyzed for protein levels relative to an internal control (Fig. 7C). We show that under untreated conditions protein levels that are translated from WT CEBPB that contains 41 C-ending codons are significantly higher than those translated from the 41Q version that has 41 U-ending codons. A similar trend was observed after NaAsO2 treatment, with a slight increase observed for WT and slight decrease observed for 41Q. In contrast to CEBPB, MIER1 is very committed to U-ending codons for Asn, Asp, His, and Tyr, and contains 68 in total (Fig. 7D). We constructed completely committed C-ending (Q-UP) and U-ending (Q-DW) versions of MIER1 for Asn, Asp, His and Tyr, and analyzed protein levels. Relative to WT MIER1, the Q-UP version had increased protein levels while Q-DW had decreased protein levels (Fig. 7D). We also performed RNA structure calculations for WT and codon engineered constructs. Minimum Free Energy (MFE) values calculated by RNAfold, UNAfold, and SRNA show similarities between CEPBP-WT and CEPBP-41Q constructs (Supplementary Figure S4–5), with the MIER1-QUP construct having a slightly lower MFE (higher structure) value than MIER-1WT and MIER1-QDW. Together, these results support the idea that C-ending codons in native CEBPB and re-engineered MIER1 promote translation and increased protein levels, with U-ending codons having the opposite effect.
Figure. 7. Extreme codon bias can be conserved and regulates protein levels of the CEBPB and MIER1 transcription factors.

Heat map-based comparison of gene-specific codon frequencies for human and mouse (A) CEBPB and (B) MIER1 genes. Codons marked with an asterisk are decoded by Q, with parenthesis indicating the number of times that codon is found in the native gene sequence. (C) Protein-simple based analysis of WT and re-engineered human CEBPB. (D) Codon details (upper) and Protein-simple based analysis (lower) of WT and re-engineered human MIER1 versions.
Discussion
Humans and mice use codon bias in distinct gene families that are potential MoTTs.
Previous studies have identified species-specific codon signatures in MoTTs encoding DNA damage response, ROS-detoxification, ribosome and translation-related process and signal transduction pathways.7,13–15,17,22,23,26,27,37 ICF values do not report on codon bias, but clustering highlights distinct patterning with underlying over- or under-usage bias. ICF patterns distinctly stratified clusters of mouse genes enriched for biological process of gamete generation, sexual reproduction, spermatid development, defense response to bacterium and innate immune response (all FDR-values < 5E−21). Clustering based on ICF values for humans identified ontologies that included chemical stimulus, development (nervous system, system, animal organ), regulation of transcription and neurogenesis (all FDR-values < 5E−13). While ICF clustering highlights codon-based differences between mice and humans, development related ontologies were similarly identified in both species, with some distinctions. Species-specific distinctions were most evident using codon over-use ontology mapping, with this methodology utilizing codon bias. Humans genes belonging to ontologies linked to skin differentiation were unique when compared to mice and over-used many codons. Human genes linked to skin differentiation are likely MoTTs. Development has previously been shown to be under extensive translational regulation by Sshu, Wnt, Hippo, PI3K and MAPK pathways.38 In addition, upstream – ORF (uORF) mediated translational regulation has been linked to neurogenesis,38 and there could be overlapping translation initiation and elongation programs that utilize uORFS and codon usage. Codon usage can also clearly influence mRNA stability, with codon over-use potentially having direct and indirect effects on translation.39,40 In mice, the ontology of olfactory transduction is unique compared to humans and it is populated by genes that over-using multiple codons and encode likely MoTTs. Mice have evolved new gene lineages that include those linked to reproduction, immunity, and olfaction,41 with the last likely due to rodents’ extensive use of smell. Shared codon usage in pathways has the potential to coordinate the regulation of pathways and also promote complex formations.42 Translational regulation of human mRNAs linked to skin development and mouse mRNAs linked to smell could be used to quickly adapt to changing environments, via translational regulation of existing mRNAs, which may be accompanied by dynamic changes in tRNA modifications.
Different multi-codon over-use signatures are present in human and mouse biological processes
Different types of codon bias have been linked to the regulation of mRNAs whose corresponding proteins belong to specific biological processes in bacteria, yeast, mice and cancer models. In mice, the response to oxidative stress is regulated by increased mcm5Um34 modifications that promote the decoding of UGA codons for selenocysteine and found in the mRNAs for ROS-detoxification enzymes.14 In humans, METTL1-dependent methylation of G47 to N7-methylguanosine (m7G) occurs in multiple tRNAs to increase abundance, with m7G on tRNA Arg-TCT-4–1 in cancers promoting the increased translation of mRNAs for cell cycle regulators enriched in the correspondingly decoded AGA codon for Arg.28,43 The theme of codon bias regulating stress responses is conserved across phylogeny, with each species utilizing distinct codon – tRNA modification rules. Some specificity in how each species utilizes codon bias should be expected as codon usage in bacteria, yeast and mammals is notably different, which can be attributed to a range of GC contents, from 38% to 67%.44–46 In addition, the physiological needs and environmental conditions of each species is different and have likely provided pressure to regulate pathways with different types of codon bias. These species-specific examples demonstrate some simple codon – tRNA modification rules, that are likely more complex in mechanism. METTL1 modifies 25 distinct tRNAs charged with 16 different amino acids and has been linked to stem cell development, cancer, and aging.28,43 METTL1’s substrates highlight the potential complexity of identifying codon over-use patterns. Similarly the ELP writers modify tRNA isoacceptors, decoding 13 codons linked to 6 amino acids (Arg, Gly, Glu, Lys, Gln, Sec), with ELP linked to codon biased translational regulation of stress and chemotherapeutic resistance programs in cancers.8 We identified complex patterns of codon over-use in our study, with more codons linked to more ontologies in humans then mice. In humans, ontologies linked to skin differentiation and metabolism show two distinct clusters, highlighting multi-codon signatures around groups of codons predominantly ending in C/G or U/A, respectfully. For example, the ontology of keratinization is comprised of genes that over-use 12 C/G ending-codons. In contrast the ontology of cellular nitrogen compound metabolic processing, which was similar to nucleic acid metabolic process, is comprised of groups of genes over-using mostly U- or A- ending codons. Patterning of mRNAs based on codons that end in either U/A or C/G has been identified during responses to stress,12,47 and is likely due to specific translational programs that optimize the decoding of corresponding mRNAs. The mouse ontology of olfactory transductions is comprised of mRNAs that as a group over-use 15 specific codons and represent the most complex pattern identified in our study. Olfactory transduction genes over-use 11 codons [AGA (Arg), GGA (Gly), AGG (Arg), AAA (Lys), GAG (Glu), CGU (Arg), CAA (Gln), GAA (Glu), and GGU (Gly)] that are decoded by tRNAs containing the wobble uridine modifications mcm5U, mcm5s2U or mchm5U. These wobble uridine modifications in mice are written by Elp1-6, Ctu1-2 and Alkbh8, which would suggest a role for these writers in regulating smell. The mouse olfactory transduction genes also over-use CCC (Pro), GCU (Ala), UCU (Ser), and UCC (Ser) codons, implicating other tRNAs and writers in translational regulation.
Extreme codon bias is a regulatory feature in mammalian ORFeomes
While complex codon over-usage signatures define specific pathways, extreme codon usage is evident in specific genes. CEBPB is transcriptional regulator of immune and inflammatory networks and promotes drug resistance in non-small cell lung cancer via regulation by Nrf2.48–51 The CEBPG gene was totally committed to C-ending codons for Asn, Asp, His and Tyr in humans and mice. Codon re-engineering of CEBPB highlights the importance of C-ending codons in maintaining protein levels. Total conservation between humans and mice supports a regulatory role for extreme codon usage, with corresponding Asn, Asp, His, and Tyr codons all decoded by tRNAs containing the modification Q34. Formation of the Q modification in tRNA of humans is dependent on the diet and microbiome-based production of the essential co-factor queuine,52,53 with nutrient levels also affecting Q-levels in Trypanasomes.54 Regulation of immune and inflammatory networks in both humans and mice may be tied to diet and the microbiome, via tRNA modification and codon-dependent translational regulation. The human transcription factors NKX6–2 and SOX1 are also highly committed to C-ending codons decoded by Q (NKX6–2 has 33 and SOX1 has 54) and use few U-ending codons (NKX6–2 uses 0 and SOX1 uses 1) and these proteins can control cell migration and invasion in gastric cancer cells,55 and oncogenic activity in glioblastomas,56 respectively. There could thus be therapeutic potential to target the translation of these extreme codon patterns to treat cancers. MIER1 is a mirror image of CEBPB, NKX6–2, and SOX1 mRNA, as it is over-using U-ending codons for Asn, Asp, His and Tyr codons. Codon re-engineering of MIER1 supports that U-ending codons lead to lower protein levels in the context of the human HEPG2 system. The presence of many genes that over-use codons that end in U (and A) is evident in humans and mice. Translational programs that favor decoding of U-ending codons could be present in certain cell types or physiological conditions, as there is evidence of translational regulation during development and tissue and age-specific gene-expression has been identified.57–59 Also, most mitochondrial genes over-use codons that end in U or A, which could sync the translation of U- or A-ending codons in cytoplasmic mRNAs with mitochondrial physiology.
Our studies support an emerging theme that codon bias can be used to regulate transcription factors. Previously codon reengineering of the master transcriptional regulator of dormancy, DosR, in bacteria has been demonstrated to enhance it translation during hypoxia, with the increased wobble U tRNA modification 5-oxyacetyl-uridine (cmo5U) postulated to promote ACG decoding, while restricting ACC.13 In BRAFV600E- expressing human melanoma cells the translation of AAA (Lys), CAA (Gln) and GAA (Glu) codons in HIF1A mRNA has been linked to the wobble U writers for corresponding tRNAs.8 HIF1A is part of the transcriptional regulator HIF1 that is induced in response to hypoxia and allows cells to adapt to low oxygen conditions.60,61 The transcription factor DEK1 has also been shown to be regulated by the codon biased translation of the LEF1, to coordinate a pro-invasion program in cancer.62,63 Codon re-engineering of HIF1A and LEF1 has also be shown to alter their regulation. Codon-bias in the ORFs of transcription factors or their regulatory proteins could allow for translational regulation to control the transcription of regulons.
Altogether, our study has provided evidence of extensive codon bias in specific biological processes for humans and mice. Codon-biased translational regulation has emerged as an important regulatory mechanism in stress responses and human cancers and aging, with strong connections to tRNA writers.28,43 Developing approaches to regulate the translation of codon-biased MoTTs could be used to regulate transcription, treat cancers or improve aging, with our study highlighting protein networks with distinct codon patterns and writers to targets. Our findings also provide a blue print to improve the production of proteins with extremely biased Q-decoded codons, with potential applications to improve protein production for biomanufacturing.
Supplementary Material
Acknowledgments
The authors are grateful for support from the National Institutes of Health (ES026856, ES031529, GM070641, CA274603) and the National Research Foundation of Singapore through the Singapore-MIT Alliance for Research and Technology Antimicrobial Resistance Interdisciplinary Research Group, the MIT - Spain “la Caixa” Foundation Seed Fund, and the Agilent Foundation. The graphical abstract was generated using BioRender.com.
Footnotes
Declarations: SRB, PCD, and TJB hold equity in Codomax
References
- 1.Bahiri-Elitzur S., and Tuller T. (2021). Codon-based indices for modeling gene expression and transcript evolution. Comput Struct Biotechnol J 19, 2646–2663. 10.1016/j.csbj.2021.04.042. [DOI] [PMC free article] [PubMed] [Google Scholar]
- 2.Hernandez-Alias X., Benisty H., Schaefer M.H., and Serrano L. (2020). Translational efficiency across healthy and tumor tissues is proliferation-related. Mol Syst Biol 16, e9275. 10.15252/msb.20199275. [DOI] [PMC free article] [PubMed] [Google Scholar]
- 3.dos Reis M., Savva R., and Wernisch L. (2004). Solving the riddle of codon usage preferences: a test for translational selection. Nucleic Acids Res 32, 5036–5044. 10.1093/nar/gkh834. [DOI] [PMC free article] [PubMed] [Google Scholar]
- 4.Sharp P.M., and Li W.H. (1987). The codon Adaptation Index--a measure of directional synonymous codon usage bias, and its potential applications. Nucleic Acids Res 15, 1281–1295. 10.1093/nar/15.3.1281. [DOI] [PMC free article] [PubMed] [Google Scholar]
- 5.Sharp P.M., and Li W.H. (1986). An evolutionary perspective on synonymous codon usage in unicellular organisms. J Mol Evol 24, 28–38. 10.1007/BF02099948. [DOI] [PubMed] [Google Scholar]
- 6.Boel G., Letso R., Neely H., Price W.N., Wong K.H., Su M., Luff J., Valecha M., Everett J.K., Acton T.B., et al. (2016). Codon influence on protein expression in E. coli correlates with mRNA levels. Nature 529, 358–363. 10.1038/nature16509. [DOI] [PMC free article] [PubMed] [Google Scholar]
- 7.LaBella A.L., Opulente D.A., Steenwyk J.L., Hittinger C.T., and Rokas A. (2021). Signatures of optimal codon usage in metabolic genes inform budding yeast ecology. PLoS biology 19, e3001185. [DOI] [PMC free article] [PubMed] [Google Scholar]
- 8.Rapino F., Delaunay S., Rambow F., Zhou Z., Tharun L., De Tullio P., Sin O., Shostak K., Schmitz S., Piepers J., et al. (2018). Codon-specific translation reprogramming promotes resistance to targeted therapy. Nature 558, 605–609. 10.1038/s41586-018-0243-7. [DOI] [PubMed] [Google Scholar]
- 9.Tumu S., Patil A., Towns W., Dyavaiah M., and Begley T.J. (2012). The gene-specific codon counting database: a genome-based catalog of one-, two-, three-, four- and five-codon combinations present in Saccharomyces cerevisiae genes. Database (Oxford) 2012, bas002. 10.1093/database/bas002. [DOI] [PMC free article] [PubMed] [Google Scholar]
- 10.Kudla G., Murray A.W., Tollervey D., and Plotkin J.B. (2009). Coding-sequence determinants of gene expression in Escherichia coli. Science 324, 255–258. 10.1126/science.1170160. [DOI] [PMC free article] [PubMed] [Google Scholar]
- 11.Lee W.L., Sinha A., Lam L.N., Loo H.L., Liang J., Ho P., Cui L., Chan C.S.C., Begley T., Kline K.A., and Dedon P. (2023). An RNA modification enzyme directly senses reactive oxygen species for translational regulation in Enterococcus faecalis. Nat Commun 14, 4093. 10.1038/s41467-023-39790-x. [DOI] [PMC free article] [PubMed] [Google Scholar]
- 12.Huber S.M., Begley U., Sarkar A., Gasperi W., Davis E.T., Surampudi V., Lee M., Melendez J.A., Dedon P.C., and Begley T.J. (2022). Arsenite toxicity is regulated by queuine availability and oxidation-induced reprogramming of the human tRNA epitranscriptome. Proc Natl Acad Sci U S A 119, e2123529119. 10.1073/pnas.2123529119. [DOI] [PMC free article] [PubMed] [Google Scholar]
- 13.Chionh Y.H., McBee M., Babu I.R., Hia F., Lin W., Zhao W., Cao J., Dziergowska A., Malkiewicz A., Begley T.J., et al. (2016). tRNA-mediated codon-biased translation in mycobacterial hypoxic persistence. Nat Commun 7, 13302. 10.1038/ncomms13302. [DOI] [PMC free article] [PubMed] [Google Scholar]
- 14.Endres L., Begley U., Clark R., Gu C., Dziergowska A., Malkiewicz A., Melendez J.A., Dedon P.C., and Begley T.J. (2015). Alkbh8 Regulates Selenocysteine-Protein Expression to Protect against Reactive Oxygen Species Damage. PLoS One 10, e0131335. 10.1371/journal.pone.0131335. [DOI] [PMC free article] [PubMed] [Google Scholar]
- 15.Deng W., Babu I.R., Su D., Yin S., Begley T.J., and Dedon P.C. (2015). Trm9-Catalyzed tRNA Modifications Regulate Global Protein Expression by Codon-Biased Translation. PLoS Genet 11, e1005706. 10.1371/journal.pgen.1005706. [DOI] [PMC free article] [PubMed] [Google Scholar]
- 16.Chan C.T., Dyavaiah M., DeMott M.S., Taghizadeh K., Dedon P.C., and Begley T.J. (2010). A quantitative systems approach reveals dynamic control of tRNA modifications during cellular stress. PLoS Genet 6, e1001247. 10.1371/journal.pgen.1001247. [DOI] [PMC free article] [PubMed] [Google Scholar]
- 17.Begley U., Dyavaiah M., Patil A., Rooney J.P., Direnzo D., Young C.M., Conklin D.S., Zitomer R.S., and Begley T.J. (2007). Trm9-Catalyzed tRNA Modifications Link Translation to the DNA Damage Response. Mol Cell 28, 860–870. [DOI] [PMC free article] [PubMed] [Google Scholar]
- 18.Liu F., Clark W., Luo G., Wang X., Fu Y., Wei J., Wang X., Hao Z., Dai Q., Zheng G., et al. (2016). ALKBH1-Mediated tRNA Demethylation Regulates Translation. Cell 167, 816–828 e816. 10.1016/j.cell.2016.09.038. [DOI] [PMC free article] [PubMed] [Google Scholar]
- 19.Dominissini D., Nachtergaele S., Moshitch-Moshkovitz S., Peer E., Kol N., Ben-Haim M.S., Dai Q., Di Segni A., Salmon-Divon M., Clark W.C., et al. (2016). The dynamic N(1)-methyladenosine methylome in eukaryotic messenger RNA. Nature 530, 441–446. 10.1038/nature16998. [DOI] [PMC free article] [PubMed] [Google Scholar]
- 20.Zaborske J.M., DuMont V.L., Wallace E.W., Pan T., Aquadro C.F., and Drummond D.A. (2014). A nutrient-driven tRNA modification alters translational fidelity and genome-wide protein coding across an animal genus. PLoS Biol 12, e1002015. 10.1371/journal.pbio.1002015. [DOI] [PMC free article] [PubMed] [Google Scholar]
- 21.Pan T. (2013). Adaptive translation as a mechanism of stress response and adaptation. Annu Rev Genet 47, 121–137. 10.1146/annurev-genet-111212-133522. [DOI] [PMC free article] [PubMed] [Google Scholar]
- 22.Endres L., Dedon P.C., and Begley T.J. (2015). Codon-biased translation can be regulated by wobble-base tRNA modification systems during cellular stress responses. RNA Biol 12, 603–614. 10.1080/15476286.2015.1031947. [DOI] [PMC free article] [PubMed] [Google Scholar]
- 23.Patil A., Dyavaiah M., Joseph F., Rooney J.P., Chan C.T., Dedon P.C., and Begley T.J. (2012). Increased tRNA modification and gene-specific codon usage regulate cell cycle progression during the DNA damage response. Cell Cycle 11, 3656–3665. 10.4161/cc.21919 21919 [pii]. [DOI] [PMC free article] [PubMed] [Google Scholar]
- 24.Chan C.T., Pang Y.L., Deng W., Babu I.R., Dyavaiah M., Begley T.J., and Dedon P.C. (2012). Reprogramming of tRNA modifications controls the oxidative stress response by codon-biased translation of proteins. Nat Commun 3, 937. 10.1038/ncomms1938. [DOI] [PMC free article] [PubMed] [Google Scholar]
- 25.Patil A., Chan C.T., Dyavaiah M., Rooney J.P., Dedon P.C., and Begley T.J. (2012). Translational infidelity-induced protein stress results from a deficiency in Trm9-catalyzed tRNA modifications. RNA Biol 9, 990–1001. 10.4161/rna.20531. [DOI] [PMC free article] [PubMed] [Google Scholar]
- 26.Chan C.T., Deng W., Li F., DeMott M.S., Babu I.R., Begley T.J., and Dedon P.C. (2015). Highly Predictive Reprogramming of tRNA Modifications Is Linked to Selective Expression of Codon-Biased Genes. Chem Res Toxicol 28, 978–988. 10.1021/acs.chemrestox.5b00004. [DOI] [PMC free article] [PubMed] [Google Scholar]
- 27.Chan C., Kwan Sze N.S., Suzuki Y., Ohira T., Suzuki T., Begley T.J., and Dedon P.C. (2023). Dengue virus exploits the host tRNA epitranscriptome to promote viral replication. bioRxiv. 10.1101/2023.11.05.565734. [DOI] [Google Scholar]
- 28.Orellana E.A., Liu Q., Yankova E., Pirouz M., De Braekeleer E., Zhang W., Lim J., Aspris D., Sendinc E., Garyfallos D.A., et al. (2021). METTL1-mediated m(7)G modification of Arg-TCT tRNA drives oncogenic transformation. Mol Cell 81, 3323–3338 e3314. 10.1016/j.molcel.2021.06.031. [DOI] [PMC free article] [PubMed] [Google Scholar]
- 29.Davis N.K., Chionh Y.H., McBee M.E., Hia F., Ma D., Cui L., Sharaf M.L., Cai W.M., Jumpathong W., Levine S.S., et al. (2024). Facile metabolic reprogramming distinguishes mycobacterial adaptation to hypoxia and starvation: ketosis drives starvation-induced persistence in M. bovis BCG. Commun Biol 7, 866. 10.1038/s42003-024-06562-2. [DOI] [PMC free article] [PubMed] [Google Scholar]
- 30.Giguere S., Wang X., Huber S., Xu L., Warner J., Weldon S.R., Hu J., Phan Q.A., Tumang K., Prum T., et al. (2024). Antibody production relies on the tRNA inosine wobble modification to meet biased codon demand. Science 383, 205–211. 10.1126/science.adi1763. [DOI] [PMC free article] [PubMed] [Google Scholar]
- 31.Szklarczyk D., Kirsch R., Koutrouli M., Nastou K., Mehryary F., Hachilif R., Gable A.L., Fang T., Doncheva N.T., Pyysalo S., et al. (2023). The STRING database in 2023: protein-protein association networks and functional enrichment analyses for any sequenced genome of interest. Nucleic Acids Res 51, D638–D646. 10.1093/nar/gkac1000. [DOI] [PMC free article] [PubMed] [Google Scholar]
- 32.Morpheus (https://software.broadinstitute.org/morpheus).
- 33.Lorenz R., Bernhart S.H., Honer Zu Siederdissen C., Tafer H., Flamm C., Stadler P.F., and Hofacker I.L. (2011). ViennaRNA Package 2.0. Algorithms Mol Biol 6, 26. 10.1186/1748-7188-6-26. [DOI] [PMC free article] [PubMed] [Google Scholar]
- 34.Zuker M. (2003). Mfold web server for nucleic acid folding and hybridization prediction. Nucleic Acids Res 31, 3406–3415. 10.1093/nar/gkg595. [DOI] [PMC free article] [PubMed] [Google Scholar]
- 35.Ding Y., and Lawrence C.E. (1999). A bayesian statistical algorithm for RNA secondary structure prediction. Comput Chem 23, 387–400. 10.1016/s0097-8485(99)00010-8. [DOI] [PubMed] [Google Scholar]
- 36.Ding Y., and Lawrence C.E. (2001). Statistical prediction of single-stranded regions in RNA secondary structure and application to predicting effective antisense target sites and beyond. Nucleic Acids Res 29, 1034–1046. 10.1093/nar/29.5.1034. [DOI] [PMC free article] [PubMed] [Google Scholar]
- 37.Zhou M., Guo J., Cha J., Chae M., Chen S., Barral J.M., Sachs M.S., and Liu Y. (2013). Non-optimal codon usage affects expression, structure and function of clock protein FRQ. Nature 495, 111–115. [DOI] [PMC free article] [PubMed] [Google Scholar]
- 38.Fujii K., Shi Z., Zhulyn O., Denans N., and Barna M. (2017). Pervasive translational regulation of the cell signalling circuitry underlies mammalian development. Nat Commun 8, 14443. 10.1038/ncomms14443. [DOI] [PMC free article] [PubMed] [Google Scholar]
- 39.Hanson G., and Coller J. (2018). Codon optimality, bias and usage in translation and mRNA decay. Nat Rev Mol Cell Biol 19, 20–30. 10.1038/nrm.2017.91. [DOI] [PMC free article] [PubMed] [Google Scholar]
- 40.Lavner Y., and Kotlar D. (2005). Codon bias as a factor in regulating expression via translation rate in the human genome. Gene 345, 127–138. [DOI] [PubMed] [Google Scholar]
- 41.Mouse Genome Sequencing C., Waterston R.H., Lindblad-Toh K., Birney E., Rogers J., Abril J.F., Agarwal P., Agarwala R., Ainscough R., Alexandersson M., et al. (2002). Initial sequencing and comparative analysis of the mouse genome. Nature 420, 520–562. 10.1038/nature01262. [DOI] [PubMed] [Google Scholar]
- 42.Benisty H., Hernandez-Alias X., Weber M., Anglada-Girotto M., Mantica F., Radusky L., Senger G., Calvet F., Weghorn D., Irimia M., et al. (2023). Genes enriched in A/T-ending codons are co-regulated and conserved across mammals. Cell Syst 14, 312–323 e313. 10.1016/j.cels.2023.02.002. [DOI] [PubMed] [Google Scholar]
- 43.Fu Y., Jiang F., Zhang X., Pan Y., Xu R., Liang X., Wu X., Li X., Lin K., Shi R., et al. (2024). Perturbation of METTL1-mediated tRNA N(7)- methylguanosine modification induces senescence and aging. Nat Commun 15, 5713. 10.1038/s41467-024-49796-8. [DOI] [PMC free article] [PubMed] [Google Scholar]
- 44.Dovbnya D.V., Bragin E.Y., Ivashina T.V., and Donova M.V. (2022). Draft Genome Sequence of Mycolicibacterium smegmatis VKM Ac-1171 Contains Full Set of Sterol Catabolic Genes. Microbiol Resour Announc 11, e0077222. 10.1128/mra.00772-22. [DOI] [PMC free article] [PubMed] [Google Scholar]
- 45.Wood V., Gwilliam R., Rajandream M.A., Lyne M., Lyne R., Stewart A., Sgouros J., Peat N., Hayles J., Baker S., et al. (2002). The genome sequence of Schizosaccharomyces pombe. Nature 415, 871–880. 10.1038/nature724. [DOI] [PubMed] [Google Scholar]
- 46.Cole S.T., Brosch R., Parkhill J., Garnier T., Churcher C., Harris D., Gordon S.V., Eiglmeier K., Gas S., Barry C.E. 3rd, et al. (1998). Deciphering the biology of Mycobacterium tuberculosis from the complete genome sequence. Nature 393, 537–544. 10.1038/31159. [DOI] [PubMed] [Google Scholar]
- 47.Watkins C.P., Zhang W., Wylder A.C., Katanski C.D., and Pan T. (2022). A multiplex platform for small RNA sequencing elucidates multifaceted tRNA stress response and translational regulation. Nat Commun 13, 2491. 10.1038/s41467-022-30261-3. [DOI] [PMC free article] [PubMed] [Google Scholar]
- 48.Kinoshita S., Akira S., and Kishimoto T. (1992). A member of the C/EBP family, NF-IL6 beta, forms a heterodimer and transcriptionally synergizes with NF-IL6. Proc Natl Acad Sci U S A 89, 1473–1476. 10.1073/pnas.89.4.1473. [DOI] [PMC free article] [PubMed] [Google Scholar]
- 49.Roy S.K., Hu J., Meng Q., Xia Y., Shapiro P.S., Reddy S.P., Platanias L.C., Lindner D.J., Johnson P.F., Pritchard C., et al. (2002). MEKK1 plays a critical role in activating the transcription factor C/EBP-beta-dependent gene expression in response to IFN-gamma. Proc Natl Acad Sci U S A 99, 7945–7950. 10.1073/pnas.122075799. [DOI] [PMC free article] [PubMed] [Google Scholar]
- 50.Okazaki K., Anzawa H., Katsuoka F., Kinoshita K., Sekine H., and Motohashi H. (2022). CEBPB is required for NRF2-mediated drug resistance in NRF2-activated non-small cell lung cancer cells. J Biochem 171, 567–578. 10.1093/jb/mvac013. [DOI] [PubMed] [Google Scholar]
- 51.Yang J., Xu Y., Xie K., Gao L., Zhong W., and Liu X. (2022). CEBPB is associated with active tumor immune environment and favorable prognosis of metastatic skin cutaneous melanoma. Front Immunol 13, 991797. 10.3389/fimmu.2022.991797. [DOI] [PMC free article] [PubMed] [Google Scholar]
- 52.El Yacoubi B., Bailly M., and de Crecy-Lagard V. (2012). Biosynthesis and function of posttranscriptional modifications of transfer RNAs. Annu Rev Genet 46, 69–95. 10.1146/annurev-genet-110711-155641. [DOI] [PubMed] [Google Scholar]
- 53.Reyniers J.P., Pleasants J.R., Wostmann B.S., Katze J.R., and Farkas W.R. (1981). Administration of exogenous queuine is essential for the biosynthesis of the queuosine-containing transfer RNAs in the mouse. J Biol Chem 256, 11591–11594. [PubMed] [Google Scholar]
- 54.Dixit S., Kessler A.C., Henderson J., Pan X., Zhao R., D’Almeida G.S., Kulkarni S., Rubio M.A.T., Hegedusova E., Ross R.L., et al. (2021). Dynamic queuosine changes in tRNA couple nutrient levels to codon choice in Trypanosoma brucei. Nucleic Acids Res 49, 12986–12999. 10.1093/nar/gkab1204. [DOI] [PMC free article] [PubMed] [Google Scholar]
- 55.Dai J., Peng T., and Yu X. (2021). NK6 Homeobox 2 Regulated Gastrokin-2 Suppresses Gastric Cancer Cell Proliferation and Invasion via Akt Signaling Pathway. Cell Biochem Biophys 79, 123–131. 10.1007/s12013-020-00948-9. [DOI] [PubMed] [Google Scholar]
- 56.Garcia I., Aldaregia J., Marjanovic Vicentic J., Aldaz P., Moreno-Cugnon L., Torres-Bayona S., Carrasco-Garcia E., Garros-Regulez L., Egana L., Rubio A., et al. (2017). Oncogenic activity of SOX1 in glioblastoma. Sci Rep 7, 46575. 10.1038/srep46575. [DOI] [PMC free article] [PubMed] [Google Scholar]
- 57.Peters M.J., Joehanes R., Pilling L.C., Schurmann C., Conneely K.N., Powell J., Reinmaa E., Sutphin G.L., Zhernakova A., Schramm K., et al. (2015). The transcriptional landscape of age in human peripheral blood. Nat Commun 6, 8570. 10.1038/ncomms9570. [DOI] [PMC free article] [PubMed] [Google Scholar]
- 58.Wang D., Eraslan B., Wieland T., Hallstrom B., Hopf T., Zolg D.P., Zecha J., Asplund A., Li L.H., Meng C., et al. (2019). A deep proteome and transcriptome abundance atlas of 29 healthy human tissues. Mol Syst Biol 15, e8503. 10.15252/msb.20188503. [DOI] [PMC free article] [PubMed] [Google Scholar]
- 59.Jiang L., Wang M., Lin S., Jian R., Li X., Chan J., Dong G., Fang H., Robinson A.E., Consortium G.T., and Snyder M.P. (2020). A Quantitative Proteome Map of the Human Body. Cell 183, 269–283 e219. 10.1016/j.cell.2020.08.036. [DOI] [PMC free article] [PubMed] [Google Scholar]
- 60.Lee P., Chandel N.S., and Simon M.C. (2020). Cellular adaptation to hypoxia through hypoxia inducible factors and beyond. Nat Rev Mol Cell Biol 21, 268–283. 10.1038/s41580-020-0227-y. [DOI] [PMC free article] [PubMed] [Google Scholar]
- 61.Zhang M., Zhang Y., Ding Y., Huang J., Yao J., Xie Z., Lv Y., and Zuo J. (2022). Regulating the Expression of HIF-1alpha or lncRNA: Potential Directions for Cancer Therapy. Cells 11. 10.3390/cells11182811. [DOI] [PMC free article] [PubMed] [Google Scholar]
- 62.Delaunay S., Rapino F., Tharun L., Zhou Z., Heukamp L., Termathe M., Shostak K., Klevernic I., Florin A., Desmecht H., et al. (2016). Elp3 links tRNA modification to IRES-dependent translation of LEF1 to sustain metastasis in breast cancer. J Exp Med 213, 2503–2523. 10.1084/jem.20160397. [DOI] [PMC free article] [PubMed] [Google Scholar]
- 63.Ladang A., Rapino F., Heukamp L.C., Tharun L., Shostak K., Hermand D., Delaunay S., Klevernic I., Jiang Z., Jacques N., et al. (2015). Elp3 drives Wnt-dependent tumor initiation and regeneration in the intestine. J Exp Med 212, 2057–2075. 10.1084/jem.20142288. [DOI] [PMC free article] [PubMed] [Google Scholar]
Associated Data
This section collects any data citations, data availability statements, or supplementary materials included in this article.