

Abstract
Background:
Type 1 diabetes (T1D) is an autoimmune disease characterized by the destruction of beta cells in the pancreas.
Objective:
This study’s goals were to look at how much CD56 was expressed in the spleen tissue of rats with type 1 diabetes and compare it to rats that were not diabetic.
Methods:
The method used in this study was to give rats type 1 diabetes by giving them Alloxan (120 mg/kg). The rats had diabetes for one month. As soon as the experiment was over, all the animals were put down and prepared for normal biochemical, histology, and immunohistochemical tests.
Results:
The study results revealed that the biochemical findings including glucose, cholesterol, and triglycerides in diabetic group were more significantly higher than that in the control group. The spleen tissue of diabetic rats was more inflamed than that of the control group, as shown by histological results. CD56 expression was much lower in the rats of diabetic group compared to the rats in the control group.
Conclusion:
When looked at as a whole, CD56’s role in diabetes seems to have been lost. This explains why people with type 1 diabetes have inflammatory problems.
Keywords: Type 1 diabetes, CD56, histology, immunohistochemistry, expression
1. BACKGROUND
Introduction to Type 1 Diabetes and Spleen Pathology
Type 1 diabetes (T1D) is an autoimmune disease characterized by the destruction of beta cells in the pancreas (1). Self-destruction of beta cells is attributed to multifactorial immune system dysfunction, in which both cell-mediated and humoral immunity contribute to disease pathogenesis and progression (2). The spleen is involved in inflammation and autoimmunity and has a profound effect on pro- or anti-inflammatory cytokine secretion. Spleen tissue changes can influence the progression of T1D (3). Therefore, the association between spleen tissue pathology and T1D occurrence, T1D development, and T1D animal models will be emphasized. In patients with T1D, homeostasis has become realized due to massive changes in multiple organs, and the main changes involve the immune system (4). The spleen is the first lymphatic organ that receives information about immunity and is a key mediator of the immune response (5). Spleen tissue changes can influence the progression of T1D (6). To date, NOD mice have been successfully used as a classic animal model for a T1D study, lacking CD56+ cells on the splenic surface (7). Therefore, it is important to diagnose the spleen in T1D models (8). The specific mechanisms of spleen tissue damage and T1D in animals are not exactly the same as those in T1D. This study aimed to explore what function CD56 plays in T1D and how changes in spleen tissue damage happen (9).
CD56 Expression and Function in Spleen Tissue
CD56 is abundantly expressed in the nervous system. CD56 is not only found in neurons, though; it has been found on more and more kinds of blood cells (10). It is now widely accepted that CD56 is primarily expressed in natural killer and other immune cell types, and that it can exist in both glycosyl-phosphatidylinositol-anchored as well as membrane-bound forms (11). Expression of CD56 has been shown to change according to pathological conditions, and CD56 is currently under investigation for its potential clinical utility as a diagnostic marker (12). It gears cellular function by serving an immune accessory function, as well as modulating intracellular signaling (13). The spleen is a crucial immune and filtration organ, functionally segregated into distinct splenic compartments, such as the red or white pulp or the marginal zone (14). Studies have shown that CD56 is able to modulate various cellular functions (15). Currently, data are emerging indicating that CD56 can also be expressed by stromal cells, that is, macrophages, fibroblastic reticular cells, as well as some subsets of B cells (16). B cells express alternative products of CD56 mRNA transcription, while the protein product of the electormorph is, to date, yet to be identified (16). Of particular note is that thymic epithelial cells also express CD56, with heightened expression observed in organs of endocrine dysregulation such as the spleen (16). CD56 expression on epithelial cells has previously been implicated in cell adhesion and motility (15).
The Impact of CD56 on Type 1 Diabetes Progression in Rat Models
New treatments for people with type 1 diabetes (T1D) need new drugs that help with more than just lowering blood sugar (17). These drugs mostly protect the immune system. This study aimed to investigate how CD56 affects the seriousness of T1D because natural killer (NK) have crucial roles in the disease progression (17). This study shows, for the first time, CD56 elevation in lymphocyte phenotyping, besides correlating CD56 expression in rat spleen with the characteristic immune changes of autoimmune T1D rats (18). Increased nitric oxide (NO) and arginase production can lead to inflammation of the affected islet (19). Therefore, CD56 can influence disease progression, illustrating the results of possible clinical trials to modify the expression of the CD56 molecule on immune cells (20). As a better understanding of the mechanisms that regulate this relationship develops, more effective therapeutic targets for the targeted modulation of T1D will emerge (20).
2. OBJECTIVE
The study aimed to explore the extent to which CD56 was expressed in the spleen of rats with diabetes and to compare that to rats in the control group.
3. MATERIAL AND METHODS
Preparation of Animals and Induction of the Diabetic Model
The methodology included 20 white male rats that were divided into two groups: a normal group (N = 10) and a diabetes group (N = 10). The study was conducted in the animal facility of the Department of Biology at Yarmouk University, Jordan. The university’s rules show that this project was approved by the IRB. The animal unit was used to get the animals. Weights were taken of the animals before the testing began. Each animal weighed 185±7.3 grams. For this study, a different area in the animal facility was set aside, and the animals were kept in cages there. For one week before the study started, all the rats were treated the same way and kept in the same environment to help them get used to it. Following a 12-hour fast, rats received a single intraperitoneal administration of alloxan monohydrate (Sigma-Aldrich) at a dosage of 120 mg/kg.
This made them diabetic. A commercial glucometer (Glucocheck, HomeMed (Pty) Ltd.) was used daily to monitor the animals’ blood glucose levels, ensuring they remained hyperglycemic (≥200 mg/dl). All of the animals were put to terminate at the end of the one-month study time. The liver organs were taken out, washed with normal saline, and then put in 10% formalin to stay put for 24 hours. After that, the tissues were fixed and colored with hematoxylin and eosin so that they could be examined histologically as usual. More samples were prepared for immunohistochemistry to look at how much CD56 was present, how it interacted with other chemicals, and where it was located.
We developed our immunohistochemistry methods in our lab and have already written about them (21-23). Tissue samples from the spleen were processed, cut into sections, and stuck to charged slides. After the sections were deparaffinized, they were put in tap water. Before immunohistochemical staining on tissue slices, samples were put in a 1% hydrogen peroxide solution for 20 minutes to stop the activity of endogenous peroxidase. After that, phosphate-buffered saline (PBS; pH 7.2–7.4) was used to wash the sections, and 1% bovine serum albumin (BSA) was used to stop any nonspecific binding. The sections were washed with PBS and then put in a humid room for one hour with the main monoclonal antibody solution (CD56, 1:100; Santa Cruz Biotechnology). Following PBS washes, secondary biotinylated antibodies were applied and incubated for 20 minutes. The sections were then treated with streptavidin conjugated to horseradish peroxidase for an additional 20 minutes, followed by PBS washing. Immunohistochemical signals were visualized using diaminobenzidine (DAB), which produced a brown coloration upon reaction. The reaction was stopped by running tap water over the slides. As a counterstain, hematoxylin was used for 30 seconds. The slices were then dried out and mounted with the right medium. The stained parts were looked at with Adobe Photoshop Software version 7.2 to measure the amount of CD56 expression. The biomarker’s brown color and the tissue’s blue counterstain were used to look at micrographs of antibody-stained slides. Expression ratios were calculated by dividing the number of pixels corresponding to the biomarker’s color (brown) by the total pixel count (sum of brown and blue pixels).
Statistical analysis
SPSS version 21.0 was used for the statistical analysis. To compare the results of the two groups, the independent t-test was used. A P-value of less than 0.05 was statistically considered significant. The amounts of CD56 expressed in each group were shown as the mean ± the standard deviation.
4. RESULTS
Biochemical results
Table 1 shows that the glucose level in the control group was 97.5 ± 8.4 mg/dl, while in the diabetes group, it was significantly higher at 265 ± 24.5 mg/dl (p < 0.001). Additionally, cholesterol and triglyceride levels were markedly elevated in the diabetes group compared to the control group, with the mean differences between the two groups also reaching statistical significance (p < 0.001).
Table 1. Biochemical profiles of glucose and lipids in study groups.
| Variable (M±SD) | Control group | Diabetic group | P value |
|---|---|---|---|
| Glucose (mg/dl) | 97.5±8.4 | 265±24.5 | <0.001 |
| Cholesterol (mg/dl) | 72.4±7.6 | 175±13.4 | <0.001 |
| Triglycerides (mg/dl) | 84.8±8.5 | 135.4±19.7 | <0.001 |
Histological findings
Figure 1 demonstrates the normal histological features of the rat spleen tissue. The blue arrow points to the lymphoid germ centers. Red blood cells surround the germ centers (red arrow).
Figure 1. A micrograph of spleen in the control group. Blue arrow points to lymphoid germ centers. Yellow arrow points to red blood cells surrounding the lymphoid germ centers, 10X H&E stain.
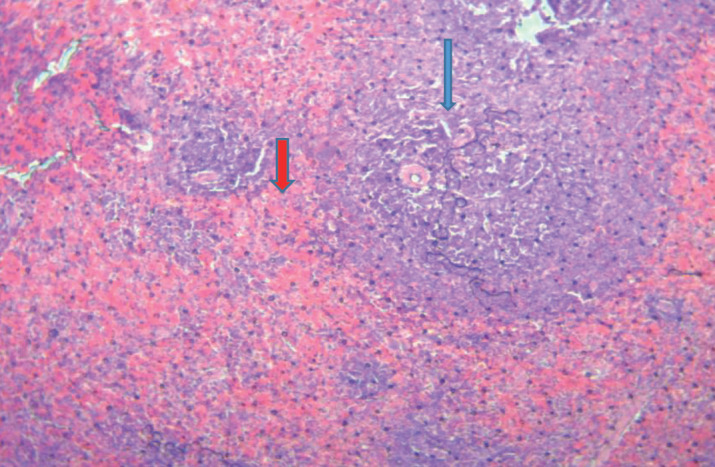
Figure 2 demonstrates the histological features of the spleen tissue of diabetic rats. We observed that red blood cells have infiltrated the germ lymphoid centers (blue arrow).
Figure 2. Histological features of the spleen of diabetic rats, 40X.

CD56 Expression in Study Groups
Figure 3 illustrates CD56 expression in the spleen tissue of the control (non-diabetic) group. CD56 expression is observed in various regions of the spleen tissue; however, it is notably absent in the lymphoid germinal centers (indicated by the blue arrow).
Figure 3. The expression of CD56 in the control group.
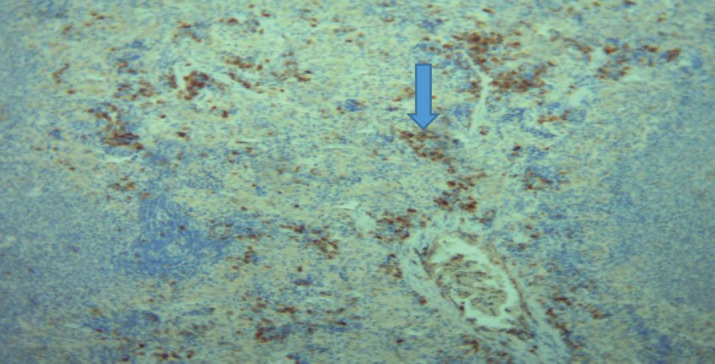
Figure 4 illustrates the expression of CD56 in the spleen of diabetic rats. It is observed that the expression of CD56 is more localized in lymphoid germ center (arrow), but in a lesser level.
Figure 4. The expression of CD56 in the diabetic group.

Mathematical Expression of CD56 in Study Groups
Table 2 and Figure 5 present the expression of CD56 in the study groups. In the control (non-diabetic) group, the CD56 expression is 10,227.13 ± 6,328.53 pixels, whereas in the diabetic group, it is significantly lower at 5,382.07 ± 3,094.64 pixels. The difference between the mean values is statistically significant (p = 0.013).
Table 2. The expression of CD56 in Study groups.
| Variable | M±SD | P value |
|---|---|---|
|
CD56-Control
CD56-Diabetes |
10227.13±6328.53
5382.07±3094.64 |
0.013 |
Figure 5. The mathematical expression of CD56 in study groups.

5. DISCUSSION
Biochemical findings
A lot more glucose was found in the diabetic group (265±24.5 mg/dl) than in the control group (97.5±8.4 mg/dl; p<0.001). This is consistent with hyperglycemia, which is a sign of diabetes mellitus. This jump is because insulin isn’t working or releasing correctly, which makes it hard for the body to absorb glucose. A metabolic problem called dyslipidemia is often linked to diabetes. People with diabetes have high levels of cholesterol and fats (25). Insulin resistance makes fat cells break down fat, which leads to dyslipidemia. This makes the liver make too many lipoproteins because it gets more free fatty acids (22).
People with diabetes are more likely to get heart disease based on these biochemical signs. This shows how important it is to keep your metabolism in check to stay healthy (21-24).
Histological Findings
Taking a close look at the spleen organs of rats with and without diabetes shows that they are very different. Blood cells called red blood cells and clear lymphoid germ centers were evenly spread out in the spleen tissue of healthy rats (Figure 1). On the other hand, it was clear that red blood cells had reached the germ blast centers in diabetic rats (Figure 2). The spleen may be going through changes that could be caused by vascular damage or inflammatory processes. This could be because of having high blood sugar for a long time. A lot of glucose can lead to oxidative stress and inflammation, which can weaken the small blood vessels in the spleen (26).
Rats with diabetes have changes in the shape and function of secondary lymphoid organs like the spleen, which could be linked to the accumulation that was seen (26).
CD56 Expression
CD56 is a sign of natural killer (NK) cells and other immune cells (17, 18). Rats with and without diabetes had different amounts of expression in their spleen organs. In the control group (Figure 3), CD56 wasn’t just found in the lymphoid germ cells but also in other parts of the spleen. The diabetic rats, on the other hand (Figure 4), only had a small amount of CD56 expression in the lymphoid germ cells. We saw that diabetic rats had a lot less CD56 expression (5382.07±3094.64 pixels) than controls (10227.13±6328.53 pixels; p=0.013). This can be seen in Table 2 and Figure 5. It shows that NK cells are not working as well or as heavily as they should because they have less CD56 expression. NK cells help the immune system keep an eye on things and change how it responds (27). Maybe the fact that the expression has dropped and the location has changed means that rats with diabetes may not have as strong of an immune system, which makes them more likely to get infections and inflammatory diseases. Hyperglycemia and reactive stress can change how NK cells work and how long they live (28).
6. CONCLUSION
These findings show that diabetes has many impacts on the metabolic and immune systems. The biochemical numbers show how important it is to keep glucose and lipids under control to lower the risk of all the bad things that can happen with diabetes. The histological and CD56 expression results show that immune organs like the spleen are changed by diabetes in how they look and work. We need to do more study to figure out the chemical processes that lead to these changes and to look into possible immune system-based diabetes treatments.
CD56 appears to have a negative outcome on the spleen due to its role in regulatory T cell injury and its co-expression with CD8 following damaging inflammation in the spleen in the late active stage of diabetic rats. Our research provides an orientation for the role of CD56 in the mechanism of spleen inflammation and sclerosis associated with diseases, which could help in the development of potential treatments and diagnostic tools for diabetic patients. Draining feeding spleen from liver-derived antigens-laden blood, which is able to contribute to the systemic immune response, may exist, but it is necessary to further validate its specific mechanism.
Author’s contribution:
All authors were involved in all steps of preparation this article. Final proofreading was made by the first author.
Conflict of interest:
None declared.
Financial support and sponsorship:
Nil.
REFERENCES
- 1.Skog O, Korsgren O. On the dynamics of the human endocrine pancreas and potential consequences for the development of type 1 diabetes. Acta Diabetologica. 2020 doi: 10.1007/s00592-019-01420-8. Available from: https://springer.com . [DOI] [PMC free article] [PubMed] [Google Scholar]
- 2.Petrelli A, Atkinson MA, Pietropaolo M, Giannoukakis N. Modulation of leukocytes of the innate arm of the immune system as a potential approach to prevent the onset and progression of type 1 diabetes. Diabetes. 2021 Feb 1;70(2):313–322. doi: 10.2337/dbi20-0026. Available from: https://diabetesjournals.org . [DOI] [PMC free article] [PubMed] [Google Scholar]
- 3.Nigi L, Maccora C, Dotta F, Sebastiani G. From immunohistological to anatomical alterations of human pancreas in type 1 diabetes: new concepts on the stage. Diabetes Metab Res Rev. 2020 May;36(4):e3264. doi: 10.1002/dmrr.3264. Available from: https://unisi.it . [DOI] [PubMed] [Google Scholar]
- 4.Queiroz LA, Assis JB, Guimarães JP, Sousa ES, Milhomem AC, Sunahara KK, et al. Endangered lymphocytes: The effects of alloxan and streptozotocin on immune cells in type 1 induced diabetes. Mediators Inflamm. 2021;2021(1):9940009. doi: 10.1155/2021/9940009. Available from: https://wiley.com . [DOI] [PMC free article] [PubMed] [Google Scholar]
- 5.Hao Y, Feng Y, Yan X, Chen L, Zhong R, Tang X, et al. Gut microbiota-testis axis: FMT improves systemic and testicular micro-environment to increase semen quality in type 1 diabetes. Mol Med. 2022 Dec;28(1) doi: 10.1186/s10020-022-00473-w. Available from: https://springer.com . [DOI] [PMC free article] [PubMed] [Google Scholar]
- 6.Jacob N, Jaiswal S, Maheshwari D, Nallabelli N, Khatri N, Bhatia A, et al. Butyrate induced Tregs are capable of migration from the GALT to the pancreas to restore immunological tolerance during type-1 diabetes. Sci Rep. 2020 Nov 5;10(1):19120. doi: 10.1038/s41598-020-76109-y. Available from: https://nature.com . [DOI] [PMC free article] [PubMed] [Google Scholar]
- 7.Huang J, Tan Q, Tai N, Pearson JA, Li Y, Chao C, et al. IL-10 deficiency accelerates type 1 diabetes development via modulation of innate and adaptive immune cells and gut microbiota in BDC2.5 NOD mice. Front Immunol. 2021 Jul 30;12:702955. doi: 10.3389/fimmu.2021.702955. Available from: https://frontiersin.org . [DOI] [PMC free article] [PubMed] [Google Scholar]
- 8.Huang J, Peng J, Pearson JA, Efthimiou G, Hu Y, Tai N, et al. Toll-like receptor 7 deficiency suppresses type 1 diabetes development by modulating B-cell differentiation and function. Cell Mol Immunol. 2021 Feb;18(2):328–338. doi: 10.1038/s41423-020-00590-8. Available from: https://nature.com . [DOI] [PMC free article] [PubMed] [Google Scholar]
- 9.Paez-Mayorga J, Campa-Carranza JN, Capuani S, Hernandez N, Liu HC, Chua CY, et al. Implantable niche with local immunosuppression for islet allotransplantation achieves type 1 diabetes reversal in rats. Nat Commun. 2022 Dec 26;13(1):7951. doi: 10.1038/s41467-022-35629-z. Available from: https://nature.com . [DOI] [PMC free article] [PubMed] [Google Scholar]
- 10.Liu M, Liu J, Zhang X, Xiao Y, et al. Activation status of CD56dim natural killer cells is associated with disease activity of patients with systemic lupus erythematosus. Clin Rheumatol. 2021 doi: 10.1007/s10067-020-05306-x. [HTML] [DOI] [PubMed] [Google Scholar]
- 11.Zhang S, Liu W, Hu B, Wang P, Lv X, Chen S, et al. Prognostic significance of tumor-infiltrating natural killer cells in solid tumors: a systematic review and meta-analysis. Front Immunol. 2020 Jul 2;11:1242. doi: 10.3389/fimmu.2020.01242. Available from: https://frontiersin.org . [DOI] [PMC free article] [PubMed] [Google Scholar]
- 12.Schwane V, Huynh-Tran VH, Vollmers S, Yakup VM, Sauter J, Schmidt AH, et al. Distinct signatures in the receptor repertoire discriminate CD56bright and CD56dim natural killer cells. Front Immunol. 2020 Dec 1;11:568927. doi: 10.3389/fimmu.2020.568927. Available from: https://frontiersin.org . [DOI] [PMC free article] [PubMed] [Google Scholar]
- 13.Chiokadze M, Bär C, Pastuschek J, Dons’koi BV, Khazhylenko KG, Schleußner E, et al. Beyond uterine natural killer cell numbers in unexplained recurrent pregnancy loss: combined analysis of CD45, CD56, CD16, CD57, and CD138. Diagnostics. 2020 Aug 29;10(9):650. doi: 10.3390/diagnostics10090650. Available from: https://mdpi.com . [DOI] [PMC free article] [PubMed] [Google Scholar]
- 14.Kucuksezer UC, Aktas Cetin E, Esen F, Tahrali I, Akdeniz N, Gelmez MY, et al. The role of natural killer cells in autoimmune diseases. Front Immunol. 2021 Feb 25;12:622306. doi: 10.3389/fimmu.2021.622306. Available from: https://frontiersin.org . [DOI] [PMC free article] [PubMed] [Google Scholar]
- 15.Beliën J, Goris A, Matthys P. Natural killer cells in multiple sclerosis: entering the stage. Front Immunol. 2022 doi: 10.3389/fimmu.2022.869447. Available from: https://frontiersin.org . [DOI] [PMC free article] [PubMed] [Google Scholar]
- 16.Uchida T, Seki S, Oda T. Infections, reactions of natural killer T cells and natural killer cells, and kidney injury. Int J Mol Sci. 2022 doi: 10.3390/ijms23010479. Available from: https://mdpi.com . [DOI] [PMC free article] [PubMed] [Google Scholar]
- 17.Curran M, Campbell JP, Powell E, Chikhlia A, Narendran P. The mobilisation of early mature CD56dim CD16bright NK cells is blunted following a single bout of vigorous intensity exercise in Type 1 Diabetes. Exerc Immunol Rev. 2020 Jan 1;26 [HTML] [PubMed] [Google Scholar]
- 18.Largent AD, Lambert K, Chiang K, Shumlak N, Liggitt D, Oukka M, et al. Dysregulated IFN-γ signals promote autoimmunity in STAT1 gain-of-function syndrome. Sci Transl Med. 2023 Jul 5;15(703):eade7028. doi: 10.1126/scitranslmed.ade7028. Available from: https://science.org . [DOI] [PMC free article] [PubMed] [Google Scholar]
- 19.Linsley PS, Greenbaum CJ, Nepom GT. Uncovering pathways to personalized therapies in type 1 diabetes. Diabetes. 2021 doi: 10.2337/db20-1185. Available from: https://diabetesjournals.org . [DOI] [PMC free article] [PubMed] [Google Scholar]
- 20.Mohammadi V, Maleki AJ, Nazari M, Siahmansouri A, Moradi A, Elahi R, et al. Chimeric antigen receptor (CAR)-based cell therapy for type 1 diabetes mellitus (T1DM); current progress and future approaches. Stem Cell Rev Rep. 2024 Apr;20(3):585–600. doi: 10.1007/s12015-023-10668-1. [HTML] [DOI] [PubMed] [Google Scholar]
- 21.Al-Khatib A. Co-expression of iNOS and HSP70 in diabetes type 1 makes a rational hypothesis to explain the diabetic neuropathy. Eur Sci J. 2013;9(3):145–156. [Google Scholar]
- 22.Al-Khatib A, Laiche F, Alkhatatbeh M, et al. Leaf extract of U. pilulifera down-regulates the expression of INOS in kidneys of diabetic rats. Eur Sci J. 2014;10(21):302–9. [Google Scholar]
- 23.Raffee LA, Alawneh KZ, Al-Khatib AJ, AlMehaisen LW. Overexpression of HSP90 in skin of diabetic rats impacts wound healing process. Res J Biol Sci. 2016;11:63–66. [Google Scholar]
- 24.Alsarhan A, Amawi KF, Al-Mazari IS, Hurirah HA, Alkhatib AJ. The compound expression of HSP90 and INOS in the testis of diabetic rats as cellular and pathologic adverse effects of diabetes. Anal Cell Pathol (Amst) 2020;2020:3906583. doi: 10.1155/2020/3906583. Available from: https://doi.org/10.1155/2020/3906583 . [DOI] [PMC free article] [PubMed] [Google Scholar]
- 25.Xia T, Zhan C, Wang T. Hyperglycemia and dyslipidemia in diabetes: Role of the spleen. Curr Diabetes Rep. 2018;18(12):131. [Google Scholar]
- 26.Kowluru RA, Mishra M. Oxidative stress, mitochondrial damage and diabetic retinopathy. Biochim Biophys Acta Mol Basis Dis. 2017;1852(11):2474–2483. doi: 10.1016/j.bbadis.2015.08.001. [DOI] [PubMed] [Google Scholar]
- 27.Vivier E, Raulet DH, Moretta A, et al. Innate or adaptive immunity? The example of natural killer cells. Science. 2008;331(5894):44–49. doi: 10.1126/science.1198687. [DOI] [PMC free article] [PubMed] [Google Scholar]
- 28.Pozzilli P, Leslie RD. Infections and diabetes: Mechanisms and prospects for prevention. Diabetes Technol Ther. 1994;3(6):1057–1063. doi: 10.1111/j.1464-5491.1994.tb00250.x. [DOI] [PubMed] [Google Scholar]