

Abstract

Underground carbon dioxide storage in confined systems becomes a viable alternative to diminish atmospheric concentrations of this gas. Shale reservoirs exhibit mineralogical and pore size heterogeneities that are not deeply analyzed to evaluate the transport and adsorption capacities of carbon dioxide inside their matrix. Functionalized carbon nanotubes and inorganic nanochannels composed of calcite or silicon dioxide are excellent approximations to model the poral throats of the organic and inorganic matrices of shale reservoirs, respectively. In this work, through an extensive molecular dynamics study, we assess the impact on adsorption and transport properties of carboxylic functionalization of the nanochannel surfaces and oxidized inorganic nanochannels, considering only silicon dioxide on pure carbon dioxide and water and carbon dioxide mixtures. We find that the presence of a relevant concentration of carboxylic groups and silicon dioxide on both types of nanochannels significantly reduces the axial velocity of carbon dioxide, owing mainly to their geometrical contributions. Regarding carbon dioxide and water mixtures at different molar fractions, simulations show that there is a relevant increase in water adsorption for both organic and inorganic nanochannels due to strong Coulombic interactions, which partially occlude the available space where carbon dioxide molecules could be adsorbed and displaced. In Figure 1a, we observe how the water molecules nucleate, self-owing to their own Coulombic interactions. On the other hand, in Figure 1b, we observe how this fluid interacts with SiO2, owing to its chemical affinity with the hydrophilic surface. Additionally, based on our findings, the mineralogical composition, the O/C relationship of kerogen, and residual water saturation confined in the nanopores all play a relevant role in defining the storage capacity of carbon dioxide.
1. Introduction
In the last six decades, the concentration of atmospheric carbon dioxide (CO2) has increased from 0.8 to 2.4 ppm per year.1 Nowadays, the average current level of carbon dioxide concentration is ∼421 ppm,2 which has generated serious concerns with regard to progressive global warming.3 CO2 capture and storage (CCS) in geological structures associated with hydrocarbon reservoirs has become one of the most widespread methods to diminish these atmospheric concentrations.4 At present, nearly 80% of the stored CO2 is sequestered through Enhanced Oil Recovery (EOR) techniques (e.g., CO2 huff and puff method5). These EOR methods are applied after primary hydrocarbon recovery is performed in order to increase the reservoir pressure, diminish the viscosity of heavy oil, and thus increase the hydrocarbon recovery factor, making the application much more profitable compared with conventional CO2 geological sequestration.6 This motivates the need to comprehend CO2 storage and hydrocarbon recovery mechanisms at the microscopic level, associated principally with adsorption, molecular diffusion, and fluid flow through shale nanoporous media. These mechanisms are valid for unconventional shale reservoirs, owing to confinement effects generated by the nanoporous media, which are not usually relevant in conventional reservoirs.
Shale reservoir rocks are typically composed of organic (kerogen) and inorganic solid matter. A relevant fraction of their porosity is associated with poorly interconnected nanoscale pores, leading to low permeabilities. It is well-accepted that inorganic pores tend to be hydrophilic, while organic pores are hydrophobic.7 Nevertheless, owing to the presence of oxygenated functional groups (e.g., −OH, −COOH, and >C=O) on kerogen surfaces, mixed wettability could predominate in organic pores.8,9
Throughout the development of shale reservoirs, values of irreducible water range between 15 and 35%.10 This can lead to a reduction in the adsorption and flow capacity of gas in shale nanopores. This issue is even more complex during field operation, where water-based fluids are injected in order to increase the recovery factor of hydrocarbons, with a flowback efficiency lower than 30%.11 This means that a portion of the unrecoverable injected water is probably being adsorbed in shale nanopores.
Experimental analysis and molecular simulations indicate that thermophysical and dynamical properties of fluids highly confined inside nanopores below 10–20 nm-size notably diverge regarding the macroscopical predictions of classical fluid dynamics (e.g., Hagen–Poiseuille flow), due to the prevalence of molecular fluid-surface interactions over fluid–fluid interactions.12−14 This phenomenon induces a molecularly heterogeneous distribution of the fluids, favoring the surface adsorption capacities of the system.15
The nanometric nature of these systems promotes the use of numerical simulations through Molecular Dynamics (MD) to understand the underlying transport and adsorption mechanisms that characterize confined systems.
In this context, many authors have studied the transport properties and adsorption capacities of pure carbon dioxide and mixtures with different water and hydrocarbons saturations. These works employ slits and nanotubes composed of graphene,16−18 different kerogen types,19,20 silica (SiO2),21,22 and calcite (CaCO3),23 to model the organic and inorganic nanopores of shale reservoirs. Particularly, Ravipati et al.23 pointed out that the order of fluid adsorption affinity (φ) (chemical affinity is referred to the tendency of any atom or molecule to combine by chemical reaction with any atom or molecule belonging to a given surface, fluid, or chemical compound of unlike composition24) on calcite pore surfaces has the following preference: φH2O > φCH4 > φCO2 and suggested that neglecting the presence of water saturation inside the pore media could lead to an overestimation of CO2 storage capability and confined methane. Yu et al.25 revealed that the kinetics of CO2 adsorption – CH4 desorption are an order of magnitude faster in immature kerogen than in overmature kerogen. This can be explained by the presence of interconnected pores that contribute to fluid diffusion. Kazemi and Takbiri-Borujeni16 reported that the adsorption capability of CO2 is stronger than CH4 on graphene surfaces, since it has higher affinity with this material. Their results show that the amounts of carbon dioxide storage and methane production increase with the injection pressure. Sun et al.26 analyzed the influence of pore size variation and bulk pressure on the adsorption and diffusion properties of CO2 and CH4, showing that the CH4 displacement and the competitive adsorption of CO2 over CH4 improve as the pore size and confining pressure increase.
Although several molecular models for organic and inorganic nano/microporosity are available in the literature, there is no systematic study that analyzes the adsorption and transport properties of pure CO2 and mixtures of CO2/H2O confined in both types of porous systems simultaneously.
Through an extensive molecular dynamics study, we examined the impact on the adsorption and transport properties of incorporating oxidized organic and inorganic nanochannels. We model the organic nanopores by carbon nanotubes and limit ourselves to −COOH functional groups. The inorganic nanochannels are represented by considering only SiO2. The methodology employed in this paper is directly derived from that of Ramírez et al.9 Contrary to the previous publication, we focus on understanding the interaction of water and adsorption capacities of CO2 with inorganic nanochannels (SiO2), which has huge relevance nowadays for carbon dioxide storage.
Although this type of analysis has been developed applying different types of models (for example, real kerogen,27 silicates,28,29 calcites,30 and different types of clay31,32), there is almost no recent publication that compares the storage and hydrodynamics of different confined reservoir fluids (water and methane,33 for example) inside the organic/inorganic nanopore structure of shale reservoirs. However, the main limitation of our model is using graphene to represent organic nanopores in shale reservoirs. This simplification is more representative in overmature kerogen. Nevertheless, the focus of this paper is to be able to analyze how polar molecules, such as water, diminish the available pore volume for carbon dioxide capture.
Finally, the novelty of this paper is radiated in the systematical analysis of the physical–chemical effects of H2O and CO2 considering the organic (graphene and functionalized graphene) and inorganic (SiO2) components of the rock, and how different water saturation values alter CO2 adsorption.
The organization of the paper is as follows: in Section 2, we explain the implemented nanochannels and fluid models as well as describe MD simulations. The results of extensive numerical simulations on the implemented systems are introduced and discussed in Section 3. Finally, in Section 4, we summarize the relevant results and conclusions.
2. Methods
We employ MD simulations to analyze the equilibrium and nonequilibrium behavior of fluids on modified surface nanochannels with carboxylic groups (F-CN) and oxidized nanochannels with silicon dioxide (O-SN) (Figure 1) utilizing the LAMMPS34 toolkit. The simulation system is composed of three types of nanochannels, as illustrated on Figure 2: carbon nanochannels with different concentrations of carboxylic group on their surfaces (Figure 2a), silicon nanochannels with a fixed concentration of silicon dioxide on their surfaces (Figure 2b), and pure carbon nanochannels (Figure 2c). For all cases considered, we employ a simulation box where the boundary conditions in each direction are periodic (Lx = 10 nm, Ly = [4–8] nm, and Lz = [4–8] nm). Interactions are mediated via a Lennard–Jones potential. We apply a cutoff (ρi) given by a range of 2.5σLJi ≤ ρi ≤ 4σLJi, where i is the label for the interaction pair, and σLJi is the LJ potential well depth. Afterward, we designate a global cutoff ρG = max(ρi) to evade any interaction with the periodic image. Lx coincides with the box length L of the nanochannel. Simulations are generally performed in situations where the aspect ratio (R/L) is below 0.35. Fluid molecules are introduced into each implemented nanochannel considering bulk density values. This is done by looking up bulk density values at a given reservoir temperature (T) using the NIST database.35 We compute and control the temperature through the canonical ensemble (NVT). Finally, the target temperature is obtained by using a Nose–Hoover thermostat, applying an accurate damping time (TDamp ∼ 100 × timesteps) to avoid wild temperature fluctuations or long time periods to equilibrate the temperature.36,37
Figure 1.

(a) Nonfunctionalized carbon nanochannel (CN) with R = 3 nm composed by carbon atoms (cyan), saturated with CO2 (dark orange and silver) and H2O (white and red). (b) Silicon dioxide nanochannel (O-SN) with R = 3 nm is composed of silica atoms (orange) with silicon dioxide (lime) randomly distributed along the nanochannel.
Figure 2.

(a) Functionalized carbon nanochannel (F-CN) with R = 3 nm composed of carbon atoms (cyan) with carboxylic groups (blue/pink) randomly distributed along the nanochannel. (b) Silicon dioxide nanochannel (O-SN) with R = 3 nm composed of silica atoms (orange) with silicon dioxide (lime) randomly distributed along the nanochannel. (c) Carbon nanochannel (CN) with R = 3 nm is constituted by carbon atoms (cyan). Particles are displaced along the nanochannel by an axial pressure gradient.
We introduce around 1000/3500 pure carbon dioxide molecules and 1900/6500 water/carbon dioxide molecules inside the system and then perform molecular simulations applying a runtime between 30 and 50 ns. To achieve a steady-state condition, only 15–30% of the total simulation time is needed; the remaining time is used to register velocity and density distributions, from which the average observables are calculated.
2.1. Implementation Details
We consider two fluids: water and carbon dioxide. Water is always present in shale pores and will affect the carbon dioxide storage capacity because of its influence on adsorption and transport mechanisms.
Our simulations employ the SPC/E water model38 in conjunction with the SHAKE algorithm,39 assuring the required rigidity of the model. Additionally, for carbon dioxide molecules, the harmonic potential field40 is applied. Lennard–Jones41 (LJ) potentials are used to depict interatomic interactions between fluid molecules, incorporating electrostatic contributions for charged ions. For water molecules, Coulombic interactions are calculated through employing the particle–particle-particle mesh42 (PPPM) algorithm, while the particle mesh Ewald43 (PME) algorithm is used to compute CO2–CO2 interactions. The Lennard–Jones and Coulombic potentials are described by
| 1 |
where σ and ε correspond to the LJ characteristic parameters for molecule interactions, r is the distance between particles, ε0 is the vacuum permittivity, and qi and qj are the partial charges placed on the carbon, silicon, oxygen, and hydrogen sites. The characteristic parameters are computed to depict the interaction among different fluids (carbon dioxide and water), and the Lorentz–Berthelot combination rules44 are employed.
In Table 1, we show the LJ parameters45,46 and atomic charges utilized for particles of both fluid molecules. In Table 2, we show the parameters related to atoms of the F-CN and O-SN. For Coulombic interactions, we employ a cutoff equal to 3σatom.
Table 1. Lennard–Jones Parameters and Partial Charges for Fluid Molecules Particles.
| atom | σ [nm] | ε [kcal/mol] | q [e] |
|---|---|---|---|
| OH2O | 0.3166 | 0.1553 | –0.8476 |
| HH2O | 0 | 0 | 0.4238 |
| CCO2 | 0.28 | 0.05365 | 0.7 |
| OCO2 | 0.305 | 0.157 | –0.35 |
Table 2. Lennard–Jones Parameters and Computed Charges for F-CN, O-SN, SiO2, and the COOH Groups.
| atom | σ [nm] | ε [kcal/mol] | q [e] |
|---|---|---|---|
| C1–COOH | 0.34 | 0.0556 | 1.44 |
| C2–COOH | 0.34 | 0.0556 | 0.14 |
| O1–COOH | 0.31 | 0.157 | –1.12 |
| O2–COOH | 0.31 | 0.157 | –1.10 |
| H1–COOH | 0.1331 | 0.0596 | 0.64 |
| SiSiO2 | 0.356 | 0.05 | 1.1 |
| OSiO21 | 0.312 | 0.025 | –0.55 |
| OSiO22 | 0.356 | 0.05 | –0.783 |
COOH charges are calculated using the Quantum Expresso package,47 applying Vanderbilt ultrasoft pseudopotentials48,49 and the exchange-correlation functional (revPBE).50 Computed values are in acceptable agreement with the atom charges reported by Liu and Wilcox,51 and SiO2 LJ parameters and charges are obtained from Heinz and Suter52 and Cole et al.53 F-CNs (O-SNs) are modeled through amorphous carbon (silicon) channels, where carbon (silicon) atoms are randomly distributed on a cylinder of specific radius and length. We select nanochannels with 1.5 nm ≤ R ≤ 3.5 nm, considering computational efficiency and owing to the characteristic pore sizes found in both organic and inorganic matrices of shale reservoirs, which are typically below 10 nm.54 The distance between first-neighbor carbon atoms and particle areal density are constrained to equivalent values of 0.142 and 38 nm–2, respectively. These values correspond to graphene. The average distance between Si–Si atoms and particle areal density are consistent with Ishimaru et al.,55 being of 0.2 and 49.96 nm–2, respectively. We place distinct surface concentrations of COOH and SiO2, randomly distributed on the inner surface of the nanochannels. The quantity of carboxylic groups or silicon dioxide bonded with carbon or silicon atoms is determined by its percentual surface concentration x:
| 2 |
where na is the number of COOH (or SiO2) and nb is the number of C (or Si) in the nanochannel. Throughout this paper, we contemplated variations of x in the range of 0–10, labeling these as F-CN and O-SN, respectively.
All MD simulations are implemented at a temperature of T = 400 K (applying the Nose–Hoover thermostat). Furthermore, the axial external force applied through these systems corresponds to a pressure gradient ΔP/L = 10 atm/nm, determined by
| 3 |
where N and V are the amount of fluid molecules and the nanochannel’s volume, respectively. High-pressure drops are necessary to reduce simulation time, and this selection does not alter the results owing to the fact that the linear dependence of flow rates against pressure gradient holds.12 In most of the executed simulations, the total runtime ranges between 30 and 50 ns, employing a time step of 0.5 ns for each fluid and its mixtures.
We follow up the molecular density evolution during the transport stage (after reaching the steady-state condition) by averaging values in concentric annular regions of the nanochannel. This allowed us to obtain radial density and velocity profiles. Since the number of fluid molecules in these control zones could be fairly small, we choose to perform longer simulations to ensure reasonable statistics.
3. Results and Discussion
In order to study the adsorption and transport properties of carbon dioxide and water molecules, we employ highly confined nanopores to represent hydrophilic and hydrophobic surfaces, which are typically found in the organic and inorganic matrices of shale reservoirs. We begin by analyzing the physical mechanisms for pure CO2 to then study those of the mixture.
3.1. Carbon Dioxide Adsorption in Equilibrium
Confinement effects present in nanoporous media strongly impact fluid transport, owing to intermolecular interactions between the fluid and the surface. To appraise the impact of the carboxylic groups and silicates, we study, through equilibrium simulations, partially saturated systems with carbon dioxide under typical shale reservoir conditions, namely, at T = 400 K and P̅ = 450 atm (ρCO2 = 0.168 g/cm3). Low fluid densities allow us to observe the molecular distribution of the fluid confined inside the nanochannels, as displayed in Figure 3.
Figure 3.
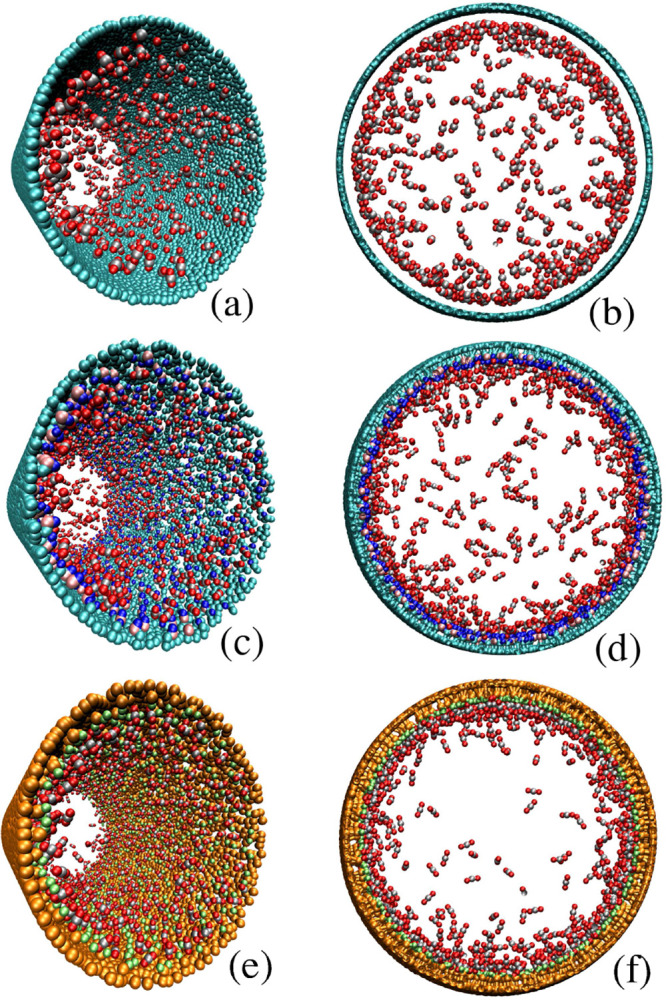
Diluted carbon dioxide (silver/red) distribution in the nanochannels. For CN without carboxylic groups (x = 0), carbon dioxide molecules tend to adsorb over the CN surface (a,b) for F-CN with x = 10 (c,d), carbon dioxide molecules nucleate around both carbon atoms and carboxylic groups. For the O-SN (x = 10) (e,f), carbon dioxide molecules nucleate around the SiO2 in all cases.
Regarding nonfunctionalized CN (Figure 3a,b), F-CN (Figure 3c,d), and O-SN (Figure 3e,f), these surfaces have a strong affinity for CO2, owing to their strong molecular interactions.56 These interactions are generated only by van der Waals forces, which are represented by the LJ potential, due to the linearity of the CO2 molecule and the fact that the dipole moments of each bond cancel each other out. Qualitatively, in Figure 3, we observed slight differences in the molecular distribution of this fluid. These illustrations are supported through molecular density distributions (Figure 4), where slight increments in the adsorbed layers of fluid are shown. Particularly, the presence of carboxylic groups and silicon dioxide randomly distributed over the surfaces yields to up to a 15% increase of the adsorbed layer, with respect to the case of nonfunctionalized CN. This phenomenon can be attributed to the difference between the depth of the potential well (ε) of each surface.57 In our previous work,9 we observed similar differences on the adsorbed layers, confining methane inside nonfunctionalized CN and F-CN.
Figure 4.

EMD radial density profiles for pure carbon dioxide confined inside a CN with x = 0, F-CNs with x = 10 of COOH, and a O-SN with x = 10 of SiO2.
3.2. Carbon Dioxide Transport Properties
To assess the effect of COOH groups and SiO2 on the transport properties of CO2, we employ different surface concentrations of both components. We implemented NEMD simulations at T = 400 K and P̅ = 450 atm, where the bulk density is ρCO2 = 0.716 g/cm3. Unlike the EMD simulations contemplated in the previous section, there is an impulsing force in the axial coordinate (corresponding to a specific a longitudinal pressure gradient) that generates the molecular fluid flow.
In Figure 5, we plot the carbon dioxide density distribution and the axial velocity profile for F-CNs and O-SN with R = 3 nm.
Figure 5.

Radial density (a) and velocity (b) profiles for pure carbon dioxide confined inside a CN with x = 0, F-CNs with x = 5 and x = 10 of COOH, and a O-SN with x = 10 of SiO2.
It is quite interesting to point out that at this density value (as can be seen in Figure 5), the presence of carboxylic groups on the CN surface and SiO2 on the inorganic surface does not noticeably modify the molecular distributions in the radial coordinate, at least at this density value. This statement is quantitatively supported by computing the number of molecules in the adsorbed layer over each implemented system. Establishing two control zones, a cylindrical in the neighborhood of the nanochannels axis (0 ≤ r ≤ 3R/4) and a surface region in contact with the nanochannel wall (3R/4 ≤ r ≤ R), we observed differences lower than 2%, denoting that the main impact of these oxygenated groups could be on the molecular velocities of the fluid.
To analyze the impact on molecular velocities considering both oxidized organic and inorganic nanochannels, as shown in Figure 5b, we plot the axial velocity profiles for nanochannels with R = 3 nm, where the surface density of carboxylic groups is established in the range x ∈ [0, 10], and the surface density of silicon dioxide is fixed (x = 10). For nonfunctionalized CN (x = 0), the molecular velocities are not influenced by their distance from the nanochannel surface. Instead, for both F-CN with x = 5 and x = 10 and for O-SN with x = 10, we observed a severe reduction of axial velocities (93–95%) with a typical parabolic profile behavior represented by a Hagen–Poiseuille equation with slip boundary conditions.12 This significant reduction in molecular velocities is owing to the steric effects caused by the presence of COOH groups9 and SiO258 distributed over the nanochannel surface. Analogously, steric effects produced by carboxylic groups on molecular flow are reported by Qiu et al.59 and Ramírez et al.9
To reinforce the previous qualitative behavior of the different velocity profiles, as shown in Figure 6, we analyze the power-law behavior of the mean axial velocity as a function of the nanochannel radius. As we expected, the molecular velocity has its maximum values when a nonfunctionalized CN is employed and does not show strong dependence on the radius, which can be qualitatively interpreted as a transition between effusion (V̅x ∝ R0) and Knudsen-like flow (V̅x ∝ R1).60 Contrarily, for F-CN with x = 5 and x = 10 and O-SN with x = 10 on their surfaces, the molecular velocities are drastically reduced due to the associated roughness effects over these surfaces. This roughness is generated by the oxygenated groups and leads to a significant dependence of velocity with the radius. These behaviors can be qualitatively described by the slipping Hagen–Poiseuille relationship (V̅x ∝ R2).12 Furthermore, confinement effects (pore radius reduction), steric effects generated by carboxylic groups and silicon dioxide, and pore volume reduction, owing to the presence of polar molecules like water, significantly reduce the mean axial velocities by almost two orders of magnitude.
Figure 6.

Mean axial velocity as a function of the nanochannel radius for pure carbon dioxide confined inside a CN with x = 0, F-CNs with x = 5, x = 10 of COOH, and a O-SN with x = 10 of SiO2. Numerical data were fitted with power-law (log–log plot) dependencies, whose exponents are indicated through the slope values (n).
3.3. Adsorption Patterns of Carbon Dioxide–Water Mixtures in Equilibrium
Up until now, we have analyzed the adsorption and transport properties of pure carbon dioxide-saturated systems. The next step is to focus on cases wherein nanochannels are saturated with a mixture of water and carbon dioxide. To study the impact on the molecular adsorption of SiO2 and COOH groups, we perform EMD simulations employing partially saturated systems with a fixed CO2–H2O molar fraction composition (0.7–0.3), under typical shale reservoir conditions, namely, T = 400 K and P̅ = 450 atm (ρCO2 = 0.281 g/cm3 and ρH2O = 0.049 g/cm3). These density values enable us to identify the molecular distribution of both fluids along the radial coordinate of the nanochannels. Regarding nonfunctionalized surfaces (Figure 7a), we observed that the carbon dioxide molecules are distributed heterogeneously along the surface owing to their strong affinity with carbon atoms. On the contrary, water molecules tend to prioritize interactions between themselves over interactions with the surface. Regarding the presence of carboxylic groups (Figure 7b,c), for both surface concentrations (x = 5 and x = 10), water molecules nucleate around these groups due to their strong Coulombic attractive interactions; meanwhile, carbon dioxide molecules are only adsorbed through van der Waals forces generated by highly confined systems. Therefore, there is a significant quantity of CO2 molecules located near the center of the nanochannels.
Figure 7.

CO2 (silver/dark orange)–H2O (red/white) mixtures confined in the nanochannels. For a CN (side view) with x = 0 (a), water molecules form a single nanodrop which is displaced through the center of the CN, while carbon dioxide molecules flow through the entire radial coordinate. For F-CNs with x = 5 (b), x = 10 (c) of COOH groups, and a O-SN with x = 10 (d) of SiO2, water molecules nucleate around these as long as CO2 molecules are dispersed inside the system.
In the presence of inorganic silica surfaces (Figure 7d), a similar adsorption is observed. Nonetheless, there is a significant increase of the adsorbed molecular layer of water, as a consequence of the enhancement of Coulombic interactions.
These findings are supported by the molecular distribution profiles along the radial coordinate (Figure 8), where the different adsorption patterns of both fluids are explicitly exhibited on each implemented surface.
Figure 8.

EMD radial density profiles for a CO2 −H2O mixture confined inside a CN with x = 0 (a), F-CNs with x = 5 (b) and x = 10 (c) of carboxylic groups, and a O-SN with x = 10 (d) of SiO2.
3.4. Transport Properties of Carbon Dioxide–Water Mixtures
Formerly, we focused our attention on the analysis of transport properties of pure carbon dioxide. We now shift our attention to cases where the organic and inorganic nanochannels are saturated with different CO2–H2O molar fractions (Figure 9). Therefore, through NEMD simulations at T = 400 K and P̅ = 450 atm (considering bulk densities of the mixture), we study how the distinct implemented surfaces change molecular adsorption and how this impacts the molecular velocities of both fluids.
Figure 9.

CO2 (silver/dark orange) and H2O (red/white) mixtures confined in the nanochannels. For a CN (side view) with x = 0 (a), water molecules form a single nanodrop which is displaced through the center of the CN, while carbon dioxide molecules flow through the entire radial coordinate. For F-CNs with x = 5 (b), x = 10 (c) of COOH groups, and a O-SN with x = 10 (d) of SiO2, water molecules nucleate around these groups along the nanochannel surface, as long as CO2 molecules are dispersed inside the system.
In Figure 10, we plot radial density profiles employing nonfunctionalized CN, F-CN with x = 5, x = 10 of carboxylic groups, and O-SN with x = 10 of silicon dioxide. Since we obtained similar qualitative behavior in the molecular distribution of both components at different molar fractions, we consider a fixed concentration of 70% carbon dioxide and 30% water. Regarding nonfunctionalized CN (Figure 10a), the hydrophobic surface induces the formation of nanodroplets from water molecules, a direct consequence of the prioritization of their intermolecular interactions. Conversely, due to the affinity with the carbon particles, carbon dioxide molecules are distributed throughout the CN, forming an adsorbed layer over the surface.
Figure 10.

Radial density profiles for a CO2–H2O mixture confined inside a CN with x = 0 (a), F-CNs with x = 5 (b), and x = 10 (c) of carboxylic groups, and a O-SN with x = 10 (d) of SiO2. Densities considered of each component are ρCO2 = 0.501 g/cm3 and ρH2O = 0.287 g/cm3.
In contrast, when a relevant fraction of carboxylic groups are located over the surface (Figure 10b,c), the hydrophilicity induces nucleation of water molecules around these groups due to their relevant Coulombic interactions with this fluid. Hence, water molecules are extended along the F-CN, forming clusters over the surface, as carbon dioxide molecules are confined to the center of the nanochannel. With respect to the inorganic surface (Figure 10d), we observe the same qualitative behavior, but due to their stronger affinity with water molecules, there is enhanced adsorption of this fluid.
Up to now, we have analyzed the molecular distribution of CO2/H2O mixtures over organic and inorganic surfaces, employing a fixed molar fraction of each component. We now turn the discussion to different CO2–H2O molar fraction compositions confined inside F-CNs and O-SNs in order to explore how surfaces of different natures impact the transport properties. Figure 11a–c shows the molecular distributions of carbon dioxide and water confined inside F-CNs (x = 5) for distinct Sw values. As the water molar fraction composition increases, the adsorbed water layer thickness grows due to the Coulombic attractive interactions with the carboxylic groups and their own intermolecular interactions. This, in turn, obstructs the accessible space where the carbon dioxide molecules are displaced. These pictures are supported by the molecular distribution of water (Figure 11d) and the axial velocity profiles of carbon dioxide (Figure 11e). It is worth mentioning that the reduction of the axial velocity of CO2 is not constrained to the vicinity of the nanochannel surface but also in the whole volume. To reinforce the previous results, in Figure 11f, we plot the normalized molecular velocity V̅x/V̅x(x = 0) as a function of water saturation Sw for F-CNs with x = 5 and x = 10 and for O-SNs with x = 10. It is interesting to see how a water saturation of Sw = 20% reduces the velocity of CO2 by approximately 96% for both F-CNs and O-SNs. As Sw increases, the mean axial velocity of carbon dioxide continues to decrease due to a relevant increase of the adsorbed water molecules along the surface, which partially occludes the nanochannel, reducing the space available for carbon dioxide to flow. Furthermore, we observe a critical water saturation point where water molecules contribute to the total flow. As we expected, the mean axial velocity of water increases with Sw.
Figure 11.

CO2 (silver/orange)–H2O (red/white) mixtures confined inside of F-CNs with x = 5 of carboxylic groups composed by Sw = 20% (a), Sw = 40% (b), and Sw = 60% (c). (d) Radial density profiles for F-CNs (x = 5) filled with carbon dioxide–water mixtures, which represent the water molecules distributed along the surface. (e) Axial velocity profiles for F-CNs (x = 5) filled with carbon dioxide–water mixtures, which depict the velocity distribution of carbon dioxide. (f) Normalized mean axial velocity V̅x/V̅x(x = 0) of CO2 and H2O as a function of water saturation Sw for a CO2–H2O mixtures confined inside a CN with x = 0, F-CNs with x = 5, x = 10 of COOH, and a O-SN with x = 10 of SiO2. From this definition, V̅x/V̅x(x = 0) = 1 for nonfunctionalized CN. The width of these nanochannels is set to R = 3 nm.
These results may provide an insight into the carbon dioxide storage capacities of shale reservoirs, considering not only their heterogeneous matrix from a mineralogical point of view but also different levels of water saturation confined inside their nanoporous media.
4. Summary and Conclusions
We have presented a detailed analysis of the adsorption and transport properties of carbon dioxide and carbon dioxide–water mixtures confined inside organic (F-CN) and inorganic (O-SN) nanochannels through MD simulations. Simulations carried out at low densities demonstrate that a small presence of carboxylic groups and silicon dioxide (x∼5%) on the surface of the nanochannel increases the adsorption of carbon dioxide by up to 15%. On the other hand, after carefully analyzing the results from NEMD simulations, we conclude that the presence of low concentrations of COOH groups and SiO2 (x ∼ 5%) along the surface of these systems does not significantly modify the carbon dioxide distribution inside the nanochannel. Nevertheless, the axial velocities are being severely reduced by 93–95%, which is attributed to the geometrical contribution of these oxygenated groups. Furthermore, we observed a qualitative change in the behavior of velocity profiles when surface oxidations are applied.
Regarding CO2–H2O mixtures, EMD simulations performed for F-CNs and O-SN, partially saturated with a fixed molar fraction of every compound, reveal that in the absence of carboxylic groups, water molecules tend to form a large droplet, while the carbon dioxide molecules are distributed along the carbon surface. Contrarily, in the cases of hydrophilic surfaces, water molecules nucleate heterogeneously owing to the relevant Coulombic attractive interactions with the COOH groups and SIO2, leaving the carbon dioxide molecules confined to the center of the system. Finally, after performing CO2–H2O NEMD simulations at different water saturations, we observe that for F-CN and O-SN, there is a relevant increase in the thickness of the water adsorbed layer, which partially occludes the space available for carbon dioxide displacement. Moreover, the reduction of the axial velocity of CO2 is not limited to the vicinity of the nanochannel wall, but extends to the complete system volume.
These results may have relevant consequences on the storage capacity of CO2, considering the mineralogical composition of shale reservoirs and the residual water adsorbed on their nanoporous media.
Acknowledgments
The author thanks YPF Tecnología S.A., CONICET (Argentina National Research Council) for their support. Particularly, the author thanks Carlos M. Carlevaro Ph.D and Esteban A. Domené for their professionalism and their technical support.
The author declares no competing financial interest.
References
- Lindsey R.Climate Change: Atmospheric Carbon Dioxide, 2022. https://www.climate.gov/news-features/understanding-climate/climate-change-atmospheric-carbon-dioxide.
- Stein T.Carbon dioxide now more than 50% higher than pre-industrial levels, 2022. https://www.noaa.gov/news-release/carbon-dioxide-now-more-than-50-higher-than-pre-industrial-levels.
- Aminu M. D.; Nabavi S. A.; Rochelle C. A.; Manovic V. A review of developments in carbon dioxide storage. Applied Energy 2017, 208, 1389–1419. 10.1016/j.apenergy.2017.09.015. [DOI] [Google Scholar]
- Blunt M.Carbon dioxide storage. In Grantham Institute for Climate Change Briefing Paper No 4; Imperial College London, 2010. [Google Scholar]
- Zhou X.; Yuan Q.; Peng X.; Zeng F.; Zhang L. A critical review of the CO2 huff and puff process for enhanced heavy oil recovery. Fuel 2018, 215, 813–824. 10.1016/j.fuel.2017.11.092. [DOI] [Google Scholar]
- Kelemen P.; Benson S. M.; Pilorgé H.; Psarras P.; Wilcox J. An overview of the status and challenges of CO2 storage in minerals and geological formations. Front. Clim. 2019, 1, 9. 10.3389/fclim.2019.00009. [DOI] [Google Scholar]
- Odusina E.; Sondergeld C.; Rai C. In An NMR study on shale wettability, Canadian Unconventional Resources Conference, 2011.
- Hu Y.; Devegowda D.; Sigal R. A microscopic characterization of wettability in shale kerogen with varying maturity levels. Journal of Natural Gas Science and Engineering 2016, 33, 1078–1086. 10.1016/j.jngse.2016.06.014. [DOI] [Google Scholar]
- Ramírez M. M.; Sánchez V. M.; Castez M. F.; Winograd E. A. Diminished Fluid Transport through Carbon Nanochannels Induced by COOH Functionalization: Implications for Nanofiltration and Oil Recovery. ACS Applied Nano Materials 2021, 4, 11505–11512. 10.1021/acsanm.1c01846. [DOI] [Google Scholar]
- Hu Z.; Duan X.; He Y.; Wu J.; Chang J.; Liu L.; Wu K.; Ma Z. Influence of reservoir primary water on shale gas occurrence and flow capacity. Natural Gas Industry B 2019, 6, 71–78. 10.1016/j.ngib.2019.01.010. [DOI] [Google Scholar]
- Ge H.-K.; Yang L.; Shen Y.-H.; Ren K.; Meng F.-B.; Ji W.-M.; Wu S. Experimental investigation of shale imbibition capacity and the factors influencing loss of hydraulic fracturing fluids. Petroleum Science 2015, 12, 636–650. 10.1007/s12182-015-0049-2. [DOI] [Google Scholar]
- Castez M.; Winograd E.; Sánchez V. Methane Flow through Organic-Rich Nanopores: The Key Role of Atomic-Scale Roughness. J. Phys. Chem. C 2017, 121, 28527–28536. 10.1021/acs.jpcc.7b09811. [DOI] [Google Scholar]
- Zhao S.; Hu Y.; Yu X.; Liu Y.; Bai Z.-S.; Liu H. Surface wettability effect on fluid transport in nanoscale slit pores. AIChE J. 2017, 63, 1704–1714. 10.1002/aic.15535. [DOI] [Google Scholar]
- Liu X.; Zhang L.; Zhao Y.; He X.; Wu J.; Su S. Shale gas transport in nanopores: Contribution of different transport mechanisms and influencing factors. Energy Fuels 2021, 35, 2033–2047. 10.1021/acs.energyfuels.0c03463. [DOI] [Google Scholar]
- Jin Z.; Firoozabadi A. Flow of methane in shale nanopores at low and high pressure by molecular dynamics simulations. J. Chem. Phys. 2015, 143, 104315. 10.1063/1.4930006. [DOI] [PubMed] [Google Scholar]
- Kazemi M.; Takbiri-Borujeni A. In Molecular dynamics study of carbon dioxide storage in carbon-based organic nanopores, SPE Annual Technical Conference and Exhibition, 2016.
- Shi K.; Chen J.; Pang X.; Jiang F.; Hui S.; Pang H.; Ma K.; Cong Q. Effect of wettability of shale on CO2 sequestration with enhanced gas recovery in shale reservoir: Implications from molecular dynamics simulation. Journal of Natural Gas Science and Engineering 2022, 107, 104798 10.1016/j.jngse.2022.104798. [DOI] [Google Scholar]
- Yuan Q.; Zhu X.; Lin K.; Zhao Y.-P. Molecular dynamics simulations of the enhanced recovery of confined methane with carbon dioxide. Phys. Chem. Chem. Phys. 2015, 17, 31887–31893. 10.1039/C5CP06649B. [DOI] [PubMed] [Google Scholar]
- Li W.; Zhang M.; Nan Y.; Pang W.; Jin Z. Molecular dynamics study on CO2 storage in water-filled kerogen nanopores in shale reservoirs: effects of kerogen maturity and pore size. Langmuir 2021, 37, 542–552. 10.1021/acs.langmuir.0c03232. [DOI] [PubMed] [Google Scholar]
- Gomaa I.; de Araujo I. S.; Heidari Z.; Espinoza D. N. In Molecular Simulation Study of the Competitive Adsorption of Carbon Dioxide and Methane in Organic Shale–Implication for Enhanced Gas Recovery, SPE/AAPG/SEG Unconventional Resources Technology Conference, 2023; p D011S019R001.
- Zhao J.; Wang Z.; Guo P.; Luo Q. Molecular level investigation of methane and carbon dioxide adsorption on SiO2 surface. Comput. Mater. Sci. 2019, 168, 213–220. 10.1016/j.commatsci.2019.05.044. [DOI] [Google Scholar]
- Liu B.; Li X.; Qi C.; Mai T.; Zhan K.; Zhao L.; Shen Y. Pressure-driven supercritical CO 2 transport through a silica nanochannel. RSC Adv. 2018, 8, 1461–1468. 10.1039/C7RA11746A. [DOI] [PMC free article] [PubMed] [Google Scholar]
- Ravipati S.; Santos M. S.; Economou I. G.; Galindo A.; Jackson G.; Haslam A. J. Monte carlo molecular simulation study of carbon dioxide sequestration into dry and wet calcite pores containing methane. Energy Fuels 2021, 35, 11393–11402. 10.1021/acs.energyfuels.1c00888. [DOI] [Google Scholar]
- de Berg K. C.The Iron(III) Thiocyanate Reaction: Research History and Role in Chemical Analysis; Springer International Publishing: Cham, 2019; pp 41–52. [Google Scholar]
- Yu K. B.; Bowers G. M.; Yazaydin A. O. Supercritical carbon dioxide enhanced natural gas recovery from kerogen micropores. Journal of CO2 Utilization 2022, 62, 102105 10.1016/j.jcou.2022.102105. [DOI] [Google Scholar]
- Sun H.; Zhao H.; Qi N.; Li Y. Simulation to enhance shale gas recovery using carbon dioxide in silica nanopores with different sizes. Energy Technology 2017, 5, 2065–2071. 10.1002/ente.201700166. [DOI] [Google Scholar]
- Liu J.; Zhao Y.; Yang Y.; Mei Q.; Yang S.; Wang C. Multicomponent shale oil flow in real kerogen structures via molecular dynamic simulation. Energies 2020, 13, 3815. 10.3390/en13153815. [DOI] [Google Scholar]
- Pace T.; Rahmaninejad H.; Sun B.; Kekenes-Huskey P. M. Homogenization of continuum-scale transport properties from molecular dynamics simulations: an application to aqueous-phase methane diffusion in silicate channels. J. Phys. Chem. B 2021, 125, 11520–11533. 10.1021/acs.jpcb.1c07062. [DOI] [PubMed] [Google Scholar]
- Dou X.; Li H.; Hong S.; Peng M.; He Y.; Qian K.; Guo L.; Ma B. Mathematical Model of the Migration of the CO2-Multicomponent Gases in the Inorganic Nanopores of Shale. Processes 2024, 12, 1679. 10.3390/pr12081679. [DOI] [Google Scholar]
- Spera M. B.; Braga F. N.; Bartolomeu R. A.; Economou I. G.; Franco L. F. Diffusion of fluids confined in carbonate minerals: A molecular dynamics simulation study for carbon dioxide and methane–ethane mixture within calcite. Fuel 2022, 325, 124800 10.1016/j.fuel.2022.124800. [DOI] [Google Scholar]
- Chen J.; Xu J.; Zhang Z.; Liu C.; Hu G.; Ding T.; Hao Y.; Wang X. Insight on the stability of methane hydrate in montmorillonite slits by molecular dynamics simulations. Appl. Surf. Sci. 2024, 654, 159413 10.1016/j.apsusc.2024.159413. [DOI] [Google Scholar]
- Chong L.; Myshakin E. M. The effect of residual water content on preferential adsorption in carbon dioxide–methane–Illite clay minerals: A molecular simulation study. Fluid Phase Equilib. 2020, 504, 112333 10.1016/j.fluid.2019.112333. [DOI] [Google Scholar]
- Sun Z.; Huang B.; Wu K.; Shi S.; Wu Z.; Hou M.; Wang H. Nanoconfined methane density over pressure and temperature: wettability effect. Journal of natural gas Science and engineering 2022, 99, 104426 10.1016/j.jngse.2022.104426. [DOI] [Google Scholar]
- Plimpton S. Fast Parallel Algorithms for Short-Range Molecular Dynamics. J. Comput. Phys. 1995, 117, 1–19. 10.1006/jcph.1995.1039. [DOI] [Google Scholar]
- NIST Chemistry WebBook. https://webbook.nist.gov/.
- Nosé S. A Unified Formulation of the Constant Temperature Molecular Dynamics Methods. J. Chem. Phys. 1984, 81, 511–519. 10.1063/1.447334. [DOI] [Google Scholar]
- Shinoda W.; Shiga M.; Mikami M. Rapid Estimation of Elastic Constants by Molecular Dynamics Simulation Under Constant Stress. Phys. Rev. B 2004, 69, 134103 10.1103/PhysRevB.69.134103. [DOI] [Google Scholar]
- Berendsen H. J. C.; Grigera J. R.; Straatsma T. P. The missing term in effective pair potentials. J. Phys. Chem. 1987, 91, 6269–6271. 10.1021/j100308a038. [DOI] [Google Scholar]
- Ryckaert J.-P.; Ciccotti G.; Berendsen H. J. C. Numerical integration of the cartesian equations of motion of a system with constraints: molecular dynamics of n-alkanes. J. Comput. Phys. 1977, 23, 327–341. 10.1016/0021-9991(77)90098-5. [DOI] [Google Scholar]
- Karplus M.; Petsko G. A. Molecular dynamics simulations in biology. Nature 1990, 347, 631–639. 10.1038/347631a0. [DOI] [PubMed] [Google Scholar]
- Jones J. E. On the determination of molecular fields. I. From the variation of the viscosity of a gas with temperature. Proc. R. Soc. A 1924, 106, 441–462. 10.1098/rspa.1924.0081. [DOI] [Google Scholar]
- Jorgensen W. L.; Maxwell D. S.; Tirado-Rives J. Development and Testing of the OPLS All-Atom Force Field on Conformational Energetics and Properties of Organic Liquids. J. Am. Chem. Soc. 1996, 118, 11225–11236. 10.1021/ja9621760. [DOI] [Google Scholar]
- Cheatham T. I.; Miller J.; Fox T.; Darden T.; Kollman P. Molecular dynamics simulations on solvated biomolecular systems: the particle mesh Ewald method leads to stable trajectories of DNA, RNA, and proteins. J. Am. Chem. Soc. 1995, 117, 4193–4194. 10.1021/ja00119a045. [DOI] [Google Scholar]
- Potoff J.; Errington J.; Panagiotopoulos A. Molecular simulation of phase equilibria for mixtures of polar and non-polar components. Mol. Phys. 1999, 97, 1073–1083. 10.1080/00268979909482908. [DOI] [Google Scholar]
- Tenney C.; Lastoskie C. Molecular simulation of carbon dioxide adsorption in chemically and structurally heterogeneous porous carbons. Environmental Progress 2006, 25, 343–354. 10.1002/ep.10168. [DOI] [Google Scholar]
- Huang L.-L.; Zhang L.-Z.; Shao Q.; Wang J.; Lu L.-H.; Lu X.-H.; Jiang S.-Y.; Shen W.-F. Molecular dynamics simulation study of the structural characteristics of water molecules confined in functionalized carbon nanotubes. J. Phys. Chem. B 2006, 110, 25761–25768. 10.1021/jp064676d. [DOI] [PubMed] [Google Scholar]
- Giannozzi P.; Baroni S.; Bonini N.; Calandra M.; Car R.; Cavazzoni C.; Ceresoli D.; Chiarotti G. L.; Cococcioni M.; Dabo I. QUANTUM ESPRESSO: a modular and open-source software project for quantum simulations of materials. J. Phys.: Condens. Matter 2009, 21, 395502 10.1088/0953-8984/21/39/395502. [DOI] [PubMed] [Google Scholar]
- Vanderbilt D. Soft self-consistent pseudopotentials in a generalized eigenvalue formalism. Phys. Rev. B 1990, 41, 7892–7895. 10.1103/PhysRevB.41.7892. [DOI] [PubMed] [Google Scholar]
- Perdew J. P.; Burke K.; Ernzerhof M. Generalized Gradient Approximation Made Simple. Phys. Rev. Lett. 1996, 77, 3865–3868. 10.1103/PhysRevLett.77.3865. [DOI] [PubMed] [Google Scholar]
- Zhang Y.; Yang W. Comment on “Generalized Gradient Approximation Made Simple. Phys. Rev. Lett. 1998, 80, 890–890. 10.1103/PhysRevLett.80.890. [DOI] [Google Scholar]
- Liu Y.; Wilcox J. Molecular simulation of CO2 adsorption in micro- and mesoporous carbons with surface heterogeneity. International Journal of Coal Geology 2012, 104, 83–95. 10.1016/j.coal.2012.04.007. [DOI] [Google Scholar]
- Heinz H.; Suter U. W. Atomic charges for classical simulations of polar systems. J. Phys. Chem. B 2004, 108, 18341–18352. 10.1021/jp048142t. [DOI] [Google Scholar]
- Cole D. R.; Chialvo A. A.; Rother G.; Vlcek L.; Cummings P. T. Supercritical fluid behavior at nanoscale interfaces: Implications for CO2 sequestration in geologic formations. Philos. Mag. 2010, 90, 2339–2363. 10.1080/14786430903559458. [DOI] [Google Scholar]
- Nelson P. H. Pore-throat sizes in sandstones, tight sandstones, and shales. AAPG bulletin 2009, 93, 329–340. 10.1306/10240808059. [DOI] [Google Scholar]
- Ishimaru M.; Bae I.-T.; Hirotsu Y.; Matsumura S.; Sickafus K. E. Structural relaxation of amorphous silicon carbide. Physical review letters 2002, 89, 055502 10.1103/PhysRevLett.89.055502. [DOI] [PubMed] [Google Scholar]
- Berghe G.; Kline S.; Burket S.; Bivens L.; Johnson D.; Singh R. Effect of CO2 and H2O on the behavior of shale gas confined inside calcite [104] slit-like nanopore: a molecular dynamics simulation study. J. Mol. Model. 2019, 25, 293. 10.1007/s00894-019-4180-7. [DOI] [PubMed] [Google Scholar]
- Xu H.; Yu H.; Fan J.; Zhu Y.; Wang F.; Wu H. Two-phase transport characteristic of shale gas and water through hydrophilic and hydrophobic nanopores. Energy Fuels 2020, 34, 4407–4420. 10.1021/acs.energyfuels.0c00212. [DOI] [Google Scholar]
- Yoshioka T.; Asaeda M.; Tsuru T. A molecular dynamics simulation of pressure-driven gas permeation in a micropore potential field on silica membranes. J. Membr. Sci. 2007, 293, 81–93. 10.1016/j.memsci.2007.01.039. [DOI] [Google Scholar]
- Qiu R.; Yuan S.; Xiao J.; Chen X. D.; Selomulya C.; Zhang X.; Woo M. W. Effects of edge functional groups on water transport in graphene oxide membranes. ACS Appl. Mater. Interfaces 2019, 11, 8483–8491. 10.1021/acsami.9b00492. [DOI] [PubMed] [Google Scholar]
- Kuila U.; Prasad M.; Kazemi H. Assessing Knudsen flow in gas-flow models of shale reservoirs. Can. Soc. Explor. Geophys. 2013, 38, 23–27. [Google Scholar]