

ABSTRACT
Background
Dietary nitrate (BR) and caffeine (CAF) ingestion have been shown to increase sports performance. However, the isolated and combined effects of BR and CAF ingestion on time trial (TT) performance as well as the accompanying physiological and perceptual responses have never been investigated in highly trained kayak athletes. Therefore, the present study examined the impact of an isolated and combined supplementation with BR (140 ml beetroot concentrate, ~12.5 mmol nitrate) and CAF (3 mg/kg bodyweight) on 1000 m ergometer TT performance as well as the accompanying physiological (i.e. cardiorespiratory function, muscle oxygenation, muscle activity) and perceptual responses (i.e. fatigue, effort, and exercise-induced pain perception) in male highly trained kayakers. It was hypothesized that the isolated ingestion of BR and CAF would both improve ergometer-based 1000 m TT performance and induce supplement-specific physiological and perceptual responses. Considering the primary effects of BR on muscle function and of CAF on the central nervous system, it was further assumed that the combined ingestion will result in an additional performance increase and supplement-specific physiological and perceptual responses.
Methods
Using a prospective, randomized, controlled, double-blind crossover design, 12 male highly trained kayak athletes from local clubs were investigated. They completed four measurement sessions resulting in four randomized conditions: (i) BR+CAF; (ii) BR+CAF placebo (BR+PLA); (iii) CAF+BR placebo (CAF+PLA); and (iv) BR placebo + CAF placebo (PLA+PLA). An air-braked instrumented kayak-ergometer was used to record 1000 m TT performance, power output, and stroke frequency. Heart rate (HR), oxygen uptake (VO2), maximum VO2 (VO2max), respiratory equivalent of O2 (VE/VO2), and carbon dioxide (VE/VCO2) were measured continuously. Furthermore, oxygenation of the deltoid muscle was measured with near-infrared spectroscopy (mNIRS) and muscle activity of nine unilateral muscles with surface electromyography (i.e. deltoideus, serratus anterior, triceps brachii caput lateralis, trapezius, infraspinatus, latissimus dorsi, obliquus externus, flexor carpi radialis, and vastus lateralis muscle) during the 1000 m TT. After the TT, fatigue, effort, and exercise-induced pain perception were queried. One- and two-way analysis of variance with repeated measures were conducted to determine differences between conditions for the entire 1000 m TT and predefined sections (0-50 m, 50-100 m, 100-150 m, 150-250 m, 250-500 m, 500-750 m, 750-1000 m), respectively (p ≤ 0.05).
Results
The supplements did not have an ergogenic effect on TT performance compared to the PLA+PLA condition, either in isolation or in combination. The same applied to the majority of physiological parameters and the perceptual responses. Nevertheless, VE/VO2 was lower during the sections 150-250 m (-5.00%; p = 0.02) and 250-500 m (-3.49%; p = 0.03) in the BR+PLA condition, whereby VE/VCO2 was higher during the section 150-250 m (4.19%; p = 0.04) in the CAF+PLA compared to the PLA+PLA condition, respectively.
Conclusions
Data indicate that the isolated and combined ingestion of BR and CAF had no effect on 1000 m TT performance, the majority of physiological responses, and perceptual responses in highly trained kayakers. These findings might be related to the dosage and/or a ceiling effect due to the already efficient vascular, metabolic, and muscle function, including high amounts of endogenous produced nitric oxide, in athletes.
KEYWORDS: Kayak time trial performance, oxygen uptake, muscle activity, muscle oxygenation, ergogenic supplements, highly trained kayak athletes
1. Introduction
Due to the marginal time differences between top rankings in international competitions, ergogenic supplements have become popular in elite athletes because even the smallest positive effect would be of practical relevance [1]. In this regard, the ingestion of isolated or combined dietary nitrate and caffeine, commonly in form of beetroot concentrates [2–5] and caffeine [6,7], has been shown to be effective in improving time trial (TT) performance compared to placebo in various endurance sports, e.g. kayak racing (-1.7%, p = 0.004) [8], rowing (-1.6 s, “possibly beneficial effect”;~-2%, “likely, probably effect”, respectively) [3,9], swimming (-0.93%, p = 0.14) [4].
The mechanistic basis for the performance improvements after dietary nitrate ingestion includes an increased concentration of nitrate circulating in the blood and thus a higher bioavailability of nitric oxide (NO) [10]. As a signal molecule, NO acutely modulates a variety of important physiological processes, such as skeletal muscle perfusion, contractile function, and blood flow [11]. At the muscle cellular level, it could influence mitochondrial respiration, oxidative phosphorylation, and glucose, as well as calcium homeostasis [12]. During severe intensity exercise, the function of endogenous oxidative NO synthases catalyzing the production of NO from L-arginine can be impaired [13]. Especially in this muscular hypoxic-acidotic environment, the nitrate-nitrite-NO pathway can compensate for this impairment due to the exogenous supply of nitrate derived from dietary sources (e.g. beetroot) [13,14]. Dietary nitrate ingestion result, for instance, in a reduced oxygen uptake (VO2) during submaximal exercise, indicating a more efficient functioning of the skeletal muscles [15,16]. It is assumed to be the result of lower muscular adenosine triphosphate (ATP) cost and lower O2 requirement for ATP resynthesis [17–19] leading to improved exercise tolerance and performance at the anaerobic threshold [15]. Due to its vasodilatory function [20], NO does not only ensure a more efficient O2 supply, but also promotes the removal of metabolites from the working muscles (e.g. adenosine diphosphate, inorganic phosphate, and lactate) [21]. Given that a hypoxic environment develops especially during intense physical exercise in the type II muscle fibers, kayakers should particularly benefit from dietary nitrate ingestion due to the high proportion of type II fibers recruited [22]. Due to the effects described above, dietary nitrate ingestion can further reduce the extent of performance fatigue and the intensity of perceptual responses to exercise (e.g. effort and exercise-induced pain perception) [23].
Systematic reviews with meta-analyses have revealed that acute oral ingestion of 3–6 mg/kg [24,25] caffeine improves TT performance across different durations lasting between 45 s and 8 min (2.22 ± 2.59%) [1,26]. Thereby 3 mg/kg caffeine has been shown to be similarly effective in increasing sport performance compared to 6 mg/kg in well-trained athletes [7,27,28]. Caffeine mainly acts as a central nervous system stimulant, including its function as a competitive adenosine receptor antagonist [29]. The muscular and plasma concentration of adenosine increases during physical activity [30] resulting in an activation of central adenosine receptors that promote reduced neuronal excitability and synaptic transmission due to the inhibition of neurotransmitters in the brain [31]. Caffeine derivatives have a strong tendency to bind to adenosine A1, A2A, and A2B receptors in the central nervous system and, therefore, counteract the effect of adenosine [32,33]. The physiological effects of caffeine include an increased release of neurotransmitters as well as the enhanced excitability and firing frequency of motoneurons [34–37]. The caffeine-induced physiological changes might explain the observed enhancements in strength accompanied by an increased activation of muscles [38,39]. Caffeine’s ergogenic effect on endurance performance is primarily ascribed to a lower perception of both effort and pain during exercise [40–43], which are related to exercise-induced fatigue and are assumed to be key-determinants of endurance performance [44].
To our knowledge, information about the TT performance enhancing potential of dietary nitrate and caffeine is limited in the context of kayak racing. In this regard, 2 × 70 ml beetroot juice ingestion (~9.6 mmol nitrate) increased 500 m on-water TT performance (−1.7% [8]) in female elite kayak athletes. Moreover, another experiment observed a reduced VO2 during submaximal exercise after consuming 70 ml of beetroot concentrate (~5 mmol nitrate), but no change in ergometer-based 1000 m TT performance in trained male kayakers [2]. Unfortunately, no study addresses the effects of caffeine on kayak TT performance.
Therefore, the present study investigated the effects of an isolated and combined supplementation with dietary nitrate in the form of 140 ml beetroot concentrate (~12.5 mmol nitrate) and 3 mg/kg caffeine on 1000 m ergometer TT performance as well as the accompanying physiological (i.e. cardiorespiratory function, muscle oxygenation, activity) and perceptual responses (i.e. perceived trait and state fatigue, effort and exercise-induced pain perception) as well as motivational measures in male highly trained kayakers. It was hypothesized that the isolated ingestion of dietary nitrate or caffeine would both improve kayak-ergometer-based 1000 m TT performance and induce supplement-specific physiological and perceptual responses to exercise. Considering the primary effects of dietary nitrate on muscle function and of caffeine on the central nervous system [1,6,24,26,45–48], it was further assumed that the combined ingestion will result in an additional TT performance increase as well as supplement-related concurrent physiological and perceptual responses [49].
2. Materials and methods
2.1. Participants
Based on the effect size reported by Peeling et al. [8], we assumed a strong effect of dietary nitrate ingestion on 1000 m TT kayak performance. Calculation of the sample size using G*Power 3.1 (F-test, repeated measures ANOVA, ηp2 = 0.14, α-error probability: 0.05, power: 0.95, four repeated measurements, correlation among measures: 0.7) resulted in a number of 10 participants that would be required. Therefore, considering potential dropouts, 12 healthy male highly trained kayakers with extensive competitive experience at the national and international level were recruited (Table 1). We included athletes who have been paddling at expert level for at least 2 years and have been part of the national squad system. The athletes trained according to a strictly periodized training regime to be able to deliver top performances at national as well as international competitions and were recruited from various German clubs. Participants were fully informed about the objectives, procedure, measurement methods, as well as risks of the experiments and informed consent was obtained before the study started.
Table 1.
Characteristics of the subjects. Data are presented as means (M) and standard deviations (SD).
| Parameters [unit] | M (SD) |
|---|---|
| N | 12 |
| Age [y] | 21.5 (6.69) |
| Height [m] | 1.85 (0.06) |
| Body Weight [kg] | 80.29 (12.08) |
| Body Mass Index [kg/m2] | 23.42 (2.36) |
| Training Time/Week [h] | 11.75 (4.16) |
| Training Experience [y] | 11.83 (7.08) |
| Daily Caffeine Intake [mg/d] | 133.41 (246.15) |
2.2. Study design and procedure
To examine the acute effects of isolated and combined ingestion of dietary nitrate and/or caffeine on ergometer-based 1000 m TT kayak performance, a prospective, randomized, controlled, double-blinded cross-over study was conducted (Figure 1). We used the research randomizer tool (www.randomizer.org) for the randomization procedure (computerized sequence generation of 12 sets of four unique numbers per set ranging from 1–4). The kayakers completed a total of four randomized conditions: (i) dietary nitrate + caffeine (BR+CAF); (ii) dietary nitrate + caffeine placebo (BR+PLA); (iii) caffeine + dietary nitrate placebo (CAF+PLA); and (iv) dietary nitrate placebo + caffeine placebo (PLA+PLA), each with a washout phase of seven days. The athletes’ anthropometric data were collected before the first measurement and the experiments started on the same day of the week and at the same time. In the 72 h before the measurements, participants were not allowed to consume alcohol or caffeinated drinks or food. Their habitual caffeine consumption per kg bodyweight was assessed using a standardized questionnaire [50]. In the 48 h before the experiments, athletes were not allowed to consume nitrate-rich foods (e.g. green leafy vegetables or beetroot). They were asked to maintain their individual training load in the 24 h before the respective measurements. The training load during the washout phases was identical for all subjects due to a standardized training plan. During each visit, cardiorespiratory data, muscle oxygenation of the deltoideus muscle, and muscle activity of nine kayak performance-relevant muscles were collected, while the athletes performed a maximal 1000 m TT on an instrumented kayak ergometer. The study design was approved by the Ethics Committee of the University Medical Center (A 2018–0249) and was carried out in accordance with the Declaration of Helsinki.
Figure 1.

Overview of the study design. Highly trained kayakers completed an ergometer-based 1000 m time trial (TT) four times each separated by 7 days in a randomized order. Before warming up, the subjects’ trait fatigue (fatigue perceived over the last seven days, Modified Fatigue Impact Scale) was queried. Directly before the start of the 1000 m TT, they completed questionnaires on motivation (Dundee Stress State Questionnaire) and state fatigue (Profile of Mood States-Fatigue). The mechanical and physiological parameters were collected during the entire 1000 m TT and its sections. After the TT, the athletes answered questionnaires on fatigue and motivation again as well as rated their effort (Borg Scale) and exercise-induced pain perception (Category Ratio Scale) for the whole TT.
2.3. Dietary nitrate and caffeine ingestion
The isolated and combined oral ingestion of dietary nitrate and/or caffeine resulted in four conditions that were randomly assigned (i) BR+CAF; (ii) BR+PLA; (iii) CAF+PLA; (iv) PLA+PLA. The athletes consumed either a 140 ml beetroot concentrate (∼12.5 mmol nitrate; Beet it, UK [4]) or a placebo (∼0.08 mmol nitrate; Beet it, UK) 2.5 h before the respective 1000 m TT. Furthermore, the athletes supplemented either 3 mg/kg caffeine (Coffeinum N 0.2 g, Mylan Healthcare, GER) or a placebo (flour, 0 g caffeine) 60 min before the respective 1000 m TT. These points in time were chosen to achieve the respective peak concentration at the time of the start of the TT. During BR+CAF condition, the supplements were ingested with the same intake times as described above, respectively [49].
2.4. 1000 m time trial performance
The athletes completed a 1000 m TT on a kayak ergometer (Dansprint Pro, GB/DK) at each visit with the aim to achieve their own best performance with maximum effort. The sitting position on the ergometer corresponded to the participants’ position in their own racing boats and was individually adjusted before each measurement. The traction resistance was set once at the beginning of the test based on the perception of the paddle resistance in the water [51–53] using a stepless adjustable air brake and was maintained during each condition. Athletes were asked to simulate a real competition and strong verbal encouragement was given by the same investigator in a standardized manner after 100 m, 250 m, 500 m, 750 m, 850 m, 900 m, and 950 m. Before the start, the athletes performed an individual, but always identical, 15 min warm-up followed by a 5 min recovery break. After the TT, the subjects remained on the ergometer for further 5 min. The “Dansprint Analyzer” software was used to measure the paddle cycle-based average time, power, speed, and stroke frequency [54]. The 1000 m TT performance was determined using a stopwatch (Hitrax Go 38.2016, GER). In addition to the analysis of the entire 1000 m TT, sections (0–50 m, 50–100 m, 100–150 m, 150–250 m, 250–500 m, 500–750 m, 750–1000 m) were also defined to compare performance as well as physiological responses, respectively.
2.5. Cardiorespiratory function
The average VO2, VO2/kg, respiratory equivalent for O2 (VE/VO2), and CO2 (VE/VCO2) as well as the respiratory exchange ratio (RER) were recorded “breath-by-breath” using an open-circuit spirometry (Metamax®3B, Cortex, GER) and analyzed [55]. In the present study, a maximum O2 uptake (VO2max) test was obsolete, as it could be assumed that the experienced athletes have retrieved their maximum performance and reached VO2max during the 1000 m TT [51,53,56]. Therefore, the peak value reached during the TT was considered a valid approximation of the athletes’ VO2max based on the 10 s moving average calculation from the raw data [8]. Heart rate (HR) was measured using a chest strap (1000 Hz sampling rate, Polar, FIN). Based on the moving average over 10 s, the average HR was calculated from the raw data.
2.6. Muscle oxygenation
The local O2 supply was measured at the deltoideus muscle using muscular near-infrared spectroscopy (mNIRS) (PortaLite, Artinis Medical Systems, NLD). This muscle is intensively involved in the paddling movement as well as in force development and transmission [57]. The sensor was applied unilaterally on the subject’s respective dominant side. Data were recorded with a sampling rate of 10 Hz. Based on the concentration changes of oxygenated (O2HB), deoxygenated (HHB), and total hemoglobin (tHB), the tissue saturation index (TSI) was calculated by the manufacturer's software. The TSI quantifies the average O2 saturation of the tissue under the sensor based on the dynamic balance between O2 supply and demand [58,59].
2.7. Muscle activity
To measure muscle activity during the 1000 m TT, surface electromyography (EMG) (Myon Aktos Classic, SUI) electrodes and wireless EMG amplifiers were applied unilaterally based on the subject’s handedness on the dominant side to nine kayak performance-relevant muscles of the trunk as well as the upper and lower extremities, i.e. deltoideus, serratus anterior, triceps brachii caput lateralis, trapezius, infraspinatus, latissimus dorsi, obliquus externus, flexor carpi radialis, and vastus lateralis muscle [60–63]. The respective EMG electrodes were applied according to the recommendations of Hermens et al. [64]. To ensure adequate recording conditions, the skin areas of the muscles were shaved, abraded, and cleaned with alcohol [65]. The maximum skin resistance was set at 5 kΩ and was checked using a digital multimeter (MY-68, McVoice, GER). To avoid motion artifacts, the electrodes were fixed with adhesive tape [57,66]. The EMG signal was recorded with a sampling rate of 2000 Hz and was filtered using a bandpass filter (10-500 Hz). The absolute root mean square (RMSabs) and relative RMS (RMSrel) were calculated. RMSrel was determined by normalizing muscle activity during the TT sections to maximum muscle activity recorded during the start (0-50 m).
2.8. Perceptual responses and motivation
To determine trait fatigue (fatigue perceived over the last seven days), the Modified Fatigue Impact Scale (MFIS) was applied before the start of the warm-up in each condition [67]. In order to quantify state fatigue (perceived fatigue induced by the TT), subjects answered the fatigue scale of the Profile of Mood States questionnaire (POMS-F) immediately before the start (POMS-Fpre) and after the respective TT (POMS-Fpost) [44,68,69]. Moreover, the DSSQ-A and B [70,71] were used before and after the 1000 m TT to record motivation for both the upcoming task and the evaluation of the previous task. Immediately after the 1000 m TT, effort as well as exercise-induced pain perception was quantified using the 15-point Borg [72] and category ratio scale (CR-10) [73], respectively. Based on the recommendations of Pageaux [74], the respective wording of the instructions for effort and exercise-induced pain perception was adapted to the upcoming motor task.
2.8.1. Statistical analyses
The data were tested for normal distribution (Shapiro-Wilk test) and variance homogeneity (Levene test). Mechanical and physiological data for the entire 1000 m TT were analyzed using a one-way repeated measures analysis of variance (RMANOVA) taking the randomized supplement condition as within-subject factor into account. To analyze potential condition-dependent differences between data recorded in each section of the TT (0-50 m, 100-150 m, 150-250 m, 250-500 m, 500-750 m, 750-1000 m), two-way RMANOVAs including within-subject factor conditions and sections were conducted. The effect size partial eta squared (ηp2) was calculated and interpreted according to Cohen [75] (≥ 0.01 = small, ≥ 0.06 = medium, ≥ 0.14 = large effect). In the case of violated sphericity (Mauchly test), the Greenhouse–Geisser correction was applied. In case of significance (p ≤ 0.05), Bonferroni-corrected post-hoc tests were performed. Moreover, Cohen’s dz (dz) was calculated and interpreted (≥ 0.20 = small, ≥ 0.50 = medium, ≥ 0.80 = large effect) [76]) to assess the effect of the supplementation in relation to the placebo condition, respectively [77,78]. Differences are shown as mean differences (ΔM) = supplement – placebo with 95% confidence intervals (CI 95%). All raw data (ergometer, cardiorespiratory function, muscle oxygenation and activity) were processed using MatLab (version R2020b). All statistical calculations were carried out using IBM’s SPSS Statistics 27.
3. Results
3.1. 1000 m time trial performance
The one-way RMANOVA (Table 2) indicated no differences in 1000 m TT performance (p = 0.770, ηp2 = 0.033), speed (p = 0.962, ηp2 = 0.009), power (p = 0.930, ηp2 = 0.013), and stroke frequency (p = 0.559, ηp2 = 0.060) calculated for the entire TT between conditions. Moreover, the two-way RMANOVA (Table 3) showed no interaction effects for the ergometer-based variables (Figure 2).
Table 2.
Outcomes of the one-way RMANOVA analyzing the respective parameters of the entire 1000 m TT. Data are shown as means (M) and standard deviations (SD) for each condition (BR: dietary nitrate, CAF: caffeine, PLA: placebo).
| 1000 m TT average | N | BR+CAF | BR+PLA | CAF+PLA | PLA+PLA | |
Condition |
|||||||||
|---|---|---|---|---|---|---|---|---|---|---|---|---|---|---|---|---|
| M (SD) | M (SD) | M (SD) | M (SD) | |||||||||||||
| F | P | ηp2 | ||||||||||||||
| TT performance | ||||||||||||||||
| Time [s] | 12 | 267.02 (15.06) | 268.48 (15.09) | 267.94 (15.87) | 268.60 (16.13) | 0.377 | 0.770 | 0.033 | ||||||||
| Speed [km/h] | 12 | 13.55 (0.85) | 13.54 (0.76) | 13.58 (0.81) | 13.57 (0.79) | 0.096 | 0.962 | 0.009 | ||||||||
| Power [W] | 12 | 191.41 (33.19) | 190.36 (28.89) | 192.60 (31.48) | 191.97 (30.70) | 0.148 | 0.930 | 0.013 | ||||||||
| Stroke frequency [S/min] | 12 | 107.06 (5.56) | 105.66 (5.52) | 106.01 (5.87) | 106.30 (5.96) | 0.699 | 0.559 | 0.060 | ||||||||
| Cardiorespiratory function | ||||||||||||||||
| VO2 [l/min] | 11 | 4.08 (0.46) | 4.09 (0.43) | 4.04 (0.45) | 4.01 (0.50) | 0.907 | 0.448 | 0.076 | ||||||||
| VO2/kg | 11 | 51.30 (5.34) | 51.40 (4.63) | 50.69 (4.12) | 50.28 (5.03) | 0.999 | 0.405 | 0.083 | ||||||||
| HR [b/min] | 6 | 177.80 (4.18) | 175.21 (5.72) | 177.53 (5.37) | 177.01 (6.14) | 1.295 | 0.312 | 0.206 | ||||||||
| VE/VO2 | 11 | 33.98 (3.73) | 32.91 (2.57) | 34.06 (3.25) | 34.17 (3.38) | 1.055 | 0.381 | 0.088 | ||||||||
| VE/CO2 | 11 | 30.84 (2.49) | 29.88 (2.10) | 31.17 (2.43) | 30.52 (1.78) | 1.826 | 0.162 | 0.142 | ||||||||
| VO2max [l/min] | 11 | 4.77 (0.57) | 4.81 (0.59) | 4.68 (0.53) | 4.53 (0.50) | 3.000 | 0.045* | 0.214 | ||||||||
| RER | 11 | 1.10 (0.05) | 1.10 (0.03) | 1.09 (0.04) | 1.11 (0.06) | 1.371 | 0.269 | 0.111 | ||||||||
| Muscle oxygenation | ||||||||||||||||
| TSI [%] | 10 | 49.63 (8.41) | 49.09 (6.62) | 49.08 (8.89) | 51.57 (9.22) | 1.149 | 0.347 | 0.113 | ||||||||
| O2HB | 10 | 67.51 (6.88) | 67.55 (5.50) | 67.47 (8.54) | 69.37 (14.39) | 0.203 | 0.894 | 0.022 | ||||||||
| HHB | 10 | 86.06 (10.60) | 84.31 (12.48) | 84.53 (13.90) | 84.78 (12.68) | 0.302 | 0.823 | 0.033 | ||||||||
| tHB | 10 | 153.57 (12.92) | 151.86 (15.76) | 152.01 (20.58) | 154.16 (22.57) | 0.134 | 0.939 | 0.015 | ||||||||
| Muscle activity | ||||||||||||||||
| RMSabs | 10 | 0.23 (0.07) | 0.22 (0.07) | 0.21 (0.07) | 0.23 (0.07) | 1.295 | 0.242 | 0.141 | ||||||||
| RMSrel [%] | 10 | 81.07 (11.12) | 75.70 (10.84) | 83.32 (9.60) | 80.53 (14.37) | 1.295 | 0.296 | 0.126 | ||||||||
| Perception and Motivation | ||||||||||||||||
| MFIS | 12 | 14.42 (9.48) | 18.83 (12.71) | 17.75 (11.64) | 17.42 (8.99) | 0.937 | 0.434 | 0.079 | ||||||||
| POMS-Fpre | 12 | 7.33 (7.33) | 7.75 (7.02) | 6.25 (5.46) | 8.50 (5.05) | 0.642GG | 0.496GG | 0.055GG | ||||||||
| POMS-Fpost | 12 | 21.92 (10.77) | 22.92 (8.27) | 20.50 (11.35) | 23.75 (9.27) | 0.716GG | 0.475GG | 0.061GG | ||||||||
| POMS-Fpre-post [%] | 12 | 726.42 (866.30) | 543.10 (465.59) | 544.14 (561.20) | 445.84 (424.00) | 0.650GG | 0.489GG | 0.056GG | ||||||||
| RPE (BORG) | 12 | 17.58 (1.93) | 18.08 (1.38) | 17.75 (1.36) | 17.92 (1.44) | 0.485 | 0.695 | 0.042 | ||||||||
| CR-10 | 12 | 6.67 (2.19) | 6.79 (2.52) | 6.50 (2.58) | 7.08 (2.02) | 0.552 | 0.651 | 0.048 | ||||||||
| DSSQ-A | 12 | 26.75 (3.33) | 26.42 (4.44) | 27.83 (2.69) | 27.83 (3.59) | 1.263 | 0.303 | 0.103 | ||||||||
| DSSQ-B | 12 | 25.67 (4.94) | 25.33 (3.06) | 25.08 (3.23) | 25.83 (3.97) | 0.149 | 0.93 | 0.013 | ||||||||
Abbreviations: RMANOVA = analyses of variance with repeated measures; F = F statistic; p = significance; ηp2 = partial eta squared; TT = time trial; VO2 = oxygen uptake; HR = heart rate; VE/VO2 = respiratory equivalent for O2; VE/VCO2 = respiratory equivalent for carbon dioxide; VO2max = maximum VO2; RER = respiratory exchange ratio; TSI = tissue saturation index; O2Hb = oxygenated hemoglobin; HHb = deoxygenated hemoglobin; total hemoglobin; RMSabs = absolute root mean square; RMSrel = relative root mean square; MFIS = modified fatigue impact scale; POMS-F = profile of mood states fatigue; RPE = exercise induced effort perception; CR-10 = category ratio scale/exercise induced pain perception; DSSQ = Dundee stress state questionnaire/motivation.
Table 3.
Outcomes of the two-way RMANOVA considering the within-subject factors condition and section.
| |
|
TT performance |
|
Cardiorespiratory function |
Muscle oxygenation |
Muscle activation |
||||||||||||||||
|---|---|---|---|---|---|---|---|---|---|---|---|---|---|---|---|---|---|---|---|---|---|---|
| F | P | ηp2 | F | P | ηp2 | F | P | ηp2 | F | P | ηp2 | |||||||||||
| Performance (N = 12) | VO2 (N = 11) | TSI (N = 10) | RMSabs (N = 10) | |||||||||||||||||||
| Condition | 0.187 | 0.904 | 0.017 | 0.985 | 0.413 | 0.090 | 1.407 | 0.262 | 0.135 | 2.699 | 0.063 | 0.213 | ||||||||||
| Section | 3618.799GG | 0.000GG | 0.997GG | 245.814GG | 0.000GG | 0.961GG | 43.985GG | 0.000GG | 0.830GG | 18.320GG | 0.000GG | 0.647GG | ||||||||||
| Condition × section | 0.464 | 0.970 | 0.040 | 1.330 | 0.174 | 0.117 | 0.450 | 0.974 | 0.048 | 0.851 | 0.638 | 0.078 | ||||||||||
| Speed (N = 12) | VO2/kg (N = 11) | O2Hb (N = 10) | RMSrel (N = 10) | |||||||||||||||||||
| Condition | 0.348 | 0.790 | 0.031 | 1.014 | 0.400 | 0.092 | 0.276 | 0.842 | 0.030 | 0.036 | 0.991 | 0.004 | ||||||||||
| Section | 102.844GG | 0.000GG | 0.903GG | 311.310GG | 0.000GG | 0.969GG | 27.873GG | 0.000GG | 0.756GG | 24.618GG | 0.000GG | 0.711GG | ||||||||||
| Condition × section | 1.069 | 0.386 | 0.089 | 1.333 | 0.172 | 0.118 | 0.626 | 0.875 | 0.065 | 0.391 | 0.988 | 0.038 | ||||||||||
| Power Output (N = 12) | HR (N = 6) | HHb (N = 10) | ||||||||||||||||||||
| Condition | 0.539 | 0.659 | 0.047 | 2.747 | 0.080 | 0.355 | 0.216 | 0.884 | 0.023 | |||||||||||||
| Section | 104.126GG | 0.000GG | 0.904GG | 206.657 | 0.0000 | 0.976 | 79.848GG | 0.000GG | 0.899GG | |||||||||||||
| Condition × section | 1.453 | 0.111 | 0.117 | 1.922 | 0.023 | 0.278 | 1.710 | 0.042* | 0.160 | |||||||||||||
| Stroke Frequency (N = 12) | VE/VO2(N = 11) | tHb (N = 10) | ||||||||||||||||||||
| Condition | 1.275 | 0.299 | 0.104 | 2.956 | 0.048 | 0.228 | 0.184 | 0.906 | 0.020 | |||||||||||||
| Section | 74.470GG | 0.000GG | 0.871GG | 37.630GG | 0.000GG | 0.790GG | 50.607GG | 0.000GG | 0.849GG | |||||||||||||
| Condition × section | 0.987 | 0.476 | 0.082 | 2.183 | 0.005 | 0.179 | 0.997 | 0.466 | 0.100 | |||||||||||||
| VE/VCO2(N = 11) | ||||||||||||||||||||||
| Condition | 2.826GG | 0.090GG | 0.220GG | |||||||||||||||||||
| Section | 23.271GG | 0.000GG | 0.699GG | |||||||||||||||||||
| Condition × section | 2.735 | 0.000 | 0.215 | |||||||||||||||||||
| RER (N = 11) | ||||||||||||||||||||||
| Condition | 1.400 | 0.262 | 0.123 | |||||||||||||||||||
| Section | 39.553GG | 0.000GG | 0.798GG | |||||||||||||||||||
| Condition × section | 0.655 | 0.851 | 0.061 | |||||||||||||||||||
Abbreviations: RMANOVA = analyses of variance with repeated measures; F = F statistic; p = significance; ηp2 = partial eta squared; TT = time trial; VO2 = oxygen uptake; HR = heart rate; VE/VO2 = respiratory equivalent for O2; VE/VCO2 = respiratory equivalent for carbon dioxide; RER = respiratory exchange ratio; TSI = tissue saturation index; O2Hb = oxygenated hemoglobin; HHb = deoxygenated hemoglobin; tHB = total hemoglobin; RMSabs = absolute root mean square; RMSrel = relative root mean square.
Figure 2.

(A) times, (B) power, and (C) stroke frequency during the respective sections of the 1000 m time trial. No significant differences between conditions were observed. Data are presented as means and standard deviations.
The mean values and standard deviations of all measurements and TT sections are shown in Tables 4–7.
Table 4.
Means (M) and standard deviations (SD) of the variables of ergometer-based TT performance for each condition (BR: dietary nitrate, CAF: caffeine, PLA: placebo) and time trial section.
| Parameter | N | BR+CAF | BR+PLA | CAF+PLA | PLA+PLA | |||||
|---|---|---|---|---|---|---|---|---|---|---|
| M (SD) | M (SD) | M (SD) | M (SD) | |||||||
| TT performance | ||||||||||
| 1000 m Time[s] | 12 | 267.02 (15.06) | 268.48 (15.09) | 267.94 (15.87) | 268.60 (16.13) | |||||
| 750 m Time[s] | 12 | 199.66 (11.87) | 198.83 (11.39) | 198.79 (11.31) | 199.55 (11.21) | |||||
| 500 m Time[s] | 12 | 130.03 (7.60) | 129.40 (7.56) | 129.27 (7.40) | 129.66 (7.03) | |||||
| 250 m Time[s] | 12 | 61.22 (3.73) | 60.94 (3.55) | 60.81 (3.60) | 61.29 (3.62) | |||||
| 150 m Time[s] | 12 | 35.30 (2.41) | 35.26 (2.33) | 34.96 (2.46) | 35.44 (2.28) | |||||
| 100 m Time[s] | 12 | 23.21 (1.80) | 23.27 (1.73) | 22.92 (1.96) | 23.31 (1.44) | |||||
| 50 m Time[s] | 12 | 11.65 (1.00) | 11.88 (1.05) | 11.61 (1.24) | 11.89 (0.89) | |||||
| 1000 m Speed [km/h] | 12 | 13.27 (0.90) | 13.26 (0.75) | 13.34 (0.96) | 13.23 (0.99) | |||||
| 750 m Speed [km/h] | 12 | 12.92 (0.80) | 12.94 (0.75) | 12.94 (0.78) | 12.89 (0.80) | |||||
| 500 m Speed [km/h] | 12 | 13.13 (0.86) | 13.15 (0.83) | 13.14 (0.83) | 13.16 (0.74) | |||||
| 250 m Speed [km/h] | 12 | 13.87 (0.87) | 13.87 (0.81) | 13.85 (0.70) | 13.95 (0.77) | |||||
| 150 m Speed [km/h] | 12 | 14.64 (1.00) | 14.70 (0.91) | 14.75 (0.87) | 14.82 (0.91) | |||||
| 100 m Speed [km/h] | 12 | 15.71 (1.34) | 15.57 (1.09) | 15.77 (1.12) | 15.78 (1.13) | |||||
| 50 m Speed [km/h] | 12 | 16.33 (1.43) | 16.15 (1.23) | 16.33 (1.29) | 16.47 (1.36) | |||||
| 1000 m Power [W] | 12 | 178.60 (34.08) | 177.80 (27.75) | 181.49 (36.97) | 176.92 (36.73) | |||||
| 750 m Power [W] | 12 | 164.64 (29.05) | 165.24 (26.98) | 165.06 (28.37) | 163.57 (29.20) | |||||
| 500 m Power [W] | 12 | 171.72 (31.30) | 172.55 (30.07) | 172.42 (30.23) | 172.78 (27.08) | |||||
| 250 m Power [W] | 12 | 198.01 (33.01) | 197.93 (30.63) | 197.07 (26.31) | 200.98 (28.86) | |||||
| 150 m Power [W] | 12 | 226.97 (39.94) | 228.79 (36.00) | 231.01 (34.47) | 234.30 (36.26) | |||||
| 100 m Power [W] | 12 | 271.16 (60.37) | 264.87 (48.52) | 272.49 (48.46) | 275.71 (49.21) | |||||
| 50 m Power [W] | 12 | 354.70 (78.52) | 340.37 (62.98) | 353.64 (72.56) | 358.70 (72.89) | |||||
| 1000 m Stroke frequency [S/min] | 12 | 106.88 (7.89) | 105.64 (6.10) | 106.18 (8.96) | 105.03 (8.90) | |||||
| 750 m Stroke frequency [S/min] | 12 | 101.13 (4.76) | 100.03 (5.82) | 99.73 (5.40) | 99.70 (6.14) | |||||
| 500 m Stroke frequency [S/min] | 12 | 102.00 (5.05) | 101.12 (6.08) | 100.95 (4.98) | 101.86 (4.74) | |||||
| 250 m Stroke frequency [S/min] | 12 | 107.84 (5.08) | 105.80 (6.61) | 106.24 (5.18) | 107.64 (4.44) | |||||
| 150 m Stroke frequency [S/min] | 12 | 114.54 (7.76) | 112.85 (7.00) | 114.11 (6.41) | 116.11 (6.56) | |||||
| 100 m Stroke frequency [S/min] | 12 | 123.52 (12.05) | 121.09 (10.39) | 123.51 (7.79) | 123.59 (9.85) | |||||
| 50 m Stroke frequency [S/min] | 12 | 136.04 (14.28) | 133.34 (11.00) | 134.44 (12.48) | 136.77 (13.37) | |||||
Table 5.
Means (M) and standard deviations (SD) for the cardiorespiratory responses for each condition (BR: dietary nitrate, CAF: caffeine, PLA: placebo) and time trial section.
| Parameter | N | BR+CAF | BR+PLA | CAF+PLA | PLA+PLA | |||||
|---|---|---|---|---|---|---|---|---|---|---|
| M (SD) | M (SD) | M (SD) | M (SD) | |||||||
| Cardiorespiratory function | ||||||||||
| 1000 m VO2 [l/min] | 11 | 4.36 (0.60) | 4.38 (0.55) | 4.38 (0.60) | 4.29 (0.60) | |||||
| 750 m VO2 [l/min] | 11 | 4.41 (0.53) | 4.39 (0.49) | 4.34 (0.49) | 4.24 (0.55) | |||||
| 500 m VO2 [l/min] | 11 | 4.34 (0.50) | 4.34 (0.46) | 4.25 (0.49) | 4.22 (0.51) | |||||
| 250 m VO2 [l/min] | 11 | 4.14 (0.44) | 4.10 (0.46) | 4.04 (0.44) | 4.03 (0.42) | |||||
| 150 m VO2 [l/min] | 11 | 3.49 (0.50) | 3.44 (0.57) | 3.18 (0.42) | 3.39 (0.46) | |||||
| 100 m VO2 [l/min] | 11 | 1.98 (0.44) | 2.16 (0.80) | 2.13 (0.33) | 1.98 (0.42) | |||||
| 50 m VO2 [l/min] | 11 | 0.99 (0.21) | 1.04 (0.24) | 1.08 (0.21) | 0.93 (0.26) | |||||
| 1000 m VO2/kg [ml/min/kg] | 11 | 55.07 (6.59) | 55.35 (5.18) | 55.20 (5.39) | 54.12 (5.70) | |||||
| 750 m VO2/kg [ml/min/kg] | 11 | 55.82 (6.37) | 55.58 (5.64) | 54.82 (5.04) | 53.57 (5.70) | |||||
| 500 m VO2/kg [ml/min/kg] | 11 | 54.88 (5.81) | 54.90 (5.29) | 53.70 (4.70) | 53.37 (5.35) | |||||
| 250 m VO2/kg [ml/min/kg] | 11 | 52.40 (5.68) | 51.93 (5.69) | 51.07 (4.64) | 51.09 (5.46) | |||||
| 150 m VO2/kg [ml/min/kg] | 11 | 44.35 (7.32) | 43.64 (8.20) | 40.41 (5.80) | 43.23 (7.17) | |||||
| 100 m VO2/kg [ml/min/kg] | 11 | 25.23 (6.40) | 27.47 (10.13) | 27.16 (5.38) | 25.28 (5.76) | |||||
| 50 m VO2/kg [ml/min/kg] | 11 | 12.47 (2.53) | 13.29 (3.41) | 13.57 (2.22) | 11.88 (3.93) | |||||
| 1000 m HR [b/min] | 6 | 182.95 (3.67) | 181.55 (4.87) | 183.15 (4.31) | 181.95 (5.41) | |||||
| 750 m HR [b/min] | 7 | 177.64 (10.80) | 178.28 (7.15) | 180.96 (5.10) | 179.22 (6.83) | |||||
| 500 m HR [b/min] | 6 | 179.37 (5.75) | 177.44 (8.09) | 179.32 (6.72) | 179.13 (6.58) | |||||
| 250 m HR [b/min] | 8 | 171.69 (11.07) | 171.23 (8.67) | 170.74 (12.67) | 173.93 (8.15) | |||||
| 150 m HR [b/min] | 6 | 174.81 (3.64) | 169.11 (4.69) | 172.68 (6.02) | 172.96 (7.78) | |||||
| 100 m HR [b/min] | 6 | 163.23 (4.78) | 154.34 (7.36) | 161.60 (7.44) | 160.46 (8.08) | |||||
| 50 m HR [b/min] | 9 | 131.24 (13.61) | 124.72 (12.21) | 129.32 (10.80) | 133.71 (15.41) | |||||
| 1000 m VE/VO2 | 11 | 32.74 (3.16) | 31.52 (2.15) | 32.22 (3.33) | 31.64 (3.50) | |||||
| 750 m VE/VO2 | 11 | 32.73 (3.24) | 31.90 (2.13) | 32.32 (3.19) | 32.28 (3.33) | |||||
| 500 m VE/VO2 | 11 | 32.63 (3.74) | 31.81 (2.61) | 32.52 (3.35) | 32.96 (3.05) | |||||
| 250 m VE/VO2 | 11 | 31.24 (3.22) | 29.64 (2.76) | 31.34 (3.29) | 31.20 (2.92) | |||||
| 150 m VE/VO2 | 11 | 31.15 (4.58) | 29.60 (3.21) | 31.85 (5.24) | 30.79 (4.02) | |||||
| 100 m VE/VO2 | 11 | 41.61 (12.37) | 40.03 (9.17) | 43.53 (8.92) | 51.17 (11.64) | |||||
| 50 m VE/VO2 | 11 | 51.12 (19.21) | 48.28 (16.18) | 65.23 (28.94) | 68.91 (28.98) | |||||
| 1000 m VE/VCO2 | 11 | 30.53 (2.74) | 29.17 (2.05) | 29.90 (2.80) | 29.35 (2.95) | |||||
| 750 m VE/VCO2 | 11 | 29.71 (2.18) | 28.85 (1.57) | 29.51 (2.24) | 29.08 (2.26) | |||||
| 500 m VE/VCO2 | 11 | 29.19 (2.49) | 28.30 (1.94) | 29.34 (2.44) | 28.89 (1.53) | |||||
| 250 m VE/VCO2 | 11 | 30.50 (2.84) | 29.15 (2.32) | 31.05 (3.07) | 29.80 (2.37) | |||||
| 150 m VE/VCO2 | 11 | 33.25 (4.17) | 31.86 (2.79) | 34.25 (4.75) | 31.67 (2.77) | |||||
| 100 m VE/VCO2 | 11 | 36.57 (7.75) | 35.32 (5.48) | 37.78 (5.19) | 41.85 (6.52) | |||||
| 50 m VE/VCO2 | 11 | 36.83 (9.12) | 35.77 (8.02) | 47.88 (20.83) | 48.90 (16.89) | |||||
| 1000 m RER | 11 | 1.07 (0.03) | 1.08 (0.03) | 1.08 (0.03) | 1.08 (0.05) | |||||
| 750 m RER | 11 | 1.10 (0.04) | 1.11 (0.04) | 1.09 (0.04) | 1.11 (0.05) | |||||
| 500 m RER | 11 | 1.12 (0.06) | 1.12 (0.06) | 1.11 (0.05) | 1.14 (0.06) | |||||
| 250 m RER | 11 | 1.03 (0.07) | 1.02 (0.07) | 1.01 (0.05) | 1.05 (0.08) | |||||
| 150 m RER | 11 | 0.94 (0.08) | 0.93 (0.07) | 0.93 (0.06) | 0.97 (0.07) | |||||
| 100 m RER | 11 | 1.10 (0.17) | 1.12 (0.14) | 1.14 (0.11) | 1.18 (0.11) | |||||
| 50 m RER | 11 | 1.36 (0.21) | 1.30 (0.20) | 1.35 (0.10) | 1.37 (0.25) | |||||
Abbreviations: VO2 = oxygen uptake; HR = heart rate; VE/VO2 = respiratory equivalent for O2; VE/VCO2 = respiratory equivalent for carbon dioxide; RER = respiratory exchange ratio.
Table 6.
Means (M) and standard deviations (SD) for the variables of muscle oxygenation for each condition (BR: dietary nitrate, CAF: caffeine, PLA: placebo) and time trial section.
| Parameter | N | BR+CAF | BR+PLA | CAF+PLA | PLA+PLA | |||||
|---|---|---|---|---|---|---|---|---|---|---|
| M (SD) | M (SD) | M (SD) | M (SD) | |||||||
| Muscle oxygenation | ||||||||||
| 1000 m TSI [%] | 10 | 49.35 (8.84) | 48.98 (6.88) | 48.85 (8.85) | 50.95 (8.99) | |||||
| 750 m TSI [%] | 10 | 49.72 (8.18) | 49.36 (6.55) | 49.61 (8.85) | 51.97 (9.11) | |||||
| 500 m TSI [%] | 10 | 49.53 (8.51) | 49.00 (6.55) | 49.25 (9.36) | 51.60 (9.86) | |||||
| 250 m TSI [%] | 10 | 48.18 (9.44) | 47.01 (7.20) | 46.96 (9.79) | 50.39 (10.11) | |||||
| 150 m TSI [%] | 10 | 47.37 (9.74) | 46.57 (7.60) | 46.27 (9.24) | 49.40 (10.06) | |||||
| 100 m TSI [%] | 10 | 46.88 (9.19) | 46.49 (7.96) | 45.96 (8.90) | 49.17 (9.73) | |||||
| 50 m TSI [%] | 10 | 59.25 (3.80) | 58.23 (5.42) | 56.85 (7.72) | 60.06 (5.07) | |||||
| 1000 m O2HB | 10 | 68.78 (6.24) | 69.33 (5.90) | 68.32 (8.28) | 70.03 (12.87) | |||||
| 750 m O2HB | 10 | 69.03 (6.53) | 69.46 (5.53) | 69.34 (8.97) | 70.88 (13.58) | |||||
| 500 m O2HB | 10 | 67.21 (7.50) | 66.69 (6.15) | 67.55 (8.72) | 69.21 (15.46) | |||||
| 250 m O2HB | 10 | 63.79 (8.68) | 63.26 (6.32) | 63.60 (8.71) | 66.35 (16.53) | |||||
| 150 m O2HB | 10 | 61.73 (9.34) | 61.76 (6.33) | 61.74 (8.94) | 64.57 (17.14) | |||||
| 100 m O2HB | 10 | 61.58 (9.74) | 61.71 (5.92) | 61.27 (9.70) | 64.37 (17.07) | |||||
| 50 m O2HB | 10 | 72.61 (6.69) | 71.27 (5.69) | 71.17 (10.80) | 74.08 (16.39) | |||||
| 1000 m HHB | 10 | 89.19 (11.81) | 87.38 (12.93) | 87.10 (14.37) | 87.23 (13.25) | |||||
| 750 m HHB | 10 | 87.46 (11.06) | 85.87 (12.63) | 85.41 (13.99) | 85.73 (12.91) | |||||
| 500 m HHB | 10 | 86.59 (10.55) | 84.49 (12.77) | 84.98 (14.22) | 85.52 (12.94) | |||||
| 250 m HHB | 10 | 85.50 (10.06) | 83.35 (12.68) | 84.40 (14.24) | 84.81 (12.80) | |||||
| 150 m HHB | 10 | 83.49 (9.50) | 81.45 (12.29) | 82.82 (13.74) | 83.17 (12.74) | |||||
| 100 m HHB | 10 | 81.60 (9.29) | 79.51 (11.98) | 81.20 (13.54) | 81.32 (12.67) | |||||
| 50 m HHB | 10 | 64.94 (7.61) | 65.41 (9.52) | 66.51 (11.44) | 65.71 (10.77) | |||||
| 1000 m tHB | 10 | 157.98 (12.58) | 156.71 (15.30) | 155.42 (19.96) | 157.26 (20.36) | |||||
| 750 m tHB | 10 | 156.48 (13.39) | 155.33 (16.03) | 154.74 (21.23) | 156.61 (21.82) | |||||
| 500 m tHB | 10 | 153.80 (13.67) | 151.18 (16.85) | 152.54 (21.26) | 154.74 (24.01) | |||||
| 250 m tHB | 10 | 149.29 (13.64) | 146.61 (16.50) | 148.00 (20.47) | 151.16 (24.97) | |||||
| 150 m tHB | 10 | 145.21 (13.68) | 143.21 (15.96) | 144.56 (20.14) | 147.74 (25.63) | |||||
| 100 m tHB | 10 | 143.18 (13.29) | 141.23 (15.38) | 142.47 (20.45) | 145.69 (25.63) | |||||
| 50 m tHB | 10 | 137.55 (12.65) | 136.68 (14.05) | 137.68 (20.66) | 139.79 (25.59) | |||||
Abbreviations: TSI = tissue saturation index; O2Hb = oxygenated hemoglobin; HHb = deoxygenated hemoglobin; tHB = total hemoglobin.
Table 7.
Means (M) and standard deviations (SD) of the variables of muscle activity for each condition (BR: dietary nitrate, CAF: caffeine, PLA: placebo) and time trial section.
| Parameter | N | BR+CAF | BR+PLA | CAF+PLA | PLA+PLA | |||||
|---|---|---|---|---|---|---|---|---|---|---|
| M (SD) | M (SD) | M (SD) | M (SD) | |||||||
| Muscle activity | ||||||||||
| 1000 m RMSabs | 11 | 0.23 (0.08) | 0.22 (0.09) | 0.21 (0.09) | 0.23 (0.08) | |||||
| 750 m RMSabs | 11 | 0.21 (0.07) | 0.20 (0.08) | 0.20 (0.07) | 0.20 (0.07) | |||||
| 500 m RMSabs | 11 | 0.21 (0.07) | 0.19 (0.07) | 0.19 (0.07) | 0.21 (0.07) | |||||
| 250 m RMSabs | 11 | 0.22 (0.06) | 0.21 (0.06) | 0.19 (0.06) | 0.22 (0.06) | |||||
| 150 m RMSabs | 11 | 0.24 (0.07) | 0.23 (0.06) | 0.21 (0.06) | 0.24 (0.06) | |||||
| 100 m RMSabs | 11 | 0.28 (0.08) | 0.25 (0.06) | 0.24 (0.07) | 0.27 (0.07) | |||||
| 50 m RMSabs | 11 | 0.28 (0.08) | 0.27 (0.10) | 0.24 (0.07) | 0.28 (0.08) | |||||
| 1000 m RMSrel [%] | 11 | 81.80 (13.55) | 81.19 (19.11) | 84.20 (21.23) | 81.11 (14.91) | |||||
| 750 m RMSrel [%] | 11 | 73.60 (13.81) | 73.76 (18.16) | 80.03 (16.24) | 73.74 (16.44) | |||||
| 500 m RMSrel [%] | 11 | 73.25 (13.30) | 73.03 (16.64) | 76.61 (11.54) | 74.01 (16.76) | |||||
| 250 m RMSrel [%] | 11 | 80.02 (10.82) | 78.80 (17.96) | 79.54 (9.04) | 79.84 (13.46) | |||||
| 150 m RMSrel [%] | 11 | 87.09 (11.89) | 87.52 (24.62) | 86.33 (7.61) | 87.72 (13.06) | |||||
| 100 m RMSrel [%] | 11 | 101.05 (16.28) | 98.85 (33.22) | 97.18 (6.95) | 99.30 (11.75) | |||||
| 50 m RMSrel [%] | 11 | 100 | 100 | 100 | 100 | |||||
Abbreviations: RMSabs = absolute root mean square; RMSrel = relative root mean square.
3.2. Cardiorespiratory function
The one-way RMANOVA (Table 2) for the parameters related to the entire 1000 m TT indicated only a significant difference in VO2max between the conditions (p = 0.045, ηp2 = 0.214) (Figure 3). However, post-hoc tests (Table 8) did not reveal any difference for the supplement conditions compared to PLA+PLA. The two-way RMANOVA (Table 3) showed significant interaction effects for HR (p = 0.023, ηp2 = 0.278), VE/VO2 (p = 0.005, ηp2 = 0.179), and VE/VCO2 (p = 0.000, ηp2 = 0.215). However, post-hoc analyses showed no differences for HR in relation to PLA+PLA. Nevertheless, VE/VO2 was lower only during BR+PLA during the 150-250 m (ΔM = -1.56, p = 0.02, CI [-2.86; -0.28] dz 1.19) and 250-500 m section (ΔM = -1.15, p = 0.03, CI [-2.19; -0.12], dz 1.10) compared to PLA+PLA, whereas VE/VCO2 was significantly higher during CAF+PLA during 150-250 m section (ΔM = 1.26, p = 0.04, CI [0.04; 2.47], dz 1.00) compared to PLA+PLA.
Figure 3.
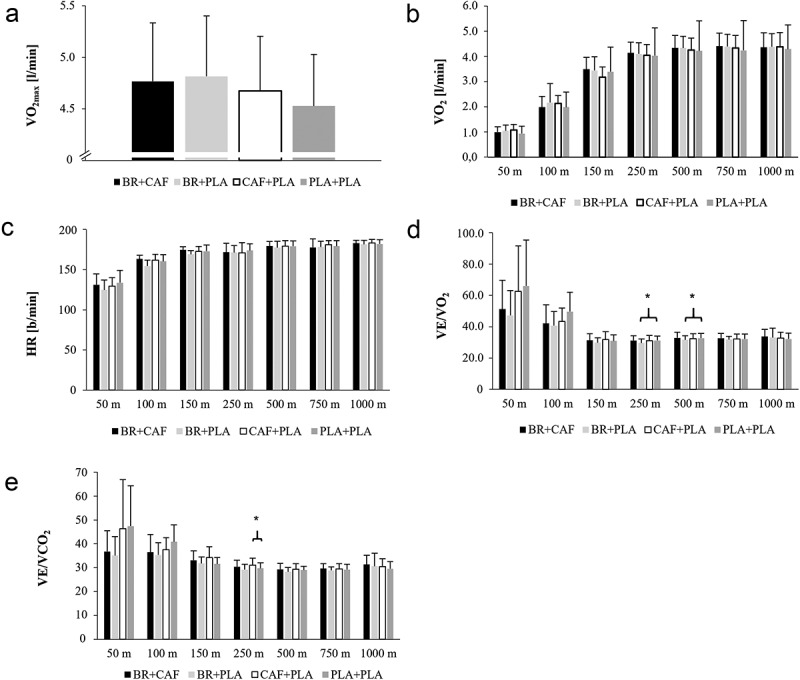
(A) maximal oxygen uptake (VO2), (B) oxygen uptake (VO2), (C) heart rate (HR), (D) respiratory equivalent for O2 (VE/VO2) and (E) CO2 (VE/VCO2) during the respective kayak ergometer-based 1000 m time trial. Differences are marked and were found between (D) VE/VO2 for BR+PLA and PLA+PLA during the sections 150-250 m and 250-500 m as well as for (E) VE/VO2 between CAF+PLA and PLA+PLA during the section 150-250 m.
Table 8.
Post-hoc analyses of two-way RMANOVA. Differences between the conditions (BR: dietary nitrate, CAF: caffeine, PLA: placebo) are shown as mean differences (ΔM) = supplement - placebo with 95% confidence intervals (CI 95%) and the effect size Cohens dz (dz).
| BR+CAF vs. PLA+PLA |
BR+PLA vs. PLA+PLA |
CAF+PLA vs. PLA+PLA |
|||||||||||||||||||||||||
|---|---|---|---|---|---|---|---|---|---|---|---|---|---|---|---|---|---|---|---|---|---|---|---|---|---|---|---|
| Parameter | N | ΔM | P | CI (95 %) |
dz | ΔM | P | CI (95 %) |
dz | ΔM | P | CI (95 %) |
dz | ||||||||||||||
| LL | UL | LL | UL | LL | UL | ||||||||||||||||||||||
| 1000 m HR [b/min] | 6 | 1.00 | 1.00 | −5.39 | 7.39 | 0.27 | −0.40 | 1.00 | −7.06 | 6.26 | 0.10 | 1.20 | 1.00 | −5.55 | 7.95 | 0.31 | |||||||||||
| 750 m HR [b/min] | 7 | −1.58 | 1.00 | −11.09 | 7.93 | 0.24 | −0.94 | 1.00 | −5.25 | 3.37 | 0.32 | 1.74 | 1.00 | −5.18 | 8.65 | 0.37 | |||||||||||
| 500 m HR [b/min] | 6 | 0.24 | 1.00 | −4.24 | 4.72 | 0.09 | −1.70 | 1.00 | −8.11 | 4.72 | 0.45 | 0.19 | 1.00 | −7.14 | 7.51 | 0.05 | |||||||||||
| 250 m HR [b/min] | 8 | −2.23 | 1.00 | −9.64 | 5.17 | 0.39 | −2.70 | 0.36 | −7.08 | 1.68 | 0.79 | −3.18 | 1.00 | −12.11 | 5.74 | 0.46 | |||||||||||
| 150 m HR [b/min] | 6 | 1.86 | 1.00 | −6.43 | 10.14 | 0.39 | −3.85 | 0.73 | −12.56 | 4.87 | 0.76 | −0.28 | 1.00 | −8.60 | 8.03 | 0.06 | |||||||||||
| 100 m HR [b/min] | 6 | 2.76 | 1.00 | −8.08 | 13.61 | 0.44 | −6.12 | 1.00 | −25.75 | 13.50 | 0.54 | 1.14 | 1.00 | −11.65 | 13.92 | 0.15 | |||||||||||
| 50 m HR [b/min] | 9 | −2.48 | 1.00 | −19.99 | 15.04 | 0.16 | −8.99 | 1.00 | −29.52 | 11.53 | 0.51 | −4.39 | 1.00 | −19.41 | 10.63 | 0.34 | |||||||||||
| 1000 m VE/VO2 | 11 | 1.10 | 0.13 | −0.23 | 2.43 | 0.82 | −0.13 | 1.00 | −1.74 | 1.49 | 0.07 | 0.58 | 1.00 | −0.81 | 2.00 | 0.41 | |||||||||||
| 750 m VE/VO2 | 11 | 0.45 | 1.00 | −0.62 | 1.53 | 0.41 | −0.37 | 1.00 | −1.99 | 1.25 | 0.23 | 0.05 | 1.00 | −1.56 | 1.66 | 0.02 | |||||||||||
| 500 m VE/VO2 | 11 | −0.33 | 1.00 | −1.97 | 1.31 | 0.20 | −1.15 | 0.03* | −2.19 | −0.12 | 1.10 | −0.44 | 1.00 | −2.07 | 1.19 | 0.27 | |||||||||||
| 250 m VE/VO2 | 11 | 0.04 | 1.00 | −1.52 | 1.61 | 0.03 | −1.56 | 0.02* | −2.86 | −0.27 | 1.19 | 0.13 | 1.00 | −1.28 | 1.55 | 0.10 | |||||||||||
| 150 m VE/VO2 | 11 | 0.37 | 1.00 | −4.10 | 4.83 | 0.08 | −1.19 | 1.00 | −4.75 | 2.37 | 0.33 | 1.07 | 1.00 | −4.83 | 6.96 | 0.18 | |||||||||||
| 100 m VE/VO2 | 11 | −9.56 | 0.80 | −28.70 | 9.58 | 0.49 | −11.15 | 0.18 | −25.67 | 3.37 | 0.76 | −7.65 | 0.93 | −23.95 | 8.66 | 0.46 | |||||||||||
| 50 m VE/VO2 | 11 | −17.79 | 0.95 | −55.98 | 20.40 | 0.46 | −20.64 | 0.54 | −56.64 | 15.36 | 0.57 | −3.69 | 1.00 | −31.08 | 23.70 | 0.13 | |||||||||||
| 1000 m VE/VCO2 | 11 | 1.18 | 0.28 | −0.52 | 2.88 | 0.69 | −0.18 | 1.00 | −1.53 | 1.17 | 0.13 | 0.55 | 1.00 | −0.99 | 2.10 | 0.35 | |||||||||||
| 750 m VE/VCO2 | 11 | 0.62 | 0.66 | −0.54 | 1.78 | 0.54 | −0.24 | 1.00 | −1.59 | 1.12 | 0.17 | 0.43 | 1.00 | −1.03 | 1.88 | 0.29 | |||||||||||
| 500 m VE/VCO2 | 11 | 0.30 | 1.00 | −1.08 | 1.68 | 0.22 | −0.59 | 0.14 | −1.31 | 0.13 | 0.81 | 0.45 | 1.00 | −0.86 | 1.76 | 0.34 | |||||||||||
| 250 m VE/VCO2 | 11 | 0.70 | 1.00 | −0.86 | 2.27 | 0.44 | −0.65 | 0.37 | −1.65 | 0.36 | 0.64 | 1.26 | 0.04* | 0.04 | 2.47 | 1.00 | |||||||||||
| 150 m VE/VCO2 | 11 | 1.58 | 1.00 | −2.83 | 5.99 | 0.35 | 0.19 | 1.00 | −3.37 | 3.74 | 0.05 | 2.58 | 0.87 | −2.77 | 7.93 | 0.48 | |||||||||||
| 100 m VE/VCO2 | 11 | −5.29 | 1.00 | −18.06 | 7.49 | 0.41 | −6.53 | 0.31 | −16.24 | 3.17 | 0.67 | −4.08 | 1.00 | −14.10 | 5.95 | 0.40 | |||||||||||
| 50 m VE/VCO2 | 11 | −12.07 | 0.70 | −35.14 | 10.99 | 0.52 | −13.13 | 0.39 | −33.91 | 7.65 | 0.62 | −1.03 | 1.00 | −18.72 | 16.66 | 0.06 | |||||||||||
| VO2max [l/min] | 12 | 0.24 | 0.31 | −0.11 | 0.59 | 0.63 | 0.29 | 0.43 | −0.18 | 0.75 | 0.56 | 0.14 | 0.71 | −0.13 | 0.43 | 0.50 | |||||||||||
| 1000 m HHb | 10 | 1.96 | 1.00 | −3.04 | 6.97 | 0.42 | 0.15 | 1.00 | −7.15 | 7.44 | 0.02 | −0.13 | 1.00 | −6.45 | 6.20 | 0.02 | |||||||||||
| 750 m HHb | 10 | 1.73 | 1.00 | −3.84 | 7.30 | 0.33 | 0.14 | 1.00 | −6.67 | 6.95 | 0.02 | −0.32 | 1.00 | −6.83 | 6.18 | 0.05 | |||||||||||
| 500 m HHb | 10 | 1.06 | 1.00 | −5.10 | 7.22 | 0.19 | −1.04 | 1.00 | −9.17 | 7.09 | 0.14 | −0.54 | 1.00 | −8.06 | 6.98 | 0.08 | |||||||||||
| 250 m HHb | 10 | 0.69 | 1.00 | −5.52 | 6.90 | 0.12 | −1.46 | 1.00 | −10.23 | 7.31 | 0.18 | −0.41 | 1.00 | −8.08 | 7.26 | 0.06 | |||||||||||
| 150 m HHb | 10 | 0.32 | 1.00 | −5.97 | 6.61 | 0.05 | −1.72 | 1.00 | −10.77 | 7.33 | 0.20 | −0.35 | 1.00 | −7.87 | 7.17 | 0.05 | |||||||||||
| 100 m HHb | 10 | 0.27 | 1.00 | −6.03 | 6.58 | 0.05 | −1.81 | 1.00 | −10.85 | 7.23 | 0.21 | −0.12 | 1.00 | −7.53 | 7.29 | 0.02 | |||||||||||
| 50 m HHb | 10 | −0.77 | 1.00 | −5.85 | 4.30 | 0.16 | −0.31 | 1.00 | −8.68 | 8.07 | 0.04 | 0.79 | 1.00 | −6.44 | 8.03 | 0.12 | |||||||||||
Abbreviations: HR = heart rate; VE/VO2 = respiratory equivalent for O2; VE/VCO2 = respiratory equivalent for carbon dioxide; VO2max = maximum oxygen uptake; HHb = deoxygenated hemoglobin.
3.3. Muscle oxygenation
No differences between conditions were found for TSI (p = 0.347, ηp2 = 0.113), O2HB (p = 0.894, ηp2 = 0.022), HHB (p = 0.823, ηp2 = 0.033), and tHB (p = 0.939, ηp2 = 0.015) regarding the entire 1000 m TT (Table 2). Although the two-way RMANOVA (Table 3) showed a significant interaction effect for HHB (p = 0.042, ηp2 = 0.160), post-hoc tests (Table 8) indicated no differences compared to PLA+PLA.
3.4. Muscle activity
The one-way (p = 0.242, ηp2 = 0.141; p = 0.296, ηp2 = 0.126) (Table 2) and the two-way RMANOVA (p = 0.638, ηp2 = 0.078; p = 0.988, ηp2 = 0.038) (Table 3), respectively, showed no significant effect for condition and for condition × section with respect to RMSabs and RMSrel.
3.5. Perceptual responses and motivation
The one-way RMANOVA (Table 2) indicated no significant supplement-induced effect on trait fatigue (MFIS), state fatigue (POMS-Fpre, POMS-Fpost, POMS-Fpre-post), effort- and exercise-induced pain perception, as well as motivation (DSSQ-A, B).
4. Discussion
The present study investigated the effects of acute isolated and combined ingestion of 140 ml nitrate-rich beetroot concentrate (~12.5 mmol nitrate) and/or caffeine (3 mg/kg) on ergometer-based 1000 m TT performance in highly trained kayakers. Against our hypotheses, the supplements did not improve TT performance compared to the PLA+PLA condition, either in isolation or in combination. Nevertheless, VE/VO2 was lower during the sections 150-250 m and 250-500 m in the BR+PLA condition, whereby VE/VCO2 was higher during the section 150-250 m in the CAF+PLA compared to the PLA+PLA condition, respectively. Moreover, perceived trait fatigue, perceived state fatigue, motivation, as well as effort- and exercise-induced pain perception were not different between conditions.
4.1. Effects of dietary nitrate ingestion
Due to the potential acute effects of NO described before (e.g. reduction of O2 demand, increased contractile efficiency, ATP utilization), an improvement in ergometer-based 1000 m TT performance in kayak athletes was expected. However, the optimal conditions for a performance-enhancing effect of dietary nitrate are partially unclear, especially in elite athletes [79]. This is mirrored by the literature showing that some studies have found a performance-enhancing effect [2,5,8,80], while others reported no or only marginal effects [81–83]. This is thought to be partly due to the already highly trained oxidative metabolism and the greater bioavailability of NO in athletes [81–83]. For instance, Peeling et al. [8] investigated the effect of both 140 ml (~9.6 mmol nitrate) on 500 m TT on-water performance in female highly trained kayakers as well as 70 ml beetroot concentrate ingestion (~4.8 mmol nitrate) during a 4 min ergometer test in male national-level kayakers. In line with our results, the distance covered on the ergometer in 4 min did also not differ between the supplement and placebo condition. However, the authors found a lower VO2 during the on-water 500 m TT after dietary nitrate intake indicating an improved exercise economy. This difference was possibly responsible for the 500 m TT performance improvement by 1.7% compared to placebo. Although a higher amount of nitrate was used in the present study (~12.5 mmol vs. ~9.6 and ~4.8 mmol nitrate), neither an improvement in performance nor a reduction in VO2 compared to PLA+PLA was found. Nevertheless, a lower VE/VO2 was observed after dietary nitrate ingestion compared to PLA+PLA during the 150-250 m and 250-500 m sections, which could possibly be due to a delayed increase in respiratory drive related to the potentially reduced metabolite accumulation and/or improved metabolite removal from the muscles, but without decreasing VO2, probably due to the effect of dietary nitrate on vascular and/or muscle function. Moreover, the ergogenic effect of NO on VO2 as well as mitochondrial respiration in elite athletes appears questionable overall, given that it remained unchanged after ingestion of dietary nitrate in several studies [81,84–86]. Furthermore, parameters representing breathing efficiency should be interpreted with caution in the context of kayak racing, as the stroke frequency and strong rotation of the upper body could additionally influence breathing frequency and depth. Although no differences in stroke frequency could be observed between conditions, no statement can be made about the distribution of force or the timing of the impulse during the strokes. Moreover, oxygenation of the deltoid muscle was not altered by dietary nitrate intake in the present study. It was expected that muscle oxygenation will be higher after dietary nitrate ingestion [23] leading to an increased TT performance, given the finding that 71% of the variance of the 500 m and 1000 m on-water performance in highly trained kayakers could be explained by deoxygenated hemoglobin concentration in the latissimus dorsi, biceps brachii, and vastus lateralis muscles [87].
Using lower dosages, Muggeridge et al. also found no improvement in both 1000 m TT and sprint performance on the ergometer (5 × 10 s all-out) after dietary nitrate ingestion (70 ml beetroot concentrate, ~5 mmol nitrate) in elite kayak athletes. Nevertheless, VO2 was reduced during the 1000 m TT compared to the placebo condition [2]. In elite rowers, it was further observed that the ergogenic effect of dietary nitrate was dose-dependent, i.e. only 140 ml (~8.4 mmol nitrate) and not 70 ml (~4.2 mmol nitrate) improved 2000 m TT performance (~0.5%) compared to the lower dose and placebo condition [3]. However, it remains uncertain whether the kayakers in the present study would have benefited from a higher dose (> ~12.5 mmol nitrate). This is supported by the results of a study with elite cross-country skiers, showing that neither 5 km TT performance increased nor physiological changes were observed, although plasma nitrate and nitrite concentrations increased significantly after acute supplementation with 614 mg nitrate (319 nmol/l) in combination with 6 g L-arginine (328 nmol/l) compared to the placebo condition (149 nmol/l) [86]. Furthermore, a systematic review with meta-analysis [88] indicated only a small effect for performance improvements across different exercises after dietary nitrate ingestion in healthy recreational active young males. Consequently, highly trained endurance athletes might benefit from the NO-based effects of nitrate supplementation only to a very limited extent [89]. It is conceivable that the long-term training may have increased endothelial NO activity in the kayakers investigated in the present study. Since the vascular endothelium is the main place of NO-action, this might be an explanation for the lack of improvement. Against this background, it is also conceivable that the conditions required for the reduction of nitrite to NO may not have been optimal. The required low pH value and/or O2 partial pressure is only achieved under hypoxic conditions, which occur during high-intensity exercise [90]. Compared to the 500 m TT investigated by Peeling et al., a different race strategy or a more moderate pacing under probably at least partially aerobic energy supply is required during the 1000 m TT [91]. Although 1000 m TT performance seems to be primarily determined aerobically [92], it seems obvious that the TT was carried out in the severe-intensity anaerobic domain. However, the hypoxic conditions for a reduction of nitrate and impact of additive NO were probably not sufficient during the 1000 m TT. Another factor influencing the performance enhancing effects of dietary nitrate ingestion is the duration of supplementation. In a review with integrated meta-analysis including well-trained subjects, a sub-group analysis revealed only small additional effects after long-term (> 3 days) compared to acute or short-term (< 3 days) supplementation on exercise tolerance. Furthermore, neither dose nor duration of supplementation had a significant effect on TT performance in trained subjects [93].
4.2. Effects of caffeine ingestion
Caffeine acts primarily in the central nervous system and has been shown to increase motor performance accompanied by a lower effort as well as exercise-induced pain perception during endurance exercise and an increased neural activation during strength tasks [25,39,94,95]. Therefore, it was assumed that caffeine ingestion will enhance performance during an ergometer-based 1000 m TT in highly trained kayakers. In this regard, not only altered perceptual responses in relation to the power output were expected, but also a more powerful starting performance, an increased average power output, and stroke frequency due to a potentially higher voluntary activation and force production of muscles. To the authors’ knowledge, there are no comparable studies that have investigated the influence of caffeine on TT performance in kayaking; however, there are findings from other endurance-based sports. In contrast to the results of the present study, acute caffeine supplementation with 3 mg/kg significantly increased the covered distance (+ 0.70%) and average power output (+ 1.78%) during a 6 min maximal performance test on the ergometer compared to the placebo condition in elite rowers [6]. The authors attributed their findings to the potential influence of caffeine on the central nervous system, e.g. a reduced exercise-induced pain perception. Furthermore, they speculated about muscular mechanisms, e.g. tolerance to higher lactate concentrations, improved calcium release [96] and reduced accumulation of interstitial potassium [97]. Carr et al. [9] also demonstrated a ~2% improvement in ergometer-based 2000 m TT performance in elite rowers after caffeine intake of 6 mg/kg. Power output was increased by 2.31% with the greatest effect observed during the 0-500 m section. However, another study showed that 2, 4 and 6 mg/kg caffeine had no effect on 2000 m TT performance in rowing [7].
In the present study, caffeine increased VE/VCO2 compared to PLA+PLA during the 150-250 m section. Considering the lack of differences in respiratory gas volumes between the conditions, a discussion of the physiological mechanism behind the transient increase in VE/VCO2 is not straightforward. Nevertheless, given that caffeine is a stimulant, which can also increase ventilation during exercise [98], its ingestion might have altered breathing efficacy during the 1000 m TT. Further, irrespective of caffeine’s modulating effect on VE/VCO2, TT performance was not different between conditions.
Caffeine has not affected effort and exercise-induced pain perception during the TT in the present study compared to PLA+PLA. It is assumed that performance during whole-body exercises is related to effort and exercise-induced pain perception [44], which can be modulated by caffeine ingestion [47,99]. This is supported by a systematic review with meta-analysis reporting a ~5.6% reduction in effort perception during exercise and an improved exercise performance by ~11.2% after caffeine ingestion. Moreover, it seems that participants can tolerate more exercise-induced discomfort/pain after caffeine intake [99–101]. Submaximal and maximal contractions increase the concentration of adenosine in the venous blood of the working muscles, which is mainly formed from adenosine monophosphate and dephosphorylated by ecto-5-nucleotidase [102]. Its binding to A1 receptors increases the perception of pain [103], whereby this can be prevented by the antagonistic effect of caffeine resulting in analgesic properties. As reported by Gonglach et al. [41], there appears to be a high pain threshold in highly trained kayakers, above which the antagonistic adenosine receptor binding of caffeine alone might no longer reduce the perception of exercise-induced pain. This is supported by the finding that 5 mg/kg caffeine ingestion did not reduce effort and exercise-induced pain perception, but significantly improved 10 km TT performance on a cycle ergometer by 0.3-2.0% in endurance-trained subjects [43].
Furthermore, there is evidence that highly trained endurance athletes benefit less from caffeine ingestion. For instance, Santos et al. [104] reported that 4 km TT performance on a cycle ergometer improved more in untrained (-2.53%) than in highly trained (-1.50%) subjects after 5 mg/kg caffeine ingestion. Therefore, it is possible that the kayakers of the present study would have benefited from a higher dose of caffeine, given the higher density of adenosine receptors in trained compared to untrained subjects [105]. However, systematic reviews also indicated that significant ergogenic effects of caffeine intake on endurance and strength performance during various exercise tasks occur primarily with dosages between 3 and 6 mg/kg [24,47,106]. Furthermore, some of the subjects in this study were habituated to caffeine and consumed moderate doses (133.41 ± 246.15 mg/day). However, in a systematic review with meta-analysis, no influence on the ergogenic effect of caffeine due to potential habituation was found [24]. Overall, it seems unclear whether a higher dose of caffeine (e.g. 6 mg/kg or up to 9 mg/kg to potentially improve high-velocity muscle contractions against higher loads [107]) would have been more ergogenic in the kayakers of the present study. For athletes, however, it generally seems to be recommendable to supplement with a higher dose as usual [108]. Although the daily caffeine intake of the kayak athletes in the present study was relatively low (133.41 ± 246.15 mg), it is unclear whether TT performance was influenced by the 72-h caffeine abstinence [109–111]. In general, caffeine withdrawal can lead to side effects in those who are habituated or maybe addicted to caffeine [112,113]. However, none of the test subjects reported any negative impacts, such as headache, after caffeine abstinence.
4.3. Effects of combined nitrate and caffeine ingestion
It was hypothesized that the primarily muscular-acting dietary nitrate and the primarily central nervous system acting caffeine would additionally increase TT performance compared to their isolated ingestion and placebo. This assumption was based on the respective supplement-specific effects on metabolic efficiency, blood flow, contractile function, and voluntary activation of muscles, as well as the perceptual responses to exercise (e.g. effort and exercise-induced pain perception). However, results of the present study indicate that the combination of dietary nitrate and caffeine ingestion did not improve ergometer-based 1000 m TT performance in highly trained kayakers. This is in contrast to Lane et al. [49] who investigated the effects of combined dietary nitrate, obtained from 140 ml beetroot juice (~8.4 mmol nitrate), and 3 mg/kg caffeine intake on cycling TT performance (males: 43.83 km; females: 29.35 km). The male subjects improved performance by an average of 3.9% and 3.0% (p < 0.05) in the caffeine conditions (CAF+PLA and BR+CAF, respectively), but not during BR+PLA. The authors attributed the lack of an ergogenic effect of dietary nitrate to the long exercise time of ~50 min, potentially resulting in an insufficient hypoxic environment. Although the exercise time for the 1000 m TT was shorter (~4 min) in the present study, no significant improvement was found after isolated or combined dietary nitrate and caffeine intake.
The discussed mechanisms of dietary nitrate and caffeine could have interfaces at the muscle cellular level. Intracellular calcium determines, among other things, the activation of endothelial NO synthase, which controls the endogenous production of NO [114]. If caffeine indeed enhances calcium release and potentially increases NO concentration, this could explain the lack of ergogenic effects of both supplements in the present study. Additionally, adenosine accumulates in hypoxic environments during severe exercise and induces vasodilation, which is counteracted by the binding of caffeine derivatives to A1 receptors [102]. Conclusively, ergogenic effects after caffeine ingestion appear more likely, which is consistent with the results of a systematic review with meta-analysis [1].
4.4. Limitations
When interpreting the results of the present study, some limitations have to be considered. First, although the present study used a randomized, controlled, double-blind crossover design resulting in four randomized conditions ([i] BR+CAF, [ii] BR+PLA, [iii] CAF+PLA, [iv] PLA+PLA), no additional TT was carried out serving as a control condition to account for the placebo effect. Nevertheless, it was not possible to perform a 5th TT, because the athletes’ training schedule only allowed for very limited time slots. Second, the present results are only applicable for male highly trained kayak athletes and no valid conclusion can be drawn regarding other populations (e.g. females) and sporting activities (e.g. rowing).
5. Conclusion
Data indicate that the isolated and combined ingestion of dietary nitrate (140 ml beetroot concentrate, ~12.5 mmol nitrate) and caffeine (3 mg/kg) had no effect on 1000 m TT performance, the majority of physiological responses, as well as effort and exercise-induced pain perception in highly trained male kayakers. These findings might be related to the dosage and/or their already high amount of endogenous produced NO as well as efficient vascular, metabolic, and muscle function. Given that this study was conducted only with males, future experiments should investigate the effects of both supplements, ingested in isolation and combination, on TT performance as well as physiological and perceptual measures in females. In this regard, future research should not only investigate the impact of different dosages of dietary nitrate and caffeine on 1000 m kayak TT performance and the psychophysiological responses to exercise, but also their impact on these measures over other distances, which usually have to be completed during national and international kayak competitions.
Acknowledgments
We thank the German Canoe Federation (DKV e.V.), the athletes, and coaches for their cooperation.
Funding Statement
The author(s) reported there is no funding associated with the work featured in this article.
Disclosure statement
No potential conflict of interest was reported by the author(s).
References
- 1.Christensen PM, Shirai Y, Ritz C, et al. Caffeine and bicarbonate for speed. A meta-analysis of legal supplements potential for improving intense endurance exercise performance. Front Physiol. 2017;8:240. doi: 10.3389/fphys.2017.00240 [DOI] [PMC free article] [PubMed] [Google Scholar]
- 2.Muggeridge DJ, Howe CC, Spendiff O, et al. The effects of a single dose of concentrated beetroot juice on performance in trained flatwater kayakers. Int J Sport Nutr Exe. 2013;23(5):498–26. doi: 10.1123/ijsnem.23.5.498 [DOI] [PubMed] [Google Scholar]
- 3.Hoon MW, Jones AM, Johnson NA, et al. The effect of variable doses of inorganic nitrate-rich beetroot juice on simulated 2000-m rowing performance in trained athletes. Int J Sport Physiol. 2014;9(4):615–620. doi: 10.1123/ijspp.2013-0207 [DOI] [PubMed] [Google Scholar]
- 4.Lowings S, Shannon OM, Deighton K, et al. Effect of dietary nItrate supplementation on swimming performance in trained swimmers. Int J Sport Nutr Exe. 2017. Aug;27(4):377–384. doi: 10.1123/ijsnem.2016-0251 [DOI] [PubMed] [Google Scholar]
- 5.Garnacho-Castano MV, Pleguezuelos-Cobo E, Berbel M, et al. Effects of acute beetroot juice intake on performance, maximal oxygen uptake, and ventilatory efficiency in well-trained master rowers: a randomized, double-blinded crossover study. J Int Soc Sports Nutr. 2024. Dec;21(1):2373170. doi: 10.1080/15502783.2024.2373170 [DOI] [PMC free article] [PubMed] [Google Scholar]
- 6.Christensen PM, Petersen MH, Friis SN, et al. Caffeine, but not bicarbonate, improves 6 min maximal performance in elite rowers. Appl Physiol Nutr Metab. 2014;39(9):1058–1063. doi: 10.1139/apnm-2013-0577 [DOI] [PubMed] [Google Scholar]
- 7.Skinner TL, Jenkins DG, Coombes JS, et al. Dose response of caffeine on 2000-m rowing performance. Med Sci Sport Exer. 2010;42(3):571–576. doi: 10.1249/MSS.0b013e3181b6668b [DOI] [PubMed] [Google Scholar]
- 8.Peeling P, Cox GR, Bullock N, et al. Beetroot juice improves on-water 500 m time-trial performance, and laboratory-based paddling economy in national and international-level kayak athletes. Int J Sport Nutr Exe. 2015;25(3):278–284. doi: 10.1123/ijsnem.2014-0110 [DOI] [PubMed] [Google Scholar]
- 9.Carr AJ, Gore CJ, Dawson B.. Induced alkalosis and caffeine supplementation: effects on 2,000-m rowing performance. Int J Sport Nutr Exe. 2011. Oct;21(5):357–364. doi: 10.1123/ijsnem.21.5.357 [DOI] [PubMed] [Google Scholar]
- 10.Lundberg JO, Weitzberg E. Chapter 12 - nitric oxide formation from inorganic nitrate. Vol. 3. Louis J. I, Bruce A. F, editors. Amsterdam, Netherlands: Academic Press; 2017. Nitric Oxide. [Google Scholar]
- 11.Stamler JS, Meissner G. Physiology of nitric oxide in skeletal muscle. Physiol Rev. 2001. Jan;81(1):209–237. doi: 10.1152/physrev.2001.81.1.209 [DOI] [PubMed] [Google Scholar]
- 12.Larsen FJ, Schiffer TA, Borniquel S, et al. Dietary inorganic nitrate improves mitochondrial efficiency in humans. Cell Metab. 2011;13(2):149–159. doi: 10.1016/j.cmet.2011.01.004 [DOI] [PubMed] [Google Scholar]
- 13.Lundberg JO, Weitzberg E, Gladwin MT. The nitrate–nitrite–nitric oxide pathway in physiology and therapeutics. Nat Rev Drug Discov. 2008;7(2):156–167. doi: 10.1038/nrd2466 [DOI] [PubMed] [Google Scholar]
- 14.Hord NG, Tang Y, Bryan NS. Food sources of nitrates and nitrites: the physiologic context for potential health benefits. Am J Clin Nutr. 2009. Jul;90(1):1–10. doi: 10.3945/ajcn.2008.27131 [DOI] [PubMed] [Google Scholar]
- 15.Domínguez R, Cuenca E, Maté-Muñoz JL, et al. Effects of beetroot juice supplementation on cardiorespiratory endurance in athletes. A systematic review. Nutrients. 2017;9(1):43. doi: 10.3390/nu9010043 [DOI] [PMC free article] [PubMed] [Google Scholar]
- 16.Larsen F, Weitzberg E, Lundberg J, et al. Effects of dietary nitrate on oxygen cost during exercise. Acta Physiologica. 2007;191(1):59–66. doi: 10.1111/j.1748-1716.2007.01713.x [DOI] [PubMed] [Google Scholar]
- 17.Affourtit C, Bailey SJ, Jones AM, et al. On the mechanism by which dietary nitrate improves human skeletal muscle function. Front Physiol. 2015;6:211. doi: 10.3389/fphys.2015.00211 [DOI] [PMC free article] [PubMed] [Google Scholar]
- 18.Jones AM, Bailey SJ, Vanhatalo A. Dietary nitrate and O2 consumption during exercise. Acute Top Sport Nutr. 2012;59: Karger Publishers; 29–35. [DOI] [PubMed] [Google Scholar]
- 19.Jones AM, Vanhatalo A, Bailey SJ. Influence of dietary nitrate supplementation on exercise tolerance and performance. Nut Coach Strat Modul Train Effic. 2013;75:27–40. [DOI] [PubMed] [Google Scholar]
- 20.Bailey JC, Feelisch M, Horowitz JD, et al. Pharmacology and therapeutic role of inorganic nitrite and nitrate in vasodilatation. Pharmacol Ther. 2014. Dec;144(3):303–320. doi: 10.1016/j.pharmthera.2014.06.009 [DOI] [PubMed] [Google Scholar]
- 21.Bailey SJ, Fulford J, Vanhatalo A, et al. Dietary nitrate supplementation enhances muscle contractile efficiency during knee-extensor exercise in humans. (vol 109, pg 135, 2010). J Appl Physiol. 2010. Sep;109(1):943–943. doi: 10.1152/japplphysiol.00046.2010 [DOI] [PubMed] [Google Scholar]
- 22.Jones AM, Ferguson SK, Bailey SJ, et al. Fiber type-specific effects of dietary nitrate. Exerc Sport Sci Rev. 2016. Apr;44(2):53–60. doi: 10.1249/JES.0000000000000074 [DOI] [PubMed] [Google Scholar]
- 23.Husmann F, Bruhn S, Mittlmeier T, et al. Dietary nitrate supplementation improves exercise tolerance by reducing muscle fatigue and perceptual responses. Front Physiol. 2019. Apr 24;10. doi: 10.3389/fphys.2019.00404 [DOI] [PMC free article] [PubMed] [Google Scholar]
- 24.Grgic J, Grgic I, Pickering C, et al. Wake up and smell the coffee: caffeine supplementation and exercise performance—an umbrella review of 21 published meta-analyses. Br J Sports Med. 2020;54(11):681–688. doi: 10.1136/bjsports-2018-100278 [DOI] [PubMed] [Google Scholar]
- 25.Grgic J, Mikulic P, Schoenfeld BJ, et al. The influence of caffeine supplementation on resistance exercise: a review. Sports Med. 2018;49(1):17–30. doi: 10.1007/s40279-018-0997-y [DOI] [PubMed] [Google Scholar]
- 26.Southward K, Rutherfurd-Markwick KJ, Ali A. The effect of acute caffeine ingestion on endurance performance: a systematic review and meta–analysis. Sports Med. 2018;48(8):1913–1928. doi: 10.1007/s40279-018-0939-8 [DOI] [PubMed] [Google Scholar]
- 27.Desbrow B, Biddulph C, Devlin B, et al. The effects of different doses of caffeine on endurance cycling time trial performance. J Sport Sci. 2012;30(2):115–120. doi: 10.1080/02640414.2011.632431 [DOI] [PubMed] [Google Scholar]
- 28.Fredholm BB, Yang JN, Wang YQ. Low, but not high, dose caffeine is a readily available probe for adenosine actions. Mol Aspects Med. 2017. Jun;55:20–25. doi: 10.1016/j.mam.2016.11.011 [DOI] [PubMed] [Google Scholar]
- 29.Martins GL, Guilherme JPLF, Ferreira LHB, et al. Caffeine and exercise performance: possible directions for definitive findings [review]. Front Sports Act Liv. 2020;2(202). doi: 10.3389/fspor.2020.574854 [DOI] [PMC free article] [PubMed] [Google Scholar]
- 30.Reichert CF, Deboer T, Landolt HP. Adenosine, caffeine, and sleep–wake regulation: state of the science and perspectives. J Sleep Res. 2022. Aug;31(4):e13597. doi: 10.1111/jsr.13597 [DOI] [PMC free article] [PubMed] [Google Scholar]
- 31.Davis JM, Zhao Z, Stock HS, et al. Central nervous system effects of caffeine and adenosine on fatigue. Am J Physiol-Regul Integr Comp Physiol. 2003;284(2):R399–R404. doi: 10.1152/ajpregu.00386.2002 [DOI] [PubMed] [Google Scholar]
- 32.Fredholm BB, Bättig K, Holmén J, et al. Actions of caffeine in the brain with special reference to factors that contribute to its widespread use. Pharmacol Rev. 1999;51(1):83–133. doi: 10.1016/S0031-6997(24)01396-6 [DOI] [PubMed] [Google Scholar]
- 33.McLellan TM, Caldwell JA, Lieberman HR. A review of caffeine’s effects on cognitive, physical and occupational performance. Neurosci Biobehav R. 2016. Dec;71:294–312. doi: 10.1016/j.neubiorev.2016.09.001 [DOI] [PubMed] [Google Scholar]
- 34.Davis JM, Zhao Z, Stock HS, et al. Central nervous system effects of caffeine and adenosine on fatigue. Am J Physiol-Reg I. 2003. Feb;284(2):R399–R404. doi: 10.1152/ajpregu.00386.2002 [DOI] [PubMed] [Google Scholar]
- 35.Graham TE. Caffeine and exercise. Sports Med. 2001;31(11):785–807. doi: 10.2165/00007256-200131110-00002 [DOI] [PubMed] [Google Scholar]
- 36.Kalmar JM. The influence of caffeine on voluntary muscle activation. Med Sci Sport Exer. 2005;37(12):2113–2119. doi: 10.1249/01.mss.0000178219.18086.9e [DOI] [PubMed] [Google Scholar]
- 37.Urry E, Landolt H-P. Adenosine, caffeine, and performance: from cognitive neuroscience of sleep to sleep pharmacogenetics. Current Topics in Behavioral Neurosciences. 2014;25:331–366. doi: 10.1007/7854_2014_274. [DOI] [PubMed] [Google Scholar]
- 38.Behrens M, Mau-Moeller A, Weippert M, et al. Caffeine-induced increase in voluntary activation and strength of the quadriceps muscle during isometric, concentric and eccentric contractions. Sci Rep. 2015;5(1):1–10. doi: 10.1038/srep10209 [DOI] [PMC free article] [PubMed] [Google Scholar]
- 39.Behrens M, Mau-Moeller A, Heise S, et al. Alteration in neuromuscular function of the plantar flexors following caffeine ingestion. Scand J Med Sci Sports. 2015. Feb;25(1):e50–8. doi: 10.1111/sms.12243 [DOI] [PubMed] [Google Scholar]
- 40.Pethick J, Winter SL, Burnley M. Caffeine ingestion attenuates fatigue-induced loss of muscle torque complexity. Med Sci Sports Exercise. 2017;50(2):236–245. doi: 10.1249/MSS.0000000000001441 [DOI] [PubMed] [Google Scholar]
- 41.Gonglach AR, Ade CJ, Bemben MG, et al. Muscle pAin as a regulator of cycling intensity: effect of caffeine ingestion. Med Sci Sport Exer. 2016;48(2):287–296. doi: 10.1249/MSS.0000000000000767 [DOI] [PubMed] [Google Scholar]
- 42.Barreto G, Grecco B, Merola P, et al. Novel insights on caffeine supplementation, CYP1A2 genotype, physiological responses and exercise performance. Eur J Appl Physiol. 2021. Mar;121(3):749–769. doi: 10.1007/s00421-020-04571-7 [DOI] [PubMed] [Google Scholar]
- 43.Astorino TA, Cottrell T, Lozano AT, et al. Effect of caffeine on RPE and perceptions of pain, arousal, and pleasure/displeasure during a cycling time trial in endurance trained and active men. Physiol Behav. 2012;106(2):211–217. doi: 10.1016/j.physbeh.2012.02.006 [DOI] [PubMed] [Google Scholar]
- 44.Behrens M, Gube M, Chaabene H, et al. Fatigue and human performance: an updated framework. Sports Med. 2023. Jan;53(1):7–31. doi: 10.1007/s40279-022-01748-2 [DOI] [PMC free article] [PubMed] [Google Scholar]
- 45.Jones AM. Dietary nitrate supplementation and exercise performance. Sports Med. 2014. May;44(S1):35–45. doi: 10.1007/s40279-014-0149-y [DOI] [PMC free article] [PubMed] [Google Scholar]
- 46.Jones AM, Thompson C, Wylie LJ, et al. Dietary nitrate and physical performance. Annu Rev Nutr. 2018;38(1):303–328. doi: 10.1146/annurev-nutr-082117-051622 [DOI] [PubMed] [Google Scholar]
- 47.Grgic J, Mikulic P, Schoenfeld BJ, et al. The influence of caffeine supplementation on resistance exercise: a review. Sports Med. 2019;49(1):17–30. doi: 10.1007/s40279-018-0997-y [DOI] [PubMed] [Google Scholar]
- 48.McMahon NF, Leveritt MD, Pavey TG. The effect of dietary nitrate supplementation on endurance exercise performance in healthy adults: a systematic review and meta-analysis. Sports Med. 2017. Apr;47(4):735–756. doi: 10.1007/s40279-016-0617-7 [DOI] [PubMed] [Google Scholar]
- 49.Lane SC, Hawley JA, Desbrow B, et al. Single and combined effects of beetroot juice and caffeine supplementation on cycling time trial performance. Appl Physiol Nutr Metab. 2014;39(9):1050–1057. doi: 10.1139/apnm-2013-0336 [DOI] [PubMed] [Google Scholar]
- 50.Bühler E, Lachenmeier DW, Schlegel K, et al. Development of a tool to assess the caffeine intake among teenagers and young adults. Ernahrungs Umschau. 2014;61(4):58–63. [Google Scholar]
- 51.van Someren K, Hawley J, Phillips G, et al. Comparison of physiological responses to simulated and open water sprint race kayaking. Med Sci Sports Exercise. 1998;30(5):50. doi: 10.1097/00005768-199805001-00282 [DOI] [Google Scholar]
- 52.van Someren KA, Oliver JE. The efficacy of ergometry determined heart rates for flatwater kayak training. Int J Sports Med. 2002. Jan;23(1):28–32. doi: 10.1055/s-2002-19268 [DOI] [PubMed] [Google Scholar]
- 53.van Someren KA, Phillips GRW, Palmer GS. Comparison of physiological responses to open water kayaking and kayak ergometry. Int J Sports Med. 2000. Apr;21(3):200–204. doi: 10.1055/s-2000-8877 [DOI] [PubMed] [Google Scholar]
- 54.Borges TO, Bullock N, Aitken D, et al. Accuracy and validity of commercially available kayak ergometers. Int J Sport Physiol. 2017. Oct;12(9):1267–1270. doi: 10.1123/ijspp.2016-0653 [DOI] [PubMed] [Google Scholar]
- 55.Macfarlane D, Wong P. Validity, reliability and stability of the portable cortex metamax 3B gas analysis system. Eur J Appl Physiol. 2012;112(7):2539–2547. doi: 10.1007/s00421-011-2230-7 [DOI] [PMC free article] [PubMed] [Google Scholar]
- 56.Michael JS, Rooney KB, Smith R. The metabolic demands of kayaking: a review. J Sports Sci Med. 2008;7(1):1. [PMC free article] [PubMed] [Google Scholar]
- 57.Trevithick BA, Ginn KA, Halaki M, et al. Shoulder muscle recruitment patterns during a kayak stroke performed on a paddling ergometer. J Electromyogr Kines. 2007. Feb;17(1):74–79. doi: 10.1016/j.jelekin.2005.11.012 [DOI] [PubMed] [Google Scholar]
- 58.Jones S, Chiesa ST, Chaturvedi N, et al. Recent developments in near-infrared spectroscopy (NIRS) for the assessment of local skeletal muscle microvascular function and capacity to utilise oxygen. Artery Res. 2016;16(C):25–33. doi: 10.1016/j.artres.2016.09.001 [DOI] [PMC free article] [PubMed] [Google Scholar]
- 59.Scholkmann F, Kleiser S, Metz AJ, et al. A review on continuous wave functional near-infrared spectroscopy and imaging instrumentation and methodology. Neuroimage. 2014. Jan 15;85:6–27. doi: 10.1016/j.neuroimage.2013.05.004 [DOI] [PubMed] [Google Scholar]
- 60.Brown M, Lauder M, Dyson R, editors. Activation and contribution of trunk and leg musculature to force production during on-water sprint kayak performance. Konstanz, Germany: ISBS-Conference Proceedings Archive; 2010. [Google Scholar]
- 61.Fleming N, Donne B, Fletcher D. Effect of kayak ergometer elastic tension on upper limb EMG activity and 3D kinematics. J Sports Sci Med. 2012;11(3):430. [PMC free article] [PubMed] [Google Scholar]
- 62.Logan SM, Holt LE. Sports performance series: the flatwater kayak stroke. Strength Cond J. 1985;7(5):4–11. doi: [DOI] [Google Scholar]
- 63.Nilsson JE, Rosdahl HG. Contribution of leg-muscle forces to paddle force and kayak speed during maximal-effort flat-water paddling. Int J Sport Physiol. 2016;11(1):22–27. doi: 10.1123/ijspp.2014-0030 [DOI] [PubMed] [Google Scholar]
- 64.Hermens HJ, Freriks B, Disselhorst-Klug C, et al. Development of recommendations for SEMG sensors and sensor placement procedures. J Electromyogr Kines. 2000. Oct;10(5):361–374. doi: 10.1016/S1050-6411(00)00027-4 [DOI] [PubMed] [Google Scholar]
- 65.Behrens M, Mau-Moeller A, Bruhn S. Effect of exercise-induced muscle damage on neuromuscular function of the quadriceps muscle. Int J Sports Med. 2012;33(8):600–606. doi: 10.1055/s-0032-1304642 [DOI] [PubMed] [Google Scholar]
- 66.Clarys JP, Cabri J. Electromyography and the study of sports movements: a review. J Sport Sci. 1993;11(5):379–448. doi: 10.1080/02640419308730010 [DOI] [PubMed] [Google Scholar]
- 67.Larson RD. Psychometric properties of the modified fatigue impact scale. Int J MS Care. 2013;15(1):15–20. doi: 10.7224/1537-2073.2012-019 [DOI] [PMC free article] [PubMed] [Google Scholar]
- 68.Albani C, Blaser G, Geyer M, et al. Überprüfung der Gütekriterien der deutschen Kurzform des Fragebogens „profile of mood states” (POMS) in einer repräsentativen Bevölkerungsstichprobe. Psychother Psychosom Med Psychol. 2005;55(7):324–330. doi: 10.1055/s-2004-834727 [DOI] [PubMed] [Google Scholar]
- 69.Petrowski K, Albani C, Zenger M, et al. Revised short screening version of the profile of mood states (POMS) from the German general population. Front Psychol. 2021;12:1937. doi: 10.3389/fpsyg.2021.631668 [DOI] [PMC free article] [PubMed] [Google Scholar]
- 70.Matthews G, Campbell SE, Falconer S. editors Assessment of motivational states in performance environments. In: Proceedings of the Human Factors and Ergonomics Society Annual Meeting; Los Angeles, CA. Sage Publications Sage CA; 2001. [Google Scholar]
- 71.Matthews G, Joyner L, Gilliland K, et al. Validation of a comprehensive stress state questionnaire: towards a state big three. Personality Psychol Eur. 1999;7:335–350. [Google Scholar]
- 72.Borg G. Borg’s perceived exertion and pain scales. Champaign, Illinois, USA: Human kinetics; 1998. [Google Scholar]
- 73.Cook DB, O’Connor PJ, Eubanks SA, et al. Naturally occurring muscle pain during exercise: assessment and experimental evidence. Med Sci Sports Exercise. 1997. Aug;29(8):999–1012. doi: 10.1097/00005768-199708000-00004 [DOI] [PubMed] [Google Scholar]
- 74.Pageaux B. Perception of effort in exercise science: definition, measurement and perspectives. Eur J Sport Sci. 2016. Nov;16(8):885–894. doi: 10.1080/17461391.2016.1188992 [DOI] [PubMed] [Google Scholar]
- 75.Cohen J. Statistical power analysis for the behavioral sciences. 2nd ed. New York, USA: Academic press; 2013. doi: 10.4324/9780203771587. [DOI] [Google Scholar]
- 76.Cohen J. Statistical power analysis for the behavioral-sciences. Percept Mot Skill. 1988. Dec;67(3):1007–1007. [Google Scholar]
- 77.Dankel SJ, Loenneke JP. Effect sizes for paired data should use the change score variability rather than the pre-test variability. J Strength Cond Res. 2018;35(6):1773–1778. doi: 10.1519/JSC.0000000000002946 [DOI] [PubMed] [Google Scholar]
- 78.Lakens D. Calculating and reporting effect sizes to facilitate cumulative science: a practical primer for t-tests and ANOVAs. Front Psychol. 2013;4:863. doi: 10.3389/fpsyg.2013.00863 [DOI] [PMC free article] [PubMed] [Google Scholar]
- 79.McDonagh ST, Wylie LJ, Thompson C, et al. Potential benefits of dietary nitrate ingestion in healthy and clinical populations: a brief review. Eur J Sport Sci. 2019;19(1):15–29. doi: 10.1080/17461391.2018.1445298 [DOI] [PubMed] [Google Scholar]
- 80.Callahan MJ, Parr EB, Hawley JA, et al. Single and combined effects of beetroot crystals and sodium bicarbonate on 4-km cycling time trial performance. Int J Sport Nutr Exe. 2017;27(3):271–278. doi: 10.1123/ijsnem.2016-0228 [DOI] [PubMed] [Google Scholar]
- 81.Christensen PM, Nyberg M, Bangsbo J. Influence of nitrate supplementation on VO2 kinetics and endurance of elite cyclists. Scand Med Sci Sports. 2013;23(1):e21–e31. doi: 10.1111/sms.12005 [DOI] [PubMed] [Google Scholar]
- 82.Bescos R, Ferrer-Roca V, Galilea PA, et al. Sodium nitrate supplementation does not enhance performance of endurance athletes. Med Sci Sports Exercise. 2012;44(12):2400–2409. doi: 10.1249/MSS.0b013e3182687e5c [DOI] [PubMed] [Google Scholar]
- 83.Boorsma RK, Whitfield J, Spriet LL. Beetroot juice supplementation does not improve performance of elite 1500-m runners. Med Sci Sports Exerc. 2014;46(12):2326–2334. doi: 10.1249/MSS.0000000000000364 [DOI] [PubMed] [Google Scholar]
- 84.Nyakayiru JM, Jonvik KL, Pinckaers PJ, et al. No effect of acute and 6-day nitrate supplementation on VO2 and time-trial performance in highly trained cyclists. Int J Sport Nutr Exe. 2017;27(1):11–17. doi: 10.1123/ijsnem.2016-0034 [DOI] [PubMed] [Google Scholar]
- 85.Peacock O, Tjønna AE, James P, et al. Dietary nitrate does not enhance running performance in elite cross-country skiers. Med Sci Sports Exerc. 2012;44(11):2213–2219. doi: 10.1249/MSS.0b013e3182640f48 [DOI] [PubMed] [Google Scholar]
- 86.Sandbakk SB, Sandbakk Ø, Peacock O, et al. Effects of acute supplementation of L-arginine and nitrate on endurance and sprint performance in elite athletes. Nitric Oxide. 2015;48:10–15. doi: 10.1016/j.niox.2014.10.006 [DOI] [PubMed] [Google Scholar]
- 87.Paquette M, Bieuzen F, Billaut F. Muscle oxygenation rather than VO2max as a strong predictor of performance in sprint canoe–kayak. Int J Sport Physiol. 2018;13(10):1299–1307. doi: 10.1123/ijspp.2018-0077 [DOI] [PubMed] [Google Scholar]
- 88.Senefeld JW, Wiggins CC, Regimbal RJ, et al. Ergogenic effect of nitrate supplementation: a systematic review and meta-analysis. Med Sci Sports Exerc. 2020. Oct;52(10):2250–2261. doi: 10.1249/MSS.0000000000002363 [DOI] [PMC free article] [PubMed] [Google Scholar]
- 89.Green DJ, Hopman MTE, Padilla J, et al. Vascular adaptation to exercise in humans: role of hemodynamic stimuli. Physiol Rev. 2017. Apr;97(2):495–528. doi: 10.1152/physrev.00014.2016 [DOI] [PMC free article] [PubMed] [Google Scholar]
- 90.Woessner MN, McIlvenna LC, Ortiz de Zevallos J, et al. Dietary nitrate supplementation in cardiovascular health: an ergogenic aid or exercise therapeutic? Am J Physiol-Heart Circulat Physiol. 2018;314(2):H195–H212. doi: 10.1152/ajpheart.00414.2017 [DOI] [PubMed] [Google Scholar]
- 91.Bishop D, Bonetti D, Dawson B. The influence of pacing strategy on VO2 and supramaximal kayak performance. Med Sci Sports Exercise. 2002;34(6):1041–1047. doi: 10.1097/00005768-200206000-00022 [DOI] [PubMed] [Google Scholar]
- 92.Coelho AB, Nakamura FY, Morgado MC, et al. Prediction of simulated 1,000 m kayak ergometer performance in young athletes. Front Public Health. 2021. Jan 20;8. doi: 10.3389/fpubh.2020.526477 [DOI] [PMC free article] [PubMed] [Google Scholar]
- 93.Van De Walle GP, Vukovich MD. The effect of nitrate supplementation on exercise tolerance and performance: a systematic review and meta-anAlysis. J Strength Cond Res. 2018. Jun;32(6):1796–1808. doi: 10.1519/JSC.0000000000002046 [DOI] [PubMed] [Google Scholar]
- 94.Grgic J, Mikulic P. Caffeine ingestion acutely enhances muscular strength and power but not muscular endurance in resistance-trained men. Eur J Sport Sci. 2017;17(8):1029–1036. doi: 10.1080/17461391.2017.1330362 [DOI] [PubMed] [Google Scholar]
- 95.Mikulic P, Grgic J. Muscular strength and power, but not muscular endurance, acutely enhanced after caffeine ingestion in resistance-trained men. In: 8th International Scientific Conference on Kinesiology; 2017. p. 114–114. [Google Scholar]
- 96.Tarnopolsky MA. Effect of caffeine on the neuromuscular system—potential as an ergogenic aid. Appl Physiol Nutr Metab. 2008;33(6):1284–1289. doi: 10.1139/H08-121 [DOI] [PubMed] [Google Scholar]
- 97.Mohr M, Nielsen JJ, Bangsbo J. Caffeine intake improves intense intermittent exercise performance and reduces muscle interstitial potassium accumulation. J Appl Physiol. 2011;111(5):1372–1379. doi: 10.1152/japplphysiol.01028.2010 [DOI] [PubMed] [Google Scholar]
- 98.Chapman RF, Mickleborough TD. The effects of caffeine on ventilation and pulmonary function during exercise: an often-overlooked response. Phys Sportsmed. 2009. Dec;37(4):97–103. doi: 10.3810/psm.2009.12.1747 [DOI] [PubMed] [Google Scholar]
- 99.Doherty M, Smith P. Effects of caffeine ingestion on rating of perceived exertion during and after exercise: a meta‐analysis. Scand Med Sci Sports. 2005;15(2):69–78. doi: 10.1111/j.1600-0838.2005.00445.x [DOI] [PubMed] [Google Scholar]
- 100.Duncan MJ, Stanley M, Parkhouse N, et al. Acute caffeine ingestion enhances strength performance and reduces perceived exertion and muscle pain perception during resistance exercise. Eur J Sport Sci. 2013. Jul 1;13(4):392–399. doi: 10.1080/17461391.2011.635811 [DOI] [PubMed] [Google Scholar]
- 101.Astorino TA, Terzi MN, Roberson DW, et al. Effect of caffeine intake on pain perception during high-intensity exercise. Int J Sport Nutr Exe. 2011. Feb;21(1):27–32. doi: 10.1123/ijsnem.21.1.27 [DOI] [PubMed] [Google Scholar]
- 102.Marshall JM. The roles of adenosine and related substances in exercise hyperaemia. J Physiol. 2007;583(3):835–845. doi: 10.1113/jphysiol.2007.136416 [DOI] [PMC free article] [PubMed] [Google Scholar]
- 103.Sawynok J. Adenosine receptor activation and nociception. Eur J Pharmacol. 1998;347(1):1–11. doi: 10.1016/S0014-2999(97)01605-1 [DOI] [PubMed] [Google Scholar]
- 104.Santos PS, Felippe LC, Ferreira GA, et al. Caffeine increases peripheral fatigue in low-but not in high-performing cyclists. Appl Physiol Nutr Metab. 2020. (ja). 45(11):1208–1215. doi: 10.1139/apnm-2019-0992 [DOI] [PubMed] [Google Scholar]
- 105.Mizuno M, Kimura Y, Tokizawa K, et al. Greater adenosine A(2A) receptor densities in cardiac and skeletal muscle in endurance-trained men: a [11C]TMSX PET study. Nucl Med Biol. 2005. Nov;32(8):831–836. doi: 10.1016/j.nucmedbio.2005.07.003 [DOI] [PubMed] [Google Scholar]
- 106.Carvalho A, Marticorena FM, Grecco BH, et al. Can I have my coffee and drink it? A systematic review and meta-analysis to determine whether habitual caffeine consumption affects the ergogenic effect of caffeine. Sports Med. 2022. Sep;52(9):2209–2220. doi: 10.1007/s40279-022-01685-0 [DOI] [PubMed] [Google Scholar]
- 107.Pallarés JG, Fernandez-Elias VE, Ortega JF, et al. Neuromuscular responses to incremental caffeine doses: performance and side effects. Med Sci Sports Exercise. 2013;45(11):2184–2192. doi: 10.1249/MSS.0b013e31829a6672 [DOI] [PubMed] [Google Scholar]
- 108.Pickering C, Kiely J. What should we do about habitual caffeine use in athletes? Sports Med. 2019;49(6):833–842. doi: 10.1007/s40279-018-0980-7 [DOI] [PMC free article] [PubMed] [Google Scholar]
- 109.Van Soeren MH, Graham TE. Effect of caffeine on metabolism, exercise endurance, and catecholamine responses after withdrawal. J Appl Physiol. 1998. Oct;85(4):1493–1501. doi: 10.1152/jappl.1998.85.4.1493 [DOI] [PubMed] [Google Scholar]
- 110.Irwin C, Desbrow B, Ellis A, et al. Caffeine withdrawal and high-intensity endurance cycling performance. J Sport Sci. 2011;29(5):509–515. doi: 10.1080/02640414.2010.541480 [DOI] [PubMed] [Google Scholar]
- 111.Desbrow B, Irwin C, Ellis A, et al. Caffeine withdrawal and high intensity endurance cycling performance. Med Sci Sport Exer. 2010. May;42(5):106–106. doi: 10.1249/01.MSS.0000385973.25825.7e [DOI] [PubMed] [Google Scholar]
- 112.Dews PB, O’Brien CP, Bergman J. Caffeine: behavioral effects of withdrawal and related issues. Food Chem Toxicol. 2002. Sep;40(9):1257–1261. doi: 10.1016/S0278-6915(02)00095-9 [DOI] [PubMed] [Google Scholar]
- 113.McLellan TM, Caldwell JA, Lieberman HR. A review of caffeine’s effects on cognitive, physical and occupational performance. Neurosci Biobehav Rev. 2016;71:294–312. doi: 10.1016/j.neubiorev.2016.09.001 [DOI] [PubMed] [Google Scholar]
- 114.Cappelletti S, Daria P, Sani G, et al. Caffeine: cognitive and physical performance enhancer or psychoactive drug? Curr Neuropharmacol. 2015;13(1):71–88. doi: 10.2174/1570159X13666141210215655 [DOI] [PMC free article] [PubMed] [Google Scholar]