

Abstract
Rab25, by altering trafficking of critical cellular resources, influences cell metabolism and survival during stress conditions. Overall, perturbations in the vesicular trafficking machinery change cellular bioenergetics that can be directly measured in real time as Oxygen Consumption Rate, OCR (mitochondrial respiration) and Extracellular Acidification Rate, ECAR (glycolysis) by an extracellular flux analyzer (XF96, Seahorse Biosciences, MA). Additionally, overall turnover of glucose, lactate, as well as glutamine and glutamate can be measured biochemically using the YSI2900 Biochemistry Analyzer (YSI Incorporated, Life Sciences, OH). A combination of these two methods allows a precise and quantitative approach to interrogate the role of Rab25 as well as other Rab GTPases in central carbon energy metabolism.
Keywords: Extracellular flux, Glycolytic index, Rab25, XF 96 extracellular flux analyzer, YSI biochemistry analyzer, Glucose, Lactate, Glutamine, Breast cancer
1. Introduction
Cellular energy is generated from both mitochondrial and nonmitochondrial compartments with the relative contribution of each having prognostic value in cancer progression [1–5]. Upstream control of oxidative phosphorylation as well as glycolysis involves regulation of growth factor and nutrient receptors by trafficking molecules [6–9]. In cancer, derailed endocytosis [10, 11] is an emerging trait with Rab25-mediated trafficking of receptors and transporters likely to contribute toward bioenergetic fitness of cancer cells in response to nutrient and other stresses [9, 12–14].
Membrane-associated Rab25 forms an integrated system with its GAPs, GEFs, effectors, as well as actin–myosin motors proteins [15–17]. Experimental conditions must be simultaneously stringent and benign to maintain the specific organic interactions that allow evaluation of contributions of Rab25 and other GTPases toward cellular energetics. Furthermore, the complex and dynamic nature of a cancer cell’s metabolic profile introduces an added challenge to experimental design. The two complementary methods described here are noninvasive, involve minimal processing of cells, require small amounts of sample, maintain physiologic nutrient conditions, and allow interrogation of multiple parameters at the same time.
The XF Extracellular Flux analyzer provides a comprehensive metabolic image of the cell by simultaneously measuring changes in cellular respiration and glycolysis from extracellular oxygen (measured as the oxygen consumption rate or OCR) and free protons (a readout of extracellular acidification rate or ECAR). The measurements are performed in real time using solid-state sensor probes (an optode composed of an oxygen-sensitive fluorescent metal complex and a pH-sensitive fluorophore, respectively) which plunge 200 μm above the cell monolayer and entrap a transiently isolated microchamber of less than 2 μl of medium within the well of a 96-well plate. Metabolites or drugs can be added successively by an in-built automated delivery system. Because cell viability is maintained during the assay, multiple measurements, including cell count or protein content in each well, can be obtained from the same cell population. However, the most accurate readings for normalization require a separate plate because drug treatment can cause the cells to detach after the Seahorse readings. The indices of mitochondrial function are tested using pharmacological inhibitors of the bioenergetics pathway. Typically, a chemical uncoupler of electron transport and oxidative phosphorylation that depolarizes the inner mitochondrial membrane potential (FCCP) is used along with a mitochondrial inhibitor of complex I (Rotenone) and ATP-synthase/complex V inhibitor (Oligomycin A) (Fig. 1).
Fig. 1.
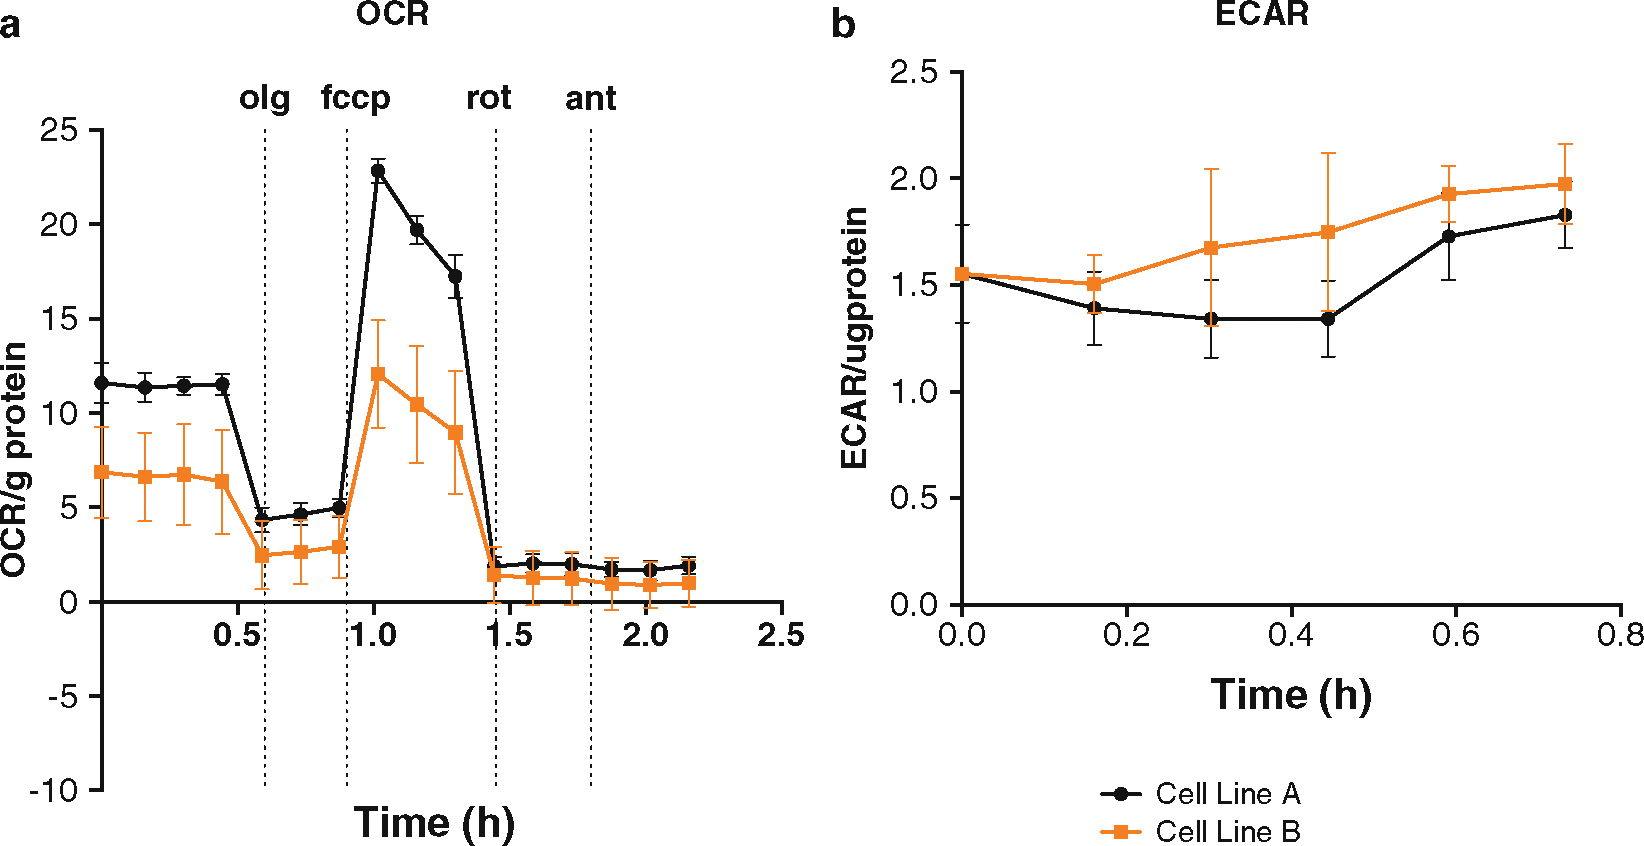
Example of XF96 analyzer data. A representative example in (a) shows the mitochondrial respiration and glycolytic activity derived from a typical experiment using ovarian cancer cells. Measurement of four initial baseline OCR readings are followed by recording the effects of sequential addition of Oligomycin (1 mg/ml), FCCP (1 μM), Rotenone (1 μM), and Antimycin A (1 μM) on OCR in two isogenic lines with variable levels of Rab25. Altering Rab25 significantly changes baseline OCR as well as ATP-dependent respiration (addition of Oligomycin). A striking effect is observed with FCCP suggesting that the cells with altered Rab25, represented in yellow, will have reduced respiratory capacity. Addition of Rotenone and Antimycin inhibits complex III and I, respectively, further decreasing OCR. These inhibitors diagnose the nonmitochondrial fraction of respiration. Overall the OCR data suggests that Rab25 levels shifts cell toward a more glycolytic profile. Analysis of baseline ECAR (b) shows rapid increase in ECAR in the cells represented by the yellow line. This increase in ECAR is due to a shift toward glycolysis and increased lactic acid export from cells leading to acidification of the surrounding media, i.e., the Warburg Effect. The OCR and ECAR data represented here are normalized to total protein in that well
The O2 flux is a direct readout for oxidation, both mitochondrial and nonmitochondrial. The major component of ECAR for cancer cells is lactate flux, a measure of glycolysis in the cytoplasm known as the Warburg Effect [18, 19]. Rab25-mediated uptake and recycling of RTKs, glucose transporters, as well as other nutrient molecules alter metabolite turnover within cells, which, in turn, affects cellular energy reserves such as glycogen storage [12]. Complementing the OCAR and ECAR measurements with data assessment of turnover of key metabolite in the system will provide additional mechanistic insights. Concentrations of glucose and lactate (as well as glutamine and glutamate) in the media surrounding the cell can be measured from plates using an enzyme electrode biosensor technology-based Biochemistry Analyzer, namely, the YSI 2900 (Fig. 2).
Fig. 2.
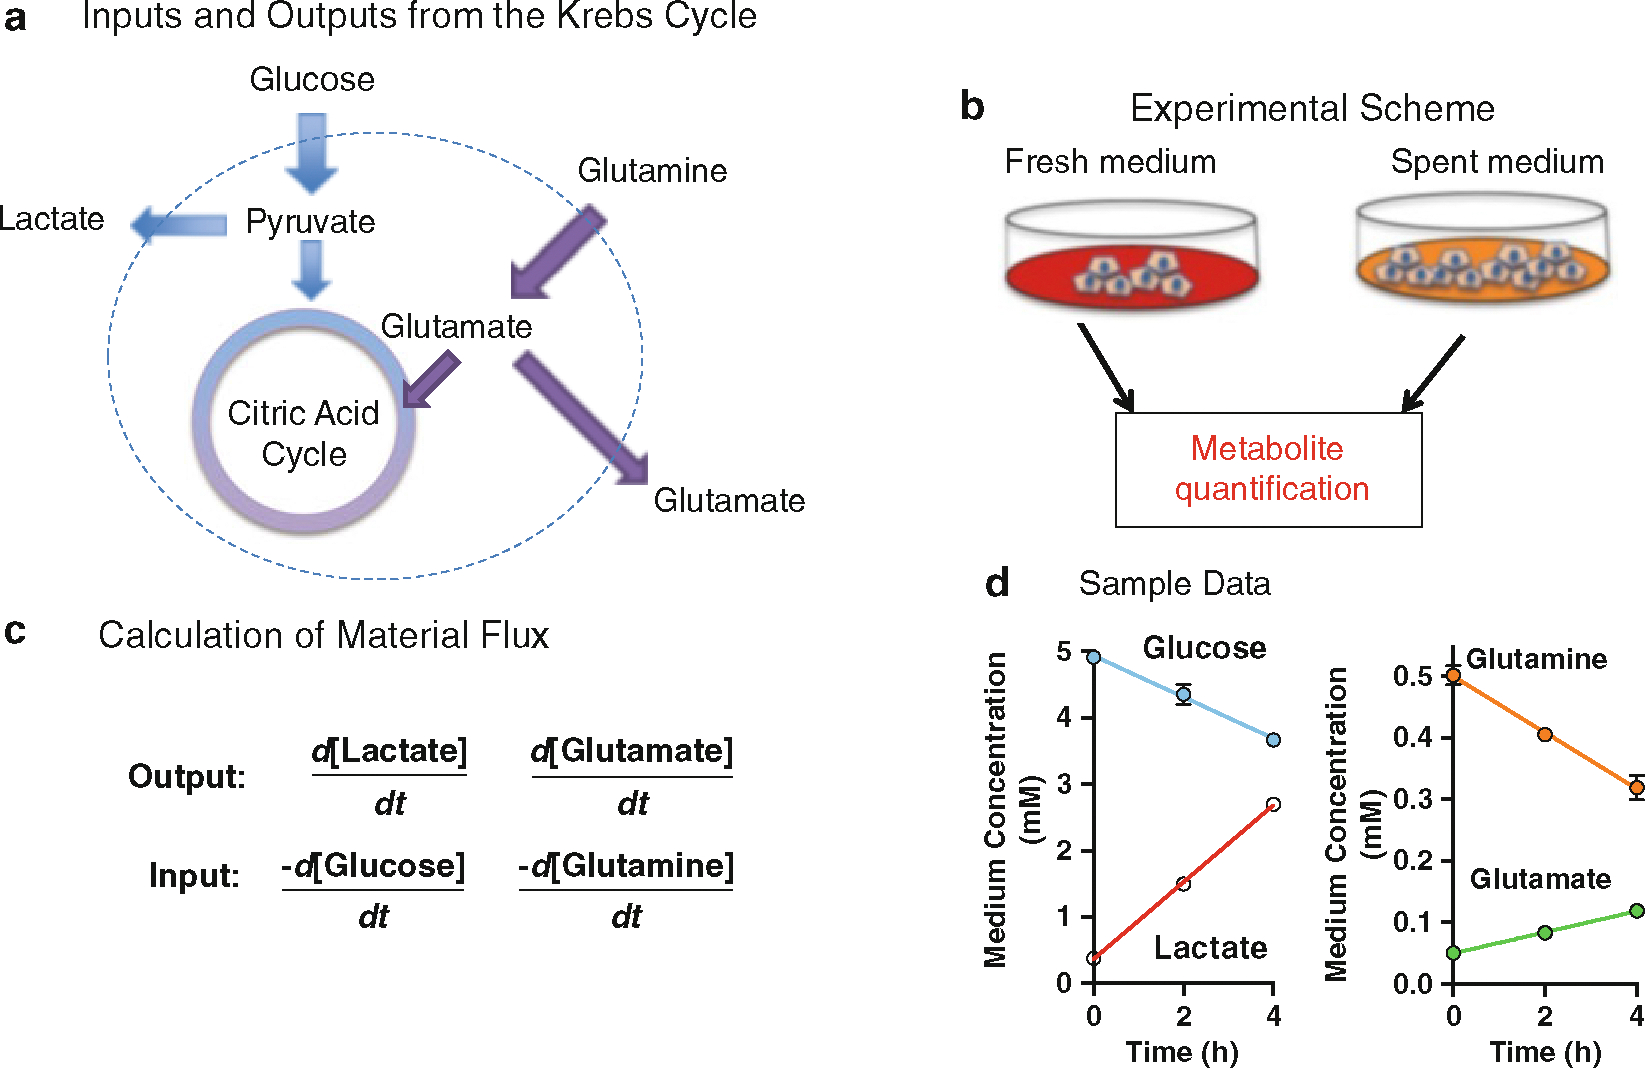
Material balance for cell lines using YSI bioanalyzer. (a) Shows the input and output of key metabolites in the Krebs Cycle that are measured by the YSI bioanalyzer to calculate metabolite flux. (b) Represents the experimental design while (c) formulates a calculation for net changes in output and input over time. Finally (d) is a representative figure showing increased glucose and glutamine uptake from the media and increased lactate and glutamate production
2. Materials
2.1. Cell Lines and Constructs
Breast and ovarian cancer cell lines, namely, MCF7, T47D, MDA 231, Hey, and A2780 (all from ATCC) were regularly cultured and maintained in DMEM 1× with 4.5 g/l glucose and l-glutamine, without sodium pyruvate (Corning CellGro 10–017CV, VA-20109) with 5 % FBS. Rab25 expression was manipulated in the cell lines using Lenti-viral Rab25 overexpressing vectors (Open Biosystem, GE Dharmacon, CO), as well as short hairpin RNA targeting Rab25 (On-Target Plus Smartpool™ small interfering RNAs toward Rab25 Dharmacon, GE) following manufacturer’s instructions. The overexpression and knockdown conditions were optimized and tested for mRNA as well as protein expression before using the lines for the metabolic assays.
2.2. Equipment
XF 96 Extracellular Flux Analyzer (Seahorse Bioscience, MA): Quantifies oxygen consumption and extracellular acidification rates.
YSI 2900 Biochemistry Analyzer equipped with Glucose/l-Lactate membranes and Glutamine/Glutamate membrane with YSI Buffer (Life Sciences, Yellow Springs, OH): Quantifies glucose and lactate levels in media.
2.3. Materials for XF96 Extracellular Flux Assay (Seahorse)
96-Well PET plates supplied by Seahorse Biosciences.
Flux packs (Seahorse)-V-bottom 96-well drug-loading plate (Sensor Cartridge).
Multichannel Pipette.
Non-CO2 Incubator.
XF Assay Medium: Bicarbonate free DMEM (Seahorse Bio, 100965–000), 0.1 N NaOH, Glutamax (Gibco, 35050–061), Sodium Pyruvate (Sigma, P4562), D-Glucose (Sigma), Na-Lactate (Sigma), l-Glutamine (Sigma). Adjust pH to 7.4 at 37 °C.
Calibration Buffer: Seahorse Calibrant (Seahorse Bio, 100840–000).
Drugs: Carbonyl cyanide p-trifluoromethoxyphenylhydrazone or FCCP (0.1 μM, 1 μM, 3 μM, 10 μM); Oligomycin (1 mg/ml); Rotenone (1 μM) Antimycin (1 μM).
2.4. Materials for YSI 2900 Biochemistry Analyzer
Glucose membrane (Cat # 2365).
l-Lactate membrane (Cat # 2329).
Glutamine membrane (Cat # 2735).
Glutamate membrane (Cat # 2754).
YSI Buffer (Cat # 2357).
Standard Solutions for standard curves for Glucose (10 mM) and l-Lactate (5 mM).
96 Well plates for YSI reading; 12 or 24 well plates for cell seeding.
ϒSI Assay Media (for physiological conditions): Glucose free, l-Glutamine free, Na-Pyruvate free DMEM (Cat#17207-CV Corning CellGro) with addition of 5 mmol/l glucose, 0.5 glutamine.
PBS (Hyclone, Thermo).
3. Methods
3.1. XF 96 Extracellular Flux Analyzer (Seahorse Bioscience)
Cell Plating and Plate Preparation for XF 96 Analyzer
-
1
Rab25 expression is manipulated stably or transiently in cells using standard transfection or transformation protocols [20, 21]. In case of transient genetic manipulations, cells were harvested and replated for the assays 24 h after transfection or transformation. Alternatively, the assay can be performed after a selection for stable clones has been verified.
-
2
For adherent cells with 15–18 h duplication time, at least 5 replicate wells are seeded at 8,000–16,000 cells per well in a final volume of 80 μl of regular growth media. Seeding is designed to have approximately 70 % cell confluence at the start of the Seahorse run (see Notes 1 and 3). The corner wells (A1, H1, A12, H12) of the plate should be cell free and loaded with media alone for background correction. To obtain uniform loading, it is recommended to make up appropriate stock solutions and then pipette 80 μl of final cell suspension using a multichannel pipettor. If cells are clumpy, they should be separated either by gentle vortexing or by aspirating through a suitable sized needed to obtain a single-cell suspension for even plating (see Note 6). Cells are allowed to attach as a monolayer and grow overnight in the incubator at 37 °C under 5 % CO2. Cells should be seeded in standard DMEM, 5 % FBS medium.
-
3
To maximize reproducibility, XF96 Sensor Cartridges should be hydrated overnight in 200 μl of XF Calibrant Buffer at room temperature.
Media Exchange
-
4
Inspect the cells in the XF96 cell culture plate under microscope to ensure uniform cell seeding.
-
5
The growth media in the well is exchanged out manually about 1 h prior to the assay and replaced with XF assay medium (serum-free, bicarbonate-free DMEM without phenol red with addition of 5 mmol/l glucose, 0.5 mM glutamine) adjusted pH to 7.4 at 37 °C. The medium provided by the manufacturer contains Glutamax, so it does not require glutamine supplementation. However, Glutamax due to its prolonged stability may mask subtle changes and skew the data. The instrument does not have CO2 atmosphere control; hence a bicarbonate-free medium is required. Because ECAR readings are dependent on buffer capacity, higher buffer capacity reduces the sensitivity of ECAR measurements. If desired, the net proton production rate can be determined if the buffer capacity is factored into the calculations (see Note 5).
-
6
To prevent disruption of the monolayer, 50 μl of original medium is removed and wells washed twice with 200 μl of XF assay medium. After the last wash 130 μl of assay medium is added back resulting in total 160 μl of medium per well. Incubate the XF96 cell culture plate at 37 °C in a non-CO2 incubator for at least 30 min prior to loading plate in XF96 instrument to allow cells to equilibrate to the new media. Alternatively, all of the medium can be removed by hand pipetting and replaced with XF Assay Medium without washing the wells. Hand pipetting is required because removal of medium by vacuum will dehydrate and lyse the cells.
Loading the Sensor Cartridge
-
7
The instrument is turned on and the XF software initiated to stabilize the instrument at 37 °C before preparing the Sensor Cartridge.
-
8
Drugs are typically dissolved in DMSO and need to equilibrate to room temperature.
For initial experiments, the FCCP response needs to be tested by using serial dilutions of FCCP in DMSO, beginning by diluting the 10 mM stock to 2 mM (see Note 2).
Up to four drugs per well may be loaded on the assay cartridge.
-
9
The assay cartridge is incubated at 37 °C non-CO2 incubator until ready for use. However, the cartridge can be effectively hydrated at room temperature. Incubation in a 37 °C oven without a water pan will evaporate the calibrant solution in the outer wells, so the plate should not be kept for prolonged periods at 37 °C without wrapping the plate in plastic wrap (see Note 4).
-
10
Once the instrument is calibrated, the assay cartridge is carefully placed into the XF Analyzer plate holder aligning with the orientation markers. This is done prior to loading the cell plate to allow automatic calibration of optical sensors. When the calibration process is complete (screen readout), the cell culture plate is inserted (without the lid) into the instrument, ensuring correct orientation. Prior to calibration, the assay cartridge is equilibrated for at least 10-min in the instrument. This equilibration time is set as a default by the software. More time may be required to increase the temperature of the calibrant solution to 37 °C depending on the length of time to load the drug solutions.
XF Analyzer Readings and Interpretation
-
11
The software is set up to measure baseline OCR (nmoles/minute) and ECAR (mpH/minute) rates thrice before the preloaded inhibitors, stimulants, substrates, or compounds are pneumatically injected into the media in each well and allowed to mix. However, baseline OCR and ECAR measurement readings can be extended if needed. OCR and ECAR measurements following addition of drugs are measured multiple times. After baseline oxygen consumption is determined, Oligomycin is injected through the ports, followed by FCCP and Rotenone/Antimycin A. The ATP-dependent OCR fraction is calculated by subtracting the decrease in OCR post Oligomycin addition. The remaining OCR at this point is non-ATP proton leak and the nonmitochondrial oxygen consumption. Addition of a correctly titrated amount of FCCP allows determination of the maximal respiration capacity. Lastly, the nonmitochondrial oxygen consumption is determined when all mitochondrial function is inhibited via electron flux through complex III with injection of Rotenone or Antimycin A.
-
12
Typically, for each condition, measurements are averaged over 3–4 readings taken at 5-min intervals. For initial set up, the 5-min cycle can be set up as a 2-min mix period, 1-min wait, and a 2-min measuring time. This 5-min cycle should be modified based on the inherent metabolic nature of the cells. For cells with high respiration rate, the measuring time should be lowered and mixing time increased and vice versa for cells with low oxidative potential. A total of about six cycles is recommended for each drug treatment. Longer times may be required for the initial readings, especially if the plate is loaded immediately after medium exchange. A standard assay time is 35–90-min depending on the optimized measuring and mixing cycles set. The cells remain viable during the whole process. With robust cells, the assays can be extended for several hours.
-
13
Normalization of data can be done via cell number, protein content, or the basal OCR and ECAR rates. At the end of the XF assay, the plate can be examined to evaluate the viability and characteristics of cells since some of the treatments and the plunger action may cause cell detachment or death. The existing media is carefully aspirated and cells lysed for protein content with a BCA assay. A more reliable approach is to fix the cells with paraformaldehyde and stain with a nuclear dye (DAPI) for automated imaging. Alternatively, nuclear stains such as Hoechst #33342 Fluorescent Stain can be used directly to quantify live or fixed cells.
3.2. Measuring Metabolite Turnover by YSI 2900
The YSI2900 is used to measure the total flux of glucose and lactate in cell lines. Typically cells are seeded in triplicate wells in 12- or 24-well plates for overnight in usual growth medium. Seeding is dictated by the duration of the assay. For up to 24-h time points, cells are seeded to reach 70–80 % confluence at the time of the YSI assay. The same time points can be seeded on the same plate if the time periods are relatively short (0, 1, 3, 6 h) so that the cell number does not change significantly.
Next day the growth medium is removed, cells are washed twice with medium, and replaced with YSI Assay media that can be either physiological levels of nutrients or other desired amounts (known amounts of glucose, glutamine, and lactate) (see Notes 7 and 8). The relative number of cells to the volume of media needs to be titrated to achieve robust and measurable levels or analytes at shorter time points. Typically this requires a confluency of at least 50 %. Low volumes of medium (i.e., 300 μl in 12-well plate) and physiological concentrations of glucose (5 mM) and glutamine (0.5 mM) are essential for this assay to work properly because depletion must be detected over a relatively short period of time.
About 500 ml of the YSI buffer is prepared following manufacturer’s instruction and the respective membranes (Glucose and Lactate, or, Glutamine and Glutamate) are fitted on the instrument.
Next the YSI 2900 Instrument is calibrated and standard curves test run before loading the assay samples. One point calibration is typically used for this instrument with an intercept of zero.
Glucose and lactate in the extracellular media is measured at 0, 6, 12, and 24 h. At each time point, 250 μl of media from each well of the seeding plate is collected in a 96-well plate and kept at −20 °C till completion of collection for all the time points. The plate should be sealed with parafilm between collection points because the medium can evaporate and alter the reliability of the results. Because the machine uses 10–50 μl per reading and the prescribed volume allows measurement of multiple chemistry from the same plate, and the high volume minimizes any effect of evaporation. The zero hour is calculated at the point when the YSI Assay media is added. Standard solutions for each of the analytes should be added at the end of each row to allow one-point calibration for each row.
At the time of media collection, cell number or protein concentration in the corresponding seeding well should be used to normalize the metabolite concentrations.
If the collected media samples were frozen they need to be thawed to room temperature before loading them on the instrument. The medium on the plate has to be well mixed. Because the volume is high (250 μl), a plate shaker is not adequate. Pipetting is required for effective mixing after freeze/thaw.
The media used at time “zero” is essential to calculate consumption and production.
After completion of instrument calibration, the 96-well plate design is laid out by using the Station tab. The instrument performed the appropriate biochemical analysis on the selected wells (see Note 9).
- Output can be represented as changes in Lactate and Glutamate over time.
4. Notes
It is critical to establish an optimal plating density for the XF plates prior to running experiments. Typical seeding densities are 2–16,000 cells/well and these are typically grown over 24-h. We recommend testing the cells on the XF instrument measuring four basal rates followed by injection of 0.5 μM FCCP and measuring an additional four rates. An ideal plating density will give robust basal and FCCP-uncoupled rates. If the cells are too dense, the basal rates might be low and the uncoupled rate will often be unstable. Cell seeding number will depend on cell type and cell growth characteristics.
The optimum FCCP concentration is typically between 0.1 and 2 μM. These values are cell line dependent.
For suspension cell lines, wells can be pretreated with CellTak™ cell and tissue adhesive (Corning, Cat # 354240) per the manufacturer instructions on the day of the reading. In such cases about 1.6 × 10⁴ cells per well is prepared in the exchange medium and plated on the day of the readings postapplication of CellTak™. OCR and ECAR readings are determined as mentioned earlier.
If the cartridge is being stored for more than 24-h, wrap para film around the edges to prevent evaporation.
The XF Assay medium is DMEM modified to use low phosphate (1 mM) to accommodate ECAR changes. The manufacturer also provides a low buffer DMEM but many other buffers can be used as long as they are devoid of bicarbonate buffer since the XF Analyzer instrument only maintains temperature and not CO2 control.
Using a 200 μl pipette and dropping the cell suspension with moderate force on the walls toward the bottom of the well allows even cell distribution in 80 μl of media
Based on a specific query, the YSI as well as XF-assay media composition can be varied by altering or withdrawing glucose, lactate, or glutamate. Since many biochemical reactions are reversible, removing a key metabolite from the culture medium will allow a more sensitive assay condition.
Finally, the main cargo, such as RTKs and or integrins or glucose transporters trafficked by the Rab GTPase can be manipulated to further analyze the role of the Rab protein in cancer cell metabolism.
Typically, the most striking conditions from the YSI Assay are further analyzed to interrogate alterations in signaling pathways using a high-throughput proteomic assay, namely, the Reverse Phase Protein Array (RPPA) [22, 23].
Acknowledgements
This work was supported by Susan G. Komen Postdoctoral Fellowship KG 101340 (SM), the CCSG RPPA Core grant NCI # CA16672 (GBM), the Ovarian Spore (NCI) 5 P50 CA083639 (GBM), and Breast PPG (NIH), 5P01 CA099031 (M.C. Hung, GBM).
References
- 1.Altenberg B, Greulich KO (2004) Genes of glycolysis are ubiquitously overexpressed in 24 cancer classes. Genomics 84(6):1014–1020. doi: 10.1016/j.ygeno.2004.08.010 [DOI] [PubMed] [Google Scholar]
- 2.Tu SH, Chang CC, Chen CS, Tam KW, Wang YJ, Lee CH, Lin HW, Cheng TC, Huang CS, Chu JS, Shih NY, Chen LC, Leu SJ, Ho YS, Wu CH (2010) Increased expression of enolase alpha in human breast cancer confers tamoxifen resistance in human breast cancer cells. Breast Cancer Res Treat 121(3):539–553. doi: 10.1007/s10549-009-0492-0 [DOI] [PubMed] [Google Scholar]
- 3.Geiger T, Madden SF, Gallagher WM, Cox J, Mann M (2012) Proteomic portrait of human breast cancer progression identifies novel prognostic markers. Cancer Res 72(9): 2428–2439. doi: 10.1158/0008-5472.CAN-11-3711 [DOI] [PubMed] [Google Scholar]
- 4.Jerby L, Wolf L, Denkert C, Stein GY, Hilvo M, Oresic M, Geiger T, Ruppin E (2012) Metabolic associations of reduced proliferation and oxidative stress in advanced breast cancer. Cancer Res 72(22):5712–5720. doi: 10.1158/0008-5472.CAN-12-2215 [DOI] [PubMed] [Google Scholar]
- 5.Dennison JB, Molina JR, Mitra S, Gonzalez-Angulo AM, Balko JM, Kuba MG, Sanders ME, Pinto JA, Gomez HL, Arteaga CL, Brown RE, Mills GB (2013) Lactate dehydrogenase B: a metabolic marker of response to neoadjuvant chemotherapy in breast cancer. Clin Cancer Res 19(13):3703–3713. doi: 10.1158/1078-0432.CCR-13-0623 [DOI] [PMC free article] [PubMed] [Google Scholar]
- 6.Cormont M, Le Marchand-Brustel Y (2001) The role of small G-proteins in the regulation of glucose transport (review). Mol Mem Biol 18(3):213–220 [DOI] [PubMed] [Google Scholar]
- 7.Handley MT, Morris-Rosendahl DJ, Brown S, Macdonald F, Hardy C, Bem D, Carpanini SM, Borck G, Martorell L, Izzi C, Faravelli F, Accorsi P, Pinelli L, Basel-Vanagaite L, Peretz G, Abdel-Salam GM, Zaki MS, Jansen A, Mowat D, Glass I, Stewart H, Mancini G, Lederer D, Roscioli T, Giuliano F, Plomp AS, Rolfs A, Graham JM, Seemanova E, Poo P, Garcia-Cazorla A, Edery P, Jackson IJ, Maher ER, Aligianis IA (2013) Mutation spectrum in RAB3GAP1, RAB3GAP2, and RAB18 and genotype-phenotype correlations in warburg micro syndrome and Martsolf syndrome. Hum Mut 34(5):686–696. doi: 10.1002/humu.22296 [DOI] [PubMed] [Google Scholar]
- 8.Honscher C, Mari M, Auffarth K, Bohnert M, Griffith J, Geerts W, van der Laan M, Cabrera M, Reggiori F, Ungermann C (2014) Cellular metabolism regulates contact sites between vacuoles and mitochondria. Dev Cell 30(1):86–94. doi: 10.1016/j.devcel.2014.06.006 [DOI] [PubMed] [Google Scholar]
- 9.Shreya Mitra GBM (2013) Aberrant vesicular trafficking contributes to altered polarity and metabolism in cancer, vol ISBN 978–1-4614–6527, Vesicle trafficking in cancer. Springer, New York, NY [Google Scholar]
- 10.Mosesson Y, Mills GB, Yarden Y (2008) Derailed endocytosis: an emerging feature of cancer. Nat Rev Cancer 8(11):835–850. doi: 10.1038/nrc2521 [DOI] [PubMed] [Google Scholar]
- 11.Mitra S, Cheng KW, Mills GB (2011) Rab GTPases implicated in inherited and acquired disorders. Seminars Cell Dev Biol 22(1):57–68. doi: 10.1016/j.semcdb.2010.12.005 [DOI] [PMC free article] [PubMed] [Google Scholar]
- 12.Cheng KW, Agarwal R, Mitra S, Lee JS, Carey M, Gray JW, Mills GB (2012) Rab25 increases cellular ATP and glycogen stores protecting cancer cells from bioenergetic stress. EMBO Mol Med 4(2):125–141. doi: 10.1002/emmm.201100193 [DOI] [PMC free article] [PubMed] [Google Scholar]
- 13.Liu Y, Tao X, Jia L, Cheng KW, Lu Y, Yu Y, Feng Y (2012) Knockdown of RAB25 promotes autophagy and inhibits cell growth in ovarian cancer cells. Mol Med Rep 6(5):1006–1012. doi: 10.3892/mmr.2012.1052 [DOI] [PubMed] [Google Scholar]
- 14.Agarwal R, Jurisica I, Mills GB, Cheng KW (2009) The emerging role of the RAB25 small GTPase in cancer. Traffic 10(11):1561–1568. doi: 10.1111/j.1600-0854.2009.00969.x [DOI] [PMC free article] [PubMed] [Google Scholar]
- 15.Casanova JE, Wang X, Kumar R, Bhartur SG, Navarre J, Woodrum JE, Altschuler Y, Ray GS, Goldenring JR (1999) Association of Rab25 and Rab11a with the apical recycling system of polarized Madin-Darby canine kidney cells. Mol Biol Cell 10(1):47–61 [DOI] [PMC free article] [PubMed] [Google Scholar]
- 16.Goldenring JR, Aron LM, Lapierre LA, Navarre J, Casanova JE (2001) Expression and properties of Rab25 in polarized Madin-Darby canine kidney cells. Methods Enzymol 329:225–234 [DOI] [PubMed] [Google Scholar]
- 17.Goldenring JR, Shen KR, Vaughan HD, Modlin IM (1993) Identification of a small GTP-binding protein, Rab25, expressed in the gastrointestinal mucosa, kidney, and lung. J Biol Chem 268(25):18419–18422 [PubMed] [Google Scholar]
- 18.Vander Heiden MG, Cantley LC, Thompson CB (2009) Understanding the Warburg effect: the metabolic requirements of cell proliferation. Science 324(5930):1029–1033. doi: 10.1126/science.1160809 [DOI] [PMC free article] [PubMed] [Google Scholar]
- 19.DeBerardinis RJ, Lum JJ, Hatzivassiliou G, Thompson CB (2008) The biology of cancer: metabolic reprogramming fuels cell growth and proliferation. Cell Metabolism 7(1):11–20. doi: 10.1016/j.cmet.2007.10.002 [DOI] [PubMed] [Google Scholar]
- 20.Cheng KW, Lahad JP, Kuo WL, Lapuk A, Yamada K, Auersperg N, Liu J, Smith-McCune K, Lu KH, Fishman D, Gray JW, Mills GB (2004) The RAB25 small GTPase determines aggressiveness of ovarian and breast cancers. Nat Med 10(11):1251–1256. doi: 10.1038/nm1125 [DOI] [PubMed] [Google Scholar]
- 21.Cheng KW, Lu Y, Mills GB (2005) Assay of Rab25 function in ovarian and breast cancers. Methods Enzymol 403:202–215. doi: 10.1016/S0076-6879(05)03017-X [DOI] [PubMed] [Google Scholar]
- 22.Hennessy BT, Lu Y, Gonzalez-Angulo AM, Carey MS, Myhre S, Ju Z, Davies MA, Liu W, Coombes K, Meric-Bernstam F, Bedrosian I, McGahren M, Agarwal R, Zhang F, Overgaard J, Alsner J, Neve RM, Kuo WL, Gray JW, Borresen-Dale AL, Mills GB (2010) A technical assessment of the utility of reverse phase protein arrays for the study of the functional proteome in non-microdissected human breast cancers. Clin Proteomics 6(4):129–151. doi: 10.1007/s12014-010-9055-y [DOI] [PMC free article] [PubMed] [Google Scholar]
- 23.Carey MS, Agarwal R, Gilks B, Swenerton K, Kalloger S, Santos J, Ju Z, Lu Y, Zhang F, Coombes KR, Miller D, Huntsman D, Mills GB, Hennessy BT (2010) Functional proteomic analysis of advanced serous ovarian cancer using reverse phase protein array: TGF-beta pathway signaling indicates response to primary chemotherapy. Clin Cancer Res 16(10):2852–2860. doi: 10.1158/1078-0432.CCR-09-2502 [DOI] [PMC free article] [PubMed] [Google Scholar]