



Abstract
Schwann cell (SC) grafts promote axon regeneration in the injured spinal cord, but transplant efficacy is diminished by a high death rate in the first 2–3 days postimplantation. Both hypoxic preconditioning and pharmacological induction of the cellular hypoxic response can drive cellular adaptations and improve transplant survival in a number of disease/injury models. Hypoxia-inducible factor 1 alpha (HIF-1α), a regulator of the cellular response to hypoxia, is implicated in preconditioning-associated protection. HIF-1α cellular levels are regulated by the HIF-prolyl hydroxylases (HIF-PHDs). Pharmacological inhibition of the HIF-PHDs mimics hypoxic preconditioning and provides a method to induce adaptive hypoxic responses without direct exposure to hypoxia. In this study, we show that hypoxia-mimetics, deferoxamine (DFO) and adaptaquin (AQ), enhance HIF-1α stability and HIF-1α target gene expression. Expression profiling of hypoxia-related genes demonstrates that HIF-dependent and HIF-independent expression changes occur. Analyses of transcription factor binding sites identify several candidate transcriptional co-regulators that vary in SCs along with HIF-1α. Using an in vitro model system, we show that hypoxia-mimetics are potent blockers of oxidative stress-induced death in SCs. In contrast, traditional hypoxic preconditioning was not protective. The robust protection induced by pharmacological preconditioning, particularly with DFO, indicates that pharmacological induction of hypoxic adaptations could be useful for promoting transplanted SC survival. These agents may also be more broadly useful for protecting SCs, as oxidative stress is a major pathway that drives cellular damage in the context of neurological injury and disease, including demyelinating diseases and peripheral neuropathies.
Keywords: adaptaquin, cell death, cell survival, deferoxamine, H2O2, hypoxia adaptations, hypoxia inducible factor (HIF), preconditioning, prolyl hydroxylase inhibition, reporter assay
1 |. INTRODUCTION
In animal models of spinal cord injury (SCI), transplantation of Schwann cells (SCs) promotes axon regeneration, preserves tissue, and, in some instances, partially restores function and axonal conduction (preclinical data reviewed in: Tetzlaff et al., 2011). For humans with SCI, SC transplantation is demonstrably safe and has successfully completed Phase 1 clinical trials (Anderson et al., 2017). SC transplants are promising for SCI repair, but they are not sufficient to restore function (Tetzlaff et al., 2011). Combinational approaches, which includes those that target the acute cell death of transplanted cells (David et al., 2020; Hill et al., 2010; Marquardt et al., 2020; Patel et al., 2010), are required to enhance efficacy.
In a number of injury and disease contexts, including cell transplantation, hypoxic preconditioning is highly cytoprotective (Terrovitis et al., 2010; Wei et al., 2017; Yu et al., 2013). Mechanistically, the exposure of cells to reduced oxygen (O2) induces adaptive transcriptional and posttranscriptional changes that afford protection against subsequent stressors (Nakayama & Kataoka, 2019; Rybnikova & Samoilov, 2015). The coordinated cellular response to hypoxic preconditioning includes, but is not limited to, changes to cellular pathways that control cellular and energy metabolism (including O2 delivery), oxidative stress, cell death, and growth (Lee et al., 2020). In cancer and immune cells, the adaptive cellular and molecular response to hypoxia is well-documented (Claesson-Welsh, 2020; Krzywinska & Stockmann, 2018) and multiple transcriptional activators (e.g., HIFs, CREB/ATFs, p53, SP1/3, NF-IL6, SMADs) and repressors (e.g., REST, BACH1, ID1, ID2, ZEB1/ZEB2) contribute to the adaptive gene expression changes (Cavadas et al., 2017).
The most widely studied and best understood cellular adaptations to hypoxia are those associated with the hypoxia-inducible factor (HIF) family of transcription factors. HIF-1α is a master regulator of the hypoxia response in cells (Semenza, 1998). It was originally identified as a cellular O2-sensor controlling expression of erythropoietin (Wang & Semenza, 1993b) and vascular endothelial growth factor (VEGF) (Forsythe et al., 1996; Liu et al., 1995), which both regulate O2 delivery. Since the initial identification of the hypoxia response element (HRE) as the genomic binding site for the HIFs (Semenza et al., 1996), hundreds of additional HIF target genes have been predicted and/or experimentally identified (Benita et al., 2009; Chi et al., 2006; Schodel et al., 2011; Schodel et al., 2013).
HIF-α levels in cells are posttranscriptionally regulated by the HIF-prolyl hydroxylases (HIF-PHDs), Fe2+-, O2-, and 2-oxoglutarate (2-OG)-dependent enzymes that hydroxylate HIF-α at the oxygen-dependent degradation (ODD) domain and target it for proteasomal degradation (Jaakkola et al., 2001; Pugh, 2016; Semenza, 2007) (Figure 1(a)). Thus, similar to exposing cells to low O2 (Theus et al., 2008; Wakai et al., 2016), HIF-1α levels can be increased by forced expression (David et al., 2020) or by pharmacological inhibition of the HIF-PHDs (Karuppagounder et al., 2016; Ratan et al., 2008). Unlike implementation of hypoxic preconditioning, pharmacological preconditioning does not require special equipment, which will make it easier to implement into clinical cell transplantation protocols. Moreover, the development of HIF-PHD-specific inhibitors allows for the effects of the HIF-PHDs on cells to be distinguished from the effects of other oxygenases, which are also affected by manipulating their co-factors, Fe2+-, O2-, and 2-OG, the targets of traditional HIF-PHD inhibitors.
FIGURE 1.
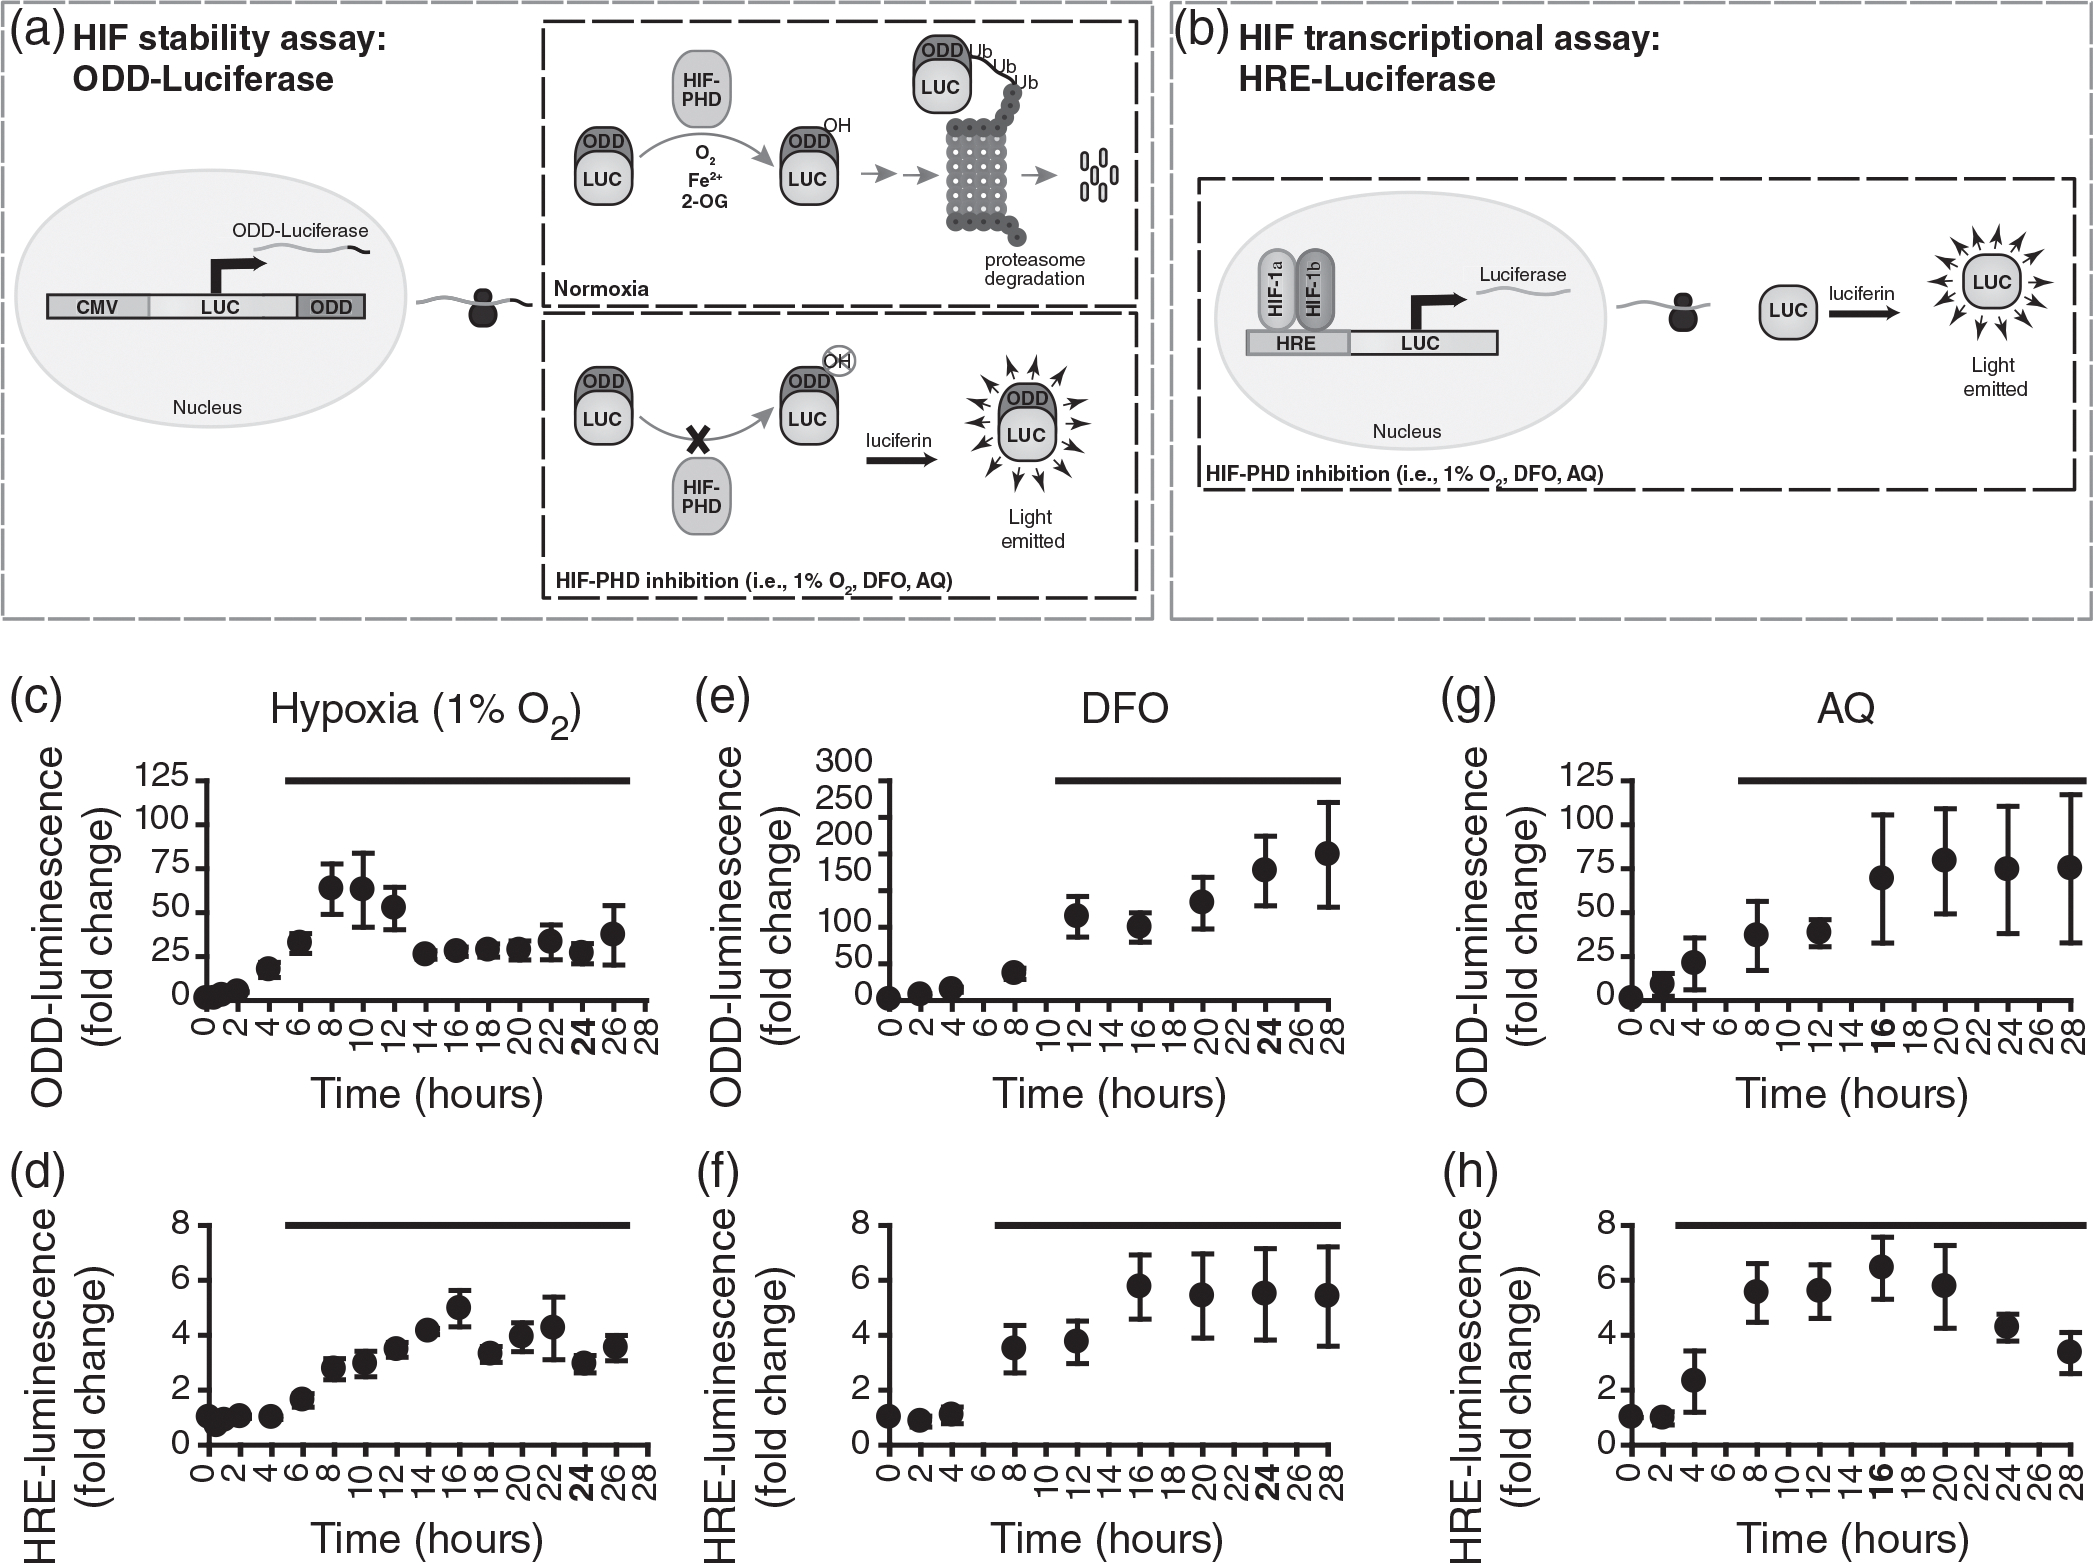
Luciferase activity over time following administration of 1% O2, deferoxamine (DFO) (200 μM) or adaptaquin (AQ) (10 μM) to Schwann cells (SCs) expressing either oxygen-dependent degradation (ODD)-luc to assess hypoxia-inducible factor (HIF) stabilization or hypoxia response element (HRE)-luc to assess HIF transcriptional activity. (a) Schematic of ODD-luc assay. In normoxia, the HIF-prolyl hydroxylases (PHDs) hydoxylate the ODD-luc fusion protein resulting in its proteasomal targeting and degradation. When the HIF-PHDs are inhibited, ODD-luc accumulates. The amount of light produced by the luciferase reaction when luciferin is added reflects the level of ODD-stabilization or degradation. (b) Schematic of HRE-luc assay. Transcription of luciferase is dependent on the HRE. HIF-binding and subsequent transcriptional activation results in increased luciferase levels within the cell. The amount of light produced by the luciferase reaction reflects the level of HIF-dependent HRE-mediated transcription. (c) 6–30 h of exposure to 1% O2 significantly increased the amount of light detected in ODD–luc expressing SCs (ANOVA: F(34,16) = 4.790, p = .000062, power = 1.000, post hoc: p < .05), 6–26 h shown. Maximum ODD-luc activity occurred with 8 h of 1% O2 exposure (63.3 ± 14.33-fold increase). Longer exposure to 1% O2 (14–30 h) resulted in reduced, but significantly elevated, levels of luciferase activity (24- to 33-fold increase above baseline). (d) 1% O2 significantly increased HRE-luc activity with 8–30 h of exposure (ANOVA: F(34, 16) = 8.404, p = 1.2084e−7, power = 1.000, post hoc: p < .05), up to 26 h shown. Maximum HRE-luc activity occurred with 16 h of hypoxia exposure (5.0 ± 0.66-fold increase). Longer hypoxia exposure (18–30 h) resulted in reduced, but significantly elevated, levels of HRE-luc activity (3.3- to 4.2-fold increase above baseline). (e) Exposure of ODD-luc SCs to DFO resulted in significantly increased luciferase activity from 12 to 28 h (ANOVA: F(7,8) = 20.594, p = 1.3019e−9, power = 1.000, post hoc: p < .05). Maximum ODD-luc activity occurred with 28 h of DFO exposure (198.8 ± 35.7-fold increase). (f) DFO exposure significantly increased HRE-luc activity from 8 to 28 h (ANOVA: F(27,8) = 14.217, p = 7.1611e−8, power = 1.000, post hoc: p < .05). Maximum HRE-luc activity occurred with 16 h of DFO exposure (5.8 ± 0.58-fold increase), after which HIF transcriptional activity remained elevated by 5.4- to 5.5-fold though 28 h of exposure. (g) 8–28 h of AQ exposure significantly increased ODD-luc activity (ANOVA: F(27,8) = 5.572, p = .000326, power = 0.995, post hoc: p < .05). Maximum stabilization occurred with 20 h of exposure (79.2 ± 14.94-fold increase). (h) 4–28 h AQ treatment significantly increased HRE-luc activity (ANOVA: F(27,8) = 20.555, p = 1.3294e−9, post hoc: p < .05). Maximum HIF transcriptional activity occurred with 16 h of AQ exposure (6.4 ± 0.56-fold increase), after which time HIF transcriptional activity gradually decreased to 3.3 ± 0.38 above baseline with 28 h of AQ exposure. Exposure times highlighted in bold were used for subsequent experiments. Solid bar denotes time points significantly elevated from baseline. Experiments were repeated three to four times, with three to four technical replicates for each independent replicate time, per condition, per time point. post hoc: Fisher’s LSD, one-tailed. n = 3–4
HIF-1α is one of three HIF-α family members (Claesson-Welsh, 2020). HIF-2α initiates distinct but overlapping transcriptional responses to HIF-1α (Mole et al., 2009) and HIF-3α’s function is poorly understood (Duan, 2016). When HIF-1α dimerizes with HIF-β, it translocates to the nucleus, where they recognize their DNA binding sequence, the HRE, which can lead to the transcription of HRE-mediated HIF-target genes (Semenza, 2007) (Figure 1(b)).
The molecular response to hypoxia remains largely unexplored in SCs. Only a few studies have examined the effects of hypoxia on SCs (Chen et al., 2015; Zhu et al., 2008; Zhu et al., 2010) and using preconditioning as an approach to improve the survival of SCs remains untested. Recently, we demonstrated that viral-mediated induction of HIF-1α protects SCs against oxidative stress-induced cell death (David et al., 2020), one of the mechanisms postulated to lead to the acute death of transplanted cells. Moreover, enhancing HIF-1α-mediated transcription in SCs was sufficient to enhance their survival when transplanted into the injured spinal cord 7-days post-SCI (David et al., 2020), a time postinjury where oxidative-stress is elevated (Carrico et al., 2009). In the current study, we test the ability of hypoxia preconditioning to stabilize HIF-1α and induce hypoxia-related pathways in SCs and assess its ability to decrease cell death in cultured rat SCs subjected to oxidative stress. We compare the effects of hypoxic preconditioning of SCs by pharmacological inhibition of the HIF-PHDs induced by treatment with either deferoxamine (DFO) or adaptaquin (AQ) with hypoxic preconditioning induced by direct exposure of SCs to low oxygen (1% O2).
DFO is an iron (Fe2+) chelator that interferes with the ability of the HIF-PHDs, Fe2+, O2, and 2-OG-dependent enzymes, to hydroxylate HIF and target it for proteasomal degradation (Hwang & Brown, 1964; Jaakkola et al., 2001; Wang & Semenza, 1993a). DFO treatment mimics hypoxia and results in HIF-stabilization and increases HIF transcriptional activity in a variety of cells (Wang & Semenza, 1993a). In addition to known hypoxia-mimetics (e.g., DFO, DMOG, etc.) that stabilize HIF by interfering with the functioning of the HIF-PHDs, a non-biased screen for HIF stabilizers identified several additional small molecule candidates (Smirnova et al., 2010), including a branched oxyquinol subsequently named AQ (Karuppagounder et al., 2016). AQ increases the expression of HIF-1α in mouse neurons (Karuppagounder et al., 2016) and is neuroprotective in mouse models of stroke and Parkinson’s disease (Aime et al. 2020; Karuppagounder et al., 2016). Unlike DFO, it inhibits the active site of the HIF-PHDs and does not appear to affect other Fe2+, O2, and 2-OG-dependent enzymes (Karuppagounder et al., 2016).
Our studies establish a dosing schedule which effectively induces HIF-1α-mediated transcription in SCs. They reveal that both hypoxia and the hypoxia-mimetics induce HIF-1α mediated transcription in SCs, but that each treatment also induces unique HIF-independent transcriptional responses. Finally, they demonstrate that preconditioning SCs with the hypoxia-mimetics provides superior protection against oxidative stress-induced death than direct hypoxic preconditioning. Thus, pharmacological manipulation of hypoxia pathways may not only be more feasible to implement clinically that direct hypoxic preconditioning, but may afford greater cytoprotection and lead to enhanced survival of transplanted SCs. Additionally, as hypoxia-mimetics mitigate oxidative stress-induced damage in SCs, they may also afford protection after peripheral nervous system injury and in diseases linked to oxidative damage, such as demyelinating diseases and peripheral neuropathies.
2 |. MATERIALS AND METHODS
2.1 |. Generation of SCs
SCs were isolated from adult Fischer rat nerves (Harlan/Envigo, barrier 217, see Dai & Hill, 2018 for complete protocol). SCs were allowed to dedifferentiate in D-10-3M D-10 with three mitogens: forskolin (2 μM, Sigma-Aldrich), heregulin (3.5 μM, GenWay Biotech), and pituitary extract (20 μg/ml, Alfa Aesar) for 10 days before dissociating with dispase: 12.5 U/ml and collagenase: 0.5% and replating into poly-l-lysine (PLL)-coated 10 cm dishes (Corning). Once confluent, they were treated with Thy1+ antibody and complement to remove Thy1+ fibroblasts. Cells were frozen as passage 1 (P1) cells and expanded to P3 or P4 for experiments. Lentiviral transduction was performed at P1 and cells expanded for use at P3 or P4. For expression of multiple constructs, lentiviruses were serially applied to P1 cells with a separation of at least 24 h between transfections, or lentiviruses were serially added to cells following passaging at P1 and P2. Lentivirus containing enhanced green fluorescent protein (LV-GFP: MOI 23, Miami Project Viral Vector Core) resulted in 94.5% of SCs expressing GFP. GFP SCs were subsequently transfected with a second lentivirus containing either: luciferase expressed behind the HRE promotor (LV-HRE-luc: MOI 192; Semenza et al., 1996) to allow for determination of HIF transcriptional activity or luciferase tagged with the ODD domain of HIF (LV-ODD-luc: MOI 40; Smirnova et al., 2010) to allow for determination of HIF protein stabilization.
2.2 |. Hypoxia manipulation of SCs
SCs were directly exposed to hypoxia using a hypoxia chamber (Coy) equilibrated to 1% O2, 5% CO2 with nitrogen (95%) and hydrogen (5%). When cells were first introduced to the hypoxia chamber, their culture media was replaced with media that was pre-equilibrated to 1% O2. Cells were kept at 1% O2 for the times specified in the individual experiments.
2.3 |. Pharmacological manipulation of SCs
Preliminary dose response studies determined that strong ODD-luc and HRE-luc expression in SCs was achieved with 200 μM DFO and 10 μM AQ. These concentrations were subsequently used for all experiments. Frozen stock solutions of DFO (100 mM) and AQ (10 mM) were kindly provided by the Ratan lab. DFO (Sigma Aldrich) was dissolved in water. AQ stock was made by dissolving AQ (synthesized by Fox Chase Cancer center, PA) in anhydrous DMSO. At the time of experimentation, stock solutions were diluted in D-10-3M to their final concentration of 200 μM DFO or 10 μM AQ (0.1% DMSO). The level of DMSO included with AQ treatment was below the level established to influence SCs (Sutrina et al., 1987).
2.4 |. Luciferase reporter assays for HIF stabilization and HIF transcriptional activity
2.4.1 |. Drug treatment
LV-ODD-luc GFP SCs or LV-HRE-luc GFP SCs (P3 or P4) were collected and 25,000 cells were plated per well in 96-well PLL-coated plates. Cells were grown for a total of 46–50 h from plating to assay. Luciferase activity was assayed 0, 2, 4, 8, 12, 16, 20, 24, or 28 h after application of DFO (200 μM) or AQ (10 μM) using the Luciferase Assay System following the manufacturer’s instructions (Promega). Prior to the luciferase assay, GFP fluorescence levels in the cells were measured. Normalized luminescence levels were determined by the following equation: , where is the luminescence of the sample; is the luminescence of a blank well with media; is the sample fluorescence; is the fluorescence of a blank well with media. Fold change was calculated by setting the luminescence at 0 h = 1. All assays were run within 4 h of each other to ensure a similar growth time for the cells. All experiments included three to four technical replicates and were repeated at least three times to generate three independent samples.
2.4.2 |. Hypoxia treatment
LV-ODD-luc GFP SCs or LV-HRE-luc GFP SCs were collected and 25,000 cells were plated per well in 96-well PLL-coated plates. Cells were grown for 3 days and then exposed to 1% O2 for 0, 2, 4, 6, 8, 10, 12, 14, 16, 18, 20, 22, 24, 26, or 30 h before assaying for luciferase expression using the Luciferase Assay System following the manufacturer’s instructions (Promega). Luminescence was normalized to protein concentration determined by the DC Protein Assay. Fold change was calculated relative to luminescence at 0 h. To control for the effect of growth time on cell numbers, all cells were plated at the same time and the exposure of the cells to the treatments was then staggered resulting in a total growth time of ~4 days for all of the cells. Reported values are the average of at least three independent samples (three to four technical replicates/sample).
2.5 |. Cell survival and death in response to hydrogen peroxide
SCs (P3 or P4) were collected and 10,000 cells per well were plated in 96-well plates and grown for 40–44 h before exposure to hydrogen peroxide (H2O2). For DFO and hypoxia treatment, they were grown for 18–20 h and then exposed to 1% O2 or 200 μM DFO for 24 h. For AQ treatment, they were grown for 24–26 h and then exposed to 10 μM AQ for 16 h. These treatment exposure times resulted in robust induction of luciferase activity in the ODD-luc and HRE-luc assays and are amenable to inclusion into transplantation protocols. Following drug treatment, H2O2 (0–1000 μM) was added with fresh drug (pretreatment and posttreatment) or without drug (pretreatment) to the cells. For hypoxia treatment, H2O2 was added to the cells exposed to 1% O2 in the hypoxia chamber (pretreatment and posttreatment) or returned to normoxia (pretreatment).
In separate experiments, the survival of the cells was determined after 3 or 24 h of H2O2 exposure using an MTS (3-(4,5-dimethylthiazol-2-yl)-5-(3-carboxymethoxyphenyl)-2-(4-sulfophenyl)-2H-tetrazolium) assay or fluorescent labeling of live nuclei (NucRed Live 647; ThermoFisher Scientific) and dead nuclei (NucGreen Dead 488; ThermoFisher Scientific). Thirty minutes before assaying, control cells were treated with cell lysis buffer (9% Triton X-100 weight/volume). For the MTS assays the H2O2 was replaced with MTS in medium (D-10-3M) and the cells were incubated with MTS for 4 h before absorbance was read at 490 nm using the SpectraMax i3 (Molecular Devices). For fluorescent assays, 1 μl of NucRed Live 647 and 1 μl NucGreen Dead 488 was added to the cells for 30 min. Cells were rinsed with PBS, fixed with 4% paraformaldehyde, imaged and quantified using the SpectraMax i3.
For MTS assays, percent survival levels were determined by the following equation: , where is the absorbance of the sample; is the absorbance of a blank well with media; the absorbance of control SCs. The LD50 for H2O2 was established for each treatment/survival time separately by identifying the concentration that resulted in the survival of approximately 50% of the control SCs. All experiments included three to four technical replicates per condition and were repeated at least three times to generate three independent samples.
For the live/dead cell counts, the number of cells per well were quantified in each of the wells receiving the LD50 dose of H2O2 for 3 h and control wells not exposed to H2O2 for each of the treatment conditions using the SpectraMax i3 software. The experiments included three to four technical replicates per condition and were repeated at least three times. The number of cells was then averaged across all the wells for each condition to obtain average number of live and dead cells per treatment condition.
2.6 |. Western blotting
P3 cells were collected and grown to confluence before exposure to DFO (24 h; 200 μM), AQ (16 h; 10 μM), or hypoxia (1% O2; 24 h). At the time of collection, cells were trypsinized, washed, centrifuged, resuspended, and recentrifuged as previously described (Dai & Hill, 2018). Protein was isolated from the pellet using the NE-PER kit (ThermoFisher). Western blotting was performed to detect expression levels of HIF-1α, and HIF targets (VEGF and enolase). The following antibodies were used: mouse anti-HIF-1α, 1:1000, Novus Biologicals, NB100-105; rabbit-anti-HIF-1α, 1:1000, Novus Biologicals, - NB100-654; rabbit-anti-β-actin, 1:10,000, A2066 Sigma-Aldrich; mouse-anti-β-actin, 1:10,000, A5316, Sigma-Aldrich; rabbit-anti-VEGF, 1:500, NB100-2381, Novus Biologicals, and; rabbit-anti-enolase, 1:1000, NB100-65252, Novus Biologicals.
For each experiment, 50 μg of nuclear protein was used for assessing HIF-1α and 20 μg of cytoplasmic protein was used for assessing VEGF and enolase. LI-COR secondary antibodies (anti-mouse IR 800:1:10,000; anti-rabbit IR 680:1:10,000) were used for all blots. Protein was loaded and resolved on either 10% sodium dodecyl sulfate polyacrylamide gels or 4–15% gradient precast gels (BioRad). Proteins were transferred to nitrocellulose membranes for immunological detection. All samples used β-actin levels as the loading control. Primary antibodies were incubated overnight at 4°C and secondary antibodies were incubated for 60–90 min at room temperature.
2.7 |. RNA isolation
Confluent P3 cells exposed to DFO (24 h; 200 μM), AQ (16 h; 10 μM) or hypoxia (1% O2; 24 h) were collected as per transplantation (Dai & Hill, 2018). After ~3 h on ice, a time reflective of the duration of cell transplantation surgeries, TRI Reagent (Zymo Research) was added directly to Eppendorf tubes containing the cells. The samples were stored at −80°C until processed. RNA was isolated from cells using the Direct-zol RNA Miniprep kit (Zymo Research), following manufacturer’s instructions. Isolated RNA was quantified using the Nanodrop and stored at −80°C.
2.8 |. HIF arrays
Here, 96-well plate hypoxia signaling arrays (Qiagen: PARN-032Z) were used to detect expression levels of 85 unique HIF target genes and 4 housekeeping genes (with 7 control wells) according to the manufacturer’s instructions. Starting with 500 ng of RNA, genomic DNA was removed using the genomic DNA elimination mix and RNA was reverse-transcribed using the reverse transcription mix included with the kit. The resulting cDNA was mixed with SYBR green and added to the 96-well HIF array plate and the qPCRs were run using the 7,500 Fast Real-time PCR System (Applied Biosystems, Inc.). The ABI 7500 Fast System SDS Software v1.5.1 was used to calculate the CT for each target. The CT values were imported into Gene Globe (Qiagen) for analysis of fold regulation and generation of the heatmap. To obtain the hypoxia-related genes that were upregulated or downregulated following treatment, the CT threshold was set to 40. This allowed for mRNAs with low expression in endogenous SCs, which changed in response to the treatments, to be included in the analysis (e.g., Epo, Slc2a4). Delta CT was established using the geometric mean for the housekeeping genes.
2.9 |. Data analysis
g:Profiler (version e98_eg45_p14_ce5b097) was used to perform the TRANSFAC analysis on the hypoxia-related mRNAs changes (Raudvere et al., 2019). The 85 mRNAs included on the hypoxia array were probed against all known rat genes with a g:SCS threshold for significance. Then, 119 predicted binding sites for 85 unique transcription factors were identified ±1 kb of the transcriptional start site. Subsequently, the genes with an absolute fold change of at least 2 and a p-value ≤.1 relative to control SCs or p-value ≤.05 between treatments were similarly probed against all known rat genes. Finally, the lists of shared and treatment-responsive transcription factors with predicted binding sites were compared to the list of transcription factors identified by predicted binding sites for the hypoxia-related gene set. For network analysis, interactions between genes were downloaded from StringDB (v11.0) and the network was generated and analyzed with Cytoscape (v3.6.1). Clusters were identified by GLay community clustering using the clusterMaker2 app (v1.3.1). To generate word clouds for each cluster, individual genes were annotated with associated GO terms, followed by using the AutoAnnotate (v1.2) and WordCloud (3.1.3) apps. Finally, each cluster was assigned a cluster activity score based on a pathway activity score from (Qu et al., 2019) and calculated by:
2.10 |. Statistics
Multivariate analysis was performed using SPSS (version 22) for analysis of the luciferase and H2O2 assays. One-tailed t tests were used to identify proteins significantly elevated relative to control SCs on Western blots. For analysis of the qPCR results, p-values were calculated as part of the analysis in both Gene Globe (Qiagen) and g: Profiler.
3 |. RESULTS
3.1 |. Hypoxia, DFO, and AQ induce HIF stabilization and transcriptional activity of HRE containing genes
The impact of low O2, DFO and AQ treatment on HIF-1α protein stabilization and the activation of HIF-1α target gene transcription was assessed in SCs. Luciferase assays were used to determine the exposure duration necessary to achieve robust induction of HIF-mediated transcription in SCs. Two different reporters were used. To test the ability of the treatments to stabilize HIF-1α (i.e., reduce hydroxylation of the HIF-1α ODD), cultured SCs were transduced to express a luciferase-fusion protein containing the HIF-1α ODD-domain (ODD-luc) (Figure 1(a)). To test whether generic HIF-1α target gene expression is increased by hypoxia or hypoxia-mimetics, the cells were transduced with a luciferase reporter gene that was under the control of a promoter containing HREs (HRE-luc) (Figure 1(b)). SCs expressing either ODD-luc or HRE-luc were exposed to hypoxia (1% O2) or the hypoxia-mimetics (200 μM DFO or 10 μM AQ) and the level of luciferase expression was assessed over a time course. Enhanced luciferase activity was observed for both ODD-luc- and HRE-luc-expressing SCs following exposure to either 1% O2, DFO, or AQ. (Figure 1(c–h)). Thus, we were able to demonstrate that all three preconditioning treatments increased HIF-1α stabilization and transcriptional activity.
The time course over which luciferase levels increased in ODD-luc or HRE-luc SCs in response to the three treatments differed (Figure 1(c–h)). To guide the decision for exposure durations for subsequent experiments, we examined the magnitude and duration of the luciferase activity in SCs expressing ODD-luc or HRE-luc in response to exposure to hypoxia or the hypoxia-mimetics, DFO, and AQ.
ODD-luc activity was significantly elevated following: 6–30 h of low O2 exposure (Figure 1(c)); 12–28 h of exposure to 200 μM DFO (Figure 1 (e)); and 8–28 h of exposure to AQ (Figure 1(g)). Thus, several h of exposure to the treatments is needed to enhance ODD-luc levels within SCs. Compared to hypoxia, it took longer to induce maximum ODD-luc activity with the hypoxia-mimetics (Figure 1(c,e,g)). The hypoxia-mimetics, however, retained higher levels of ODD-luc activity with prolonged exposure (Figure 1(c,e,g)). Maximal luciferase activity with DFO was 3.1-fold greater than with low O2 and 2.5-fold greater than with AQ, indicating that DFO may be more effective at stabilizing HIF-α with prolonged exposure than either hypoxia or AQ treatments.
Similar to the ODD-luc assay results, all three treatments increased HRE-dependent transcription, as determined by HRE-luc activity (Figure 1(d,f,h)). HRE-luc activity was significantly elevated in SCs following 6–28 h of exposure to low O2, 8–28 h of exposure to DFO, and 4–28 h of exposure to AQ. Maximal HRE-luc activity occurred following 16 h of exposure to either hypoxia or the hypoxia-mimetics and was fourfold to sixfold greater than baseline (Figure 1(df,h)). High levels of HRE-luc activity were maintained following prolonged exposure to either low O2 or DFO, but were reduced with prolonged exposure to AQ. In contrast to the large differences in ODD-luc activity observed between the different treatments, the magnitude and timing of HRE-luc activity was more similar between the treatments. Maximal HRE-luc activity was increased by 5.0-fold, 5.8-fold, and 6.4-fold for low O2, DFO, and AQ, respectively. Therefore, while the treatments appear to differ in their ability to stabilize HIF-α, their ability to induce HIF-mediated transcription appeared to be similar.
Together, the ODD-luc and HRE-luc assays indicate that similar to hypoxia, several hours of exposure are required for maximal stabilization of the HIF-1α ODD and effective induction of HRE-mediated transcription. Based on these results, exposures of 24 h were chosen for low O2 and DFO and 16 h was chosen for AQ for all subsequent experiments. These exposure times significantly increased both ODD-luc activity (HIF stabilization) and HRE-luc activity (HIF-α-mediated transcription), and also are feasible for incorporation into clinical transplantation paradigms. At these exposure durations (highlighted in bold in Figure 1(c–h)), low O2, DFO, and AQ increased ODD-luc activity by 26.5 ± 5.78-fold, 176.7 ± 23.77-fold, and 69.1 ± 18.23-fold, respectively, and increased HRE-luc activity by 2.9 ± 0.31-fold, 5.5 ± 0.83-fold and 6.4 ± 0.56-fold, respectively.
3.2 |. SCs elevate nuclear levels of HIF and cytoplasmic levels of its transcriptional targets in response to 1% O2, DFO, and AQ
To confirm that the changes in luciferase activity in ODD-luc and HRE-luc expressing SCs reflected an increase in endogenous HIF-1α stabilization and an upregulation of HIF-1α target gene expression, nuclear HIF-1α protein levels and cytoplasmic protein levels of representative HIF-1α target genes, VEGFA and enolase, were examined.
Western blotting showed that all three treatments increased nuclear HIF-1α levels above control (Figure 2(a,b)), providing evidence of endogenous HIF-1α stabilization. Nuclear levels of HIF-1α were increased by 1.8 ± 0.10-fold with 1% O2, 13.9 ± 1.91-fold by DFO, and 11.3 ± 1.18-fold by AQ. The increase in HIF-1α achieved in SCs in response to hypoxia was just below the levels reported in response to hypoxia in other primary cell types (e.g., stem cells and bone marrow stromal cells), which range from 2- to 6.5-fold when exposed to low O2 (Theus et al., 2008; Wakai et al., 2016). The pharmacological hypoxia-mimetics DFO and AQ resulted in substantially greater nuclear HIF-1α levels in SCs than those achieved with hypoxia treatment (Figure 2(a–d)). For DFO they were 7.7-fold higher and for AQ they were 6.3-fold higher. This was greater than previously achieved by hypoxia treatment of other cell types (Theus et al., 2008; Wakai et al., 2016) or by viral mediated expression of HIF-1α in SCs (David et al., 2020). Overall, the HIF-1α Western blots corroborated the results of the ODD-luc assays. Moreover, they show DFO or AQ were superior to hypoxia at increasing HIF-1α levels in SCs.
FIGURE 2.
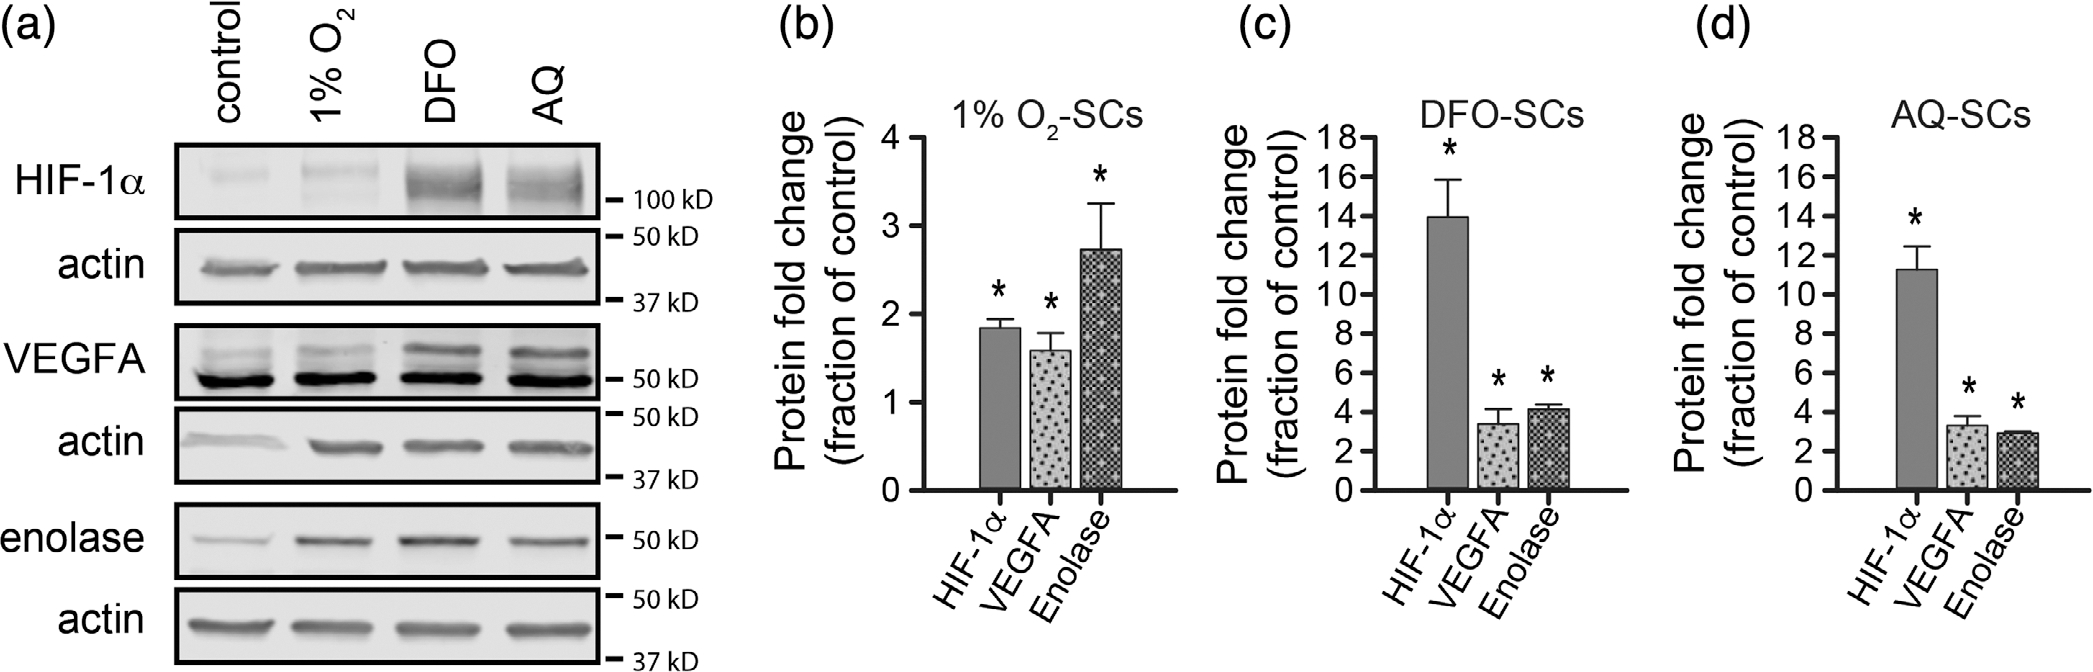
Protein expression of hypoxia-inducible factor 1 alpha (HIF-1α) and HIF target genes following exposure of Schwann cells (SCs) to hypoxia (1% O2) or hypoxia-mimetics (deferoxamine [DFO] or adaptaquin [AQ]). Confluent 10 cm dishes of SCs were treated and collected by trypsinization and centrifugation; nuclear and cytoplasmic protein was isolated. Western blotting (a) shows the nuclear levels of HIF-1α and cytoplasmic levels of VEGFA and enolase. Quantification of the protein levels normalized to β-actin and relative to the expression level in control SCs is shown for cells exposed to low O2 (b), DFO (c), and AQ (d). Levels of HIF-1α were significantly increased by all three treatments (O2, t(2) = 8.07, p = .08, power = 0.99; DFO, t(2) = 6.78, p = .01, power = 0.99; AQ, t(2) = 8.70, p = .007, power = 0.99), as were the levels of VEGFA (O2, t(2) = 2.89, p = .05, power = 0.59; DFO, t(2) = 3.11, p = .05, power = 0.64; AQ, t(2) = 4.68, p = .02, power = 0.89); and enolase (O2, t(2) = 3.30, p = .04, power = 0.68; DFO, t(2) = 13.10, p = .003, power = 0.99; AQ, t(2) = 22.39, p = .001, power = 1.00). Statistics, one-tailed t test. * p ≤ .05. n = 3/condition
To establish whether elevated nuclear HIF-1α levels corresponded to increased protein levels of HIF-1α target genes, we assessed cytoplasmic protein levels of VEGFA and enolase via Western blot. This confirmed that all three treatments increased the levels of these HIF-target proteins, albeit to different levels (Figure 2(a,c,d)). DFO and AQ induced a more robust protein expression of VEGFA than exposure to hypoxia treatment. Moreover, DFO induced greater expression of enolase than either hypoxia or AQ. The levels of VEGFA and enolase following exposure of SCs to DFO and AQ were approximately double those previously achieved with viral expression of HIF-1α in SCs (David et al., 2020). DFO provided a slightly greater elevation of both representative targets than AQ (Figure 2(a,c,d)).
Together the Western blot and luciferase assay results demonstrate that the dosing schedule established for each of the three interventions resulted in HIF-1α stabilization and the induction of HIF-mediated transcriptional pathways in SCs. DFO treatment resulted in the greatest changes, but all three treatments induced key mediators and effectors of adaptive hypoxic pathways in SCs.
3.3 |. Preconditioning of SCs with hypoxia and hypoxia-mimetics, DFO, and AQ, alters the expression profile of hypoxia-related genes in SCs
HIF is a master regulator of the cellular response to hypoxia, but it is one of over 20 transcriptional activators and 10 transcriptional repressors known to direct the response to hypoxia (Cavadas et al., 2017). To better understand the hypoxia-related changes induced in SCs following application of 1% O2 or pharmacological hypoxia-mimetics that target the HIF-PHDs, we profiled the response of 85 previously identified hypoxia-responsive genes by qPCR.
Expression levels in SCs exposed to low O2 or the hypoxia-mimetics, DFO, and AQ, were compared to untreated control SCs. Significant (p ≤ .05) changes were detected for 44.7% (38/85), 60.0% (51/85), and 56.5% (48/85) of transcripts in SCs exposed to 1% O2, DFO, or AQ, respectively (Supplemental Table 1). Most (71.1%) of the mRNA levels covaried across all three treatments (Figure 3(a,b))—15 mRNAs increased (Figure 3(a,c)) and 48 mRNAs decreased (Figure 3(b,d)). Additionally, expression levels of 22 mRNAs were divergent (Figure 3(a,b,e)).
FIGURE 3.
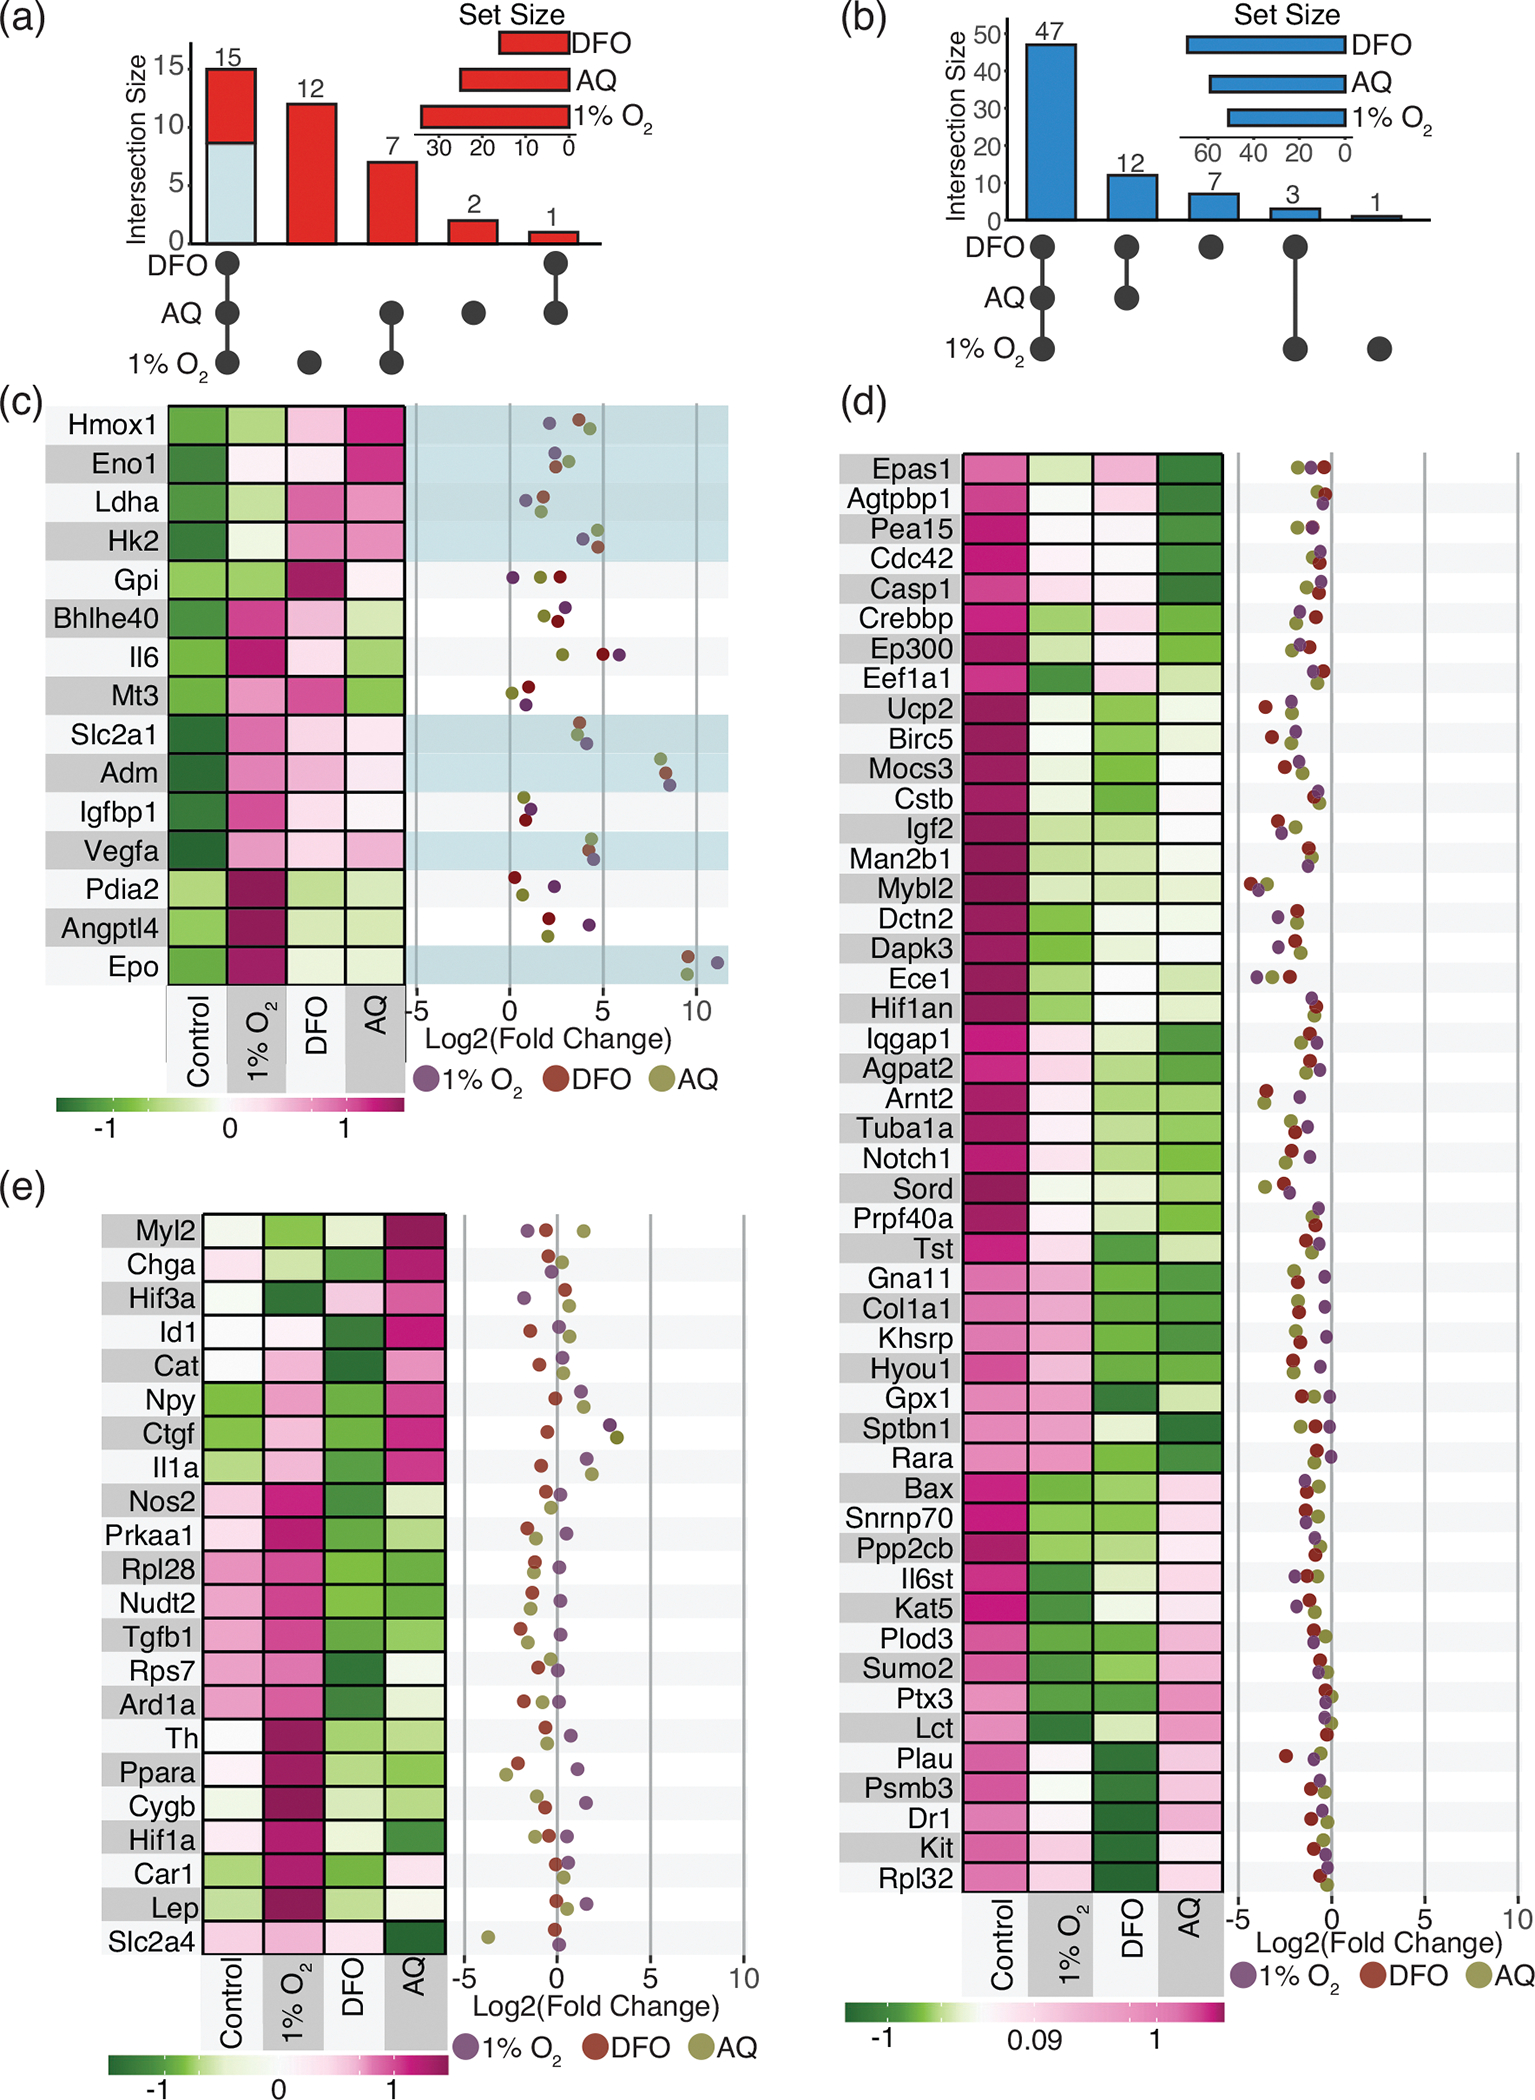
Expression of hypoxia-related mRNAs in Schwann cells (SCs) in response to exposure to 1% O2 (24 h), or hypoxia-mimetics, deferoxamine (DFO) (200 μM, 24 h) or adaptaquin (AQ) (10 μM, 16 h). Confluent 10 cm dishes of SCs were treated and collected by trypsinization and centrifugation. (a,b) Upsets depict the number of mRNAs that are shared or differ between the conditions. Upsets of mRNAs increased (up), (a), and decreased (down), (b), in response to the treatments. Circles reflect treatment condition with change. Lines link conditions with shared responses. Set size reflects the total number of mRNAs altered by the treatment condition. (c–e) Heatmap and expression levels across treatments for the 85 hypoxia-related mRNAs. (c) mRNAs increased in response to all treatment (fold-change >0). (d) mRNAs reduced in response to treatment (fold-change <0). (e) mRNAs with divergent expression. n = 3–4/condition
3.4 |. HIF-1α is the primary regulator of the induced hypoxia-related gene expression
In response to low oxygen, DFO or AQ, 17.6% of the hypoxia-related mRNAs induced in SCs were shared (Figure 3(a)). Nine of these genes (Epo, Adm, Vegfa, Hmox1, Slc2a1, Eno1, Hk2, Ldha, and Prkaa1) were either significantly altered (p ≤ .05) or showed a trend toward significance (p ≤ .1) (Figure 3, Supplemental Table 1). Of these nine genes, eight contain an HRE in their promoter region and are known to be HIF-responsive (Figure 3(c)).
As observed in the HRE-reporter assays (Figure 1), overall, the level of induction of HRE-responsive genes was similar between the treatments (Figure 3(c), Supplemental Table 1). Greater variability in expression was detected for Epo and Adm, the two mRNAs that were induced several folds of magnitude more than the other HRE-containing mRNAs (Figure 3(c), Supplemental Table 1). TRANSFAC analysis was performed to identify transcription factors predicted to bind within 1 kb of the transcriptional start site of the transcripts altered in response to the treatments relative to control SCs. This analysis confirmed that the HIF-1 binding site was overrepresented in the upstream DNA of the transcripts with altered expression in response to all three treatments (Figure 4(a), Supplemental Table 2). In fact, the HIF-1 binding site was the only transcription factor motif identified that was not also associated with the 85 hypoxia-related genes examined. This result further supports the importance of HIF-1α-mediated transcription as a key driver in enhanced expression of hypoxia-related mRNAs in SCs in response to both hypoxia and the pharmacological hypoxia-mimetics. In addition to HIF-1, the TRANSFAC analysis predicts that the binding of ETF (Tead2) and E2F family members, in particular E2F-3, may also contribute to the enhanced expression of hypoxia-related mRNAs in response to the treatments (Figure 4(a), Supplemental Table 2). By examining the hypoxia related mRNAs upregulated in response to treatment, we established that: first, in response to exposure to DFO and AQ, their expression resembles that achieved by exposure to low O2, and second, HRE-responsive transcriptional changes predominate.
FIGURE 4.
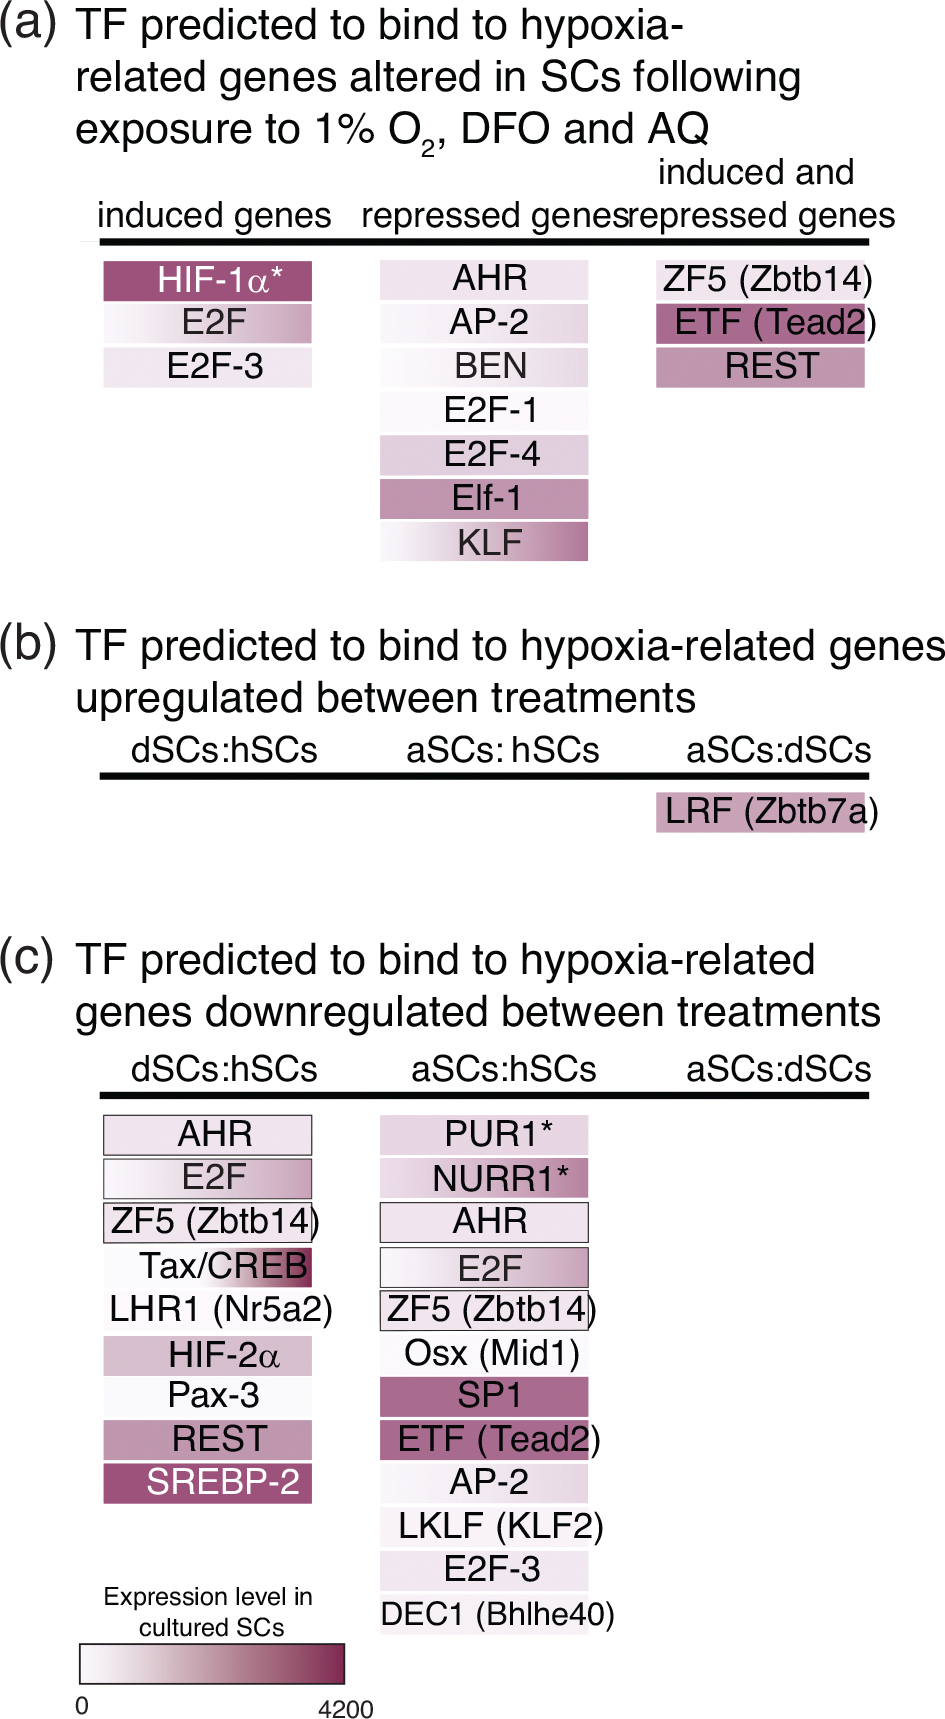
Transcription factors with predicted binding to the hypoxia-related genes altered in Schwann cells (SCs) in response to exposure to low O2, deferoxamine (DFO), or adaptaquin (AQ). (a) Transcription factors identified that are shared between the three treatments relative to control SCs. Transcription factor binding sites (p < .05) were identified by TRANSFAC analysis of the mRNAs induced or repressed in treated vs. control cells. Lists were compared to identify the predicted transcription factors shared between SCs treated with hypoxia or the hypoxia-mimetics. Binding sites and p-values are included in Supplemental Table 2. (b) Transcription factors identified from the gene lists for the mRNAs upregulated (b) or downregulated (c) between treatments. Binding sites and p-values are included in Supplemental Table 5. Color intensity reflects level of expression in cultured SCs in Clements et al. (2017). *, transcription factors with predicted binding sites that are overrepresented for the altered mRNAs, but not for the 85 hypoxia-related mRNAs. Transcription factors with gray outlines were identified to be altered compared to hypoxia, but shared between the two hypoxia-mimetics
Together the examination of hypoxia-related gene expression supports HIF-mediated transcription as the primary mechanism driving the enhanced expression of hypoxia related genes in SCs in response to all the three treatments.
3.5 |. HIF-1α is not associated with hypoxia-related gene repression
In contrast to the few hypoxia-related genes induced by exposing SCs to hypoxia, DFO or AQ (Figure 3(a,c), Supplemental Table 1), all three treatments led to substantial repression of hypoxia-related gene expression in SCs (Figure 3(b,d), Supplemental Table 1). Most of the hypoxia-related mRNAs (56.5%) were repressed and 25 mRNAs were significantly repressed (Supplemental Table 1). None of the 48 mRNAs with decreased expression following treatment are known HRE-containing genes and the HIF-1 binding site was not associated with the repressed mRNAs in the TRANSFAC analysis (Figure 4(a)). This indicates that the repressive changes are HIF-independent. Thus, in addition to HIF-1α, other transcription factors must participate in the SC cellular adaptations following exposure to hypoxia and pharmacological hypoxia-mimetics.
TRANSFAC analysis for predicted transcription factor binding sites in SC genes altered with exposure to low O2, DFO, or AQ identified several candidate transcription factors that were shared across the three treatments and are expressed in cultured SCs (Clements et al., 2017) (Figure 4(a), Supplemental Table 2). The transcription factors predicted to regulate the expression of the hypoxia-related genes repressed in response to treatment were ETF (Tead2), REST, E2F-1, E2F-4, AP2, ZF5 (Zbtb14), BEN (Bend), KLF, Elf-1, and AHR. Therefore, in addition to the HIF-1α-mediated induction of hypoxia-related gene expression, additional transcription factors are predicted to regulate the substantial hypoxia-related gene repression that occurs in SCs following exposure to hypoxia or the hypoxia-mimetics, DFO, and AQ.
Notable among the transcription factors predicted to regulate the expression of the hypoxia-related genes altered in SCs in response to hypoxia or exposure to the hypoxia-mimetics was RE-1 silencing transcription factor, REST. REST is an established hypoxia-responsive transcriptional repressor that mediates both HIF-dependent and HIF-independent cellular responses to prolonged hypoxia (Cavadas et al., 2015; Cavadas et al., 2016). REST binding sites were identified for 13 upregulated genes and 40 downregulated genes altered in response to at least one of the treatment conditions (Supplemental Table 3). REST is associated with suppression of HIF-mediated adaptations in response to prolonged hypoxia, including suppression of Hif1a transcription (Cavadas et al., 2015). Thus, to address whether the identification of REST was associated with suppression of HIF-mediated adaptations in SCs following the treatments, we examined the genes associated with the identification of REST (Supplemental Table 3) for evidence of suppression of HIF family members and HIF-regulators. Fewer than 12% of the genes predicted to have REST binding sites were identified to be associated with the regulation of HIF-mediated transcription (Supplemental Table 3) (1% O2, 11.5%; DFO, 2.5%; AQ, 10.5%). Thus, only a small proportion of genes with predicted REST-binding sites were linked to suppression of HIF-adaptations. In other cells, REST linked to cytoprotection. In neurons, REST is protective (Bray et al., 2020) and it represses genes associated with cell death (Lu et al., 2014; Noh et al., 2012), under conditions of hypoxia and/or oxidative stress. In astrocytes, loss of REST is detrimental. Astrocyte-specific conditional knockdown of REST augments pro-inflammatory cellular responses (Li et al., 2020). The role of REST in SCs has not previously been studied; however, when we examined the genes repressed in response to the treatments, pro-apoptotic proteins were identified. Bax, was repressed in 1% O2- and DFO-SCs and Casp1 was repressed in AQ-SCs (Supplemental Table 3). Given its protective role in other cells, specific manipulation of REST in SCs could be useful—not only for understanding its role in cellular hypoxia responses, but also for determining its impact on SC cytoprotection in the context of transplantation and PNS injury and disease. (Cavadas et al., 2016; Chen et al., 1998; Li et al. 2020).
3.6 |. Differences exist in the adaptive response of SCs induced by exposure to low O2, DFO, or AQ
Although the majority of the hypoxia-related gene expression changes in response to treatment were similar between the three conditions, a proportion of transcripts were either differentially expressed (Figure 3 (a,b,e)) or the magnitude of induction/repression in response to treatment differed (Figure 3(c–e)). To gain insight into the treatment-specific differences, the expression of the hypoxia-related transcripts was directly compared between DFO SCs and hypoxia SCs (dSC: hSCs); AQ SCs and hypoxia SCs (aSC:hSC); and AQ SCs and DFO SCs (aSC:dSC). This direct comparison identified a limited number of treatment-specific changes in mRNA expression (Supplemental Table 4). Only 3.5% (3/85) of mRNAs differed significantly between aSC:dSC, demonstrating that the profile of mRNAs altered by the two pharmacological hypoxia-mimetics was quite similar. The similarity in the gene expression changes between DFO, which targets Fe2+, a co-factor for the HIF-PHDs, and AQ, which binds directly to the HIF-PHDs, suggests that the bulk of DFO’s effects on hypoxia-related gene expression in SCs is through the HIF-PHDs. 14.1% (12/85) and 22.4% (19/85) of mRNAs differed significantly for dSC:hSC and aSC: hSC, respectively, revealing that the molecular response of SCs to DFO was more similar to hypoxia than the molecular response of SCs to AQ. The greater similarity between DFO and 1% O2 treatments than AQ and 1% O2 treatments indicates that not all of the expression changes in SCs exposed to 1% O2 and DFO are regulated via altered HIF-PHD activity. Overall, the limited number of treatment-specific differences identified established that the majority of the hypoxia related changes were similar between SCs exposed to hypoxia and pharmacological hypoxia-mimetics. The identification of treatment specific differences, does, however, demonstrate that pharmacological targeting of HIF-PHDs does not fully mimic the changes induced by exposure of SCs to 1% O2.
In an effort to understand the potential functional effects of the limited number of differences identified, network analysis was performed on the hypoxia-related mRNAs and cluster activity in response to treatment was assessed. Five functional clusters were identified with unique roles ranging from metabolic activities to regulatory roles (Figure 5). Clusters 1 and 2 are composed of genes involved in transcription and developmental regulation, whereas Clusters 4 and 5 are more focused on sensing the environment and cell signaling. Examination of cluster activity, which reflects both the magnitude of gene expression change and the relatedness of the mRNA, revealed that the directional alterations in cluster activity in SCs exposed to DFO were similar to those induced by hypoxia (Figure 5). This supported the earlier finding that the molecular and functional effects of DFO were broadly similar to those induced by hypoxia. One notable difference was that DFO induced greater changes in genes associated with transcription and cellular regulation (Cluster 1) than hypoxia. This suggests that although the effect of DFO resemble those induced by hypoxia, DFO may have broader transcriptional effects, possibly due to differences in the level of inhibition in oxygenase activity induced by the two treatments, as reflected in the differences in the nuclear levels of HIF-1α achieved. Cluster analysis revealed that AQ treatment had broader functional effects than either hypoxia or DFO. AQ treatment resulted in an even greater induction of the genes in Cluster 1 than DFO. It also resulted in greater induction of the mRNAs in Cluster 2, greater repression of Cluster 4, and repression rather than induction of Clusters 3 and 5. Together, these changes indicate that AQ induced changes in gene expression are associated with broader functional effects than either hypoxia or DFO. Based on the changes in cluster activity, AQ induces changes in gene expression associated with alterations in both intrinsic (i.e., transcription, developmental state) and extrinsic (i.e., cellular signaling) cellular responses. These changes, particularly the shifts in expression for Cluster 1, which contains many HIF family members and regulators, and Clusters 4 and 5, which contain many of the HIF-target genes, may reflect the enhanced specificity of AQ for the HIF-PHDs and possibly enhanced repression of hypoxic adaptations in response to prolonged AQ exposure.
FIGURE 5.
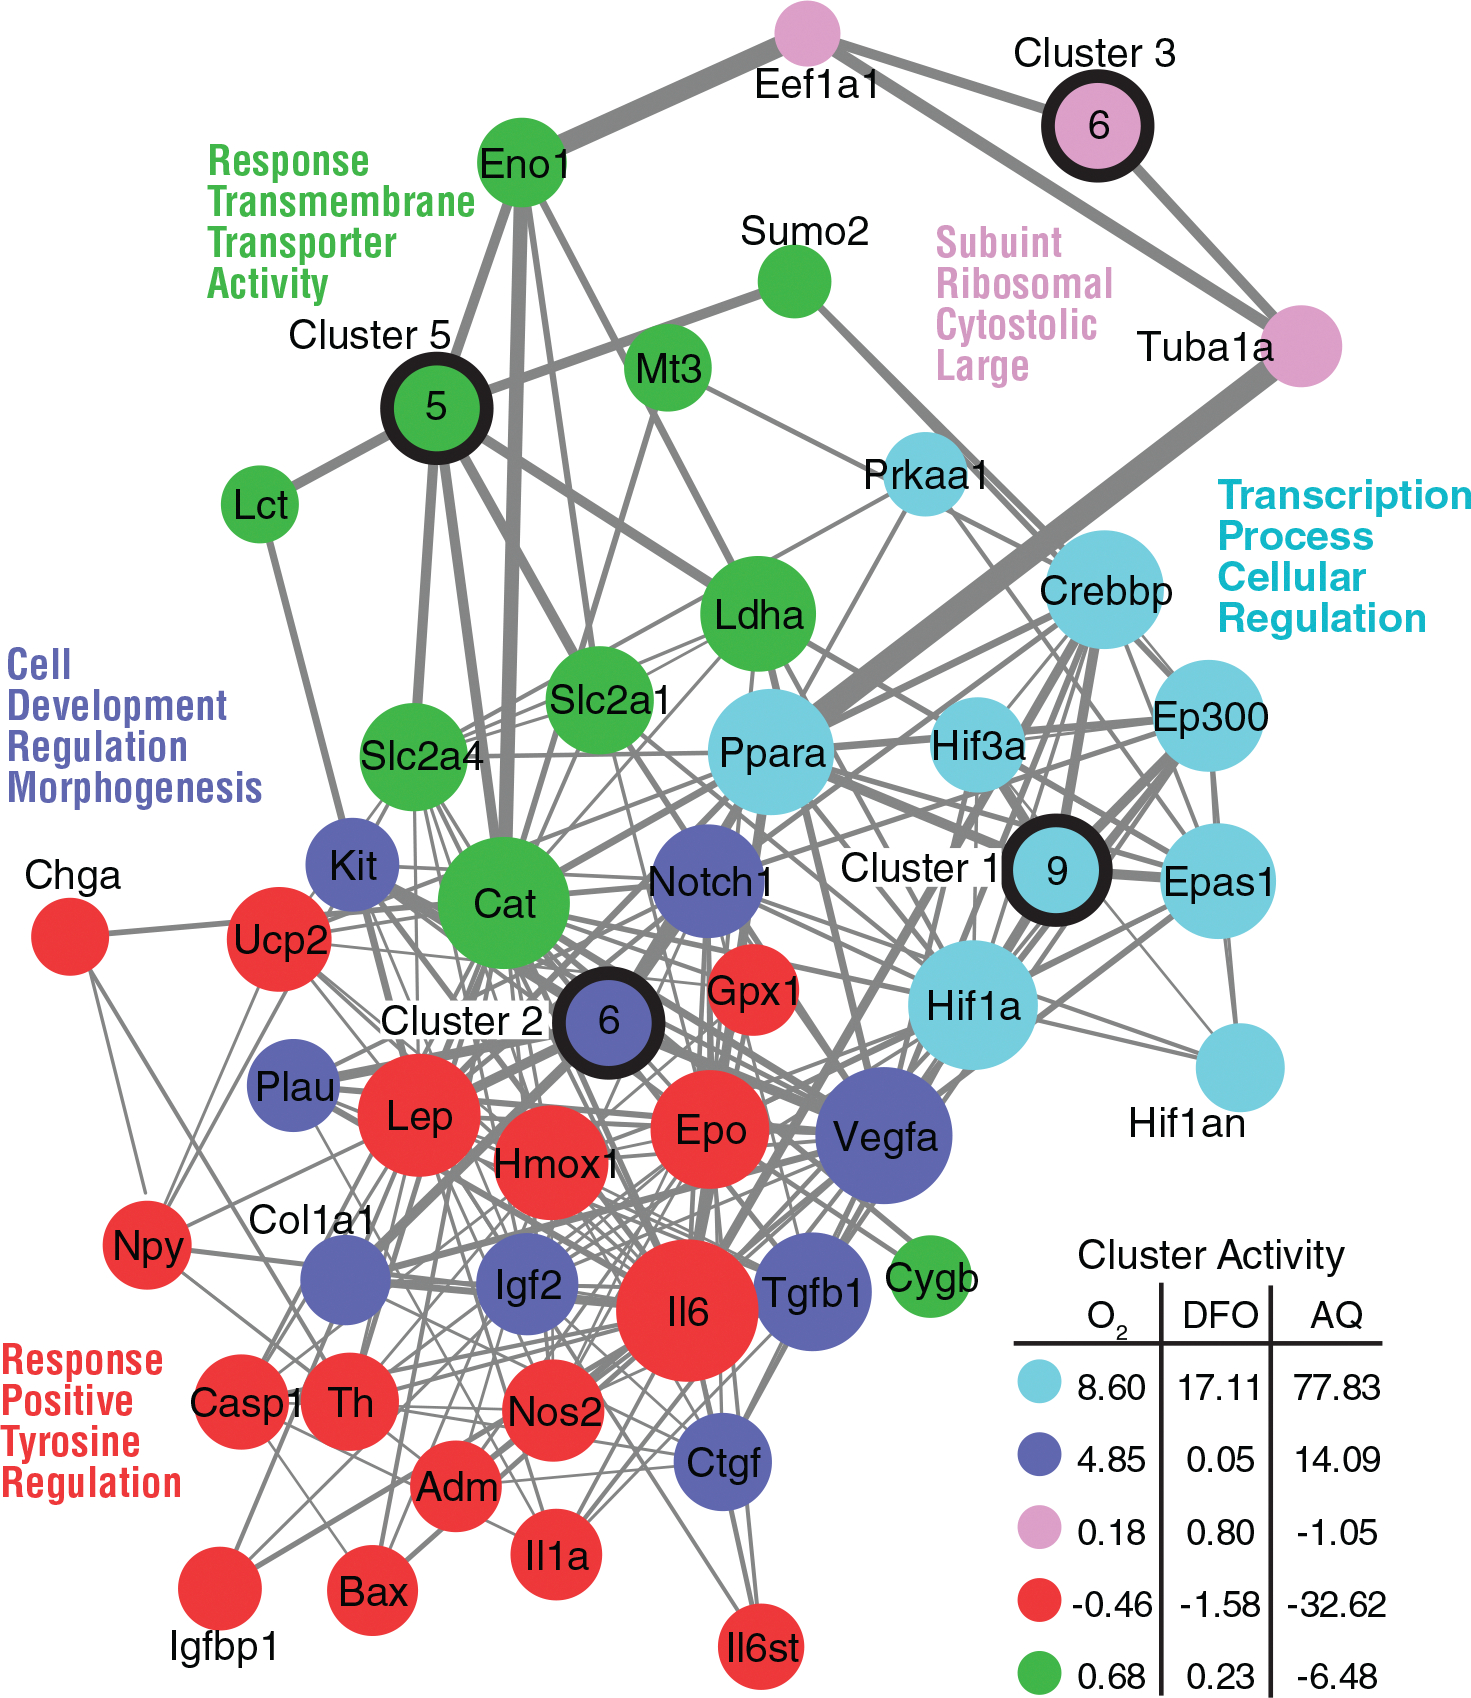
Using StringDB, a network was generated composed of the 85 hypoxia-related mRNAs examined. Five clusters were identified with the GLay algorithm and using the wordcloud app in Cytoscape, we identified key words from Gene Ontology terms associated with each gene in the clusters. A cluster activity score was calculated for each cluster with a higher positive number representing higher activity and a negative number representing suppressed cluster activity. Gene names are provided for the genes with more than one neighbor in the network. Genes with only one neighbor in each cluster were collapsed into a single node with a number indicating the number of genes in the node. Line thickness reflects strength of the edge from StringDB. Different colors represent the different clusters
As the functional analysis of the hypoxia-related mRNAs indicated that the hypoxia-mimetics differed from hypoxia in terms of transcriptional regulation, we identified the transcription factors predicted to bind to the DNA upstream of the hypoxia-related genes altered between the treatments. Using TRANSFAC analysis, several transcription factors were identified (Figure 4(b,c), Supplemental Table 5). Nine transcription factors were identified that are predicted to bind upstream of the genes whose expression was significantly altered with DFO treatment compared to hypoxia. Twelve transcription factors were identified for AQ. Only one transcription factor, LRF, was identified for the mRNAs that differed significantly between DFO and AQ. Interestingly, LRF is linked to preventing the binding of CBP/p300 to transcriptional complexes (Yang et al., 2015). CPB/p300 complexes with HIF for transcription of HIF target genes (Arany et al., 1996). Thus, the identification of LRF could reflect a difference in the level of HIF-mediated transcription, or the induction of negative feedback loops to suppress HIF-mediated transcription in response to the two treatments. Together, the comparisons between the treatments supports the results of the functional analysis that indicate that the hypoxia-mimetics differ from hypoxia in terms of transcriptional regulation and that AQ treatment is associated with greater transcriptional changes than either hypoxia or DFO.
Examination of the transcription factors associated with the genes with significantly altered expression in response to hypoxia-mimetics relative to hypoxia (dSCs:hSCs; aSCs:hSCs) identified three transcription factors that were shared between DFO and AQ treated SCs (Figure 4(c), Supplemental Table 5). The remaining transcription factors identified were exclusive to either DFO or AQ treatment (Figure 4(c), Supplemental Table 5). HIF-2α, REST, and SREBP-2 were identified as transcription factors expressed in cultured SCs and unique to the expression differences found with DFO treatment (dSCs:hSCs). NURR1, Sp1, and ETF were similarly identified for AQ treatment (aSCs:hSCs). This analysis suggests that although low O2, DFO and AQ all alter the activity of the HIF-PHDs, some unique transcriptional programs are induced in response to each treatment.
Overall, targeting the HIF-PHDs with the two pharmacological hypoxia-mimetics induced broadly similar changes in hypoxia-related gene expression in SCs. The changes in response to the hypoxia-mimetics, resembled, but were not identical to, the changes observed following direct exposure of SCs to hypoxia. Of the two hypoxia-mimetics, DFO induced changes in hypoxia-related mRNAs that were more similar to changes that occurred following hypoxia. In contrast, changes in hypoxia-related gene expression induced by exposure of SCs to AQ were broader than those that occurred with either hypoxia or DFO.
3.7 |. Exposure to hypoxia-mimetics, but not hypoxia, protects SCs from H2O2-mediated cell death in vitro
In SCs, forced expression of HIF-1α protects against cytotoxic cell death, especially H2O2-mediated oxidative stress (David et al., 2020). In other cell types, exposure of cells to hypoxia or hypoxia-mimetics also leads to cytoprotection (Hamrick et al., 2005; Siddiq et al., 2009; Theus et al., 2008). To test whether hypoxia or pharmacological hypoxic preconditioning was sufficient to protect SCs against oxidative stress, SCs were exposed to 1% O2 (24 h), DFO (24 h) or AQ (16 h) prior to oxidative stress induced by application of H2O2 (0–1000 μM). Cell survival was assessed via MTS assay after either 3 or 24 h of exposure to H2O2. In a separate experiment, the number of dead and live cells was quantified using NucDead-488 and NucLive-647 staining after 3 h of H2O2 exposure.
In contrast to previous reports showing beneficial results of either hypoxic preconditioning in other cells (Theus et al., 2008; Wakai et al., 2016; Yu et al., 2013) or forced-expression of HIF-1α in SCs (David et al., 2020), hypoxic preconditioning failed to protect SCs against H2O2-mediated cell death (Figure 6(a,b); Figure 7(a–c)). Fewer SCs survived following hypoxic preconditioning than under normoxia at the LD50 for H2O2 in experiments where survival was assessed by the MTS assay (Figure 6(a,b); LD50 survival at 3 h: control, 53.4 ± 7.20%, 1% O2, 38.2 ± 3.78%; LD50 survival at 24 h: control, 66.6 ± 19.7%, 1% O2 44.2 ± 26.4%). This was confirmed by live/dead staining (Figure 7(b,c); Supplemental Figure 1). SCs preconditioned with 1% O2 and then subsequently exposed to the LD50 dose of H2O2 contain significantly more dead cells and significantly fewer live cells than control SC cultures. Phase images (Figure 7 (a)) further show that hypoxic preconditioning by exposure of SCs to low oxygen does not result in SC cytoprotection. Although we detected very few dead cells in 1% O2-preconditioned SC cultures that were not exposed to oxidative stress (Figure 7(b)), reperfusion injury can augment cultured SC death (Zhu et al., 2008; Zhu et al., 2010). Therefore, we tested whether postconditioning might prevent this death and lead to enhanced protection. Compared to preconditioning alone, more SCs survived in the control condition when the assays were performed without reexposing the cells to normoxia (102.7 vs. 71.9% for control SCs at the LD50). Even under these conditions, however, exposure of SCs to 1% O2 failed to protect them against oxidative-stress-induced cell death (Figure 6(c,d)), as indicated by the similar number of SCs that survived in treated versus control conditions at the LD50 following acute (control: 67.0 ± 8.52%; 1% O2: 68.8 ± 12.40%) or prolonged hypoxia exposure (control: 69.1 ± 7.66%; 1% O2: 42.2 ± 12.1%). These results demonstrate that exposure to hypoxia and the concomitant induction of hypoxia-related gene expression is not sufficient to protect SCs against oxidative stress.
FIGURE 6.
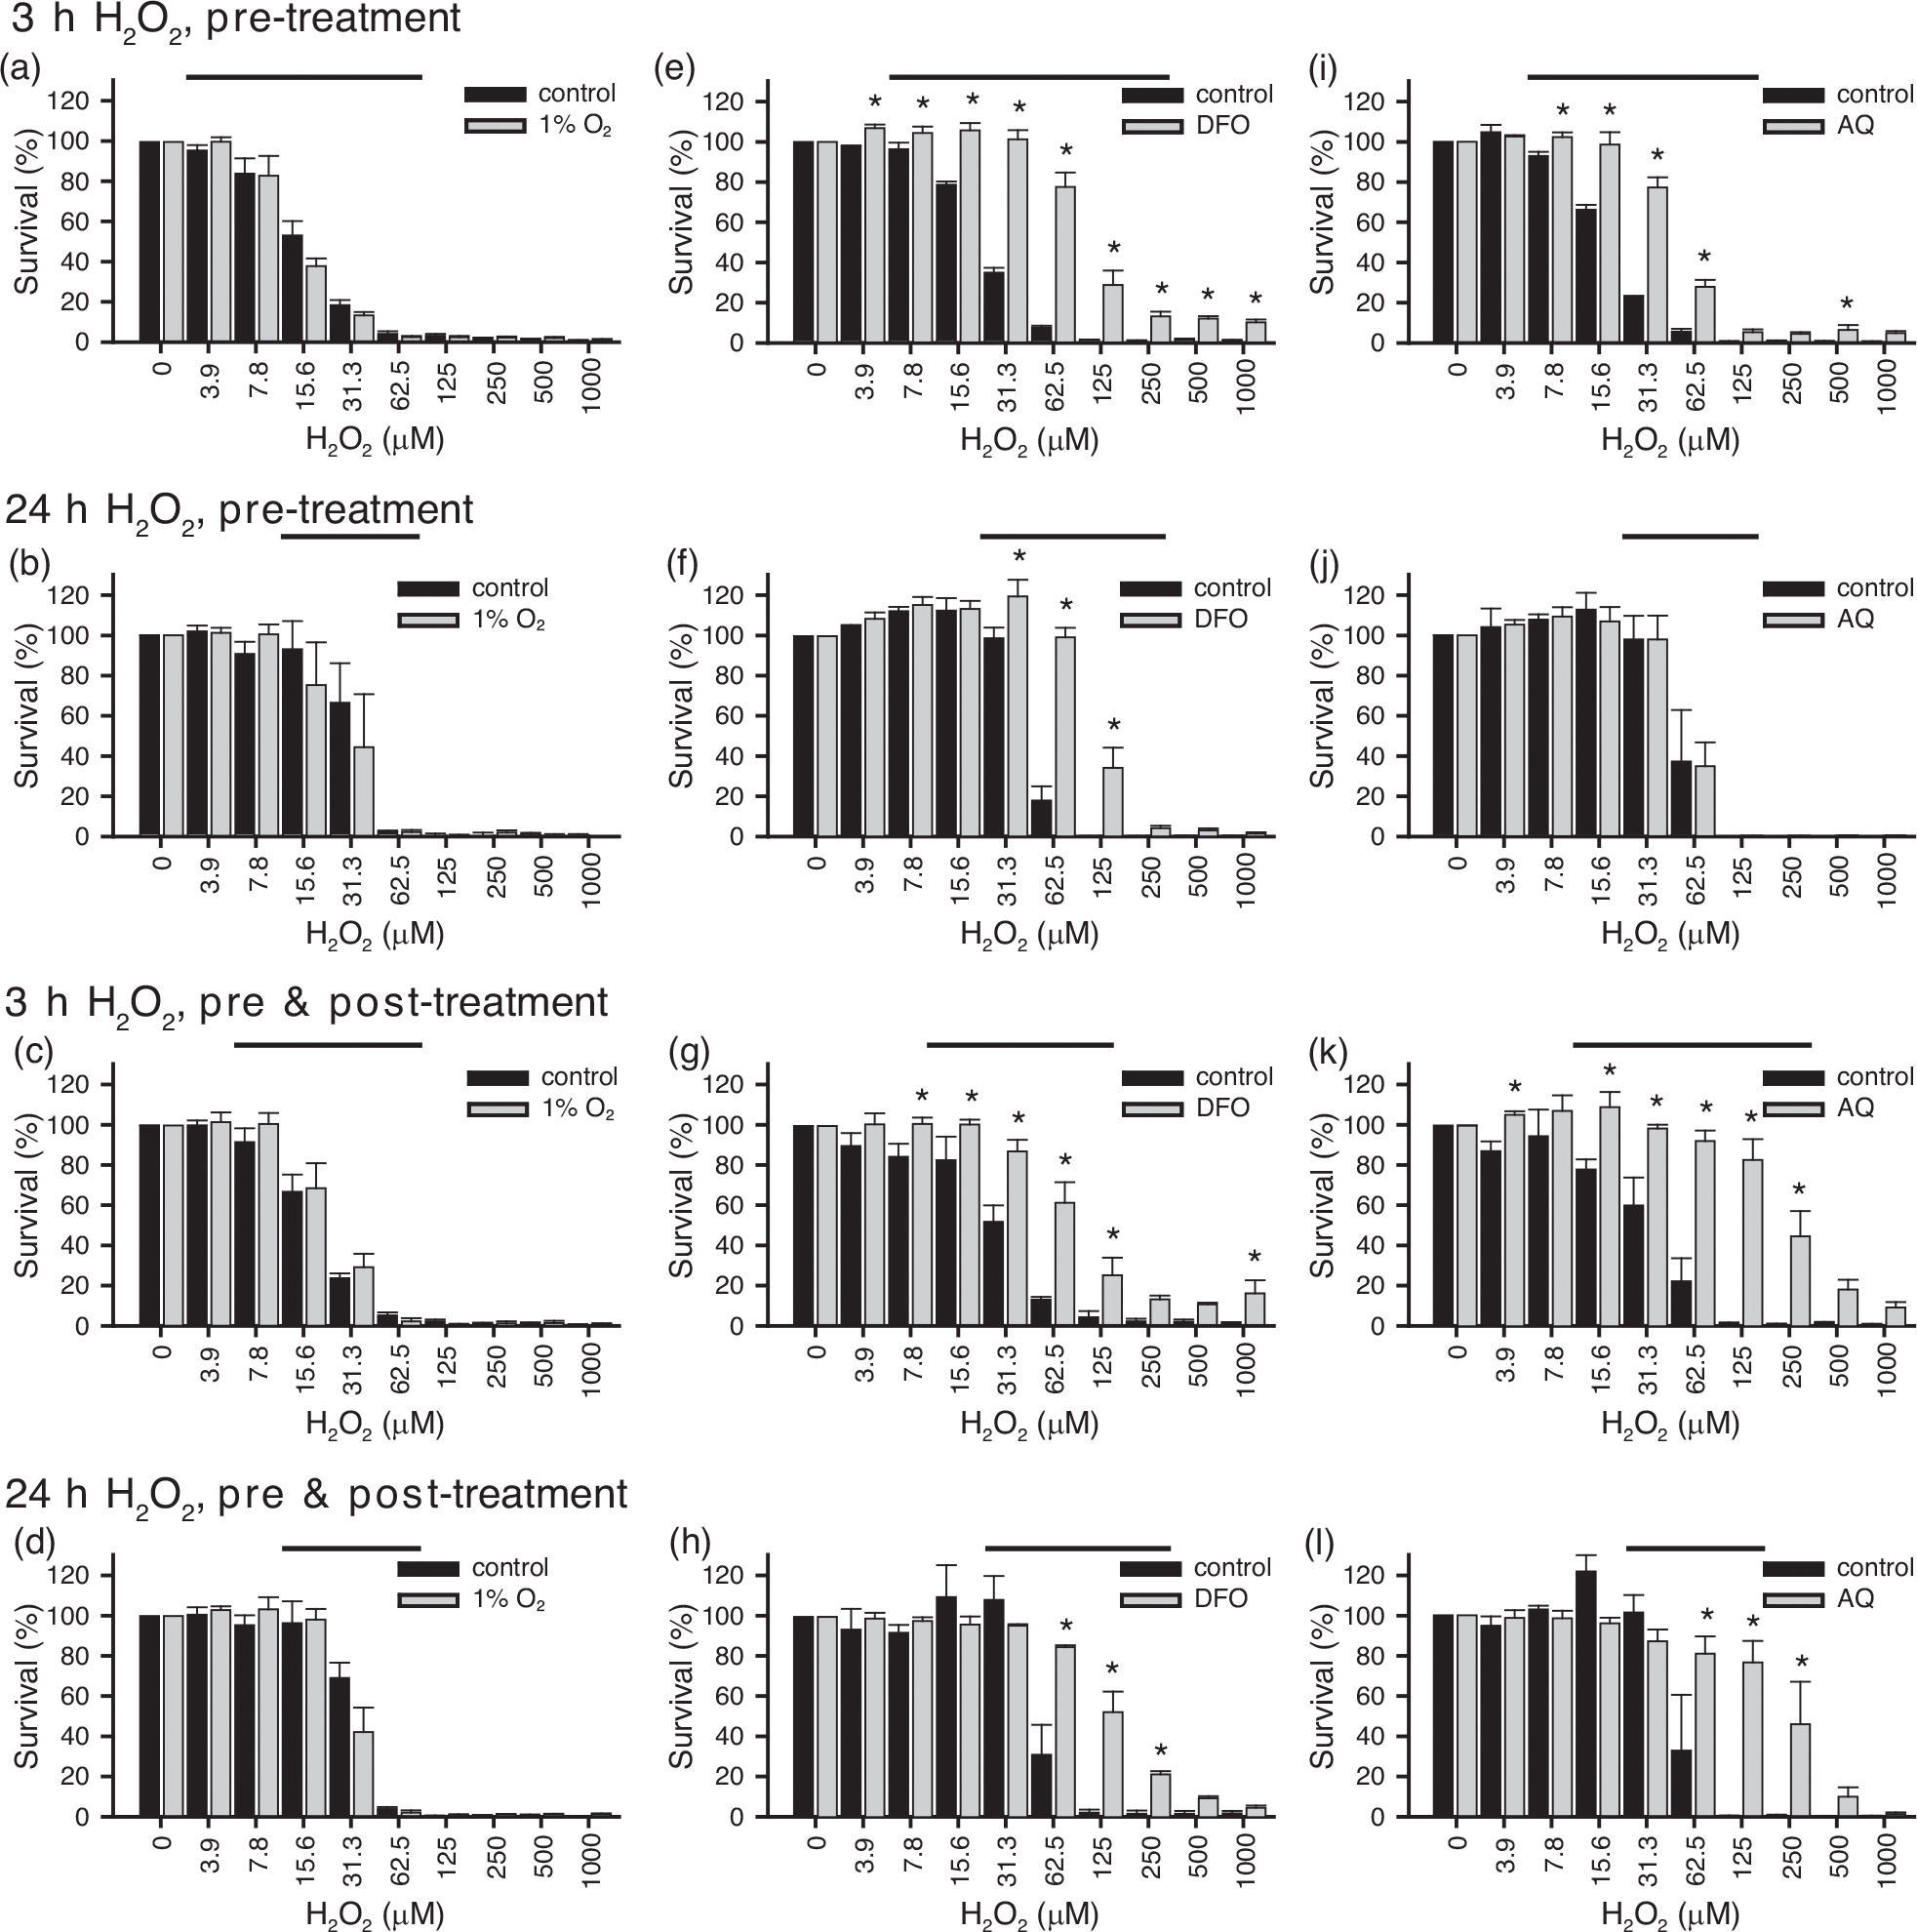
Response of Schwann cells (SCs) preconditioned with hypoxia (1% O2, 24 h) or hypoxia-mimetics (deferoxamine [DFO], 200 μM, 24 h; adaptaquin (AQ), 10 μM, 16 h) and then exposed to H2O2 for either 3 h (a,c,e,g,i,k) or 24 h (b,d,f,h,j,l) with or without the addition of postconditioning treatment. Hypoxic preconditioning failed to protect SCs against H2O2-mediated cell death at either 3 h (a) or 24 h (b) (3 h: F(40, 1) = 1.24, p = .272, power = 0.193; 24 h: F(40, 1) = 0.508, p = .490, power = 0.107). The addition of hypoxic postconditioning did not prevent oxidative-stress-induced cell death in response to either 3 h (c) or 24 h (d) of exposure to H2O2 (3 h: F(40, 1) = 0.472, p = .496, power = 0.103; 24 h: F(40, 1) = 0.384, p = .539, power = 0.093). Preconditioning with DFO protected SCs against H2O2-mediated cell death at 3 h (e), and 24 h (f) (3 h: F(40,1) = 321.9, p = 9.80e−21, power = 1.000, post hoc, 3.9–1000 μM, p < .05; 24 h: F(40,1) = 64.26, p = 7.51e−10, power = 1.000, post hoc, 31.3–125 μM, p < .05). Protection was also observed when DFO was included along with the administration of H2O2 at both 3 h (g) and 24 h (h) (3 h: F(40, 1) = 55.31, p = 5.15e−35, power = 1.000, post hoc, 7.8–125 μM, 1000 μM, p < .05; 24 h: F(40, 1) = 15.9, p = 2.72 e−4, power = 0.974, post hoc, 62.5–250 μM, p < .05). Similar to DFO, AQ enhanced the survival of SCs exposed to oxidative stress for 3 h ((i) F(40,1) = 155.9, p = 2.21e−15, power = 1.000, post hoc, 7.8–62.5 μM, 500 μM, p < .05). Unlike DFO, preconditioning with AQ did not lead to long-term protection ((j), 24 h: F(40,1) = 0.005, p = .946, power = 0.051). The addition of postconditioning enhanced the protection achieved with AQ at 3 h ((k) F(40, 1) = 103.2, p = 1.22e−12, power = 1.000, post hoc, 3.9, 15.6–250 μM, p < .05). It also induced protection at 24 h ((l) F(40, 1) = 11.8, p = .001, power = 0.919, post hoc, 16.6, 62.5–250 μM, p < .05). Multivariate ANOVAs with one-tailed Fisher’s LSD post hoc tests. Bar, H2O2 concentrations for which survival significantly differs from the preceding concentration. *, significantly different (p ≤ .05) between groups. Experiments were repeated three to four times, with three to four technical replicates each time, per condition, per time point. n = 3–4
FIGURE 7.
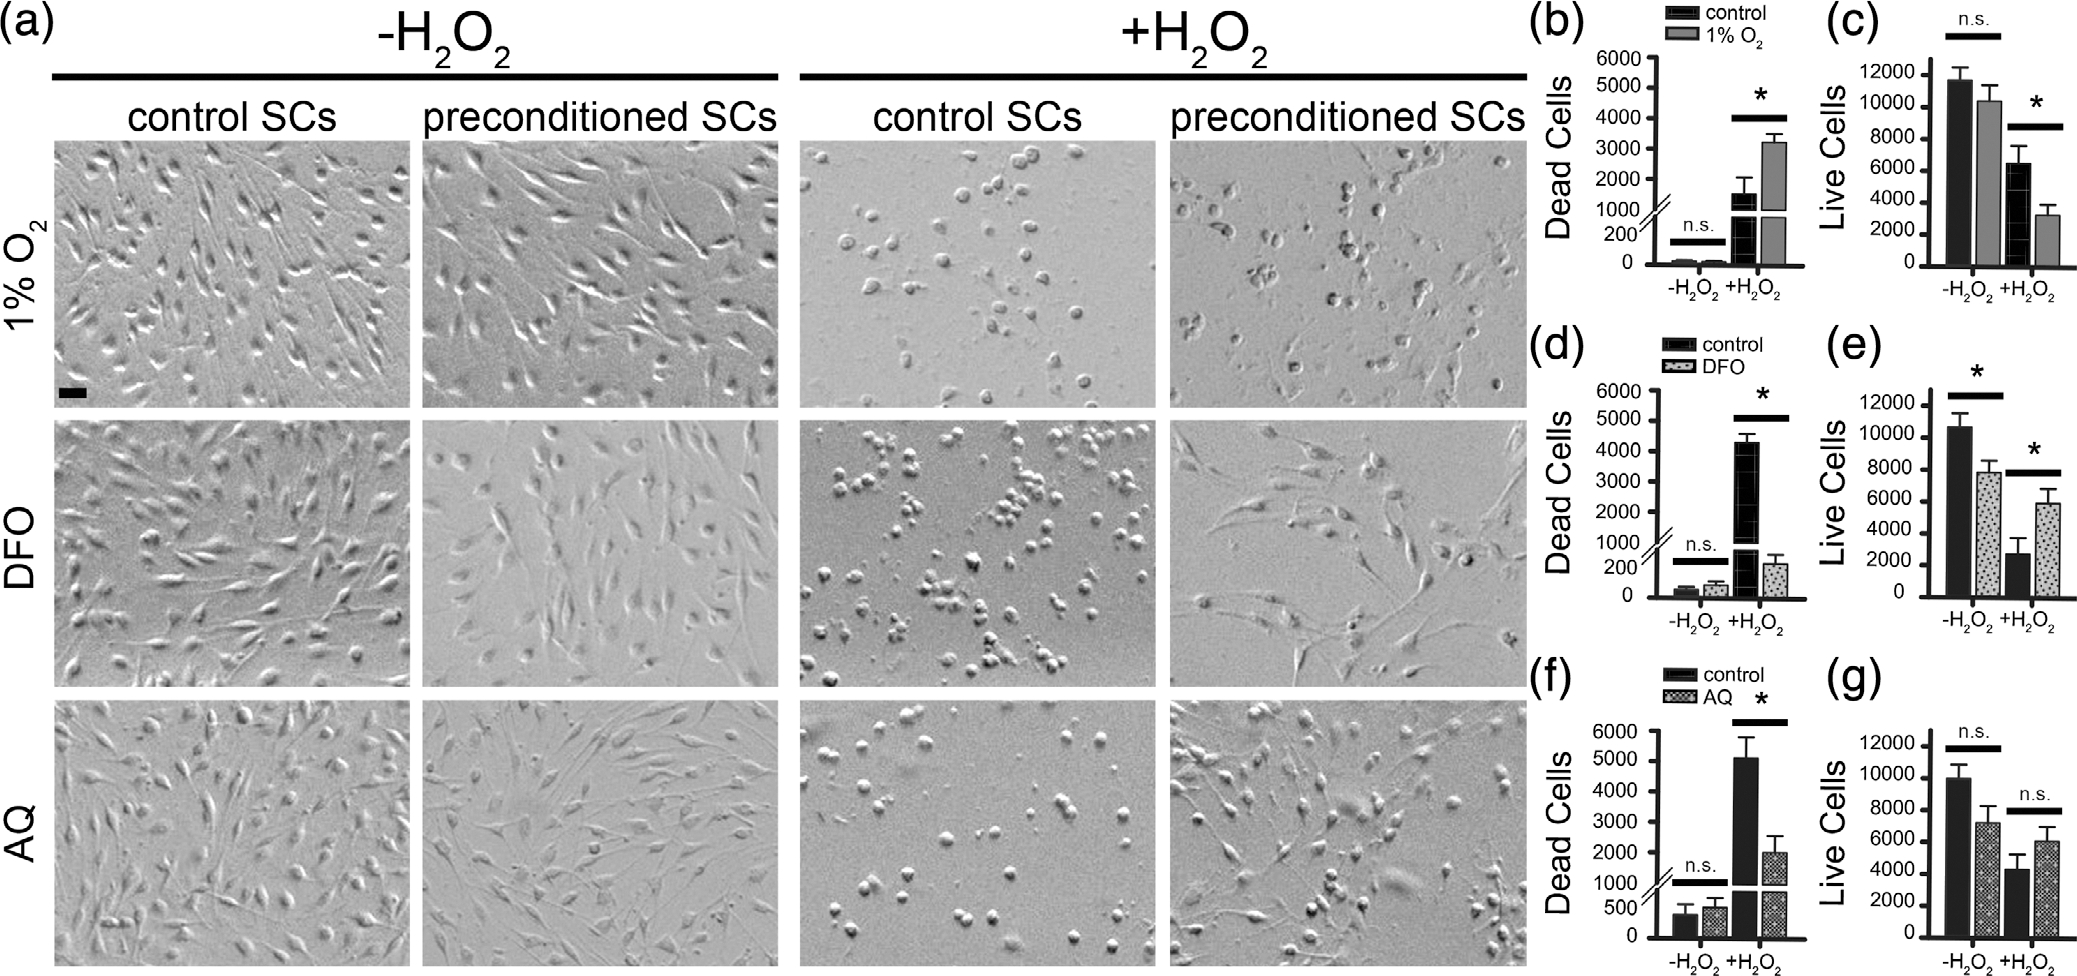
Appearance and quantification of dead and live Schwann cells (SCs) in response to preconditioning with hypoxia or hypoxia-mimetics, with and without H2O2 exposure. SCs were preconditioned with hypoxia (1% O2, 24 h) or hypoxia-mimetics (deferoxamine [DFO], 200 μM, 24 h; adaptaquin [AQ], 10 μM, 16 h), exposed to the LD50 dose of H2O2 for 3 h and then stained (dead, NucGreen-488-positive; live, NucRed-647-positive). Preconditioned SCs had a similar morphology to control SCs in response to all three preconditioning treatments ((a) H2O2). There was no morphological evidence that the preconditioning treatments were toxic to the SCs (a). A small number of dead SCs were quantified in the preconditioned SCs not exposed to oxidative stress (b,d,f) and the number did not differ between preconditioned and control SC cultures ((b,d,f), post hoc, n.s., p > .05). Fewer live SCs were quantified in wells exposed to preconditioning treatments than untreated control SCs ((c,e,g)). The reduction was significant for DFO-SCs ((e) DFO-SCs, post hoc, t = 2.430, p = .024), showed a trend for AQ-SCs ((g) AQ-SCs, post hoc, t = 2.013, p = .064) and was not statistically significant for 1% O2-SCs ((c) 1% O2-SCs, post hoc, t = 1.009, p = .324). After exposure to oxidative stress, control SCs had a spherical morphology and lacked their distinctive elongated processes ((a), +H2O2). In response to exposure to H2O2, 1% O2-SCs showed a similar spherical morphology ((a), +H2O2). In contrast, DFO-SC and AQ-SC cultures contained fewer spherical cells and more elongated SCs following exposure to H2O2 ((a), +H2O2). Significantly more dead cells ((b), post hoc, t =2.767, p = .019) and fewer live cells ((c), post hoc, t = 2.531, p = .02) were quantified in 1% O2-treated SC cultures than in normoxic controls. Significantly fewer dead SCs ((d), t = 14.498, p = 9.4e−5) and more live SCs ((e), t =2.322, p = .03) were found in DFO-preconditioned SC cultures following exposure to H2O2. Significantly fewer dead cells were found in AQ-preconditioned cultures following exposure to H2O2 ((f), post hoc, t = 3.158, p = .002), but no difference in the number of live cells was detected ((g), t =1.361, p = .195). Statistics: multivariate ANOVAs followed by post hoc two-tailed t-tests, corrected for unequal variance where appropriate based on Levene’s test for equality of variances. LD50 was use for H2O2 concentrations: 1% O2, 31.25 μM; DFO and AQ: 62.5 μM. Scale, 10 μm. *, significantly different (p ≤ .05) between groups. n.s., not significant. Experiments contain 7–12 wells from 2 to 3 independent experimental replicates. n = 7–12
In contrast to exposure to hypoxia, application of pharmacological hypoxic-mimetics was sufficient to protect SCs against H2O2 induced cell death (Figures 6(e,f,i,j) and 7(a,d–g)). Preconditioning of SCs with either DFO or AQ enhanced cytoprotection when exposed to acute (3 h) oxidative stress (Figures 6(e,i) and 7(a,d–g)). DFO preconditioning was more broadly protective than preconditioning with AQ. DFO enhanced SC survival across nine H2O2 concentrations (Figure 6(e)), whereas AQ preconditioning enhanced SC survival across five concentrations (Figure 6(i)). This was supported by the live/dead cell counts following 3 h of H2O2 exposure, which showed that DFO resulted in a greater reduction in the number of dead cells than AQ (Figure 7(d,f)) and that DFO, but not AQ, significantly increased the number of live cells (Figure 7(e,g)). Additionally, in response to prolonged exposure to oxidative stress (24 h), only DFO preconditioning led to protection (Figure 6(f,j)). Thus, of the three approaches used to induce hypoxia-related cellular adaptations, preconditioning with DFO provided the greatest protection. Inclusion of the pharmacological hypoxia-mimetics along with the addition of H2O2 (preconditioning and postconditioning) (Figure 6(g,h,k,l)), was able to increase the protective effects of AQ. The addition of postconditioning increased both the range of H2O2 concentration over which AQ induced protection and extended the window of protection from 3 to 24 h (Figure 6(k,l)).
The hypoxia-mimetic treatments did not alter SC morphology. SCs exposed to DFO or AQ resembled control SCs in size and shape (Figure 7(a)). The hypoxia-mimetics did not appear toxic to SCs, as the number of dead cells in cultures that were not exposed to oxidative stress was low and did not differ between control SCs and SCs exposed to DFO or AQ (Figure 7(d,f)). There were, however, fewer live SCs quantified in the wells exposed to preconditioning treatments than untreated control SCs (Figure 7(c,e,g)). This may reflect treatment-specific effects on SC proliferation, which were not specifically examined.
4 |. DISCUSSION
SCs promote recovery when grafted into the injured spinal cord and they have advanced to human clinical testing as a therapy for SCI (Anderson et al., 2017; Bunge et al., 2017; Tetzlaff et al., 2011). One limitation of SC transplants, and cell transplants in general, is the acute death of the transplanted cells that occurs immediately following transplantation (David et al., 2020; Hill et al., 2006; Hill et al., 2007). After the initial phase of acute death, where necrosis predominates, the remaining cells integrate into the host tissue and persist long term (David et al., 2020; Hill et al., 2006; Hill et al., 2007). Better transplanted cell survival is associated with enhanced functional recovery following SCI (Kadoya et al., 2016; Lu et al., 2012; Marquardt et al., 2020), but current approaches require inclusion of the interventions along with the transplanted cells. This may make their implementation into current clinical paradigms more difficult. An alternative approach to improving transplant survival is to harness temporary adaptive cellular responses. In the current study, we demonstrate that both hypoxia and pharmacological hypoxia-mimetics induce hypoxia-related gene expression changes in SCs, but that only exposure to the pharmacological hypoxia-mimetics protects against oxidative stress-induced cell death. Additionally, of the two pharmacological hypoxia-mimetics tested, DFO was more effective than AQ when applied as a preconditioning treatment. As development of a pretreatment approach that leads to significant cytoprotection would not only be more easily adaptable to the generation of clinical-grade protocols for protecting transplanted cells, these experiments support the in vivo testing of DFO to assess whether the changes induced with pharmacological hypoxic preconditioning are sufficient to elicit enhanced transplanted SC survival. In addition to their impact on SC survival, the adaptive programs induced in response to the pharmacological hypoxia-mimetics are linked to axonal support and protection by SCs following PNS injury (Babetto et al., 2020; Keswani et al., 2011). Thus, while direct testing is still needed, the utility of pharmacological induction of hypoxic adaptations in SCs is unlikely to be restricted to preconditioning of transplanted cells.
In the current study, we establish the dosing duration necessary to induce adaptive hypoxic pathways in SCs following exposure to 1% O2 or pharmacological hypoxia-mimetics, DFO, and AQ. Using Western blotting and qPCR, we demonstrate that all three interventions increased nuclear levels of HIF-1α, and that pharmacological hypoxia-mimetics alter the expression of hypoxia-related genes in SCs in a broadly similar fashion as occurs with direct exposure to hypoxia. Despite their similarity in inducing hypoxia-related gene expression, these treatments substantially differed in their ability to protect SCs against H2O2-induced oxidative stress. Pharmacological targeting of the PHDs provided superior cell protection. Moreover, at some H2O2 concentrations, the mimetics completely prevented oxidative stress-induced cell death. Together, these results suggest that pharmacological pretreatment of SCs with PHD inhibitors will be more effective at counteracting transplanted cell death. Moreover, the use of pharmacological agents, such as DFO or AQ, can be readily incorporated into transplantation protocols.
The potential benefits of inducing hypoxic adaptations using the interventions tested here are not restricted to their use in preconditioning of cellular transplants. Enhanced glycolytic activity (Babetto et al., 2020) and induction of Epo (Keswani et al., 2011) are both linked to enhanced axon protection by SCs. The ability of the HIF-PHD inhibitors to enhance hypoxia-related target genes in SCs, including genes for glycolytic enzymes (e.g., Eno1, LDHA, HK2, Gpi) and Epo, may therefore make them useful pharmacological tools for protecting axons following injury or neuropathies. In mouse models of intracerebral hemorrhage and Parkinson’s disease, pharmacological targeting of PHDs protects against cell death and reduces neurological dysfunction (Aime et al., 2020; Karuppagounder et al., 2016). Although further work is required to understand the cellular effects of targeting HIF-PHDs on other neurological diseases, particularly those associated with glial cell biology and their metabolic functions, current evidence suggests that doing so, via pharmacological agents such as used here, could also be an effective approach for tissue protection in a of variety neurological injuries and diseases.
Several experimental factors may have led to the failure of hypoxic preconditioning to protect SCs against oxidative stress. These include the nuclear levels of HIF-1α, which were lower in previous studies where HIF-1α is linked to cytoprotection (David et al., 2020; Theus et al., 2008; Wakai et al., 2016) and lower than the levels achieved in SCs treated with DFO or AQ. The effective induction of expression of HIF-target genes (including Vegfa that has a half-life of 1 h (Levy et al., 1996)), however, supports our ability to induce HIF-mediated transcription in SCs with the hypoxia protocol. The low nuclear level of HIF-1α is SCs exposed to hypoxia in this study most likely reflects the method used to collect the SCs, which includes steps at normoxia as would occur during processing of cells for transplantation (Dai & Hill, 2018) that leads to the rapid degradation of HIF-1α. It is also possible that the duration of exposure to 1% O2 led to the induction of REST-mediated repression of HIF-mediated adaptations that altered their ability to survive (Cavadas et al., 2015; Cavadas et al., 2016). A second factor is reperfusion injury upon reoxygenation. Reperfusion injury can reduce SC survival (Zhu et al., 2010), but this is unlikely to be the mechanism, as elimination of reperfusion injury by performing the assays under hypoxia failed to protect SCs. Finally, the preconditioning protocol employed could have influenced the SC survival. How cells are preconditioned affects the efficacy of preconditioning (Hess et al., 2019; Zhou et al., 1996). In this study, we used prolonged hypoxia exposure that is effective for stem cells (Theus et al., 2008; Wakai et al., 2016) and, if effective, would have been feasible to implement into preclinical and clinical transplantation paradigms. Repeated rounds of hypoxia-reperfusion or less severe hypoxia (i.e., 2–5% O2) may be needed to elicit hypoxiamediated cytoprotection of SCs.
The complex adaptive program induced by hypoxia is only partially understood. Moreover, the transcription response to hypoxia differs by cell type (Chi et al., 2006). In SCs, where few studies have examined the effects of hypoxia, it is poorly delineated. Using direct identification of known HRE-dependent genes and computational analysis of potential transcriptional factor binding sites, we show that exposure of SCs to hypoxia and the hypoxia-mimetics induced both HIF-dependent and HIF-independent changes in gene expression. All three treatments effectively enhanced the expression of HRE-responsive genes. However, transcription factor binding site analyses identified several additional transcription factors that co-regulate the gene expression changes induced by the treatments. This analysis expands the regulatory network controlling these genes beyond HIF-1α. These additional transcription factors include the E2F family, AP-2, Elf-1, KLF family, ETF, and REST. Several of these transcription factors are implicated in SC lineage development, maturation, and myelination (e.g., ETF, REST, and AP-2) (Aoki & Kunisada, 2016; Brown & Lemke, 1997; Grove et al., 2017; Stewart et al., 2001). Further work to understand these transcriptional regulators in SCs may not only provide insight for enhancing transplanted SC survival, but could also provide insight into the cellular reprogramming that occurs in SCs as part of their response to injury.
Overall, the changes in hypoxia-related gene expression were similar between the treatments; however, the hypoxia-mimetics induced several gene expression changes that were distinct from those that occurred following exposure to hypoxia. These mRNA expression differences primarily arose from downregulation of transcripts normally expressed in SCs, although lower levels of some of the mRNAs induced by hypoxia were also found in response to exposure to the hypoxia-mimetics. These differentially expressed genes represent a minority of the overall mRNA changes, but their differences could explain the treatment specific differences in cytoprotection between SCs exposed to hypoxia and those exposed to the hypoxia-mimetics. Several transcription factors were identified to be associated with the differentially expressed genes. These included transcription factors identified to be shared between the treatments (i.e., AHR, E2F family [in particular E2F-3], ZF5 [Zbtb14], AP-2, REST, and ETF), as well as several additional transcription factors (i.e., HIF2A, SREBP-2, SP1, LKLF, PUR1, NURR1, and DEC1 [Bhlhe40]).
One notable transcription factor, whose binding is predicted to differ between the treatments, is HIF-2α. HIF-2α binding sites were associated with hypoxia-related genes with lower expression following DFO treatment relative to hypoxia. Similar to HIF-1α, HIF-2α is regulated by the HIF-PHDs and binds to the HRE, which is shared between HIF family members (Mole et al., 2009). In several injury models, loss of HIF-2α exacerbates injury (Kapitsinou et al., 2014; Kerber et al., 2020). Thus, it is possible that some of the changes in HRE-mediated gene expression and the differences in SC survival arise from alterations in HIF-2α. HIF-1α and 2α initiate overlapping, but distinct, transcriptional programs (Hu et al., 2003; Mole et al., 2009). Their responses to low O2 are postulated to have different temporal dynamics and functional effects (Uchida et al., 2004). Furthermore, the different HIF-PHD isoforms, PHD1, 2 and 3, have different propensities for targeting HIF-1α and 2α (Appelhoff et al., 2004); namely PHD2, the PHD for which AQ binding has been demonstrated (Karuppagounder et al., 2016), is more selective for HIF-1α than 2α (Appelhoff et al., 2004). Collectively, this suggests that differential HIF-2α responses contribute to the discrepancies between hypoxia and hypoxia-mimetic treatments on cytoprotection. Attempts to quantify HIF-2α levels by immunoblotting, however, were inconsistent and prevented us from independently addressing this possibility.
Another notable transcription factor predicted to bind to the mRNAs altered in the current study is REST. REST was identified as a potential regulator of the genes with altered expression in response to all three treatments relative to control SCs. It is possible, that the treatment exposure durations resulted in suppression of HIF-mediated hypoxic adaptations. In other cells, REST activity is associated with repression of Hif1a transcription and a diminution of HIF-1α responses under conditions of prolonged hypoxia (Cavadas et al., 2015). In SCs, we observed attenuation of ODD-luc activity with exposure to 1% O2 for more than 12 h and attenuation of HRE-luc activity with exposure to AQ for more than 16 h. Examination of Hif1a in SCs following preconditioning (1% O2, 24 h; DFO, 24 h; AQ, 16 h) showed that AQ treatment, but not 1% O2 or DFO treatment, resulted in a significant reduction in Hif1a. Despite finding a reduction in Hif1a, both nuclear levels of HIF-1α and expression of HRE-containing genes were substantially elevated following AQ treatment compared to control SCs. This suggests that if the identification of REST reflects repression of HIF1a and its cellular adaptations in SCs exposed to the treatments, the repression is incomplete. REST was also identified as a transcription factor whose binding differed between SCs exposed to hypoxia and DFO. Thus, it may contribute to the treatment-specific differences in protection. In addition to suppression of HIF-1α adaptations, REST expression is linked to injury protection (Bray et al., 2020). In other CNS models, REST potently protects neurons from oxidative stress (Lu et al., 2014). It also represses neuronal genes associated with cell death under both hypoxic and oxidative stress conditions (Lu et al., 2014; Noh et al., 2012). The role of REST in SCs is currently unknown; however, loss of REST in astrocytes lead to augmented pro-inflammatory responses under injury conditions (Li et al., 2020), which suggests that it may be important for mitigating tissue damage and inducing protective adaptations in glial cells. Thus, it is possible that REST in important for SC protection. Further studies are needed that directly test RESTs role in SCs, how it responds to exposure of SCs to hypoxia and the hypoxia-mimetics, and its contribution to SC cytoprotection.
The HIF-PHDs are part of a larger family of Fe2+-, O2-, and 2-OG-dependent oxygenases, which includes the Jumonjis (Jmj) that act as transcriptional and posttranscriptional regulators and the collagen-4-PHDs that regulate collagen synthesis (Johansson et al., 2014). In the current study we induced hypoxic adaptations in SCs by exposing them to 1% O2, the Fe2+ chelator DFO or a HIF-PHD inhibitor AQ (Karuppagounder et al., 2016). At the concentrations used here, AQ does not appear to influence off target enzymes (Karuppagounder et al., 2016); however, for SCs exposed to 1% O2 and DFO off-target effects of the treatments on additional oxygenases could contribute to treatment effects. This may also explain why the molecular response of DFO-SCs was more similar to hypoxia than the molecular response of AQ-SCs to hypoxia. Epigenetic modifications, including those mediated by the Jmjs, can influence transcription by regulating the gene accessibility for transcription factors (Johansson et al., 2014). Hypoxia induces rapid changes in histone methylation and chromatin reprogramming (Batie et al., 2019), demonstrating that its effects are not restricted to the HIF-PHDs, although HIF-1α-mediated transcription may play a role (Pollard et al., 2008). Similarly, DFO treatment affects other oxygenases and influences epigenetic regulation and collagen formation (Chvapil et al., 1974; Hunt et al., 1979; Vrtacnik et al., 2015). It is possible that the effects of the DFO preconditioning are in part mediated by additional oxygenases not examined in this study. In support of a possible role for additional oxygenases on the treatment-specific effects, two of the transcription factors with predicted binding sites in the altered genes, REST and E2F, can colocalize in complexes with Jmj-type oxygenases (Johansson et al., 2014; Tahiliani et al., 2007). Further, some of the Jmj family members are implicated in posttranscriptional regulation of gene expression (Fu & He, 2012; Jia et al., 2013), which could contribute to the discordant levels of Vegfa protein and mRNA. Additional work directly altering the levels of the HIF-PHDs, collagen-PHDs and Jmjs is needed to address the role of these oxygenases within SCs and to establish the extent to which the off-target effects of DFO influence SC cytoprotection. Interestingly, the ability of ascorbate to induce myelination in SCs is linked to both the collagen-4-PHDs and demethylases (Huff et al., 2020; Murad et al., 1981), but has not been examined for the HIF-PHDs. Given that ascorbate also acts as a co-factor for the HIF-PHDs (Kuiper et al., 2014), HIF-PHDs may also have a heretofore unknown function in regulating SC myelination. The specificity of AQ for the HIF-PHDs could be valuable in distinguishing whether they have a role in induction of myelination by SCs.
These studies demonstrate that treating SCs with pharmacological hypoxia-mimetics, DFO in particular, protects them against oxidative stress, and are superior to direct hypoxic preconditioning. Our results indicate that DFO pretreatment is sufficient to induce protective and adaptive pathways within SCs that enhances SC survival. Moreover, enhanced expression of HIF-1α and its target genes can demonstrate the induction of the adaptive response. In order to maximize the efficacy of cell transplants for SCI repair, an important next step is to assess whether pharmacological preconditioning is sufficient to both protect engrafted SCs in an injured spinal cord and promote SCI repair.
Supplementary Material
ACKNOWLEDGMENTS
The authors would like to thank Dr Rajiv Ratan and the members of the Ratan lab for their assistance and advice, Chad Kurylo, Dr Wilfredo Mellado, and Dr Dianna Willis for their assistance with cloning, and Drs John Cave and Sally Temple for their feedback on the manuscript. Drs Saravanan Karuppagounder and Thong Ma assisted with the Western blotting and assay setup and Drs Veena Kandaswamy and Ma contributed to the preliminary drug testing. Table of contents image was created using BioRender. This work was supported by the NIH: NINDS (grant: NS075375), the Burke Foundation, White Plains, NY, the Spinal Cord Injury Trust Fund through New York State Department of Health (Contracts: C030081, C029128) and the Regenerative Research Foundation, Rensselaer, NY. Opinions expressed here are solely those of the author and do not necessarily reflect those of the Spinal Cord Injury Research Board, the New York State Department of Health, or the State of New York.
Funding information
National Institute of Neurological Disorders and Stroke, Grant/Award Number: NS075375; Spinal Cord Injury Trust Fund through New York State Department of Health Contract, Grant/Award Numbers: C029128, C030081; Regenerative Research Foundation; Burke Foundation
Footnotes
CONFLICT OF INTEREST
The authors declare no conflicts of interest.
SUPPORTING INFORMATION
Additional supporting information may be found online in the Supporting Information section at the end of this article.
DATA AVAILABILITY STATEMENT
The data that support the findings of this study are available from the corresponding author upon reasonable request.
REFERENCES
- Aime P, Karuppagounder SS, Rao A, Chen Y, Burke RE, Ratan RR, & Greene LA (2020). The drug adaptaquin blocks ATF4/CHOP-dependent pro-death Trib3 induction and protects in cellular and mouse models of Parkinson’s disease. Neurobiology of Disease, 136, 104725. 10.1016/j.nbd.2019.104725 [DOI] [PMC free article] [PubMed] [Google Scholar]
- Anderson KD, Guest JD, Dietrich WD, Bartlett Bunge M, Curiel R, Dididze M, Green BA, Khan A, Pearse DD, Saraf-Lavi E, Widerstrom-Noga E, Wood P, & Levi AD (2017). Safety of autologous human Schwann cell transplantation in subacute thoracic spinal cord injury. Journal of Neurotrauma, 34(21), 2950–2963. 10.1089/neu.2016.4895 [DOI] [PubMed] [Google Scholar]
- Aoki H, & Kunisada T (2016). Rest as a new transcription factor to control neural crest development. Single Cell Biology, 5(2). 10.4172/2168-9431.1000144 [DOI] [Google Scholar]
- Appelhoff RJ, Tian YM, Raval RR, Turley H, Harris AL, Pugh CW, Ratcliffe PJ, & Gleadle JM (2004). Differential function of the prolyl hydroxylases PHD1, PHD2, and PHD3 in the regulation of hypoxia-inducible factor. The Journal of Biological Chemistry, 279(37), 38458–38465. 10.1074/jbc.M406026200 [DOI] [PubMed] [Google Scholar]
- Arany Z, Huang LE, Eckner R, Bhattacharya S, Jiang C, Goldberg MA, Bunn HF, & Livingston DM (1996). An essential role for p300/CBP in the cellular response to hypoxia. Proceedings of the National Academy of Sciences of the United States of America, 93 (23), 12969–12973. 10.1073/pnas.93.23.12969 [DOI] [PMC free article] [PubMed] [Google Scholar]
- Babetto E, Wong KM, & Beirowski B (2020). A glycolytic shift in Schwann cells supports injured axons. Nature Neuroscience, 23(10), 1215–1228. 10.1038/s41593-020-0689-4 [DOI] [PMC free article] [PubMed] [Google Scholar]
- Batie M, Frost J, Frost M, Wilson JW, Schofield P, & Rocha S (2019). Hypoxia induces rapid changes to histone methylation and reprograms chromatin. Science, 363(6432), 1222–1226. 10.1126/science.aau5870 [DOI] [PubMed] [Google Scholar]
- Benita Y, Kikuchi H, Smith AD, Zhang MQ, Chung DC, & Xavier RJ (2009). An integrative genomics approach identifies hypoxia inducible factor-1 (HIF-1)-target genes that form the core response to hypoxia. Nucleic Acids Research, 37(14), 4587–4602. 10.1093/nar/gkp425 [DOI] [PMC free article] [PubMed] [Google Scholar]
- Bray JK, Elgamal OA, Jiang J, Wright LS, Sutaria DS, Badawi M, … Schmittgen TD (2020). Loss of RE-1 silencing transcription factor accelerates exocrine damage from pancreatic injury. Cell Death & Disease, 11(2), 138. 10.1038/s41419-020-2269-7 [DOI] [PMC free article] [PubMed] [Google Scholar]
- Brown AM, & Lemke G (1997). Multiple regulatory elements control transcription of the peripheral myelin protein zero gene. The Journal of Biological Chemistry, 272(46), 28939–28947. 10.1074/jbc.272.46.28939 [DOI] [PubMed] [Google Scholar]
- Bunge MB, Monje PV, Khan A, & Wood PM (2017). From transplanting Schwann cells in experimental rat spinal cord injury to their transplantation into human injured spinal cord in clinical trials. Progress in Brain Research, 231, 107–133. 10.1016/bs.pbr.2016.12.012 [DOI] [PubMed] [Google Scholar]
- Carrico KM, Vaishnav R, & Hall ED (2009). Temporal and spatial dynamics of peroxynitrite-induced oxidative damage after spinal cord contusion injury. Journal of Neurotrauma, 26(8), 1369–1378. 10.1089/neu.2008-0870 [DOI] [PMC free article] [PubMed] [Google Scholar]
- Cavadas MA, Mesnieres M, Crifo B, Manresa MC, Selfridge AC, Keogh CE, … Cheong A (2016). REST is a hypoxia-responsive transcriptional repressor. Scientific Reports, 6, 31355. 10.1038/srep31355 [DOI] [PMC free article] [PubMed] [Google Scholar]
- Cavadas MA, Mesnieres M, Crifo B, Manresa MC, Selfridge AC, Scholz CC, … Taylor CT (2015). REST mediates resolution of HIF-dependent gene expression in prolonged hypoxia. Scientific Reports, 5, 17851. 10.1038/srep17851 [DOI] [PMC free article] [PubMed] [Google Scholar]
- Cavadas MAS, Cheong A, & Taylor CT (2017). The regulation of transcriptional repression in hypoxia. Experimental Cell Research, 356 (2), 173–181. 10.1016/j.yexcr.2017.02.024 [DOI] [PubMed] [Google Scholar]
- Chen O, Wu M, & Jiang L (2015). The effect of hypoxic preconditioning on induced Schwann cells under hypoxic conditions. PLoS One, 10(10), e0141201. 10.1371/journal.pone.0141201 [DOI] [PMC free article] [PubMed] [Google Scholar]
- Chen ZF, Paquette AJ, & Anderson DJ (1998). NRSF/REST is required in vivo for repression of multiple neuronal target genes during embryogenesis. Nature Genetics, 20(2), 136–142. 10.1038/2431 [DOI] [PubMed] [Google Scholar]
- Chi JT, Wang Z, Nuyten DS, Rodriguez EH, Schaner ME, Salim A, Wang Y, Kristensen GB, Helland A, Borresen-Dale AL, Giaccia A, Longaker M., Hastie T, Yang GP, van de Vijver MJ, & Brown PO (2006). Gene expression programs in response to hypoxia: Cell type specificity and prognostic significance in human cancers. PLoS Medicine, 3(3), e47. 10.1371/journal.pmed.0030047 [DOI] [PMC free article] [PubMed] [Google Scholar]
- Chvapil M, McCarthy D, Madden JW, & Peacock EE Jr. (1974). Effect of 1,10-phenanthroline and desferrioxamine in vivo on prolyl hydroxylase and hydroxylation of collagen in various tissues of rats. Biochemical Pharmacology, 23(15), 2165–2173. 10.1016/0006-2952(74)90582-6 [DOI] [PubMed] [Google Scholar]
- Claesson-Welsh L (2020). Oxygen sensing; a stunningly elegant molecular machinery highjacked in cancer. Upsala Journal of Medical Sciences, 125(3), 205–210. 10.1080/03009734.2020.1769231 [DOI] [PMC free article] [PubMed] [Google Scholar]
- Clements MP, Byrne E, Camarillo Guerrero LF, Cattin AL, Zakka L, Ashraf A, … Parrinello S (2017). The wound microenvironment reprograms schwann cells to invasive mesenchymal-like cells to drive peripheral nerve regeneration. Neuron, 96(1), 98–114 e117. 10.1016/j.neuron.2017.09.008 [DOI] [PMC free article] [PubMed] [Google Scholar]
- Dai Y, & Hill CE (2018). Transplantation of adult rat Schwann cells into the injured spinal cord. Methods in Molecular Biology, 1739, 409–438. 10.1007/978-1-4939-7649-2_28 [DOI] [PMC free article] [PubMed] [Google Scholar]
- David BT, Curtin JJ, Goldberg DC, Scorpio K, Kandaswamy V, & Hill CE (2020). Hypoxia-inducible factor 1alpha (HIF-1alpha) counteracts the acute death of cells transplanted into the injured spinal cord. eNeuro, 7(3), ENEURO.0092–ENEU19.2019. 10.1523/ENEURO.0092-19.2019 [DOI] [PMC free article] [PubMed] [Google Scholar]
- Duan C (2016). Hypoxia-inducible factor 3 biology: Complexities and emerging themes. American Journal of Physiology. Cell Physiology, 310 (4), C260–C269. 10.1152/ajpcell.00315.2015 [DOI] [PubMed] [Google Scholar]
- Forsythe JA, Jiang BH, Iyer NV, Agani F, Leung SW, Koos RD, & Semenza GL (1996). Activation of vascular endothelial growth factor gene transcription by hypoxia-inducible factor 1. Molecular and Cellular Biology, 16(9), 4604–4613. 10.1128/mcb.16.9.4604 [DOI] [PMC free article] [PubMed] [Google Scholar]
- Fu Y, & He C (2012). Nucleic acid modifications with epigenetic significance. Current Opinion in Chemical Biology, 16(5–6), 516–524. 10.1016/j.cbpa.2012.10.002 [DOI] [PMC free article] [PubMed] [Google Scholar]
- Grove M, Kim H, Santerre M, Krupka AJ, Han SB, Zhai J, Cho JY, Park R, Harris M, Kim S, Sawaya BE, Kang SH, Barbe MF, Cho SH, Lemay MA, & Son YJ (2017). YAP/TAZ initiate and maintain Schwann cell myelination. eLife, 6. 10.7554/eLife.20982 [DOI] [PMC free article] [PubMed] [Google Scholar]
- Hamrick SE, McQuillen PS, Jiang X, Mu D, Madan A, & Ferriero DM (2005). A role for hypoxia-inducible factor-1alpha in desferoxamine neuroprotection. Neuroscience Letters, 379(2), 96–100. 10.1016/j.neulet.2004.12.080 [DOI] [PubMed] [Google Scholar]
- Hess V, Kasim M, Mathia S, Persson PB, Rosenberger C, & Fahling M (2019). Episodic hypoxia promotes defence against cellular stress. Cellular Physiology and Biochemistry, 52(5), 1075–1091. 10.33594/000000073 [DOI] [PubMed] [Google Scholar]
- Hill CE, Guller Y, Raffa SJ, Hurtado A, & Bunge MB (2010). A calpain inhibitor enhances the survival of Schwann cells in vitro and after transplantation into the injured spinal cord. Journal of Neurotrauma, 27 (9), 1685–1695. 10.1089/neu.2010.1272 [DOI] [PMC free article] [PubMed] [Google Scholar]
- Hill CE, Hurtado A, Blits B, Bahr BA, Wood PM, Bartlett Bunge M, & Oudega M (2007). Early necrosis and apoptosis of Schwann cells transplanted into the injured rat spinal cord. The European Journal of Neuroscience, 26(6), 1433–1445. 10.1111/j.1460-9568.2007.05771.x [DOI] [PubMed] [Google Scholar]
- Hill CE, Moon LD, Wood PM, & Bunge MB (2006). Labeled Schwann cell transplantation: Cell loss, host Schwann cell replacement, and strategies to enhance survival. Glia, 53(3), 338–343. 10.1002/glia.20287 [DOI] [PubMed] [Google Scholar]
- Hu CJ, Wang LY, Chodosh LA, Keith B, & Simon MC (2003). Differential roles of hypoxia-inducible factor 1alpha (HIF-1alpha) and HIF-2alpha in hypoxic gene regulation. Molecular and Cellular Biology, 23(24), 9361–9374. 10.1128/mcb.23.24.9361-9374.2003 [DOI] [PMC free article] [PubMed] [Google Scholar]
- Huff TC, Sant DW, Camarena V, van Booven D, Andrade NS, Mustafi S, Monje PV, & Wang G (2020). Vitamin C regulates Schwann cell myelination by promoting DNA demethylation of promyelinating genes. Journal of Neurochemistry. 10.1111/jnc.15015 [DOI] [PMC free article] [PubMed] [Google Scholar]
- Hunt J, Richards RJ, Harwood R, & Jacobs A (1979). The effect of desferrioxamine on fibroblasts and collagen formation in cell cultures. British Journal of Haematology, 41(1), 69–76. 10.1111/j.1365-2141.1979.tb03682.x [DOI] [PubMed] [Google Scholar]
- Hwang YF, & Brown EB (1964). Evaluation of Deferoxamine in iron overload. Archives of Internal Medicine, 114, 741–753. 10.1001/archinte.1964.03860120053003 [DOI] [PubMed] [Google Scholar]
- Jaakkola P, Mole DR, Tian YM, Wilson MI, Gielbert J, Gaskell SJ, Gaskell SJ, von Kriegsheim A, Hebestreit HF, Mukherji M, Schofield CJ, Maxwell PH, Pugh CW, & Ratcliffe PJ (2001). Targeting of HIF-alpha to the von Hippel-Lindau ubiquitylation complex by O2-regulated prolyl hydroxylation. Science, 292(5516), 468–472. 10.1126/science.1059796 [DOI] [PubMed] [Google Scholar]
- Jia G, Fu Y, & He C (2013). Reversible RNA adenosine methylation in biological regulation. Trends in Genetics, 29(2), 108–115. 10.1016/j.tig.2012.11.003 [DOI] [PMC free article] [PubMed] [Google Scholar]
- Johansson C, Tumber A, Che K, Cain P, Nowak R, Gileadi C, & Oppermann U (2014). The roles of Jumonji-type oxygenases in human disease. Epigenomics, 6(1), 89–120. 10.2217/epi.13.79 [DOI] [PMC free article] [PubMed] [Google Scholar]
- Kadoya K, Lu P, Nguyen K, Lee-Kubli C, Kumamaru H, Yao L, Knackert J, Poplawski G, Dulin JN, Strobl HC, Takashima Y, Biane J, Zhang SC, & Tuszynski MH (2016). Spinal cord reconstitution with homologous neural grafts enables robust corticospinal regeneration. Nature Medicine, 22(5), 479–487. 10.1038/nm.4066 [DOI] [PMC free article] [PubMed] [Google Scholar]
- Kapitsinou PP, Sano H, Michael M, Kobayashi H, Davidoff O, Bian A, Yao B, Zhang MZ, Harris RC, Duffy KJ, EricksonMiller CL, Sutton TA, & Haase VH (2014). Endothelial HIF-2 mediates protection and recovery from ischemic kidney injury. The Journal of Clinical Investigation, 124(6), 2396–2409. 10.1172/JCI69073 [DOI] [PMC free article] [PubMed] [Google Scholar]
- Karuppagounder SS, Alim I, Khim SJ, Bourassa MW, Sleiman SF, John R, Thinnes CC, Yeh TL, Demetriades M, Neitemeier S, Cruz D, Gazaryan I, Killilea DW, Morgenstern L, Xi G, Keep RF, Schallert T, Tappero RV, Zhong J, … Ratan RR (2016). Therapeutic targeting of oxygen-sensing prolyl hydroxylases abrogates ATF4-dependent neuronal death and improves outcomes after brain hemorrhage in several rodent models. Science Translational Medicine, 8(328), 328ra329. 10.1126/scitranslmed.aac6008 [DOI] [PMC free article] [PubMed] [Google Scholar]
- Kerber EL, Padberg C, Koll N, Schuetzhold V, Fandrey J, & Winning S (2020). The importance of hypoxia-inducible factors (HIF-1 and HIF-2) for the pathophysiology of inflammatory bowel disease. International Journal of Molecular Sciences, 21(22). 10.3390/ijms21228551 [DOI] [PMC free article] [PubMed] [Google Scholar]
- Keswani SC, Bosch-Marce M, Reed N, Fischer A, Semenza GL, & Hoke A (2011). Nitric oxide prevents axonal degeneration by inducing HIF-1-dependent expression of erythropoietin. Proceedings of the National Academy of Sciences of the United States of America, 108(12), 4986–4990. 10.1073/pnas.1019591108 [DOI] [PMC free article] [PubMed] [Google Scholar]
- Krzywinska E, & Stockmann C (2018). Hypoxia, metabolism and immune cell function. Biomedicine, 6(2). 10.3390/biomedicines6020056 [DOI] [PMC free article] [PubMed] [Google Scholar]
- Kuiper C, Dachs GU, Currie MJ, & Vissers MC (2014). Intracellular ascorbate enhances hypoxia-inducible factor (HIF)-hydroxylase activity and preferentially suppresses the HIF-1 transcriptional response. Free Radical Biology & Medicine, 69, 308–317. 10.1016/j.freeradbiomed.2014.01.033 [DOI] [PubMed] [Google Scholar]
- Lee P, Chandel NS, & Simon MC (2020). Cellular adaptation to hypoxia through hypoxia inducible factors and beyond. Nature Reviews. Molecular Cell Biology, 21(5), 268–283. 10.1038/s41580-020-0227-y [DOI] [PMC free article] [PubMed] [Google Scholar]
- Levy AP, Levy NS, & Goldberg MA (1996). Post-transcriptional regulation of vascular endothelial growth factor by hypoxia. The Journal of Biological Chemistry, 271(5), 2746–2753. 10.1074/jbc.271.5.2746 [DOI] [PubMed] [Google Scholar]
- Li H, Liu Z, Wu Y, Chen Y, Wang J, Wang Z, Huang D, Wang M, Yu M, Fei J, & Huang F (2020). The deficiency of NRSF/REST enhances the pro-inflammatory function of astrocytes in a model of Parkinson’s disease. Biochimica et Biophysica Acta - Molecular Basis of Disease, 1866(1), 165590. 10.1016/j.bbadis.2019.165590 [DOI] [PubMed] [Google Scholar]
- Liu Y, Cox SR, Morita T, & Kourembanas S (1995). Hypoxia regulates vascular endothelial growth factor gene expression in endothelial cells. Identification of a 50 enhancer. Circulation Research, 77(3), 638–643. 10.1161/01.res.77.3.638 [DOI] [PubMed] [Google Scholar]
- Lu P, Wang Y, Graham L, McHale K, Gao M, Wu D, Brock J, Blesch A, Rosenzweig ES, Havton LA, Zheng B, Conner JM, Marsala M, & Tuszynski MH (2012). Long-distance growth and connectivity of neural stem cells after severe spinal cord injury. Cell, 150(6), 1264–1273. 10.1016/j.cell.2012.08.020 [DOI] [PMC free article] [PubMed] [Google Scholar]
- Lu T, Aron L, Zullo J, Pan Y, Kim H, Chen Y, Yang TH, Kim HM, Drake D, Liu XS, Bennett DA, Colaiacovo MP, & Yanknerq BA (2014). REST and stress resistance in ageing and Alzheimer’s disease. Nature, 507(7493), 448–454. 10.1038/nature13163 [DOI] [PMC free article] [PubMed] [Google Scholar]
- Marquardt LM, Doulames VM, Wang AT, Dubbin K, Suhar RA, Kratochvil MJ, Medress ZA, Plant GW, & Heilshorn SC (2020). Designer, injectable gels to prevent transplanted Schwann cell loss during spinal cord injury therapy. Science Advances, 6(14), eaaz1039. 10.1126/sciadv.aaz1039 [DOI] [PMC free article] [PubMed] [Google Scholar]
- Mole DR, Blancher C, Copley RR, Pollard PJ, Gleadle JM, Ragoussis J, & Ratcliffe PJ (2009). Genome-wide association of hypoxia-inducible factor (HIF)-1alpha and HIF-2alpha DNA binding with expression profiling of hypoxia-inducible transcripts. The Journal of Biological Chemistry, 284(25), 16767–16775. 10.1074/jbc.M901790200 [DOI] [PMC free article] [PubMed] [Google Scholar]
- Murad S, Grove D, Lindberg KA, Reynolds G, Sivarajah A, & Pinnell SR (1981). Regulation of collagen synthesis by ascorbic acid. Proceedings of the National Academy of Sciences of the United States of America, 78(5), 2879–2882. 10.1073/pnas.78.5.2879 [DOI] [PMC free article] [PubMed] [Google Scholar]
- Nakayama K, & Kataoka N (2019). Regulation of gene expression under hypoxic conditions. International Journal of Molecular Sciences, 20(13). 10.3390/ijms20133278 [DOI] [PMC free article] [PubMed] [Google Scholar]
- Noh KM, Hwang JY, Follenzi A, Athanasiadou R, Miyawaki T, Greally JM, Bennett MV, & Zukin RS (2012). Repressor element-1 silencing transcription factor (REST)-dependent epigenetic remodeling is critical to ischemia-induced neuronal death. Proceedings of the National Academy of Sciences of the United States of America, 109(16), E962–E971. 10.1073/pnas.1121568109 [DOI] [PMC free article] [PubMed] [Google Scholar]
- Patel V, Joseph G, Patel A, Patel S, Bustin D, Mawson D, Tuesta LM, Puentes R, Ghosh M, & Pearse DD (2010). Suspension matrices for improved Schwann-cell survival after implantation into the injured rat spinal cord. Journal of Neurotrauma, 27(5), 789–801. 10.1089/neu.2008.0809 [DOI] [PMC free article] [PubMed] [Google Scholar]
- Pollard PJ, Loenarz C, Mole DR, McDonough MA, Gleadle JM, Schofield CJ, & Ratcliffe PJ (2008). Regulation of Jumonji-domain-containing histone demethylases by hypoxia-inducible factor (HIF)-1alpha. The Biochemical Journal, 416(3), 387–394. 10.1042/BJ20081238 [DOI] [PubMed] [Google Scholar]
- Pugh CW (2016). Modulation of the hypoxic response. Advances in Experimental Medicine and Biology, 903, 259–271. 10.1007/978-1-4899-7678-9_18 [DOI] [PubMed] [Google Scholar]
- Qu C, Zhang Y, Chen J, Zhang S, Yu J, Yang C, Zhang X, Xu Z-R, & Liu G (2019). A weighted mean value analysis to identify biological pathway activity changes during poplar seed germination. Forests, 10 (8), 664. 10.3390/f10080664 [DOI] [Google Scholar]
- Ratan RR, Siddiq A, Aminova L, Langley B, McConoughey S, Karpisheva K, Lee HH, Carmichael T, Kornblum H, Coppola G, Geschwind DH, Hoke A, Smirnova N, Rink C, Roy S, Sen C, Beattie MS, Hart RP, …, & Gazaryan I (2008). Small molecule activation of adaptive gene expression: Tilorone or its analogs are novel potent activators of hypoxia inducible factor-1 that provide prophylaxis against stroke and spinal cord injury. Annals of the New York Academy of Sciences, 1147, 383–394. 10.1196/annals.1427.033 [DOI] [PMC free article] [PubMed] [Google Scholar]
- Raudvere U, Kolberg L, Kuzmin I, Arak T, Adler P, Peterson H, & Vilo J (2019). g:Profiler: A web server for functional enrichment analysis and conversions of gene lists (2019 update). Nucleic Acids Research, 47(W1), W191–W198. 10.1093/nar/gkz369 [DOI] [PMC free article] [PubMed] [Google Scholar]
- Rybnikova E, & Samoilov M (2015). Current insights into the molecular mechanisms of hypoxic pre- and postconditioning using hypobaric hypoxia. Frontiers in Neuroscience, 9, 388. 10.3389/fnins.2015.00388 [DOI] [PMC free article] [PubMed] [Google Scholar]
- Schodel J, Mole DR, & Ratcliffe PJ (2013). Pan-genomic binding of hypoxia-inducible transcription factors. Biological Chemistry, 394(4), 507–517. 10.1515/hsz-2012-0351 [DOI] [PubMed] [Google Scholar]
- Schodel J, Oikonomopoulos S, Ragoussis J, Pugh CW, Ratcliffe PJ, & Mole DR (2011). High-resolution genome-wide mapping of HIF-binding sites by ChIP-seq. Blood, 117(23), e207–e217. 10.1182/blood-2010-10-314427 [DOI] [PMC free article] [PubMed] [Google Scholar]
- Semenza GL (1998). Hypoxia-inducible factor 1: Master regulator of O2 homeostasis. Current Opinion in Genetics & Development, 8(5), 588–594. 10.1016/s0959-437x(98)80016-6 [DOI] [PubMed] [Google Scholar]
- Semenza GL (2007). Hypoxia-inducible factor 1 (HIF-1) pathway. Science’s STKE, 2007(407), cm8. 10.1126/stke.4072007cm8 [DOI] [PubMed] [Google Scholar]
- Semenza GL, Jiang BH, Leung SW, Passantino R, Concordet JP, Maire P, & Giallongo A (1996). Hypoxia response elements in the aldolase A, enolase 1, and lactate dehydrogenase A gene promoters contain essential binding sites for hypoxia-inducible factor 1. The Journal of Biological Chemistry, 271(51), 32529–32537. 10.1074/jbc.271.51.32529 [DOI] [PubMed] [Google Scholar]
- Siddiq A, Aminova LR, Troy CM, Suh K, Messer Z, Semenza GL, & Ratan RR (2009). Selective inhibition of hypoxia-inducible factor (HIF) prolyl-hydroxylase 1 mediates neuroprotection against normoxic oxidative death via HIF- and CREB-independent pathways. The Journal of Neuroscience, 29(27), 8828–8838. 10.1523/JNEUROSCI.1779-09.2009 [DOI] [PMC free article] [PubMed] [Google Scholar]
- Smirnova NA, Rakhman I, Moroz N, Basso M, Payappilly J, Kazakov S, Hernandez-Guzman F, Gaisina IN, Kozikowski AP, Ratan RR, & Gazaryan IG (2010). Utilization of an in vivo reporter for high throughput identification of branched small molecule regulators of hypoxic adaptation. Chemistry & Biology, 17(4), 380–391. 10.1016/j.chembiol.2010.03.008 [DOI] [PMC free article] [PubMed] [Google Scholar]
- Stewart HJ, Brennan A, Rahman M, Zoidl G, Mitchell PJ, Jessen KR, & Mirsky R (2001). Developmental regulation and overexpression of the transcription factor AP-2, a potential regulator of the timing of Schwann cell generation. The European Journal of Neuroscience, 14(2), 363–372. 10.1046/j.0953-816x.2001.01650.x [DOI] [PubMed] [Google Scholar]
- Sutrina SL, Lue NF, Chen GL, & Chen WW (1987). Effect of dimethyl sulfoxide on transformed rat Schwann cells. Biochimica et Biophysica Acta, 923(3), 451–462. 10.1016/0304-4165(87)90054-7 [DOI] [PubMed] [Google Scholar]
- Tahiliani M, Mei P, Fang R, Leonor T, Rutenberg M, Shimizu F, Li J, Rao A, & Shi Y (2007). The histone H3K4 demethylase SMCX links REST target genes to X-linked mental retardation. Nature, 447(7144), 601–605. 10.1038/nature05823 [DOI] [PubMed] [Google Scholar]
- Terrovitis JV, Smith RR, & Marban E (2010). Assessment and optimization of cell engraftment after transplantation into the heart. Circulation Research, 106(3), 479–494. 10.1161/CIRCRESAHA.109.208991 [DOI] [PMC free article] [PubMed] [Google Scholar]
- Tetzlaff W, Okon EB, Karimi-Abdolrezaee S, Hill CE, Sparling JS, Plemel JR, Plunet WT, Tsai EC, Baptiste D, Smithson LJ, Kawaja MD, Fehlings MG, & Kwon BK (2011). A systematic review of cellular transplantation therapies for spinal cord injury. Journal of Neurotrauma, 28(8), 1611–1682. 10.1089/neu.2009.1177 [DOI] [PMC free article] [PubMed] [Google Scholar]
- Theus MH, Wei L, Cui L, Francis K, Hu X, Keogh C, & Yu SP (2008). In vitro hypoxic preconditioning of embryonic stem cells as a strategy of promoting cell survival and functional benefits after transplantation into the ischemic rat brain. Experimental Neurology, 210(2), 656–670. 10.1016/j.expneurol.2007.12.020 [DOI] [PubMed] [Google Scholar]
- Uchida T, Rossignol F, Matthay MA, Mounier R, Couette S, Clottes E, & Clerici C (2004). Prolonged hypoxia differentially regulates hypoxia-inducible factor (HIF)-1alpha and HIF-2alpha expression in lung epithelial cells: Implication of natural antisense HIF-1alpha. The Journal of Biological Chemistry, 279(15), 14871–14878. 10.1074/jbc.M400461200 [DOI] [PubMed] [Google Scholar]
- Vrtacnik P, Marc J, & Ostanek B (2015). Hypoxia mimetic deferoxamine influences the expression of histone acetylation- and DNA methylation-associated genes in osteoblasts. Connective Tissue Research, 56(3), 228–235. 10.3109/03008207.2015.1017573 [DOI] [PubMed] [Google Scholar]
- Wakai T, Narasimhan P, Sakata H, Wang E, Yoshioka H, Kinouchi H, & Chan PH (2016). Hypoxic preconditioning enhances neural stem cell transplantation therapy after intracerebral hemorrhage in mice. Journal of Cerebral Blood Flow and Metabolism, 36(12), 2134–2145. 10.1177/0271678X15613798 [DOI] [PMC free article] [PubMed] [Google Scholar]
- Wang GL, & Semenza GL (1993a). Desferrioxamine induces erythropoietin gene expression and hypoxia-inducible factor 1 DNA-binding activity: Implications for models of hypoxia signal transduction. Blood, 82(12), 3610–3615 Retrieved from https://www.ncbi.nlm.nih.gov/pubmed/8260699 [PubMed] [Google Scholar]
- Wang GL, & Semenza GL (1993b). General involvement of hypoxia-inducible factor 1 in transcriptional response to hypoxia. Proceedings of the National Academy of Sciences of the United States of America, 90(9), 4304–4308. 10.1073/pnas.90.9.4304 [DOI] [PMC free article] [PubMed] [Google Scholar]
- Wei ZZ, Zhu YB, Zhang JY, McCrary MR, Wang S, Zhang YB, Yu SP, & Wei L (2017). Priming of the cells: Hypoxic preconditioning for stem cell therapy. Chinese Medical Journal, 130(19), 2361–2374. 10.4103/0366-6999.215324 [DOI] [PMC free article] [PubMed] [Google Scholar]
- Yang Y, Cui J, Xue F, Zhang C, Mei Z, Wang Y, Bi M, Shan D, Meredith A, Li H, & Xu ZQ (2015). Pokemon (FBI-1) interacts with Smad4 to repress TGF-beta-induced transcriptional responses. Biochimica et Biophysica Acta, 1849(3), 270–281. 10.1016/j.bbagrm.2014.12.008 [DOI] [PubMed] [Google Scholar]
- Yu SP, Wei Z, & Wei L (2013). Preconditioning strategy in stem cell transplantation therapy. Translational Stroke Research, 4(1), 76–88. 10.1007/s12975-012-0251-0 [DOI] [PMC free article] [PubMed] [Google Scholar]
- Zhou X, Zhai X, & Ashraf M (1996). Direct evidence that initial oxidative stress triggered by preconditioning contributes to second window of protection by endogenous antioxidant enzyme in myocytes. Circulation, 93(6), 1177–1184. 10.1161/01.cir.93.6.1177 [DOI] [PubMed] [Google Scholar]
- Zhu H, Li F, Yu WJ, Wang WJ, Li L, Wan LD, Le Y, & Ding WL (2010). Effect of hypoxia/reoxygenation on cell viability and expression and secretion of neurotrophic factors (NTFs) in primary cultured Schwann cells. The Anatomical Record (Hoboken), 293(5), 865–870. 10.1002/ar.21105 [DOI] [PubMed] [Google Scholar]
- Zhu H, Wang WJ, Ding WL, Li F, & He J (2008). Effect of panaxydol on hypoxia-induced cell death and expression and secretion of neurotrophic factors (NTFs) in hypoxic primary cultured Schwann cells. Chemico-Biological Interactions, 174(1), 44–50. 10.1016/j.cbi.2008.04.041 [DOI] [PubMed] [Google Scholar]
Associated Data
This section collects any data citations, data availability statements, or supplementary materials included in this article.
Supplementary Materials
Data Availability Statement
The data that support the findings of this study are available from the corresponding author upon reasonable request.