

Abstract
Pesticide transformation products (TPs) are frequently quantified in aquatic systems, including surface and groundwater. They often present higher polarity than parent compounds, are less volatile and less biodegradable and are therefore more mobile and persistent. These properties make them compounds of main interest in water resources and drinking water. With more than 600 samples collected over two years and nearly 100,000 results available, this study was carried out to evaluate the occurrence of 157 pesticide TPs and certain active substances in raw and drinking water in France. Our study made it possible to assess the potential exposure of the population to pesticides and their metabolites through drinking water consumption and finally to put forward new TPs of interest for the monitoring of drinking water. Among TPs, chlorothalonil R471811 and metolachlor ESA were the most frequently quantified compounds, with quantification in more than 50% of raw and drinking water. TPs dimethachlor CGA369873, chlorothalonil R471811 and R417888, terbuthylazine LM2 and LM6, desphenyl chloridazon (DPC) and methyldesphenyl chloridazon (MeDPC) were monitored for the first time in drinking water in France. Concentrations exceeding the regulatory quality standard of 0.1 µg.L−1 were observed in more than 30% of drinking water samples for chlorothalonil R471811, and a maximum concentration was measured at 9.8 µg.L−1 for DPC in drinking water. The quantification frequencies were relatively similar in raw water and tap water, which appears to indicate poor efficiency of the majority of the currently used drinking water treatment plants. This research confirmed the benefit of focusing on TPs and parent compounds, and also to continue monitoring TPs that originate from compounds already withdrawn from the market for several years that appear to be highly persistent.
Supplementary Information
The online version contains supplementary material available at 10.1007/s11356-025-35979-3.
Keywords: Pesticides, Pesticide transformation products, Raw water, Drinking water, Monitoring
Introduction
Modern food production systems rely on high volumes of chemical pesticides to ensure crop yield stability and quantity, and to maintain food security (EEA 2017, 2019; Baran et al. 2021). Active substances (ASs) of pesticides are used to kill pests, but they may persist in the environment after their application (Froger et al. 2023; Sarker et al. 2024). In the environment, ASs of pesticides may degrade depending on their intrinsic properties and the physicochemical conditions encountered in soil, air, water and wildlife. Consequently, pesticide transformation products (TPs), also called metabolites, result from various biotic (metabolisation) and abiotic (hydrolysis, photodegradation) processes (Anagnostopoulou et al. 2022; Barriuso et al. 1996). All of these compounds can seep or leach to ground or surface waters and many studies have highlighted their occurrence in all environmental compartments: water resources, the atmosphere, soil and sediments (Baran et al. 2022; Masiá et al. 2013; Menger et al. 2021; Papadakis et al. 2015; Teysseire et al. 2023; Vulliet et al. 2014).
TPs are often more polar, less volatile and less biodegradable than parent compounds and are therefore more mobile and persistent. They are considered pseudo-ubiquitous in the aquatic system, including in surface and groundwater (Buttiglieri et al. 2009; Kolpin et al. 2004). Conventional drinking water treatment processes are primarily designed for the elimination of suspended matter in water and for water disinfection. They are not dedicated to the elimination of micropollutants and have consequently low efficiency in eliminating polar molecules such as pesticide ASs and their TPs.
Polar TPs are considered substances of prime interest and need to be studied to fill knowledge gaps concerning their occurrence and fate in the natural environment and drinking water processing (Harmon O'Driscoll et al. 2022; Mahai et al. 2021). They have consequently become a high concern for health and environmental authorities. Importantly, a clear understanding of pollutants, their properties and their concentration levels is a prerequisite for selecting and sizing specific technologies, such as granular activated carbon, nanofiltration or ozonation (Bilal et al. 2019; Kiefer et al. 2020) and organising effective monitoring.
In 2021, 469 pesticide active substances were approved in Europe and 61 were pending a final decision. France is one of the most pesticide-consuming countries in Europe (Baran et al. 2022), with more than 70,000 tons sold in 2021 according to the national database of phytopharmaceutical product sales (EauFrance 2021).
Quality requirements for drinking water are specified in the French Public Health Code in the application of European Directive 2020/2184 (European Union 2020). In France, lists of pesticides to be monitored are defined and implemented regionally by regional health agencies according to general guidelines established by the Ministry of Health, considering the following: historical results, occurrence in other compartments (surface water and groundwater), uses and alerts from other administrative regions/territories or other countries, data provided by water suppliers (Direction Générale de la Santé 2015).
Pesticide active substances have been monitored for decades in raw water and water intended for human consumption in France. Monitoring of TPs as part of routine supervision of drinking water has been increasing in recent years thanks to improved analytical methods—notably direct injection liquid chromatography-tandem mass spectrometry (LC–MS/MS)—enabling the detection of numerous polar metabolites at low concentrations in water. Nevertheless, many difficulties are still patent because of certain obstacles that are difficult to overcome: (i) TPs of interest are very numerous and many of them are not known (pesticide registration data is either not easily accessible or not available at all), (ii) analytical standards for TPs are sometimes not commercially available and finally (iii) TP analysis often requires dedicated methods, e.g. for small polar compounds such as aminomethylphosphonic acid (AMPA) which is a TP of glyphosate, or chlorothalonil metabolite R419492. Thus, knowledge is still poor regarding the nature and the concentrations of TPs in raw and drinking waters. Preliminary results nevertheless indicate, as observed in other studies (Buttiglieri et al. 2009; Kiefer et al. 2019; Kolpin et al. 2004; Schuhmann et al. 2016) that TPs occur more frequently and in higher concentrations than corresponding ASs and are, therefore, responsible for the majority of non-compliance events (Anagnostopoulou et al. 2022, Direction Générale de la Santé 2023).
Environmental monitoring provides an important ‘warning system’ to supply risk assessment. Accordingly, this study aimed to fill the knowledge gap on the occurrence of a wide range of ASs and TPs through a national campaign covering the entire territory of France, including overseas departments.
The main objectives of this study were as follows: (i) to evaluate the occurrence of a large number of pesticide TPs and some ASs in raw and drinking waters, (ii) to estimate exposure of the population to pesticides and their metabolites through its consumption and (iii) to propose new TPs of interest for the monitoring of drinking water. Multiresidue methods based on gas chromatography (GC) and liquid chromatography (LC) coupled with mass spectrometry (MS/MS) were developed and validated to accurately quantify the full set of target compounds. Then, a sampling strategy was deployed to develop an overview of the contamination of aquifers and surface waters by relevant pesticide ASs and their TPs, including compounds that have been banned for many years.
Materials and methods
Studied compounds
A list of 145 pesticides, including Ass and TPs, was selected from various chemical families (e.g. carbamates, chloroacetamides, phenylpyrazoles, neonicotinoids, triazines, organophosphates, substituted ureas and sulfonamides) and classes of uses (e.g. herbicides, fungicides, insecticides, as well as more restricted categories such as molluscicides, rodenticides and nematicides). A total of 44 compounds were ASs (including 17 banned substances), 4 were mixed molecules (ASs and TPs), and 97 were TPs. When certain TPs were deemed of interest, the list of TPs from the same AS was widened in order to develop knowledge on their relative distribution and occurrence through the entire drinking water cycle. The complete list is presented as supplementary information (Table S1). The selection of compounds was based on (i) a bibliographic survey, (ii) local alerts or alerts from neighboring countries, (iii) contamination of other matrices and (iv) expert opinions and peer review. Among selected emerging substances, transformation products of chlorothalonil (R471811, R417888, R182281, R611965, SYN507900), chloridazon (desphenyl- and methyl desphenyl-) or terbuthylazine (LM2 to LM6) that have been found to be of high interest (Kiefer et al. 2019) were included to provide initial data on their occurrence in water in France.
Sampling strategy
This national campaign aimed to cover the entire territory of France, including all départements (both overseas and metropolitan), and was carried out in collaboration with Regional Health Agencies and the French Ministry of Health. This sampling plan has shown its effectiveness and relevance in various previously published studies (Bach et al. 2024, 2020; Colin et al. 2014). In order to be representative of a large proportion of the national flow of produced drinking water (20% to 25% of the French population), the sampling strategy deployed from October 2020 to June 2022 was implemented as described below. For each département, three sample locations were investigated: (i) the water catchment producing the greatest flow of drinking water (GF), (ii) a randomly selected drinking water source (RS) and (iii) a drinking water resource known to present contamination by pesticides (CR). A total of 304 raw water samples (222 groundwater and 82 surface water samples) and 299 corresponding drinking water samples were analysed. In some cases, multiple samples corresponding to a single drinking water source were collected. Samples were taken simultaneously from raw and drinking water sources without accounting for the residence time in the drinking water treatment plants.
The sampling campaign was conducted over an extended period of 18 months, independently of climatic conditions (e.g. during baseflow or flood wave periods), land use and pesticide applications. Consequently, the transfer time and residence time of pesticides and their TPs in the aquifers were not considered in the interpretation of the results. Acknowledging the limitations of our sampling strategy, the results were interpreted as a whole rather than on a case-by-case basis.
All water samples were collected in 40-mL glass bottles containing 0.1% formic acid, shipped at 4 °C on cold packs in polystyrene boxes and received at the laboratory within 24 to 48 h. In most cases, samples were analysed within 4–5 days of collection. Sodium thiosulfate was added to all drinking water samples to neutralise free residual chlorine and to avoid pesticide degradation after sampling.
Standards and reagents
All native and isotope-labeled compounds (13C and 2H) were purchased as pure analytical standards or solutions from Dr. Ehrenstorfer (Augsburg, Germany), Neochema GmbH (Bodenheim, Germany), HPC standards GmbH (Borsdorf, Germany) and Techlab (Metz, France). Some non-commercially available TP standards were obtained from companies such as Bayer, Syngenta, FMC Agricultural Solutions and Dow Agro Science. Water, acetonitrile and methanol were liquid chromatography–mass spectrometry (LC–MS) grade and were obtained from Biosolve (Valkenswaard, the Netherlands).
Two independent batches of individual solutions of the native compounds were prepared when possible: the first for preparation of calibration samples, and the second for spiking of samples. All stock and working solutions were stored in the dark at 4 ± 2 °C. No instability of compounds in working solutions was detected over a storage period of 12 months. For LC–MS/MS analysis, standard solutions were prepared in a mix of acetonitrile and water (10/90 v/v), according to initial chromatographic conditions. For GC–MS/MS analysis, standard solutions were prepared in methanol.
Analytical methods
Two complementary analytical methods were used to perform analysis of the 157 compounds.
Surface waters were first centrifuged to prevent clogging. The first analytical method was based on direct injection coupled with liquid chromatography hyphenated to tandem mass spectrometry in both negative and positive ionisation modes (DI LC–MS/MS). Two consecutive injections were necessary to monitor the 137 compounds. Accurate quantification was achieved by implementing 31 isotopically labeled standards.
In brief, the second analytical method implemented stir bar sorptive extraction (SBSE) followed by gas chromatography hyphenated to tandem mass spectrometry analysis (GC–MS/MS). In all, 8 compounds of interest and 12 of their isomers were analysed. Three labeled internal standards were implemented to carry out the quantification.
A more complete description of the developed methods (LC and GC parameters, MS/MS transitions) is available in Table S2.
Method performances
Method validation was performed using some of the specific statistical tools provided in the NF T90:210 standard (AFNOR 2018), which aligns with the SANTE guidelines by incorporating European regulatory requirements (EURL 2017). Therefore, method validation was carried out on a representative matrix. A set of water samples with an extensive range of physicochemical properties was selected as representative of environmental and geochemical conditions to which the method will be applied for monitoring in surface, ground and drinking waters. During the analytical development phase, an important step in evaluating the matrix effect was carried out, taking into account the various types of water analysed. This work enabled the relevant association of labeled internal standards with target compounds and, when necessary, the acquisition of homologous internal standards for some molecules that could not be corrected using non-homologous internal standards. This study was essential to avoid concentration bias caused by matrix effects (Gallé et al. 2022; Gru et al. 2010).
For both methods, calibrations were performed with 7 to 9 points of concentration range. The quadratic fit of the calibration curves was systematically checked for each sample batch (R-square values from regression analysis ≥ 0.97 and maximum bias for each point of the calibration curve below 20%). Quantification of the target compounds was performed using the internal standard method with deuterated or 13C-labeled internal standards. They were added to each water sample before applying analytical procedures and were used to check the overall recovery of target chemicals during the analytical procedure.
For each compound, limit of quantification (LOQ) and uncertainty were determined (see Table S2). LOQ was defined as the lowest concentration of analyte that can be determined with acceptable accuracy under the stated conditions of the test, e.g. representative real matrix under intermediate precision. In this study, a maximum allowed tolerance of ± 60% was required (XP CEN/TS 16800, (AFNOR 2016)). LOQs, in matrix, were between 0.005 and 0.200 µg.L−1 and maximum relative uncertainties (k = 2) around 40% at the LOQ. Recoveries ranged between 89 and 114% (100 ± 6%), and 90 and 108% (98 ± 5%), respectively for LC–MS/MS and GC–MS/MS methods.
Quality assurance/quality control
To check initial system performances and to monitor any prejudicial loss of sensitivity during the analytical runs, a range of quality control tools were deployed. Confirmation of target compound identification was performed, fulfilling the ISO 21253–1:2019 requirements: retention time with a tolerance of 2.5%, monitoring of two distinct transitions and their abundance ratio (based on peak area) with 30% tolerance between samples and calibration samples (International Organization for Standardization 2019).
Standard solution mixtures were injected on average every 10 real samples and a standard solution mixture at the LOQ was injected at the end of each run to prevent analytical drift. To ensure the quality of the data produced, results were interpreted using control charts with tolerances below 30%.
The relative recovery study was carried out by spiking one raw water and one drinking water sample randomly selected in each analytical run. These samples were spiked with the targeted compounds in order to verify the accuracy of the analytical method and to monitor potential matrix effects. These controls were considered valid when recoveries were between 60 and 140%, according to SANTE/11813/2017 guidance document (EURL 2017).
Additional external quality controls were performed by periodic participation (at less twice a year) in inter-laboratory comparisons covering approximatively 25% of the targeted compounds. Results of these external quality controls supported the quality of our methods (Z score < 2).
No related cross-contamination was revealed during method validation. However, the absence of contamination of up to 1/3 of the LOQ was verified at each sequence by pouring LC–MS grade water into collection bottles and performing the overall analytical procedures.
The stability of target compounds was investigated before the sampling campaign by conducting spiking experiments in natural water (raw and drinking water) for a period of 3 weeks, under the sampling and storage conditions described above, and after extraction by SBSE and storage at 4 °C in amber glass vials for a period of 3 months. All target compounds were stable during this period of time (recoveries within the uncertainty of the analytical method), with the exception of metsulfuron-methyl and pinoxaden, which were stable for 2 and 13 days, respectively in water.
Lastly, 92% of the results were produced under cover of COFRAC accreditation according to NF EN ISO/IEC 17025 requirements (AFNOR 2017) (145 compounds were accredited).
The validated procedures demonstrated their applicability to real samples in relation to the objectives of robust quantification in raw and drinking waters. Finally, the optimised procedures were applied in the national monitoring campaign.
Results and discussion
With respect to the overall objectives of the study and considering the limitations of the implemented sampling strategy, a decision was made to aggregate the data from all of France (no regional discussion) in order to highlight the main trends. Furthermore, no paired discussion (raw water/drinking water) at a given site will be shown, and accordingly, the efficiency of drinking water process treatment will not be discussed. In fact, treatment process evaluation can be complex, especially since several resources may be used to provide drinking water.
Pesticides and their transformation products in raw waters
This survey involved drinking water networks supplied by groundwater and surface water. Due to the sampling strategy, groundwater samples were predominant, representing 73% of the 304 raw waters collected, in accordance with the type of water used in France. The results in raw water are given in Fig. 1a. At least one compound was detected above the LOQ in 80% of groundwaters and 83% of surface waters. Moreover, 97% of raw water samples coming from vulnerable resources (known to present contamination by pesticides) contained at least one of the target compounds above LOQ, while raw waters that were selected randomly exhibited a lower state of contamination, with approximately 60% of them contaminated by at least one of the target compounds above LOQ. This overall picture confirmed the ubiquitous contamination of waterbodies by pesticides and their TPs as a consequence of their mobility via transfer processes, such as runoff, infiltration or leaching into water resources (Guzzella et al. 1996; Hintze et al. 2020; Jorfi et al. 2021; Syafrudin et al. 2021; Verlicchi and Ghirardini 2022).
Fig. 1.

Number of compounds investigated and quantified in raw waters (a) and drinking waters (b), depending on the type of pesticide use
Among the 145 investigated compounds (44 ASs, 97 TPs and 4 mixed molecules), 84 were quantified at least once in raw water. Among them, 27 were ASs and 57 were TPs. Not surprisingly, TPs represented a substantial proportion of systematically detected contaminants (Hintze et al. 2020; Ulrich 2022), legitimating the critical need to address TPs in routine monitoring programs.
Herbicides, which were the most commonly represented, were also the most quantified: 77% of the target herbicide ASs and TPs were measured at least once. The broad occurrence of fungicides was also confirmed, with 65% of them quantified at least once. Insecticides, especially neonicotinoids (the main target compounds at 14 of 42), showed the lowest frequency of quantification (17%). These results are consistent with the banning of their use, implemented in France since 2018, and also their uses, especially compared to herbicides as stated by the National Crop Protection Products Sales database (EauFrance 2021). In fact, over the period 2017–2021, considering the selected ASs for this study, fewer than 500 tons per year of insecticides were sold versus more than 12,000 tons for herbicides.
As highlighted in Fig. 1a, groundwaters displayed higher frequencies of quantification, regardless of the types of compounds (AS/TP) and chemical classes, compared to surface waters. This may be due to the selection of CR points mainly of groundwater origin. Furthermore, as shown in Fig. 2, which presents the 90th percentile of the total concentration (µg.L−1) of quantified substances at a given site, the state of contamination of groundwaters by banned ASs and their related TPs was higher than that of surface water, with TP 90th percentile total concentrations of 1.115 and 0.738 µg.L−1, respectively. Currently authorised substances and related TPs were more concentrated in surface waters than groundwaters, at 0.114 µg.L−1 and 0.062 µg.L−1, respectively. Although an impact of the sampling strategy on this snapshot could not be ruled out, it can be assumed that it reflects the wide persistence and mobility of pesticides. In fact, the fate of pesticides has been recognised to be driven as much by the climate setting and type of aquifer as the use and properties of the compounds (Baran et al. 2021). In France, several studies have demonstrated that compounds can be found in groundwater several years after being withdrawn from the market (Baran et al. 2007, 2021; Gourcy et al. 2009; Lopez et al. 2015; Morvan et al. 2006).
Fig. 2.
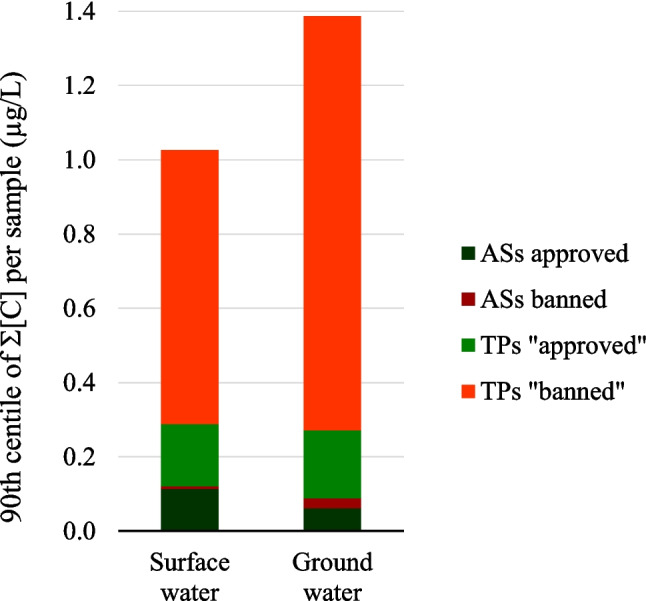
90th percentile of the sum of substances, in concentration, per sample according to their type (AS or TP), their regulatory status (approved or banned), and the type of water (surface water or groundwater)
Furthermore, the occurrence of approved ASs in surface waters reflects their immediate vulnerability to spray and dust drift during application, or surface runoff (Bonmatin et al. 2014; Ulrich 2022).
Three main phenomena have been put forward to explain the persistence of an AS in groundwater: remobilisation from soils, delayed transfer time and the absence of degradation in the saturated zone (Baran et al. 2021). These mechanisms are also affected by hydrology and dynamics of transfer to groundwater during the application period (Baran et al. 2021).
This widespread groundwater contamination by TPs can also be explained by their physiochemical characteristics. TPs are usually more polar, less volatile and less biodegradable than their parent compounds and show groundwater ubiquity scores (GUS) that are greater than ASs, which results in higher leachability from soils and mobility in the general environment (Arp and Hale 2022; Baran et al. 2022; Lapworth et al. 2015; Schuhmann et al. 2016). Indeed, the GUS is an experimentally calculated value that relates a pesticide’s half-life and Koc (from laboratory data) and can be used to rank pesticides based on their potential to leach into groundwater (Gustafson 1989).
With the exception of atrazine (25%), bentazone (16%) and metolachlor (18%), the ASs were quantified at frequencies lower than 10% (Fig. 3). Interestingly, if we compare the most sold ASs in France over the period 2017–2021 (see Figure S1), prosulfocarb, which presents the most significant annual tonnages, was found in only 5% of samples. Flufenacet, chlorotoluron, tebuconazole, metazachlor, dimethenamid, chloridazon, and 2,4 D and 2,4-methyl-chlorophenoxyacetic acid were quantified in 6%, 5%, 3%, 9%, 3%, 1.7%, 2% and 0.7% of samples, respectively. Their median concentrations did not exceed 0.1 µg.L−1.
Fig. 3.

Median concentrations of target compounds in raw water compared to frequencies of quantification
Of note, the TPs of chlorothalonil (banned in France since 2020), namely chlorothalonil R4711811 and chlorothalonil R471888, of atrazine (banned in France since 2003), namely desethylatrazine (DEA), desethyldesisopropylatrazine (DEDIA) and 2-hydroxy-atrazine, of metolachlor (withdrawn for its main uses in progress since 2023), namely metolachlor ESA, metolachlor OXA, metolachlor NOA and metolachlor CGA368208, of metazachlor, namely metazachlor ESA and metazachlor OXA were quantified in more than 10% of raw waters. With the exception of chlorothalonil R4711811 (0.140 µg.L−1) and metolachlor NOA (0.1 µg.L−1), median concentrations of individual TPs did not exceed 0.1 µg.L−1. The ratios between the occurrence of ASs and TPs varied, depending on the pesticide.
Herbicides of the chloroacetamide class (metolachlor, metazachlor and flufenacet) and all of their TPs represent a large proportion of the compounds quantified in the water samples studied here. In fact, chloroacetamides, used mainly on maize crops, which represent 11% of the agricultural area in France, and more broadly for pre- or post-emergence weed control, are one of the most widely used groups of herbicides. Punctual high concentrations have been observed, with some TP levels reaching up to 10 µg.L−1.
For the first time in France, large contamination of raw waters by TPs of chloratholonil was identified. Chloratholonil is a fungicide widely used on cereals and potatoes until 2020, date of its end of use, and it was the sixth most commonly used AS in France in 2018. It is therefore not surprising to find these TPs in almost all water bodies.
These results are consistent with recently published findings in Switzerland. In the Swiss study, eight metabolites of chlorothalonil (R611968, SYN507900, SYN548580, SYN548581, R417888, R419492, R471811 and an isomer of R417888) were detected in groundwater (Kiefer et al. 2019). Among these metabolites, R471811, R419492 and R417888, which belong to the group of sulfonic acids, tended to have a higher detection frequency and occurred in higher concentrations in Swiss groundwater than the phenols SYN548580, SYN507900 and R611968 (Kiefer et al. 2019). Despite the ban of the chlorothalonil in 2020, it is probably justified to include this compound in the routine monitoring programme of waterbodies in France, and to carry out ecological and health safety risk assessment analysis.
Prosulfocarb, the main approved and most commonly used thiocarbamate herbicide in France (in terms of tonnage) is characterised by low solubility in water (13.2 mg/L), moderate polarity (logP 4.48), potencies for volatilisation and vapour drift and low leachability (GUS 0.76). The very low contamination observed in our study is consistent with other previously published findings in France (NAÏADES database 2024; Slaby et al. 2022), Cyprus (Nikolaou et al. 2017) and Germany (Halbach et al. 2021). To date, to the authors’ knowledge, no published study has addressed the monitoring of its minor soil metabolite prosulfocarb sulfoxide in European raw waters. Despite the potential for groundwater exposure via the intended uses above the parametric drinking water limit of 0.1 µg.L−1 for parent prosulfocarb and its minor soil metabolite prosulfocarb sulfoxide, the risk was considered to be low in peer review risk assessment (European Food Safety Authority 2007). Its extensive use has led to the recommendation to include these ASs and TPs in regulatory monitoring.
Raw waters in France still display strong impregnation by triazines, specifically atrazine and its TPs, DEA and DEDIA, as well as terbuthylazine and its TPs. The preferential occurrence of atrazine and its metabolites (DEA, desisopropylatrazine (DIA) and DEDIA) in groundwater was highlighted by our results. This appears to reflect a trend towards depletion of AS stocks by leaching migration and transformation processes in deeper soil layers (Bhatti et al. 2022; Buhler et al. 1993; Novak et al. 1998). Terbuthylazine-desethyl and terbuthylazine-hydroxy have been included in regulatory monitoring for many years, but this is not the case for the TPs LM2, LM3, LM4, LM5 and LM6. In our study, eight TPs of terbuthylazine were monitored for the first time in raw waters intended for drinking water production. The results highlight the wide occurrence of LM6 (frequency of quantification (FQ): 7.3% med C = 0.048 µg.L−1), LM3 (FQ: 1% med C = 0.053 µg.L−1) and to a lesser extent LM5 (FQ: 4.3% med C = 0.030 µg.L−1) and LM2 (only one detection, but at a concentration of 0.27 µg.L−1). Very recently, Nanusha et al. (2023) observed wide contamination of Danish groundwater by tertuthylazine LM6, LM5, and -desethyl-hydroxy with detection frequencies reaching up to 60%. Kiefer et al. (2019), as for them, observed wide contamination of water in Switzerland by LM2, LM3, LM5 and LM6, which were detected in 80–90% of samples, with 90th percentile concentrations ranging from 6.4 to 54 ng/L. These observations are also consistent with certain previously reported results for aquifers in Italy (Valsecchi et al. 2017). The preliminary findings from our work legitimate the recommendation to include LM2, LM3, LM5 and LM6 in regulatory monitoring.
Chloridazon was quantified in fewer than 2% of samples, with a median concentrations 0.006 µg.L−1. Its two main TPs, MeDPC and DPC, were found in 16.6% and 5% of samples, at median concentrations of 0.041 µg.L−1 and 0.670 µg.L−1, respectively. Chloridazon is a pyridazinone herbicide characterised by moderate solubility in water (422 mg/L), low polarity (Log P 1.29), moderate persistence in soils and transition state from soils (GUS 2.16). On the contrary, DPC and MeDPC display high leachability from soils, as shown by their GUS (5.46 and 4.39, respectively). Chloridazon, banned in 2021, exclusively applied on beetroot fields and at much lower quantities (300 tons in 2018), had its TP MeDPC quantified in all beetroot-growing départements from France. DPC was quantified at a lower frequency in these départements, probably due to its LOQ of 0.2 µg.L−1 (LOQ of MeDPC = 0.010 µg.L−1).
These results are in line with previously published data that demonstrated the prevalence and relevance for routine regulatory monitoring of TPs of chloridazon (Menger et al. 2021).
Importantly, because of scarce results on the contamination of soils by pesticides and their TPs at national scales, it is not possible to establish links between uses, soil contamination and contamination of water resources. The findings support the conclusion that Froger et al. (2023) arrived at, to consider pesticides and their residues in the construction of future regulations on soil protection, and particularly the European Soil Health Law currently being discussed.
For a better understanding of the occurrence and fate of pesticides, a pairwise correlation matrix of concentrations has been constructed to help identify the compounds most likely to be found concomitantly in raw waters, and thus potentially identify certain indicators or patterns of substances to be recommended for routine regulatory monitoring. A pairwise correlation matrix for all the concentrations compiled to derive the compounds quantified in more than 20 samples (except for DPC due to its high LOQ)—raw waters type relationships—is presented in Fig. 4. The direction and magnitude of the correlation coefficient are indicated by the colour of the cell: the darker the colour, the stronger the correlation. Blue cells indicate positive correlations, and red cells indicate negative correlations. This represents a total 27 compounds, 22 TPs and 5 ASs.
Fig. 4.

Pairwise correlation between pesticide concentrations quantified in groundwater and surface water
At first glance, better correlations can be observed in groundwater than in surface water. It should also be noted that only surface waters present significant negative correlations.
Whether in groundwater or surface water,
Chlorothalonil TPs (R471811 and 417888) are positively correlated with each other, with a greater correlation in groundwater (r ranging from 0.5 to 0.9). Chloridazon TPs (MeDPC and DPC) are positively correlated with each other with a greater correlation in groundwater (r = 0.9). Furthermore, correlation between the metabolites of both ASs is also observed. These compounds correspond to recently banned active substances.
Metolachlor TPs and metolachlor are positively correlated, with a greater correlation in surface waters. Terbuthylazine metabolites and AS are positively correlated, with a greater correlation in surface waters compared to groundwaters. These compounds correspond to ASs that are still approved.
In surface waters, negative correlations were observed between TPs from banned ASs (atrazine, chloridazon, alachlor and acetochlor) and ASs and TPs of active substances that are still approved (metazachlor, metolachlor and terbuthylazine). Nevertheless, the correlation coefficients, r, are close to 0 (ranging from − 0.1 to − 0.3) indicating very weak negative linear relationships. It may require additional work to better assess the connections between compounds. A positive correlation was observed between dimethenamid ESA, and terbuthylazine and its TPs in surface waters (r > 0.6), and to a lesser extent with metolachlor and its TPs (r = 0.4).
Furthermore, a positive correlation between dimethenamid ESA and terbuthylazine and its TPs was observed (r ranging from 0.5 to 0.6), and to a lesser extent with metolachlor and its TPs. On the contrary, a negative correlation was observed between dimethachlor CGA369873 and metolachlor and its TPs, and to a lesser extent its terbuthylazine TPs (r ranging from − 0.1 to − 0.2).
In groundwater, a highly significant positive correlation was found between dimethachlor ESA, dimethachlor CGA 369873, dimethenamid ESA, flufenacet ESA and metazachlor and its TPs (r ranging from 0.6 to 0.9). All these compounds are either chloroacetanilide herbicides or derived from them, widely used on major crops as wheat, rapeseed, barley, corn and sunflower, often in rotation. The hypothesis of co-uses of the ASs or co-formulation, such as metazachlor in formulation with dimethenamid-P, and common scheme of degradation, can be made.
No correlations were demonstrated between terbuthylazine and its TPs and metolachlor and its TPs in groundwater, while positive correlations were observed in surface water.
A moderate positive correlation between atrazine and its TPs was observed in groundwater.
Relative abundances of TPs from chlorothalonil and metalochlor (the most frequently quantified TPs) were estimated in surface water and groundwater, and are presented in Fig. 5. We observed that chlorothalonil R417888 and R182281 have higher contribution in groundwater than in surface water. According to the EFSA peer review of chlorothalonil (European Food Safety Authority 2018), both have high mobility but R417888 is more persistent and predominately formed under anaerobic conditions in soil than R471811. Concerning metolachlor TPs, there is a noticeably higher relative abundance of metolachlor ESA in groundwater. Metolachlor peer review from EFSA (European Food Safety Authority 2023) highlights that metolachlor degradation in soil produces more ESA than OXA, and metolachlor ESA is more mobile in soil than OXA.
Fig. 5.

Relative abundances of transformation products from chlorothalonil and metolachlor in surface and groundwater
Pesticides and their transformation products in drinking water
Among the 145 investigated compounds, 73 were quantified at least once in tap water, 19 were ASs and 54 TPs (Fig. 1b). Herbicides were the most frequently quantified in tap water, as observed for raw water. In all, 70% of the target herbicide ASs and TPs were measured at least once in tap water. All compounds quantified in drinking water were also quantified in raw water, and no significant increase in metabolites was observed through treatment processes.
Quantified compounds in tap water can be classified according to different levels of interest. The substances of greatest interest based on this study are highlighted in red squares in Fig. 6. These substances, corresponding to 90th percentile of their concentrations up to 0.100 µg.L−1 and measured in more than 10% of the drinking water samples (n = 30), are all TPs. Among these, 10 TPs, metabolites of chloroacetanilides (acetochlor ESA, alachlor ESA, metazachlor ESA, and metolachlor ESA and OXA), are known to be far more mobile, more persistent and more resistant to treatment processes than the parent compounds (Farlin et al. 2018; Gustafson et al. 2003; Verstraeten et al. 2002).
Fig. 6.

90th percentile of the concentration of compounds quantified in more than 5% of drinking waters versus frequency of quantification. ASs are represented by red dots
To our knowledge, dimethachlor CGA369873, as well as chlorothalonil R471811 and R417888, have been quantified in this study in drinking water in France for the first time. It should be emphasised that the most frequently quantified metabolites generally correspond to predicted concentrations of high concern, according to EFSA evaluations. This is particularly the case for chlorothalonil R471811, R41788, metazachlor ESA and desphenyl-chloridazon which have predicted concentrations exceeding 10 µg.L−1 in groundwater and are considered major TPs in soils. For dimethachlor CGA369873, concentrations are expected to exceed 0.1 µg.L−1 in groundwater (European Food Safety Authority 2008). These observations underline the importance in deploying early TP surveillance in connection with EFSA assessments.
The second class, in orange, presents moderate interest. It brings together compounds that have high concentrations (greater than 0.1 µg.L−1) and low frequencies of quantification (flufenacet ESA, metazachlor OXA, metolachlor NOA and terbuthylazine LM6), or conversely high frequencies of quantification (15 to 20%) with low concentrations. This is the case for atrazine and its metabolite desethyl-atrazine. Again here, this finding underlines strong persistence and broad contamination by atrazine, a substance banned over 20 years ago. DEDIA, which is an ultimate TP of atrazine and other triazines, is more worrying with high FQ and high concentrations.
The last class, in green, concerns compounds of low interest. They are all TPs, with the exception of metolachlor.
Maximum concentrations in drinking water were measured for DPC (9.8 µg.L−1), metolachlor ESA (3.1 µg.L−1) and chlorothalonil R471811 (2.0 µg.L−1).
A total of 12 TPs that were not part of regulatory control were quantified for the first time in more than 1% of samples. Among them, chlorothalonil SYN507900, metolachlor CGA 357704, metolachlor CGA 368208, sedaxane M02 and terbuthylazine LM5 never exceeded the threshold value of 0.1 µg.L−1, whereas the other seven TPs (chlorothalonil R471811, R417888, R182281, terbuthylazine LM6, phthalamic acid, phthalic acid and saccharin) exceeded 0.1 µg.L−1 at least once. The guideline value of 0.1 µg.L−1 is taken as a reference, regardless of the relevance of each TP that is evaluated and managed in each country.
Table 1 shows the frequencies of exceeding 0.1 µg.L−1 and the maximum concentrations measured in tap water. Chlorothalonil R471811, metabolite of the fungicide chlorothalonil, banned from use in France since 2020, was the most frequently quantified compound (57% of positive samples) and had the highest frequency of exceeding 0.1 µg.L−1 (34%). AS chlorothalonil was not analysed in this campaign as it requires specific analytical conditions and cannot be included in this type of multiresidue analytical method. However, the AS is regularly monitored through regulatory control in France and does not lead to non-compliance (Direction Générale de la Santé 2022, 2023).
Table 1.
Results obtained for drinking water
| Compounds | FQ > 0.1 µg.L−1 | Max (µg.L−1) | LOQ (µg.L−1) |
|---|---|---|---|
| Chlorothalonil R471811 | 34.1% | 2.000 | 0.020 |
| Metolachlor ESA | 13.0% | 3.100 | 0.005 |
| Metazachlor ESA | 5.0% | 1.500 | 0.020 |
| Chlorothalonil R417888 | 3.7% | 0.310 | 0.020 |
| Alachlor ESA + Acetochlor ESA | 3.3% | 1.800 | 0.010 |
| DPC | 3.3% | 9.800 | 0.200 |
| Phthalic acid | 3.0% | 1.100 | 0.200 |
| MeDPC | 2.7% | 1.800 | 0.010 |
| Dimethachlor CGA369873 | 2.3% | 0.460 | 0.010 |
| DEA | 2.0% | 0.150 | 0.010 |
| DEDIA | 2.0% | 0.210 | 0.020 |
| Phthalamic acid | 1.3% | 1.100 | 0.200 |
| Terbuthylazine LM6 | 1.0% | 0.260 | 0.020 |
| Phthalimide | 1.0% | 1.900 | 0.200 |
| Flufenacet ESA | 0.7% | 0.800 | 0.005 |
| Metolachlor | 0.7% | 0.210 | 0.005 |
| Bentazone | 0.7% | 0.210 | 0.005 |
| Chlorothalonil R182281 | 0.7% | 0.200 | 0.005 |
| Flufenacet | 0.7% | 1.200 | 0.005 |
| Flufenacet OXA | 0.7% | 0.400 | 0.010 |
| Saccharine | 0.3% | 0.260 | 0.020 |
| Terbumeton-desethyl | 0.3% | 0.230 | 0.005 |
| Metazachlor | 0.3% | 0.290 | 0.005 |
| Terbuthylazine-desethyl | 0.3% | 0.130 | 0.005 |
| Terbuthylazine | 0.3% | 0.110 | 0.005 |
| Boscalid | 0.3% | 0.310 | 0.005 |
| Epoxyconazole | 0.3% | 0.150 | 0.005 |
| Dimethachlor OXA | 0.3% | 0.430 | 0.050 |
| Terbuthylazine LM2 | 0.3% | 0.190 | 0.050 |
Active substances—Transformation products
Metolachlor ESA was also quantified in more than 50% of the sample. However, this TP exceeded 0.1 µg.L−1 for only 13% of samples. Other major metabolites of metolachlor, namely metolachlor OXA and metolachlor NOA, were less frequently quantified and were always below the guideline value.
Metazachlor ESA, chlorothalonil R417888, alachlor ESA plus acetochlor ESA, chloridazon-methyl-desphenyl and chloridazon-desphenyl were the next compounds frequently exceeding 0.1 µg.L−1, for 3 to 5% of the samples.
Atrazine metabolites DEA and DEDIA, which are also monitored in regular control, presented frequencies of quantification greater than 0.1 µg.L−1 in 2%. These results are consistent with those of Guillon et al. (2019) who highlighted the predominance and ubiquity of these TPs.
Previous studies mentioned that chloridazon TPs are often measured in higher concentrations than the parent compound (Kiefer et al. 2019). In this national campaign, chloridazon was quantified only five times and always under 0.1 µg.L−1, whereas MeDPC and DPC were quantified in 31 and 10 drinking water samples, respectively with 2.7% and 3.3% exceedance of 0.1 µg.L−1. These results are convergent with those from Schüle et al. (2008) who revealed frequent quantified results for these compounds among 263 drinking waters. It is worth noting that DPC presents some analytical difficulties and its LOQ was 0.2 µg.L−1. Thus, the FQ exceeding 0.1 µg.L−1 is underestimated for this parameter, as well as for folpel and phosmet TPs phthalic acid, phthalamic acid and phthalimide.
Phytopharmaceutical products containing terbuthylazine were recently re-approved in France. Certain TPs such as desethyl-terbuthylazine, hydroxy-terbuthylazine and desethyl-hydroxy-terbuthylazine are regularly monitored through regulatory monitoring. However, EFSA reports the possible presence of other less well-known metabolites identified with the acronyms LM1 to LM6 (European Food Safety Authority 2011). Only a few recent studies have confirmed, like ours, the presence of LM2, LM5 and LM6 in groundwater in Switzerland and in ground and drinking waters in Italy (Kiefer et al. 2019; Polesello et al. 2017).
Figure 7 focuses on the most quantified ASs and TPs. It summarises the extent of concentrations measured for ASs and for the sum of the produced TPs. In all cases, with the exception of flufenacet, concentrations of TPs were higher than concentrations of associated ASs. Concerning flufenacet, it cannot be ruled out that other TPs, such as TFA, may be present. Clearly, the findings shown in Fig. 7 illustrate the importance of monitoring TPs, which are more frequently detected and in higher concentrations than the corresponding AS.
Fig. 7.

Concentrations of ASs compared to the sum of TP concentrations from a same AS in all drinking water samples (the number of TPs is indicated in parentheses). Boxplots define medians, first and third quartiles and maximum and minimum concentrations. LOQs are shown in green and frequencies of quantification are given on the x axis. NA, not analysed
In this study, the absence of ASs was regularly observed, whereas their TPs were measured at high concentrations. This can be explained by the very low to moderate half-lives (i.e. from a few days to a few weeks) of active substances such as chlorothalonil, chloridazon, metolachlor and metazachlor. These results are consistent with EFSA’s peer review of the pesticide risk assessment of these substances (European Food Safety Authority 2008, 2011, 2018, 2023).
Raw water and drinking water balance
The aim of this work was not to study the elimination of pesticides in drinking water treatment plants (DWTP). Further sampling and investigations (understanding of treatment processes and taking into account residence time) would have been necessary to assess the behaviour of molecules. As a first state, it is important to emphasise that TPs are already present in raw water prior to any treatment. No production of TPs was observed during water treatment, while a moderate treatment capacity of DWTPs was noted (Fig. 8 and Figure S2), as evidenced by higher FQ in raw water compared to drinking water.
Fig. 8.

Frequency of quantification of compounds in raw and drinking water as a function of XLogP3 (logP predicted by the PubChem database). ASs in red and TPs in black
Overall, it can be observed that ASs (in red) revealed generally lower quantitation frequencies in drinking water than in raw water. Prosulfocarb, bentazone, flufenacet, metolachlor, chlorotoluron, metazachlor and terbuthylazine are less polar than TPs and seem to be removed through DWTPs (Fig. 8).
On the other hand, for TPs such as chlorothalonil R471811 and metolachlore ESA, poor efficiency of DWTPs seemed to be demonstrated (considering quantitation frequencies only) consistent with polarity, and therefore high mobility of these compounds, as reflected in findings reported by Kiefer et al. (2020).
Concerning chlorothalonil or metolachlor TPs, the most frequently quantified compounds, only advanced processes such as reverse osmosis or activated carbon filtration could display some effectiveness (Gustafson et al. 2003; Kiefer et al. 2020; Verstraeten et al. 2002).
Most purification treatment of water in France implements a simple disinfection step (by chlorination) that is recognised to be inefficient to degrade these TPs. However, some compounds could be reactive to chlorine and likely to degrade in drinking water networks or form organo-chlorinated by-products (Pinkston and Sedlak 2004). This is particularly the case for compounds with amine functions, such as DPC, MeDPC and chlorothalonil R471811. This reaction may induce an apparent efficiency of DWTPs, as we occasionally observed in our study. This transformation is likely to occur more frequently in drinking water distribution networks with increasing contact time with chlorine and may require further work. The fate of pesticides and TPs in DWTPs has recently been taken into account through a guideline from ECHA and EFSA (European Chemicals and European Food Safety 2023) and will gradually be integrated into EFSA assessment of pesticides.
Atrazine, banned for over 20 years, is still today the AS most often quantified in drinking water. Moderate removal efficiency is observed for atrazine TPs, and these results are in line with observations from Guillon et al. (2019) who demonstrated elimination of these metabolites with clarification and granular activated carbon treatment.
Conclusions
This work established for the first time in France an extensive inventory of contamination by pesticide transformation products and active substances in drinking waters. With more than 600 samples collected over two years and nearly 100,000 results available, population exposure to pesticides through water consumption could be assessed, even though it may be necessary to track trends over time for compounds with the highest concentrations.
In this type of study, one of the difficulties is the lack of availability of certain commercial analytical standards. This issue was addressed through supply of standard solutions from industrial companies.
Among the 157 transformation products and active substances of interest, 89 were quantified at least once. Both groundwater and surface water are contaminated by these compounds. The frequencies of quantification were relatively similar in raw water and tap water, which seems to point to poor efficiency of most DWTPs.
Transformation products are generally more frequently quantified than the corresponding active substance, which confirms the value of focusing on them and not only on the parent compound. Among TPs, chlorothalonil R471811 and metolachlor ESA were the most frequently quantified compounds, with more than 50% quantification in drinking water. It is worth highlighting that the most frequently quantified metabolites generally correspond to predicted scenario according to EFSA evaluation.
To our knowledge, some TPs, such as dimethachlor CGA369873, as well as chlorothalonil R471811 and R417888, were monitored for the first time in drinking water in France in this study. Concentrations exceeding the regulatory quality standard of 0.1 µg.L−1 were observed in more than one of three drinking water samples for chlorothalonil R471811.
Our research also highlights the presence of transformation products several years after the parent compounds were withdrawn from the market and illustrates their strong persistence in water systems. More broadly, through this study, the need for more integrative and systematic monitoring of soils and aquatic compartments is underlined, to sustain the characterisation and understanding of pesticide pressure on water resources, especially groundwaters, as requested to better characterise the exposome.
Furthermore, the results of this study illustrate the need for an iterative approach to surveillance (regulatory surveillance as well as surveillance by water suppliers) and allow prioritisation of work for health safety risk assessment. This work also revealed the need for a better understanding of the effects of chlorine on certain compounds, and to explore the fate of these compounds in distribution networks. Additional research is underway to assess the efficiency of DWTPs, and to better assess seasonal variations.
Finally, this work advocates for the need to change the paradigm by switching from a posteriori monitoring to early-stage preventive monitoring of TPs from newly approved substances, as Sjerps et al. (2019) did in drinking water sources in the Netherlands.
Supplementary Information
Below is the link to the electronic supplementary material.
Acknowledgements
We would like to thank the departmental and regional Ministry of Health personnel (respectively Délégation Territoriale and Agence Régionale de la Santé) for their invaluable contributions to this work by sampling water, as well as their helpful comments and continued support. This work was carried out through the cooperative efforts of the ANSES staff at the Nancy Laboratory for Hydrology, with a particular mention for Marie-Christelle Clavos, Guillaume Farré, Caroline Hollard, Sophie Lardy-Fontan, Jean-Sébastien Py and Christophe Rosin.
Author contribution
The study was conceptualised and designed by Laure Pasquini, Sophie Lardy-Fontan and Christophe Rosin. Material preparation, data collection and analysis were performed by Laure Pasquini. The first draft of the manuscript was written by Laure Pasquini, and Sophie Lardy-Fontan and Christophe Rosin commented on previous versions of the manuscript. All authors read and approved the final manuscript.
Funding
This study was supported by the French Ministry of Health.
Data availability
The authors declare that the data supporting the findings of this study are available within the paper and its Supplementary Information files. Should any raw data files be needed in another format they are available from the corresponding author upon reasonable request.
Declarations
Ethical approval
Not applicable.
Consent to participate
Not applicable.
Consent for publication
Not applicable.
Competing interests
The authors declare no competing interests.
Footnotes
Publisher's Note
Springer Nature remains neutral with regard to jurisdictional claims in published maps and institutional affiliations.
References
- AFNOR (2016) XP CEN/TS 16800 - Lignes directrices pour la validation des méthodes d'analyse physico-chimiques. AFNOR, Paris, p 62
- AFNOR (2017) NF EN ISO/IEC 17025 - Exigences générales concernant la compétence des laboratoires d'étalonnages et d'essais. AFNOR, Paris, p 43
- AFNOR (2018) NF T90–210 - Qualité de l'eau - Protocole d'évaluation initiale des performances d'une méthode dans un laboratoire. AFNOR, Paris, p 60
- Anagnostopoulou K, Nannou C, Evgenidou E, Lambropoulou D (2022) Overarching issues on relevant pesticide transformation products in the aquatic environment: a review. Sci Total Environ 815:152863. 10.1016/j.scitotenv.2021.152863 [DOI] [PubMed] [Google Scholar]
- Arp HPH, Hale SE (2022) Assessing the persistence and mobility of organic substances to protect freshwater resources. ACS Environ Au 2(6):482–509. 10.1021/acsenvironau.2c00024 [DOI] [PMC free article] [PubMed] [Google Scholar]
- Bach C, Rosin C, Munoz J-F, Dauchy X (2020) National screening study investigating nine phthalates and one adipate in raw and treated tap water in France. Environ Sci Pollut Res 27(29):36476–36486. 10.1007/s11356-020-09680-6 [DOI] [PubMed] [Google Scholar]
- Bach C, Boiteux V and Dauchy X (2024) Occurrence in France of 1,4-dioxane, an emerging pollutant of high concern in drinking water. 10.21203/rs.3.rs-3903273/v1
- Baran N, Mouvet C, Négrel P (2007) Hydrodynamic and geochemical constraints on pesticide concentrations in the groundwater of an agricultural catchment (Brévilles, France). Environ Pollut 148(3):729–738. 10.1016/j.envpol.2007.01.033 [DOI] [PubMed] [Google Scholar]
- Baran N, Surdyk N, Auterives C (2021) Pesticides in groundwater at a national scale (France): impact of regulations, molecular properties, uses, hydrogeology and climatic conditions. Sci Total Environ 791:148137. 10.1016/j.scitotenv.2021.148137 [DOI] [PubMed] [Google Scholar]
- Baran N, Rosenbom AE, Kozel R, Lapworth D (2022) Pesticides and their metabolites in European groundwater: comparing regulations and approaches to monitoring in France, Denmark, England and Switzerland. Sci Total Environ 842:156696. 10.1016/j.scitotenv.2022.156696 [DOI] [PubMed] [Google Scholar]
- Barriuso E, Calvet R, Schiavon M, Soulas G (1996) Les pesticides et les polluants organiques des sols : transformations et dissipation. Étude Et Gestion des Sols 3(4):279–295 [Google Scholar]
- Bhatti P, Duhan A, Pal A, Monika BRK, Kumawat P, Yadav DB (2022) Ultimate fate and possible ecological risks associated with atrazine and its principal metabolites (DIA and DEA) in soil and water environment. Ecotoxicol Environ Saf 248:114299. 10.1016/j.ecoenv.2022.114299 [DOI] [PubMed] [Google Scholar]
- Bilal M, Iqbal HMN, Barceló D (2019) Persistence of pesticides-based contaminants in the environment and their effective degradation using laccase-assisted biocatalytic systems. Sci Total Environ 695:133896. 10.1016/j.scitotenv.2019.133896 [DOI] [PubMed] [Google Scholar]
- Bonmatin J-M, Giorio C, Girolami V, Goulson D, Kreutzweiser D, Krupke C, Liess M, Long E, Marzaro M, Mitchell E, Noome D, Simon-Delso N, Tapparo A (2014) Environmental fate and exposure; neonicotinoids and fipronil. Environ Sci Pollut Res Int 22:35–67. 10.1007/s11356-014-3332-7 [DOI] [PMC free article] [PubMed] [Google Scholar]
- Buhler DD, Randall GW, Koskinen WC, Wyse DL (1993) Atrazine and alachlor losses from subsurface tile drainage of a clay loam soil. J Environ Qual 22(3):583–588. 10.2134/jeq1993.00472425002200030024x [Google Scholar]
- Buttiglieri G, Peschka M, Frömel T, Müller J, Malpei F, Seel P, Knepper TP (2009) Environmental occurrence and degradation of the herbicide n-chloridazon. Water Res 43(11):2865–2873. 10.1016/j.watres.2009.03.035 [DOI] [PubMed] [Google Scholar]
- Colin A, Bach C, Rosin C, Munoz J-F, Dauchy X (2014) Is drinking water a major route of human exposure to alkylphenol and bisphenol contaminants in France? Arch Environ Contam Toxicol 66(1):86–99. 10.1007/s00244-013-9942-0 [DOI] [PubMed] [Google Scholar]
- Direction Générale de la Santé (2015) BILAN DE LA QUALITE DE L'EAU AU ROBINET DU CONSOMMATEUR VIS-A-VIS DES PESTICIDES EN 2013. Direction Générale de la Santé, Paris
- Direction Générale de la Santé (2022) BILAN DE LA QUALITE DE L'EAU AU ROBINET DU CONSOMMATEUR VIS-A-VIS DES PESTICIDES EN 2021. Direction Générale de la Santé, Paris
- Direction Générale de la Santé (2023) BILAN DE LA QUALITE DE L'EAU AU ROBINET DU CONSOMMATEUR VIS-A-VIS DES PESTICIDES EN 2022. Direction Générale de la Santé, Paris
- EauFrance (2021) BNV-D Traçabilité - Données sur les ventes de produits phytopharmaceutiques. Eaufrance, Paris
- EURL (2017) SANTE/11813/2017 - Guidance document on analytical quality control and method validation procedures for pesticide residues and analysis in food and feed. EU Reference Laboratories for Residues of Pesticides, Stuttgart, p 46
- European Chemicals A, European Food Safety A (2023) Guidance document on the impact of water treatment processes on residues of active substances or their metabolites in water abstracted for the production of drinking water. EFSA J 21(8):e08194. 10.2903/j.efsa.2023.8194 [DOI] [PMC free article] [PubMed] [Google Scholar]
- European Food Safety Authority (2007) Conclusion regarding the peer review of the pesticide risk assessment of the active substance prosulfocarb. EFSA J 5(8):111r. 10.2903/j.efsa.2007.111r [DOI] [PMC free article] [PubMed] [Google Scholar]
- European Food Safety Authority (2008) Conclusion regarding the peer review of the pesticide risk assessment of the active substance dimethachlor. EFSA J 6(10):169r. 10.2903/j.efsa.2008.169r [DOI] [PMC free article] [PubMed] [Google Scholar]
- European Food Safety Authority (2011) Conclusion on the peer review of the pesticide risk assessment of the active substance terbuthylazine. EFSA J 9(1):1969. 10.2903/j.efsa.2011.1969 [Google Scholar]
- European Food Safety Authority (2018) Peer review of the pesticide risk assessment of the active substance chlorothalonil. EFSA J 16(1):e05126. 10.2903/j.efsa.2018.5126 [DOI] [PMC free article] [PubMed] [Google Scholar]
- European Food Safety Authority (2023) Peer review of the pesticide risk assessment of the active substance S-metolachlor excluding the assessment of the endocrine disrupting properties. EFSA J 21(2):e07852. 10.2903/j.efsa.2023.7852 [DOI] [PMC free article] [PubMed] [Google Scholar]
- European Union (2020) Directive (EU) 2020/2184 on the quality of water intended for human consumption., Official Journal of the European Union L 435, pp 1–62. http://data.europa.eu/eli/dir/2020/2184/oj
- Farlin J, Gallé T, Bayerle M, Pittois D, Köppchen S, Krause M, Hofmann D (2018) Breakthrough dynamics of s-metolachlor metabolites in drinking water wells: transport pathways and time to trend reversal. J Contam Hydrol 213:62–72. 10.1016/j.jconhyd.2018.05.002 [DOI] [PubMed] [Google Scholar]
- Froger C, Jolivet C, Budzinski H, Pierdet M, Caria G, Saby NPA, Arrouays D, Bispo A (2023) Pesticide residues in French soils: occurrence, risks, and persistence. Environ Sci Technol 57(20):7818–7827. 10.1021/acs.est.2c09591 [DOI] [PMC free article] [PubMed] [Google Scholar]
- Gallé T, Bayerle M, Pittois D (2022) Geochemical matrix differently affects the response of internal standards and target analytes for pesticide transformation products measured in groundwater samples. Chemosphere 307:135815. 10.1016/j.chemosphere.2022.135815 [DOI] [PubMed] [Google Scholar]
- Gourcy L, Baran N, Vittecoq B (2009) Improving the knowledge of pesticide and nitrate transfer processes using age-dating tools (CFC, SF6, 3H) in a volcanic island (Martinique, French West Indies). J Contam Hydrol 108(3):107–117. 10.1016/j.jconhyd.2009.06.004 [DOI] [PubMed] [Google Scholar]
- Gru Y, Colin R, Le Cloirec P (2010) Investigation of matrix effects for some pesticides in waters by on-line solid-phase extraction-liquid chromatography coupled with triple quadrupole linear ion-trap mass spectrometry and the use of postcolumn introduction. J AOAC Int 93(3):1020–1031. 10.1093/jaoac/93.3.1020 [PubMed] [Google Scholar]
- Guillon A, Videloup C, Leroux C, Bertin H, Philibert M, Baudin I, Bruchet A, Esperanza M (2019) Occurrence and fate of 27 triazines and metabolites within French drinking water treatment plants. Water Sci Technol: Water Supply 19(2):463–471. 10.2166/ws.2018.091 [Google Scholar]
- Gustafson D (1989) Groundwater ubiquity score: a simple method for assessing pesticide leachability. Environ Toxicol Chem 8:339–357. 10.1002/etc.5620080411 [Google Scholar]
- Gustafson DI, Carr KH, Carson DB, Fuhrman JD, Hackett AG, Hoogheem TJ, Snoeyink VL, Curry M, Heijman B, Chen S, Hertl P, Van Wesenbeeck I (2003) Activated carbon adsorption of chloroacetanilide herbicides and their degradation products from surface water supplies. J Water Supply: Res Technol - AQUA 52(6):443–454. 10.2166/aqua.2003.0041 [Google Scholar]
- Guzzella LM, Paolis AD, Bartone CR, Pozzoni F, Giuliano G (1996) Migration of pesticide residues from agricultural soil to groundwater. Int J Environ Anal Chem 65:261–275 [Google Scholar]
- Halbach K, Möder M, Schrader S, Liebmann L, Schäfer RB, Schneeweiss A, Schreiner VC, Vormeier P, Weisner O, Liess M, Reemtsma T (2021) Small streams–large concentrations? Pesticide monitoring in small agricultural streams in Germany during dry weather and rainfall. Water Res 203:117535. 10.1016/j.watres.2021.117535 [DOI] [PubMed] [Google Scholar]
- Harmon O’Driscoll J, Siggins A, Healy MG, McGinley J, Mellander PE, Morrison L, Ryan PC (2022) A risk ranking of pesticides in Irish drinking water considering chronic health effects. Sci Total Environ 829:154532. 10.1016/j.scitotenv.2022.154532 [DOI] [PubMed] [Google Scholar]
- Hintze S, Glauser G, Hunkeler D (2020) Influence of surface water – groundwater interactions on the spatial distribution of pesticide metabolites in groundwater. Sci Total Environ 733:139109. 10.1016/j.scitotenv.2020.139109 [DOI] [PubMed] [Google Scholar]
- International Organization for Standardization (2019) ISO 21253–1:2019 - Qualité de l'eau — Méthodes d'analyse de composés multi-classes — Partie 1: Critères pour l'identification de composés cibles par chromatographie en phase gazeuse ou liquide et spectrométrie de masse. ISO, Genève, p 60
- Jorfi S, Rahim F, Rahmani AR, Jaafarzadeh N, Ghaedrahmat Z, Almasi H, Zahedi A (2021) Herbicide residues in water resources: a scoping review. Avicenna J Environ Health Eng 8:126–133 [Google Scholar]
- Kiefer K, Müller A, Singer H, Hollender J (2019) New relevant pesticide transformation products in groundwater detected using target and suspect screening for agricultural and urban micropollutants with LC-HRMS. Water Res 165:114972. 10.1016/j.watres.2019.114972 [DOI] [PubMed] [Google Scholar]
- Kiefer K, Bader T, Minas N, Salhi E, Janssen EML, von Gunten U, Hollender J (2020) Chlorothalonil transformation products in drinking water resources: widespread and challenging to abate. Water Res 183:116066. 10.1016/j.watres.2020.116066 [DOI] [PubMed] [Google Scholar]
- Kolpin DW, Battaglin WA, Meyer MT, Schnoebelen DJ, Kalkhoff SJ (2004) Pesticide degradates: monitoring and occurrence. In: Proceedings of International symposium on pesticides, their degradates, and adjuvants, Prague
- Lapworth DJ, Baran N, Stuart ME, Manamsa K, Talbot J (2015) Persistent and emerging micro-organic contaminants in Chalk groundwater of England and France. Environ Pollut 203:214–225. 10.1016/j.envpol.2015.02.030 [DOI] [PubMed] [Google Scholar]
- Lopez B, Ollivier P, Togola A, Baran N, Ghestem J-P (2015) Screening of French groundwater for regulated and emerging contaminants. Sci Total Environ 518–519:562–573. 10.1016/j.scitotenv.2015.01.110 [DOI] [PubMed] [Google Scholar]
- Mahai G, Wan Y, Xia W, Wang A, Shi L, Qian X, He Z, Xu S (2021) A nationwide study of occurrence and exposure assessment of neonicotinoid insecticides and their metabolites in drinking water of China. Water Res 189:116630. 10.1016/j.watres.2020.116630 [DOI] [PubMed] [Google Scholar]
- Masiá A, Campo J, Vázquez-Roig P, Blasco C, Picó Y (2013) Screening of currently used pesticides in water, sediments and biota of the Guadalquivir River Basin (Spain). J Hazard Mater 263:95–104. 10.1016/j.jhazmat.2013.09.035 [DOI] [PubMed] [Google Scholar]
- Menger F, Boström G, Jonsson O, Ahrens L, Wiberg K, Kreuger J, Gago-Ferrero P (2021) Identification of pesticide transformation products in surface water using suspect screening combined with national monitoring data. Environ Sci Technol 55(15):10343–10353. 10.1021/acs.est.1c00466 [DOI] [PMC free article] [PubMed] [Google Scholar]
- Morvan X, Mouvet C, Baran N, Gutierrez A (2006) Pesticides in the groundwater of a spring draining a sandy aquifer: temporal variability of concentrations and fluxes. J Contam Hydrol 87(3):176–190. 10.1016/j.jconhyd.2006.05.003 [DOI] [PubMed] [Google Scholar]
- NAÏADES database (2024) Données sur la qualité des eaux de surface. Office français de la biodiversité, Paris
- Nanusha MY, Frøkjær EE, Rüsz Hansen H, Bonde Rasmussen S, BruunNicolaisen J, Hansen M (2023) Explorative quantitative nontarget analysis reveals micropollutants in Danish groundwater. ACS ES&T Water 3(12):3992–4003. 10.1021/acsestwater.3c00403 [Google Scholar]
- Nikolaou S, Efstathiou P, Tiggiridou M, Arabatzis N, Piera Y, Aletrari M (2017) Monitoring of pesticides in drinking, surface and ground water of cyprus by liquid-liquid and solid phase extraction in combination with GC/MS and UPLC/MS/MS. J Water Resour Protect 9(10):1184–1198. 10.4236/jwarp.2017.910077 [Google Scholar]
- Novak S, Portal JM, Morel JL, Schiavon M (1998) Pesticide movement through the soil and dynamic of tranfer by water - Mouvement des produits phytosanitaires dans le sol et dynamique de transfert par l'eau. Comptes Rendus de l'Académie d'Agriculture de France 84(5):119-132
- Papadakis EN, Vryzas Z, Kotopoulou A, Kintzikoglou K, Makris KC, Papadopoulou-Mourkidou E (2015) A pesticide monitoring survey in rivers and lakes of northern Greece and its human and ecotoxicological risk assessment. Ecotoxicol Environ Saf 116:1–9. 10.1016/j.ecoenv.2015.02.033 [DOI] [PubMed] [Google Scholar]
- Pinkston KE, Sedlak DL (2004) Transformation of aromatic ether- and amine-containing pharmaceuticals during chlorine disinfection. Environ Sci Technol 38(14):4019–4025. 10.1021/es035368l [DOI] [PubMed] [Google Scholar]
- Polesello S, Valsecchi S, Rusconi M, Mazzoni M, Sala A, Longoni O, Rusconi M (2017) Diffusione e valutazione di rischio di LM6, metabolita non clorurato della terbutilazina, nelle falde acquifere/distribution and risk assessment of LM6, dechlorinated metabolite of terbuthylazine, in groundwater. Ingegneria dell’Ambiente 4:131. 10.14672/ida.v4i2.1144 [Google Scholar]
- Sarker A, Shin WS, Masud MAA, Nandi R, Islam T (2024) A critical review of sustainable pesticide remediation in contaminated sites: research challenges and mechanistic insights. Environ Pollut 341:122940. 10.1016/j.envpol.2023.122940 [DOI] [PubMed] [Google Scholar]
- Schuhmann A, Gans O, Weiss S, Fank J, Klammler G, Haberhauer G, Gerzabek MH (2016) A long-term lysimeter experiment to investigate the environmental dispersion of the herbicide chloridazon and its metabolites—comparison of lysimeter types. J Soils Sed 16(3):1032–1045. 10.1007/s11368-015-1311-3 [Google Scholar]
- Schüle E, Mack D, Schüler S, Wieland M (2008) Polar pesticide-metabolites in drinking and mineral water. In: European Pesticide Residue Workshop, Berlin
- Sjerps RMA, Kooij PJF, van Loon A, Van Wezel AP (2019) Occurrence of pesticides in Dutch drinking water sources. Chemosphere 235:510–518. 10.1016/j.chemosphere.2019.06.207 [DOI] [PubMed] [Google Scholar]
- Slaby S, Le Cor F, Dufour V, Auger L, Pasquini L, Cardoso O, Curtet L, Baudoin J-M, Wiest L, Vulliet E, Feidt C, Dauchy X, Banas D (2022) Distribution of pesticides and some of their transformation products in a small lentic waterbody: fish, water, and sediment contamination in an agricultural watershed. Environ Pollut 292:118403. 10.1016/j.envpol.2021.118403 [DOI] [PubMed] [Google Scholar]
- Syafrudin M, Kristanti RA, Yuniarto A, Hadibarata T, Rhee J, Al-Onazi WA, Algarni TS, Almarri AH, Al-Mohaimeed AM (2021) Pesticides in drinking water-a review. Int J Environ Res Public Health 18(2):468. 10.3390/ijerph18020468 [DOI] [PMC free article] [PubMed] [Google Scholar]
- Teysseire R, Barron E, Baldi I, Bedos C, Chazeaubeny A, Le Menach K, Roudil A, Budzinski H, Delva F (2023) Pesticide exposure of residents living in wine regions: protocol and first results of the Pestiprev study. Int J Environ Res Public Health 20(5):3882. 10.3390/ijerph20053882 [DOI] [PMC free article] [PubMed] [Google Scholar]
- Ulrich U (2022) Pesticides and their transformation products: transport, ecotoxicity and retention, Christian-Albrechts-Universität zu Kiel, Kiel
- Valsecchi S, Mazzoni M, Rusconi M, Polesello S, Sala A, Longoni O, Rusconi M (2017) Spread and risk assessment of LM6, a non-chlorinated metabolite of terbuthylazine, in groundwater (Diffusione e valutazione di rischio di LM6, metabolita non clorurato della terbutilazina, nelle falde acquifere). Ingegneria Dell’ambiente 4(2):131–141 [Google Scholar]
- Verlicchi P, Ghirardini A (2022) Contribution of land runoff to the release of pesticides into water bodies in arable areas. Handbook of environmental chemistry 113:225–249
- Verstraeten IM, Thurman EM, Lindsey ME, Lee EC, Smith RD (2002) Changes in concentrations of triazine and acetamide herbicides by bank filtration, ozonation, and chlorination in a public water supply. J Hydrol 266(3–4):190–208. 10.1016/S0022-1694(02)00163-4 [Google Scholar]
- Vulliet E, Berlioz-Barbier A, Lafay F, Baudot R, Wiest L, Vauchez A, Lestremau F, Botta F, Cren-Olivé C (2014) A national reconnaissance for selected organic micropollutants in sediments on French territory. Environ Sci Pollut Res 21(19):11370–11379. 10.1007/s11356-014-3089-z [DOI] [PubMed] [Google Scholar]
Associated Data
This section collects any data citations, data availability statements, or supplementary materials included in this article.
Supplementary Materials
Data Availability Statement
The authors declare that the data supporting the findings of this study are available within the paper and its Supplementary Information files. Should any raw data files be needed in another format they are available from the corresponding author upon reasonable request.