

Abstract
Background
Sarcopenia in patients with non-small cell lung cancer (NSCLC) is often indicative of a more aggressive disease course and a poorer prognosis. Nevertheless, there have been limited studies that specifically examined clinical parameters to predict sarcopenia in individuals with malignant pleural effusion (MPE). Our objective is to investigate the potential correlations between commonly utilized clinical variables and reduced muscle mass in NSCLC patients who also have MPE.
Methods
This retrospective study examined the clinicopathological data and imaging characteristics of NSCLC patients admitted to the hospital with MPE. The Least Absolute Shrinkage and Selection Operator (LASSO) algorithm was employed to select the most appropriate variables for model creation, effectively reducing the chance of overfitting. Logistic regression analysis was conducted to pinpoint the independent factors predicting sarcopenia in NSCLC patients with MPE. Subsequently, a nomogram was formulated to estimate the sarcopenia risk for individual patient. The efficacy of this nomogram was assessed through various metrics, including the receiver operating characteristic (ROC) curve, calibration curve, and decision curve analysis (DCA).
Results
A total of 139 patients, with an average age of 66 years and a majority being male (56.8%), were included in this study. Multivariate logistic regression analysis revealed that age, body mass index (BMI), albumin (Alb), and cytokeratin-19-fragment (CY21-1) were all independent predictors of sarcopenia in NSCLC patients with MPE. A nomogram was developed to facilitate personalized prediction of sarcopenia for individual patient. The ROC curve demonstrated that the nomogram model incorporating these predictive factors achieved an area under the curve (AUC) of 0.889, indicating its discriminatory power in predicting sarcopenia. The calibration curve demonstrated a strong concordance between the actual and the anticipated sarcopenia risk. DCA further confirmed that the nomogram showed good clinical applicability and net benefits in sarcopenia prediction.
Conclusions
Certain commonly used clinical characteristics were found to be associated with decreased skeletal muscle mass. Specifically, age, BMI, Alb, and CY21-1 levels emerged as predictive indicators for sarcopenia among NSCLC patients with MPE. These indicators have the potential to serve as effective alternatives to traditional computed tomography (CT) evaluation in assessing sarcopenia.
Keywords: Sarcopenia, Non-small cell lung cancer, Malignant pleural effusion, Predictive indicators, Nomogram
Introduction
Sarcopenia refers to the age-related loss of skeletal muscle mass, which can lead to adverse consequences such as physical disability, poor quality of life, and even death [1]. Sarcopenia and reduced muscle mass have been linked to poor prognosis in various chest and respiratory diseases. Studies have shown that decreased muscle mass is associated with incidence and mortality rates in conditions such as chronic obstructive pulmonary disease [2], idiopathic pulmonary fibrosis [3], lung transplantation [4], lung cancer [5–7], and more recently, COVID-19 [8], among others.
According to the latest 2020 Global Cancer Data Report published by the International Agency for Research on Cancer (IARC) of the World Health Organization, lung cancer accounts for 18.0% of all cancer-related deaths globally [9]. Statistics indicate that approximately 50% of malignant tumors can be accompanied by malignant pleural effusion (MPE), which is defined as the presence of tumor cells in pleural effusion [10]. The most common causes of MPE are lung cancer, breast cancer, and lymphoma, collectively accounting for 80% of all MPE cases [11]. In the UK, there are 50,000 new cases of MPE each year [12], and with the rising incidence of cancer worldwide, the occurrence of MPE may also increase. The clinical manifestation of MPE is characterized by progressively worsening dyspnea, often accompanied by symptoms such as chest pain or cough [13]. Furthermore, patients may experience other significant symptoms including weight loss, discomfort, and anorexia, which serve as indicators of a poor prognosis [14]. Despite significant advancements in cancer treatment, the management of MPE remains primarily palliative, with a median survival time ranging from only 3 to 12 months [15].
Sarcopenia is increasingly recognized as a clinical syndrome caused by multiple factors, including inactivity, malnutrition, and chronic diseases [16]. Early diagnosis of sarcopenia is pivotal for the clinical management of lung cancer. However, comprehensively diagnosing sarcopenia based on skeletal muscle mass measured by dual-energy X-ray absorptiometry (DXA) or bioelectrical impedance analysis (BIA), as well as grip strength and gait speed, can be time-consuming and cumbersome. Consequently, diagnosing sarcopenia in clinical practice presents certain challenges. In recent years, there has been considerable interest in utilizing computed tomography (CT) for body composition analysis to predict clinical outcomes [17]. CT, as a standard method for assessing skeletal muscle mass, has been extensively utilized in the diagnosis and management of sarcopenia [18]. According to the European Working Group on Sarcopenia in Older People (EWGSOP) recommendation, measuring the skeletal muscle area at the level of the third lumbar vertebra (L3) serves as an alternative method for assessing muscle mass, as it accurately mirrors the overall muscle mass [19]. Therefore, in this study, we employed the lumbar skeletal muscle index (LSMI), calculated by normalizing the muscle cross-sectional area measured at the L3 level to height, as an alternative approach for evaluating sarcopenia. Although CT-measured muscle area holds significant value in assessing sarcopenia among non-small cell lung cancer (NSCLC) patients, its application is constrained by costs and radiation exposure. Hence, there is a pressing need to develop simple, non-invasive, and effective detection methods to identify and monitor sarcopenia in clinical management.
Cytokeratin is a component of the structural proteins found in epithelial cells. Cytokeratin-19-fragment (CY21-1) is predominantly located in the cytoplasm of epithelial cells and represents a soluble fragment derived from cytokeratin. In malignant cells, the activation of proteases accelerates cellular degradation, leading to the release of CY21-1 into the bloodstream. The level of CY21-1 correlates with the staging of tumor cells, and elevated concentrations suggest that the tumor is in an advanced stage or has a poor prognosis. Clinical studies have demonstrated that CY21-1 exhibits greater sensitivity in the diagnosis of lung squamous cell carcinoma compared to lung adenocarcinoma and large cell carcinoma [20]. Furthermore, studies have indicated that the expression level of CY21-1 holds certain significance in the diagnosis of MPE [21, 22]. However, there have been no reports on its application in the diagnosis of sarcopenia.
Currently, there is a lack of research investigating the accuracy of CY21-1 in predicting sarcopenia among patients with NSCLC and MPE. Therefore, the aim of this study is to explore the precision of CY21-1 in evaluating sarcopenia in MPE patients, as compared to other established valuable indicators, and to determine the optimal cut-off value for predicting sarcopenia using this biomarker. To achieve this, we examined the correlation between the LSMI and CY21-1 levels, along with other laboratory results and clinical parameters. Furthermore, we investigated the feasibility of utilizing CY21-1 in combination with other indicators to evaluate sarcopenia in NSCLC patients with MPE through the development of a nomogram.
Materials and methods
Study design and patients
This cross-sectional study retrospectively collected clinical data from NSCLC patients with MPE who underwent sarcopenia assessments at the First Affiliated Hospital of Xi’an Jiaotong University between 2019 and 2022. Based on this formula  )2, we calculated the included sample size. The baseline clinicopathological data prior to treatment initiation were retrieved from electronic case records for all consecutive participants. In the present study, we included all NSCLC patients who were diagnosed with MPE and underwent sarcopenia assessments during their hospitalization. Patients with coexisting other tumors, disease recurrence, or incomplete medical records were excluded from the analysis. The study protocol received approval from the institutional review board of the First Affiliated Hospital of Xi’an Jiaotong University School of Medicine (No. XJTU1AF2023LSK-2019-217). This study was conducted in accordance with the Transparent Reporting of a multivariable prediction model for Individual Prognosis or Diagnosis (TRIPOD) statement [23]. Written informed consent was obtained from all participating patients.
Covariable
The study comprehensively gathered demographic information comprising age, sex, and body mass index (BMI). Additionally, it documented cancer-related details such as pathological subtypes, Eastern Cooperative Oncology Group performance status (ECOG-PS), driver gene mutations, prior anti-tumor treatments, and serum tumor markers. Relevant laboratory test results, including blood routine tests, serum albumin (Alb) level, blood urea nitrogen (BUN), creatinine (Cr), and ratios such as neutrophil-to-lymphocyte (NLR) and platelet-to-lymphocyte (PLR) were also collected. The prognostic nutritional index (PNI) was calculated using the formula: PNI = serum Alb level (g/L) + 5 × peripheral lymphocyte count (109/L). The optimal cut-off value for CY21-1 was established through the “roc” function within the “pROC” package.
Computed tomography imaging
GE Optima 64-slice spiral CT scanner (CT-660) was utilized for upper abdominal scanning. The scanning area covered the region from the top of the diaphragm to the navel. During the procedure, patients were positioned supine with both hands raised above their head and instructed to hold their breath at the end of a deep inhalation. The scanning parameters were set as follows: a tube voltage of 120 kV, a tube current with adaptive adjustment ranging from 100 to 400 mA, and a conventional scanning layer thickness of 5 mm. Subsequently, all acquired images were transmitted to the GE ADW 4.6 workstation via the Picture Archiving and Communication System (PACS).
Quantitative measurement of skeletal muscle cross-sectional area
The measurement of the skeletal muscle cross-sectional area (SMA) was conducted using a single-slice CT image at the L3 level. The skeletal muscle areas on both sides were manually outlined and selected (Fig. 1). These muscle cross-sectional areas were calculated utilizing a standard clinical PACS. In this study, two experienced radiologists, each with more than five years of experience, utilized the Radiomics module of the 3D Slice software to delineate regions of interest (ROI) on CT image sequences, ensuring that motion artifacts and image resolution issues did not interfere with their delineations. Subsequently, the extracted imaging features underwent standardized preprocessing, which involved normalizing them to a range of 0 to 1 using the min-max normalization method. Radiologist 1 placed the ROI and extracted the imaging features once, and then repeated the process one week later to evaluate intra-observer consistency. Radiologist 2 performed the ROI placement and feature extraction only once, and their measurements were compared with Radiologist 1’s first set of measurements to assess inter-observer consistency. The intraclass correlation coefficient (ICC) was calculated for the standardized features extracted by both radiologists and by the same radiologist on two separate occasions, with a threshold of at least 0.8 ensuring reliability. Sarcopenia was assessed using the SMI, which is determined by dividing the muscle area at L3 (in cm2) by the height squared (in meters2) [24].
Fig. 1.
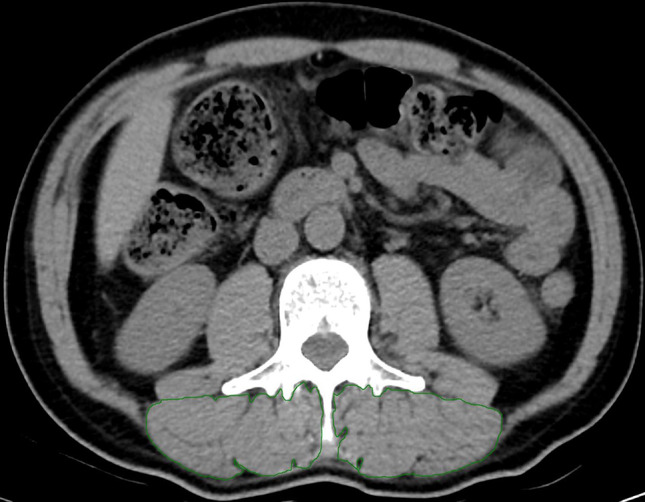
A representative single-slice CT image of the third lumbar vertebrae level used to calculate the SMA. Specialized computer software was employed to measure the SMA of the manually outlined areas (indicated by the green line). SMA, skeletal muscle cross-sectional area
Characteristic selection
Given the dataset’s high dimensionality, we employed the Least Absolute Shrinkage and Selection Operator (LASSO) algorithm to identify the most pertinent variables for model construction and mitigate the risk of overfitting [25]. By leveraging the penalty parameter lambda, LASSO regression effectively diminishes the coefficients of less significant variables to zero, thus screening out the crucial predictors. We determined the optimal lambda value through a rigorous 10-fold cross-validation (CV) process. The implementation of LASSO regression was facilitated by the “glmnet” package [26], where the “cv.glmnet” function automatically searched through various lambda values and selected the optimal one based on CV results. Variables with a P-value below 0.05 from the univariate analysis were incorporated into a multivariate logistic regression model to ascertain the independent predictors of sarcopenia in NSCLC patients with MPE.
Construction and evaluation of nomogram
The multivariate logistic regression analysis identified independent predictors, which were subsequently utilized to construct a nomogram aimed at predicting the risk of sarcopenia in NSCLC patients with MPE. To visualize this nomogram, the “rms” package was employed, while the “nomogramEx” package facilitated the calculation of total points for individual patient. The nomogram’s discriminatory power was evaluated using the receiver operating characteristic (ROC) curve, with the area under the curve (AUC) serving as an estimate. The “pROC” package was employed for the purpose of displaying and analyzing ROC curves, while the “roc.test” function was utilized for comparing the AUCs of diverse predictors. Additionally, a calibration curve was utilized to evaluate the model’s calibration ability, accompanied by the Hosmer and Lemeshow goodness-of-fit (GOF) test to assess the alignment between actual and predicted risk of sarcopenia. In the “rms” package, a model was first fitted, and subsequently the “val.prob” function was utilized to generate data for constructing the calibration curve. Recognizing that the nomogram’s discriminatory and calibration abilities alone could not encapsulate “false positive” and “false negative” occurrences within the dataset, we undertook additional decision curve analysis (DCA) to gauge the net clinical benefits derived from the nomogram [27]. The “rmda” package was used for plotting and analyzing DCA curves, and the “decision_curve” function was employed to assess the clinical applicability and net clinical benefits of the nomogram.
Statistical analysis
Continuous variables are presented as either the mean ± standard deviation (SD) or medians with the interquartile range (IQR), depending on their distribution. Categorical variables are presented as numbers and percentages. For comparisons between groups, the independent-samples Student’s t-test was used for normally distributed continuous variables, the Mann-Whitney U test was used for non-normally distributed variables, and either the Fisher exact test or a chi-square test was used for categorical variables. Pearson or Spearman correlation tests were employed to assess the strength of association among continuous and rank variables, respectively. LASSO regression was utilized to ascertain the most suitable variables for developing the model. Multiple logistic regression models were developed to explore the factors independently predicting L3 SMI. The optimal threshold for predicting sarcopenia was determined by plotting the ROC curve and calculating the AUC. A P-value < 0.05 was considered statistically significant. The statistical analysis and visualizations were performed using GraphPad Prism 8 (GraphPad Software, La Jolla, CA), IBM SPSS Statistics version 25 (IBM, Armonk, NY), and R software version 4.4.1 for Windows 10.0.
Results
Demographic and clinical characteristics
Initially, 176 patients met the inclusion criteria. However, following the exclusion of 24 cases involving coexisting other tumors, 8 cases due to incomplete electronic medical records, and 5 cases of disease recurrence, the study ultimately included 139 participants (Fig. 2). Table 1 summarizes the baseline characteristics and included subjects in this study. A total of 139 cases were enrolled, with 56.8% being male and an average age of 66.00 ± 9.63 years. The average LSMI of the total population was 647.08 ± 141.09. Among the NSCLC samples included, there were 90 cases (64.7%) of adenocarcinoma and 49 cases (35.3%) of squamous cell carcinoma, respectively. The median levels of serum carcinoembryonic antigen (CEA), neuron specific enolase (NSE), and CY21-1 at baseline were 6.80 ng/mL (IQR: 2.56–46.82), 22.35 ng/mL (IQR: 14.29–45.11), and 7.70 ng/mL (IQR: 3.04–18.90), respectively. The results of blood routine and biochemical tests collected upon admission are also presented in Table 1.
Fig. 2.

Study flow diagram
Table 1.
Demographic and clinical characteristics of the enrolled patients
| Characteristics | Value or no. of patients |
|---|---|
| Age, years | 66.00 ± 9.63 |
| Sex, n (%) | |
| Female | 60 (43.2%) |
| Male | 79 (56.8%) |
| BMI, kg/m2 | |
| Female | 21.64 ± 3.52 |
| Male | 22.94 ± 3.64 |
| LSMI | 647.08 ± 141.09 |
| Pathological subtypes | |
| Adenocarcinoma | 90 (64.7%) |
| Squamous cell carcinoma | 49 (35.3%) |
| CEA (0–5.0 ng/mL) | 6.80 (2.56–46.82) |
| NSE (0−16.3 ng/mL) | 22.35 (14.29–45.11) |
|
CY21−1 (0−3.3 ng/mL) |
7.70 (3.04–18.90) |
| WBC (3.5–9.5 × 10⁹/L) | 6.90 (5.30–9.20) |
| Neutrophils (1.8–6.3 × 10⁹/L) | 4.60 (3.50–6.80) |
| Lymphocytes (1.1–3.2 × 10⁹/L) | 1.20 (0.80–1.60) |
| Hgb (115–150 g/L) | 122.17 ± 17.98 |
| NLR | 4.43 (2.67–6.86) |
| PLT (125–350 × 109/L) | 246.00 (211.00−316.00) |
| PLR | 235.19 (156.11–337.50) |
| BUN/Cr | 85.53 ± 27.91 |
| Alb (35–55 g/L) | 37.80 (34.80–41.40) |
Values are presented as mean ± SD, median (25th-75th percentiles), or percentage (%)
BMI, body mass index; LSMI, lumbar skeletal muscle index; CEA, carcinoembryonic antigen; NSE, neuron specific enolase; CY21-1, cytokeratin-19-fragment; WBC, white blood cells; Hgb, hemoglobin; NLR, neutrophil-to-lymphocyte ratio; PLT, platelet; PLR, platelet-to-lymphocyte ratio; BUN, blood urea nitrogen; Cr, creatinine; Alb, albumin
Comparison of clinical variables between patients with and without sarcopenia
Based on the risk of developing sarcopenia, the patients were divided into two groups. Due to variations in the numerical reference ranges used to define sarcopenia at the L3 SMI level among different studies, we categorized patients into normal (n = 71, 51.1%) and low (n = 68, 48.9%) groups based on their LSMI levels, with the separation determined by the mean value. When compared to the normal group, individuals with reduced LSMI were found to have a significantly older age (69.51 vs. 62.63, P < 0.001) and a lower BMI (20.60 vs. 24.09, P < 0.001). Regarding serum tumor markers, the levels of NSE (27.49 vs. 18.11, P = 0.018) and CY21-1 (14.15 vs. 4.00, P < 0.001) were significantly higher in the low LSMI group compared to those without sarcopenia. Additionally, an increase in inflammatory markers such as platelet (PLT), the PLR, and the NLR were also associated with a decrease in skeletal muscle mass (all P < 0.05). Sarcopenia often indicates poor nutritional status in patients, which was manifested in our study by decreased levels of serum Alb and hemoglobin (Hgb). Furthermore, no significant correlation was found between driver gene mutations, including EGFR and ALK, ECOG-PS score, prior anti-tumor treatments, and the PNI in relation to the decrease in skeletal muscle mass (Table 2).
Table 2.
Comparison of baseline clinical data and serological results between two groups of patients
| Characteristics | Normal LSMI (n = 71) |
Low LSMI (n = 68) |
P-value |
|---|---|---|---|
| Age, years | 62.63 ± 9.45 | 69.51 ± 8.56 | < 0.001 |
| Sex, n (%) | 0.211 | ||
| Female | 27 (38.0%) | 33 (48.5%) | |
| Male | 44 (62.0%) | 35 (51.5%) | |
| BMI, kg/m2 | 24.09 ± 3.18 | 20.60 ± 3.21 | < 0.001 |
| ECOG-PS | 0.522 | ||
| 0–1 | 32 (45.1%) | 27 (39.7%) | |
| 2–4 | 39 (54.9%) | 41 (60.3%) | |
| Driver gene mutations | 0.734 | ||
| Negative | 34 (47.9%) | 31 (45.6%) | |
| EGFR | 23 (32.4%) | 26 (38.2%) | |
| ALK | 14 (19.7%) | 11 (16.2%) | |
| Prior anti-tumor treatments | 0.341 | ||
| Chemotherapy | 36 (50.7%) | 29 (42.6%) | |
| Immunotherapy | 35 (49.3%) | 39 (57.4%) | |
| CEA (0–5.0 ng/mL) | 7.64 (2.49–46.82) | 5.89 (2.59–60.24) | 0.995 |
| NSE (0−16.3 ng/mL) | 18.11 (14.17–35.24) | 27.49 (15.89–59.32) | 0.018 |
|
CY21−1 (0−3.3 ng/mL) |
4.00 (2.03–9.39) | 14.15 (6.29–50.74) | < 0.001 |
| WBC (3.5–9.5 × 10⁹/L) | 6.50 (5.00−9.30) | 7.15 (5.40–8.87) | 0.359 |
| Neutrophils (1.8–6.3 × 10⁹/L) | 4.40 (3.20–6.60) | 4.85 (3.90–6.90) | 0.222 |
| Lymphocytes (1.1–3.2 × 10⁹/L) | 1.20 (0.90–1.70) | 1.15 (0.70–1.58) | 0.213 |
| Hgb (115–150 g/L) | 125.83 ± 18.06 | 118.35 ± 17.19 | 0.014 |
| NLR | 4.00 (2.36–5.87) | 4.71 (2.83–7.34) | 0.035 |
| PLT (125–350 × 109/L) | 230.00 (199.00−290.00) | 284.00 (230.75–334.00) | 0.002 |
| PLR | 191.67 (126.15−280.91) | 254.14 (186.18−397.95) | 0.004 |
| BUN/Cr | 86.65 ± 30.98 | 84.36 ± 24.46 | 0.631 |
| Alb (35–55 g/L) | 39.80 ± 7.61 | 36.41 ± 4.71 | 0.002 |
| PNI | 45.00 ± 10.12 | 43.70 ± 7.56 | 0.394 |
Values are presented as mean ± SD, median (25th-75th percentiles), or percentage (%)
LSMI, lumbar skeletal muscle index; BMI, body mass index; ECOG-PS, Eastern Cooperative Oncology Group performance status; CEA, carcinoembryonic antigen; NSE, neuron specific enolase; CY21-1, cytokeratin-19-fragment; WBC, white blood cells; Hgb, hemoglobin; NLR, neutrophil-to-lymphocyte ratio; PLT, platelet; PLR, platelet-to-lymphocyte ratio; BUN, blood urea nitrogen; Cr, creatinine; Alb, albumin; PNI, prognostic nutritional index
Multivariate logistic regression analysis for predicting sarcopenia
In the univariate analysis, variables with P-values less than 0.05 were selected, and to address the problem of overfitting in datasets with high dimensionality, we utilized the LASSO algorithm. Through a 10-fold CV process, this algorithm selected seven variables with non-zero coefficients (Fig. 3). We conducted an assessment of multicollinearity among the variables by utilizing the variance inflation factors (VIF) (Table 3). The results indicated that, although some variables exhibited a moderate level of correlation, the VIF values remained within an acceptable threshold, typically considered to be below 10. This implies that multicollinearity is not a significant concern within our dataset. Multivariate logistic regression analysis results demonstrated that age [odds ratio (OR) = 1.077, 95% confidence interval (CI) = 1.019–1.138; P = 0.009], BMI (OR = 0.761, 95% CI = 0.647–0.894; P = 0.001), serum Alb levels (OR = 0.907, 95% CI = 0.826–0.996; P = 0.042), and CY21-1 levels (OR = 1.081, 95% CI = 1.034–1.131; P = 0.001) were independently and significantly associated with a decrease in LSMI. For a comprehensive view of the results, please refer to Table 4.
Fig. 3.

LASSO algorithm to discern potential predictors of sarcopenia. The left panel illustrates the variable selection phase in the context of the LASSO penalty. The horizontal axis denotes the log-transformed penalized parameter, lambda, while the vertical axis represents the coefficients of individual variable, which progressively diminish towards zero as lambda increases. Ultimately, variables retaining nonzero coefficients are chosen for subsequent analysis. The right panel displays the results of a 10-fold CV for the LASSO model. LASSO, Least Absolute Shrinkage and Selection Operator; CV, cross-validation
Table 3.
Multivariate linear regression analysis of the association between clinical parameters and LSMI
| Variables | β | t | 95% CI | P-value | VIF |
|---|---|---|---|---|---|
| Age | -2.835 | -2.994 | -4.709 to -0.962 | 0.003 | 1.194 |
| BMI | 8.243 | 3.176 | 3.109–13.376 | 0.002 | 1.277 |
| NLR | 0.958 | 0.681 | -1.826 to 3.742 | 0.497 | 1.126 |
| PLT | -0.023 | -0.249 | -0.202 to 0.157 | 0.804 | 1.115 |
| Hgb | 0.211 | 0.401 | -0.833 to 1.256 | 0.689 | 1.293 |
| Alb | 3.400 | 2.412 | 0.611–6.188 | 0.017 | 1.299 |
| CY21−1 | -2.352 | -8.153 | -2.923 to -1.782 | < 0.001 | 1.123 |
Notes: β, standardized coefficient
LSMI, lumbar skeletal muscle index; CI, confidence interval; VIF, variance inflation factors; BMI, body mass index; NLR, neutrophil-to-lymphocyte ratio; PLT, platelet; Hgb, hemoglobin; Alb, albumin; CY21-1, cytokeratin-19-fragment
Table 4.
Multivariate logistic regression analysis of factors influencing sarcopenia in NSCLC patients with malignant pleural effusion
| Variables | B | OR | 95% CI | P-value |
|---|---|---|---|---|
| Constant | 4.131 | 62.253 | 0.236 | |
| Age | 0.074 | 1.077 | 1.019–1.138 | 0.009 |
| BMI | -0.273 | 0.761 | 0.647–0.894 | 0.001 |
| NLR | -0.041 | 0.960 | 0.891–1.034 | 0.281 |
| PLT | 0.002 | 1.002 | 0.997–1.008 | 0.414 |
| Hgb | -0.005 | 0.995 | 0.965–1.026 | 0.753 |
| Alb | -0.098 | 0.907 | 0.826–0.996 | 0.042 |
| CY21−1 | 0.078 | 1.081 | 1.034–1.131 | 0.001 |
OR, odds ratio; CI, confidence interval; BMI, body mass index; NLR, neutrophil-to-lymphocyte ratio; PLT, platelet; Hgb, hemoglobin; Alb, albumin; CY21-1, cytokeratin-19-fragment
Correlation analysis between clinical parameters and lumbar muscle mass at the L3 level
Figure 4 illustrates the correlation between the independent predictors of sarcopenia and the SMI at the L3 vertebral level. The age of NSCLC patients at the time of initial diagnosis of MPE exhibited a slight negative correlation with the L3 SMI (r = -0.400, P < 0.001). In this study, the relationship between BMI and L3 SMI was statistically significant (r = 0.445, P < 0.001). Furthermore, the results revealed a positive correlation between L3 SMI and the nutritional indicator serum Alb (r = 0.314, P < 0.001), whereas a moderate negative correlation was observed with the tumor marker CY21-1 (r = -0.562, P < 0.001).
Fig. 4.

Correlation analysis between selected indicators and LSMI in lung cancer patients with MPE. The results indicated a negative correlation between the LSMI and both age (A) and CY21-1 levels (D). In contrast, there existed a positive correlation between the LSMI and both BMI (B) and serum Alb levels (C). LSMI, lumbar skeletal muscle index; MPE, malignant pleural effusion; BMI, bodymass index; Alb, albumin; CY21-1, cytokeratin-19-fragment
The construction and evaluation of a nomogram for predicting sarcopenia
Subsequently, the four aforementioned independent predictors were selected to construct a nomogram for sarcopenia prediction, with a C-index of 0.889 indicating its satisfactory discriminatory power (Fig. 5). Consequently, using this nomogram, clinicians can promptly pinpoint patients who are at an elevated risk of sarcopenia. The cut-off value was determined using Youden’s index to maximize the sum of sensitivity and specificity on the ROC curve for biomarker analysis [28]. Consequently, a cut-off value of CY21-1 > 12.65 ng/mL was identified as the optimal threshold for distinguishing sarcopenia, yielding a sensitivity of 54.4%, a specificity of 85.9%, and an F1-score of 0.643. To delve deeper into the predictive potential of the nomogram derived from a combined model that incorporates factors such as age, BMI, Alb, and CY21-1 for sarcopenia, a collaborative analysis was undertaken (Fig. 6). The results clearly indicated that the combined model exhibited a marked improvement in discriminatory power when compared to the CY21-1 single prediction model. Specifically, the combined model achieved an AUC of 0.889, significantly higher than the AUC of 0.767 observed for the CY21-1 model (P < 0.001). Furthermore, the combined model demonstrated a robust sensitivity of 85.3%, a specificity of 81.7%, and an impressive F1-score of 0.824. The calibration curve demonstrated that the nomogram tends to slightly underestimate or overestimate in the lower and higher prediction probability ranges, respectively, yet it offers relatively precise predictions within the middle range (Fig. 7). The outcomes of the Hosmer-Lemeshow test substantiated the nomogram’s robust calibration performance (P > 0.05). The DCA curve depicted in the nomogram revealed that, in comparison to a single variable, the integrated model, incorporating multiple variables within the nomogram, offers substantial net benefits (Fig. 8). This underscores that the nomogram serves as a reliable and user-friendly instrument for facilitating clinical decision-making pertaining to the diagnosis of sarcopenia.
Fig. 5.

A nomogram developed for the diagnostic assessment of sarcopenia BMI, body mass index; Alb, albumin; CY21-1, cytokeratin-19-fragment
Fig. 6.
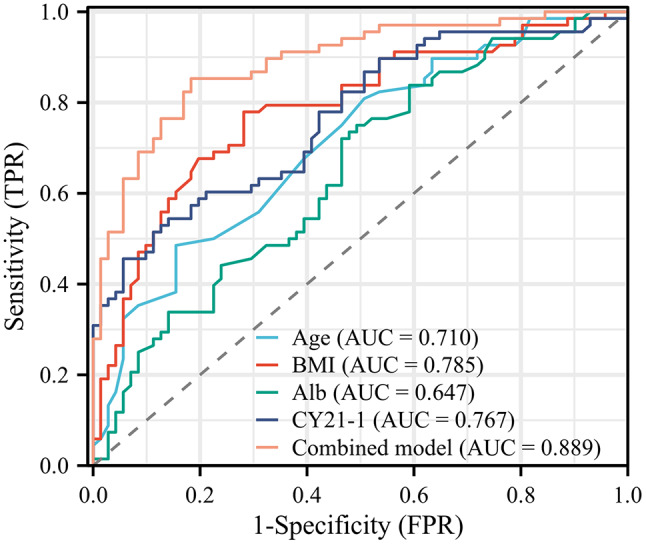
ROC curve to illustrate the nomogram’s discriminative power BMI, body mass index; Alb, albumin; CY21-1, cytokeratin-19-fragment; ROC, receiver operating characteristic
Fig. 7.

The calibration curve of the nomogram for predicting sarcopenia
Fig. 8.

Decision curve analysis of the nomogram for predicting sarcopenia. BMI, body mass index; Alb, albumin; CY21-1, cytokeratin-19-fragment
Discussions
Lung cancer is the highest morbidity of cancer in the world, with about 2.09 million new cases of lung cancer every year, accounting for 11.6% of global cancer patients [29]. It is also the main cause of cancer-related deaths, with approximately 1.76 million patients dying from lung cancer each year, accounting for 18.4% of the total global cancer deaths and posing a serious threat to human life and health safety [30]. With the continuous progress of science and technology, significant progress has been made in the exploration of lung cancer treatment methods. For instance, the successful development of targeted therapeutic drugs and anti-PD-1/PD-L1 targeted therapies has significantly reduced the mortality rate of lung cancer in recent times. Nevertheless, the prognosis for lung cancer patients remains suboptimal, with a 5-year survival rate of 19%, and an even lower rate for patients in advanced stages [31]. Prior clinical studies have revealed that the short-term and long-term outcomes of lung cancer are influenced not only by cancer-related factors, such as disease stage and pathological type, but also by host factors, including reduced activity tolerance and decreased skeletal muscle mass throughout the body [32].
In 2010, the EWGSOP developed and reported the clinical definition and consensus diagnostic criteria for sarcopenia [33]. Sarcopenia is a syndrome marked by a progressive and widespread loss of skeletal muscle mass and strength, posing a risk of adverse outcomes. This condition severely compromises an individual’s health status, increasing the risk of movement disorders, falls, and fractures, impairing the ability to perform daily activities, and elevating the likelihood of disability and mortality [34]. Skeletal muscle loss is prevalent among cancer patients and is closely associated with factors such as age, nutritional status, physical activity, cardiovascular disease, and metabolic conditions like diabetes, hypertension, and dyslipidemia. The underlying pathogenesis may include the loss of motor neurons, a decreased number of motor units, reduced activity at the neuromuscular junctions, elevated levels of inflammatory factors, and impaired hormone synthesis and utilization.
In recent years, the utilization of CT in body composition analysis has garnered significant attention for predicting potential outcomes. As one of the most accurate methods for measuring skeletal muscle mass, CT has been extensively employed in sarcopenia research. According to the recommendations of the EWGSOP, the skeletal muscle area at the L3 level on single-slice CT images can serve as an alternative means for assessing muscle mass [35]. However, in clinical practice and research, not all lung cancer patients are candidates for abdominal CT examinations. Consequently, diagnosing sarcopenia in daily clinical practice poses some challenges. It is imperative to develop simpler detection methods for diagnosing and evaluating sarcopenia.
Sarcopenia is a disease intricately linked to aging. Statistics reveal that the average annual decline in muscle mass among women and men is 0.37% and 0.47%, respectively. As individuals age beyond 50, their muscle mass can decrease by 1–2% annually [36]. A study by Simsek H et al. [37] on the prevalence and influencing factors of sarcopenia in the elderly population in Türkiye indicated that the prevalence rate of sarcopenia among this group is 5.2%, and the risk of decreased skeletal muscle mass escalates with age. This aligns with our research findings, confirming that age serves as an independent predictor of sarcopenia. Therefore, medical professionals should prioritize assessing the skeletal muscle mass of elderly lung cancer patients in clinical practice, implement early screening and interventions, and strive to minimize the occurrence of adverse events.
In this study, we observed differences in BMI between the sarcopenia group and the non-sarcopenia group. Multivariate regression analysis indicated that BMI was an independent influencing factor for sarcopenia, with higher BMI levels associated with a lower risk of sarcopenia in lung cancer patients. This finding is consistent with the results of a multicenter longitudinal study conducted in South Korea [38], which demonstrated that a high BMI exerts a protective effect against the reduction of SMI in patients. This may be attributed to the fact that elderly patients who are obese or overweight have more sufficient energy reserves and better nutritional status. Therefore, high BMI levels may not only reflect fat distribution but also potentially indicate a rich muscle content. This suggests that clinical physicians should prioritize early screening of patients with low BMI to detect sarcopenia as soon as possible and devise pertinent diagnosis and treatment plans, thereby optimizing the long-term prognosis of patients. Consequently, the judicious formulation of exercise and nutrition prescriptions aimed at maintaining a certain high level of BMI in patients may assist in mitigating the risk of sarcopenia.
In this study, we found a significant difference in Alb levels between the two patient groups. Furthermore, after conducting multiple logistic regression analysis, we identified Alb as a contributing factor to sarcopenia. Clinically, serum Alb is a commonly used indicator to assess the nutritional status of patients, even in the context of chronic inflammation due to aging or disease [39]. Extensive evidence indicates that malnutrition is associated with a reduction in skeletal muscle mass [40]. This may be attributed to inadequate nutrient intake or increased consumption due to diseases, leading to hypoalbuminemia and negative nitrogen balance, which in turn disrupts skeletal muscle protein synthesis and promotes muscle atrophy. A study has recommended supplementing patients with sarcopenia with branched-chain amino acids and whey protein. This nutritional support therapy can enhance muscle protein synthesis and serum Alb levels, thereby aiding in the prevention and treatment of sarcopenia [41].
CY21-1 is a fragment derived from cytokeratin 19, which plays a crucial role in maintaining the structural integrity of epithelial cells. When cancer cells undergo apoptosis, proteases degrade proteins into various fragments. Following the rupture of the cell membrane, CY21-1 enters the bloodstream and exhibits high expression levels in the serum of patients with NSCLC. Additionally, it can serve as a predictive indicator for the effectiveness of chemotherapy or as a marker for postoperative recurrence and metastasis [20, 42]. This study revealed that the serum expression of CY21-1 in the sarcopenia group of lung cancer patients with MPE was significantly higher than that in the normal group. Multivariate regression analysis further demonstrated a notable correlation between elevated CY21-1 levels and decreased skeletal muscle mass in these patients. This study plotted the ROC curve for CY21-1, and the results indicated that CY21-1 has certain predictive value for the occurrence of sarcopenia in patients. When the cut-off value was set at 12.65 ng/ml, the best predictive effect for sarcopenia was achieved, yielding a sensitivity of 54.4% and a specificity of 85.9%. Furthermore, the study found that when CY21-1 was combined with age, BMI, and Alb for predicting sarcopenia, the area under the ROC curve increased to 0.889, with a sensitivity of 85.3% and a specificity of 81.7%. This suggests that the combination of CY21-1 with these other parameters achieves a higher predictive value for the occurrence of sarcopenia.
Despite identifying multiple clinical characteristics linked to sarcopenia risk in NSCLC patients with MPE, we observed that the predictive power of any single indicator fell short compared to a combined model. Consequently, we devised an innovative risk classification model incorporating these factors to forecast sarcopenia. As anticipated, our developed nomogram exhibited remarkable discriminatory power and calibration accuracy. Crucially, we utilized DCA to assess the overall clinical advantages of the nomogram in aiding clinical decision-making. Remarkably, our nomogram outperformed a single marker in terms of net clinical benefits. These findings validate our developed risk classification tool as a reliable and precise predictor of sarcopenia in NSCLC patients with MPE. Currently, the diagnosis of sarcopenia primarily relies on abdominal CT evaluation, which is limited by factors such as availability, time limitations, cost considerations, and radiation exposure in lung cancer patients, making it challenging to assess skeletal muscle mass in all NSCLC patients during routine treatment. However, early prediction and evaluation of sarcopenia are crucial for lung cancer patients, especially those in advanced stages, as muscle mass depletion can adversely impact their long-term prognosis and quality of life. Therefore, this study successfully identified a more convenient and cost-effectiveness alternative testing method to predict sarcopenia, enabling clinicians to make earlier diagnoses and expedite treatment decisions.
However, this study has several limitations that need to be acknowledged. Firstly, the sample size was relatively small, which may have weakened the correlation between certain indicators and muscle mass. Secondly, there was a certain level of information bias in the collection of medical histories and data, despite implementing rigorous data validation procedures. To validate our findings and address potential biases arising from the retrospective and oligo-institutional nature of our study, it may be necessary to conduct prospective multicenter studies with larger sample sizes to further investigate the incidence and influencing factors of sarcopenia in lung cancer patients with MPE. Such studies will offer more extensive theoretical insights into the prevention and management of sarcopenia in this patient population. While our study provides valuable insights into the potential correlations between clinical variables and decreased muscle mass in NSCLC patients with MPE, it is important to note that our findings may not be generalizable to other types of lung cancer. In future studies, we aim to investigate the predictive value of CY21-1 in sarcopenia among a more diverse spectrum of lung cancer subtypes. By expanding our research to include a broader patient cohort, we aim to gain a more comprehensive understanding of CY21-1’s role in lung cancer and its implications for patient management and care. Furthermore, the lack of certain tumor-related and nutritional indicators constitutes a limitation, as these indicators could potentially provide additional insights into the disease. Moving forward, we will collect and analyze a more comprehensive set of biomarkers and nutritional parameters to overcome the limitations of the current study. Another limitation of this study is the absence of external validation for our model. Despite the promising nature of our findings, caution is warranted in interpreting them pending validation through independent datasets. To address this limitation, we aim to undertake future research endeavors focused on validating our model using a diverse and representative patient dataset sourced from independent datasets or multicenter cohorts. To facilitate these validation studies, we will actively pursue funding opportunities and forge collaborations with clinical researchers, biostatisticians, and healthcare professionals. We are committed to transparently disclosing the results of these future studies, inclusive of any limitations and potential biases, to ensure a comprehensive evaluation of our model’s performance and generalizability.
Our current research, while leveraging traditional statistical methods such as multivariate logistic regression, acknowledges their potential limitations in fully capitalizing on the predictive power embedded within our dataset. Given the inherent complexities and nuanced characteristics of our data, it becomes evident that there is room for enhancement in our feature selection and model development process. To address these limitations, we plan to embark on a journey to explore and incorporate advanced machine learning algorithms in our future endeavors. Specifically, we intend to delve into random forests and gradient boosting, as these methodologies are renowned for their proficiency in managing high-dimensional data and effectively mitigating issues of collinearity. By adopting these algorithms, our objective is to fortify the robustness and predictive accuracy of our models. Moreover, we will undertake a meticulous comparison of the performance of these various machine learning approaches, focusing on metrics such as accuracy, precision, recall, F1-score, and potentially other relevant indicators tailored to our specific research context. This comprehensive evaluation will enable us to pinpoint the model that offers an optimal balance between predictive performance and interpretability, thereby paving the way for more refined and insightful analytical outcomes.
Conclusions
In summary, the findings of this study validated the association between age, BMI, Alb, and CY21-1 with LSMI measurement. The straightforward assessment of these indicators holds promise as a practical and valuable biological marker for evaluating sarcopenia in lung cancer patients with MPE. Additionally, we have devised and validated an innovative nomogram that integrates age, BMI, Alb, and CY21-1 to enhance the assessment of skeletal muscle mass in these patients, highlighting their importance as potential predictive biomarkers for sarcopenia. To establish a more robust theoretical basis for assessing sarcopenia, future research endeavors are imperative, encompassing a larger, multicenter patient cohort and exploring the role of these biomarkers across varied clinical and pathological attributes. Additionally, we will contemplate initiating future research endeavors aimed at directly comparing CY21-1 with various other biomarkers and predictive models, thereby definitively establishing its superiority in predicting sarcopenia among NSCLC patients with MPE.
Acknowledgements
We thank TopEdit Limited for the linguistic editing and proofreading of the manuscript.
Abbreviations
- NSCLC
Non-small cell lung cancer
- MPE
Malignant pleural effusion
- LSMI
Lumbar skeletal muscle index
- CEA
Carcinoembryonic antigen
- CY21-1
Cytokeratin-19-fragment
- NSE
Neuron specific enolase
- BMI
Body mass index
- WBC
White blood cells
- NLR
Neutrophil-to-lymphocyte ratio
- PLT
Platelet
- PLR
Platelet-to-lymphocyte ratio
- Hgb
Hemoglobin
- BUN
Blood urea nitrogen
- Cr
Cr: Creatinine
- Alb
Albumin
- SMA
Skeletal muscle cross-sectional area
- ROC
Receiver operating characteristic
- ECOG-PS
ECOG-PS: Eastern Cooperative Oncology Group performance status
- PNI
Prognostic nutritional index
- VIF
Variance inflation factors
- LASSO
Least Absolute Shrinkage and Selection Operator
- CV
Cross-validation
- DCA
Decision curve analysis
Author contributions
H.G.: Conceptualization, Data curation, Investigation, Methodology, Formal analysis, Writing-original draft. X.Z.: Data curation, Methodology, Project administration, Supervision. M.F.: Data curation, Project administration, Validation. M.C.: Conceptualization, Resources, Writing-review & editing. All authors read and approved the final manuscript.
Funding
This work was supported by grants from the Key Research and Development Projects of Shaanxi Province (Grant number 2024SF-GJHX-41).
Data availability
The datasets used and/or analysed during the current study are available from the corresponding author on reasonable request.
Declarations
Ethical approval
The research protocol was approved by the Ethics Committee of the First Affiliated Hospital of Xi’an Jiaotong University School of Medicine (No. XJTU1AF2023LSK-2019-217) based on the Helsinki Declaration.
Consent to participate
All patients signed a written informed consent.
Consent for publication
Not applicable.
Competing interests
The authors declare no competing interests.
Footnotes
Publisher’s note
Springer Nature remains neutral with regard to jurisdictional claims in published maps and institutional affiliations.
References
- 1.Galeano-Fernández TF, Carretero-Gómez J, Vidal-Ríos AS, et al. Impact of diabetes, malnutrition and sarcopenia on the prognosis of patients admitted to internal medicine. Rev Clin Esp (Barc). 2023;223(9):523–31. 10.1016/j.rceng.2023.09.004. [DOI] [PubMed] [Google Scholar]
- 2.Gómez-Martínez M, Rodríguez-García W, González-Islas D, et al. Impact of body composition and sarcopenia on mortality in chronic obstructive pulmonary disease patients. J Clin Med. 2023;12(4):1321. 10.3390/jcm12041321. [DOI] [PMC free article] [PubMed] [Google Scholar]
- 3.Fujita K, Ohkubo H, Nakano A, et al. Frequency and impact on clinical outcomes of sarcopenia in patients with idiopathic pulmonary fibrosis. Chron Respir Dis. 2022;19:14799731221117298. 10.1177/14799731221117298. [DOI] [PMC free article] [PubMed] [Google Scholar]
- 4.Matsui Y, Kanou T, Fukui E et al. Association of the Psoas muscle index with the survival of patients on a waiting list for lung transplantation: a Japanese single-institution study. Surg Today. 10.1007/s00595-023-02765-y [DOI] [PubMed]
- 5.Morita-Tanaka S, Yamada T, Takayama K. The landscape of cancer cachexia in advanced non-small cell lung cancer: a narrative review. Transl Lung Cancer Res. 2023;12(1):168–80. 10.21037/tlcr-22-561. [DOI] [PMC free article] [PubMed] [Google Scholar]
- 6.Wang F, Zhen HN, Wang HP, Yu K. Measurement of sarcopenia in lung cancer inpatients and its association with frailty, nutritional risk, and malnutrition. Front Nutr. 2023;10:1143213. 10.3389/fnut.2023.1143213. [DOI] [PMC free article] [PubMed] [Google Scholar]
- 7.Hasenauer A, Forster C, Hungerbühler J, et al. CT-Derived sarcopenia and outcomes after thoracoscopic pulmonary resection for Non-Small cell lung Cancer. Cancers (Basel). 2023;15(3):790. 10.3390/cancers15030790. [DOI] [PMC free article] [PubMed] [Google Scholar]
- 8.Li ML, Kor PP, Sui YF, Liu JY. Health maintenance through home-based interventions for community-dwelling older people with sarcopenia during and after the COVID-19 pandemic: A systematic review and meta-analysis. Exp Gerontol. 2023;174:112128. 10.1016/j.exger.2023.112128. [DOI] [PMC free article] [PubMed] [Google Scholar]
- 9.Wéber A, Morgan E, Vignat J, et al. Lung cancer mortality in the wake of the changing smoking epidemic: a descriptive study of the global burden in 2020 and 2040. BMJ Open. 2023;13(5):e065303. 10.1136/bmjopen-2022-065303. [DOI] [PMC free article] [PubMed] [Google Scholar]
- 10.Kwok B, Wu BG, Kocak IF, et al. Pleural fluid microbiota as a biomarker for malignancy and prognosis. Sci Rep. 2023;13(1):2229. 10.1038/s41598-023-29001-4. [DOI] [PMC free article] [PubMed] [Google Scholar]
- 11.Dipper A, Sundaralingam A, Hedley E, et al. The randomised thoracoscopic Talc poudrage + indwelling pleural catheters versus thoracoscopic Talc poudrage only in malignant pleural effusion trial (TACTIC): study protocol for a randomised controlled trial. BMJ Open Respir Res. 2023;10(1):e001682. 10.1136/bmjresp-2023-001682. [DOI] [PMC free article] [PubMed] [Google Scholar]
- 12.Bashour SI, Mankidy BJ, Lazarus DR. Update on the diagnosis and management of malignant pleural effusions. Respir Med. 2022;196:106802. 10.1016/j.rmed.2022.106802. [DOI] [PubMed] [Google Scholar]
- 13.Cloyes RR, Josan E, Pastis N, et al. Reducing hospital admissions in patients with malignant pleural effusion: a quality improvement study. BMJ Open Qual. 2023;12(3):e002197. 10.1136/bmjoq-2022-002197. [DOI] [PMC free article] [PubMed] [Google Scholar]
- 14.Önder CE, Moustafa-Oglou M, Schröder SM, Hartkopf AD, Koch A, Seitz CM. Precision immunotherapy utilizing adapter CAR-T cells (AdCAR-T) in metastatic breast Cancer leads to target specific Lysis. Cancers (Basel). 2023;16(1):168. 10.3390/cancers16010168. [DOI] [PMC free article] [PubMed] [Google Scholar]
- 15.Zhao Y, Yu L, Wang L, et al. Current status of and progress in the treatment of malignant pleural effusion of lung cancer. Front Oncol. 2023;12:961440. 10.3389/fonc.2022.961440. [DOI] [PMC free article] [PubMed] [Google Scholar]
- 16.Rolland Y, Dray C, Vellas B, Barreto PS. Current and investigational medications for the treatment of sarcopenia. Metabolism. 2023;149:155597. 10.1016/j.metabol.2023.155597. [DOI] [PubMed] [Google Scholar]
- 17.Baumgartner A, Olpe T, Griot S, et al. Association of CT-based diagnosis of sarcopenia with prognosis and treatment response in patients at risk of malnutrition - A secondary analysis of the effect of early nutritional support on frailty, functional outcomes, and recovery of malnourished medical inpatients trial (EFFORT) trial. Clin Nutr. 2023;42(2):199–207. 10.1016/j.clnu.2022.12.006. [DOI] [PubMed] [Google Scholar]
- 18.Chianca V, Albano D, Messina C, et al. Sarcopenia: imaging assessment and clinical application. Abdom Radiol (NY). 2022;47(9):3205–16. 10.1007/s00261-021-03294-3. [DOI] [PMC free article] [PubMed] [Google Scholar]
- 19.Nam K, Lee JY, Ko Y, et al. Impact of sarcopenia on clinical course of inflammatory bowel disease in Korea. Dig Dis Sci. 2023;68(6):2165–79. 10.1007/s10620-023-07838-z. [DOI] [PubMed] [Google Scholar]
- 20.Bi H, Yin L, Fang W, Song S, Wu S, Shen J. Association of CEA, NSE, CYFRA 21– 1, SCC-Ag, and ProGRP with clinicopathological characteristics and chemotherapeutic outcomes of lung Cancer. Lab Med. 2023;54(4):372–9. 10.1093/labmed/lmac122. [DOI] [PubMed] [Google Scholar]
- 21.Fazli Khalaf F, Asadi Gharabaghi M, Balibegloo M, Davari H, Afshar S, Jahanbin B, Pleural CEA. CA-15-3, CYFRA 21– 1, CA-19-9, CA-125 discriminating malignant from benign pleural effusions: diagnostic cancer biomarkers. Int J Biol Markers. 2023;38(2):81–8. 10.1177/03936155231158661. [DOI] [PubMed] [Google Scholar]
- 22.Wang S, An J, Hu X, et al. A simple and efficient clinical prediction scoring system to identify malignant pleural effusion. Ther Adv Respir Dis. 2024;18:17534666231223002. 10.1177/17534666231223002. [DOI] [PMC free article] [PubMed] [Google Scholar]
- 23.Collins GS, Reitsma JB, Altman DG, Moons KG. Transparent reporting of a multivariable prediction model for individual prognosis or diagnosis (TRIPOD): the TRIPOD statement. BMJ. 2015;350:g7594. 10.1136/bmj.g7594. [DOI] [PubMed] [Google Scholar]
- 24.Şahin MEH, Akbaş F, Yardimci AH, Şahin E. The effect of sarcopenia and sarcopenic obesity on survival in gastric cancer. BMC Cancer. 2023;23(1):911. 10.1186/s12885-023-11423-y. [DOI] [PMC free article] [PubMed] [Google Scholar]
- 25.Ghosh D, Zhu Y, Coffman DL. Penalized regression procedures for variable selection in the potential outcomes framework. Stat Med. 2015;34(10):1645–58. 10.1002/sim.6433. [DOI] [PMC free article] [PubMed] [Google Scholar]
- 26.Engebretsen S, Bohlin J. Statistical predictions with Glmnet. Clin Epigenetics. 2019;11(1):123. 10.1186/s13148-019-0730-1. [DOI] [PMC free article] [PubMed] [Google Scholar]
- 27.Kerr KF, Brown MD, Zhu K, Janes H. Assessing the clinical impact of risk prediction models with decision curves: guidance for correct interpretation and appropriate use. J Clin Oncol. 2016;34(21):2534–40. 10.1200/JCO.2015.65.5654. [DOI] [PMC free article] [PubMed] [Google Scholar]
- 28.Dang AK, Truong MT, Le HT, et al. Anthropometric Cut-Off values for detecting the presence of metabolic syndrome and its multiple components among adults in Vietnam: the role of novel indices. Nutrients. 2022;14(19):4024. 10.3390/nu14194024. [DOI] [PMC free article] [PubMed] [Google Scholar]
- 29.Leiter A, Veluswamy RR, Wisnivesky JP. The global burden of lung cancer: current status and future trends. Nat Rev Clin Oncol. 2023;20(9):624–39. 10.1038/s41571-023-00798-3. [DOI] [PubMed] [Google Scholar]
- 30.Lahiri A, Maji A, Potdar PD, et al. Lung cancer immunotherapy: progress, pitfalls, and promises. Mol Cancer. 2023;22(1):40. 10.1186/s12943-023-01740-y. [DOI] [PMC free article] [PubMed] [Google Scholar]
- 31.Li Y, Yan B, He S. Advances and challenges in the treatment of lung cancer. Biomed Pharmacother. 2023;169:115891. 10.1016/j.biopha.2023.115891. [DOI] [PubMed] [Google Scholar]
- 32.Al-Sawaf O, Weiss J, Skrzypski M, et al. Body composition and lung cancer-associated cachexia in tracerx. Nat Med. 2023;29(4):846–58. 10.1038/s41591-023-02232-8. [DOI] [PMC free article] [PubMed] [Google Scholar]
- 33.Park B, Bhat S, Xia W, et al. Consensus-defined sarcopenia predicts adverse outcomes after elective abdominal surgery: meta-analysis. BJS Open. 2023;7(4):zrad065. 10.1093/bjsopen/zrad065. [DOI] [PMC free article] [PubMed] [Google Scholar]
- 34.Kiuchi Y, Tsutsumimoto K, Doi T, et al. Effect of dietary diversity on incident of disability in community-dwelling older adults with sarcopenia: A 40-month follow-up longitudinal study. Maturitas. 2024;179:107887. 10.1016/j.maturitas.2023.107887. [DOI] [PubMed] [Google Scholar]
- 35.Hess DL, Harmon C, Bhatia S, Williams GR, Giri S. SARC-F as a screening tool to detect computed tomography-based sarcopenia and myosteatosis among older adults with cancer. Cancer Med. 2023;12(22):20690–8. 10.1002/cam4.6599. [DOI] [PMC free article] [PubMed] [Google Scholar]
- 36.Pham LT, Nguyen BT, Huynh DT, et al. Community-based prevalence and associated factors of sarcopenia in the Vietnamese elderly. Sci Rep. 2024;14(1):17. 10.1038/s41598-023-50979-4. [DOI] [PMC free article] [PubMed] [Google Scholar]
- 37.Simsek H, Meseri R, Sahin S, et al. Prevalence of sarcopenia and related factors in community-dwelling elderly individuals. Saudi Med J. 2019;40(6):568–74. 10.15537/smj.2019.6.23917. [DOI] [PMC free article] [PubMed] [Google Scholar]
- 38.Yoo MC, Won CW, Soh Y. Association of high body mass index, waist circumference, and body fat percentage with sarcopenia in older women. BMC Geriatr. 2022;22(1):937. 10.1186/s12877-022-03643-x. [DOI] [PMC free article] [PubMed] [Google Scholar]
- 39.Majeed AA, Shaikh H, Rasheed A, Khalid R, Qazi Arisa FA, Ghias H. Prevalence and risk factors of sarcopenia in patients with cirrhosis: an observational study. J Pak Med Assoc. 2023;73(10):2004–8. 10.47391/JPMA.8461. [DOI] [PubMed] [Google Scholar]
- 40.Damluji AA, Alfaraidhy M, AlHajri N, et al. Sarcopenia and cardiovascular diseases. Circulation. 2023;147(20):1534–53. 10.1161/CIRCULATIONAHA.123.064071. [DOI] [PMC free article] [PubMed] [Google Scholar]
- 41.Jang YJ. The effects of protein and supplements on sarcopenia in human clinical studies: how older adults should consume protein and supplements. J Microbiol Biotechnol. 2023;33(2):143–50. 10.4014/jmb.2210.10014. [DOI] [PMC free article] [PubMed] [Google Scholar]
- 42.Dhanurdhar Y, Jagaty SK, Subhankar S, Behera D. Diagnostic and prognostic significance of serum Biomarkers-Serum amyloid A and CYFRA 21– 1 in lung Cancer. Int J Appl Basic Med Res. 2023;13(2):89–94. 10.4103/ijabmr.ijabmr_639_22. [DOI] [PMC free article] [PubMed] [Google Scholar]
Associated Data
This section collects any data citations, data availability statements, or supplementary materials included in this article.
Data Availability Statement
The datasets used and/or analysed during the current study are available from the corresponding author on reasonable request.