

Abstract
AIM
To evaluate alterations in conjunctival vascular density (CVD) and macular capillary density (MCD) in female patients with type 2 diabetes mellitus (T2DM) and gestational diabetes mellitus (GDM) using optical coherence tomography angiography (OCTA).
METHODS
A total of 60 female participants were recruited, comprising 20 patients with T2DM, 20 patients with GDM, and 20 healthy age-matched controls (HCs). OCTA was used to assess superficial and deep retinal and conjunctival capillary plexuses. Subsequently, changes in MCD were analyzed using a circular segmentation method (C1-C6), a hemispheric quadrant segmentation method [superior right (SR), superior left (SL), inferior left (IL), and inferior right (IR)], and the early treatment diabetic retinopathy study (ETDRS) segmentation method (S, I, R, L).
RESULTS
OCTA unequivocally demonstrated that the variations in CVD among HCs, T2DM, and GDM groups were statistically significant (P<0.001). In the superficial retinal capillary plexus (sRCP), significant differences were observed in the densities of total microvascular (TMI), microvasculature (MIR), and macrovascular (MAR) between patients with T2DM and HCs (P<0.05). Furthermore, the GDM group exhibited a more substantial reduction in MIR density compared to the T2DM group (P<0.01). In the deep retinal capillary plexus (dRCP), significant differences in the densities of TMI and MIR were identified between the T2DM group and HCs (P<0.05), with a notable difference in TMI density also observed between the GDM and T2DM groups (P<0.01). In the receiver operating characteristic (ROC) curve analysis, the area under the ROC curve (AUC) for TMI in sRCP between the T2DM group and HCs was 0.975, with a 95% confidence interval (CI) of 0.941–1. The AUC for MIR was highest in dRCP, with an AUC value of 0.914 and a 95%CI ranging from 0.847 to 0.981. In comparing the GDM and T2DM groups, the AUC for I region was maximized in sRCP, achieving a value of 0.978 with a 95%CI of 0.953–1. Additionally, the AUC for R region was maximized in dRCP, reaching a value of 0.99 with a 95%CI of 0.975 to 1.
CONCLUSION
The sRCP and dRCP densities show higher diagnostic sensitivity for T2DM and GDM. OCTA holds potential as a significant instrument for the early diagnosis and differentiation of T2DM and GDM.
Keywords: diabetes, optical coherence tomography angiography, superficial retinal capillary plexus, deep retinal capillary plexus, retinal region segmentation method
INTRODUCTION
Diabetes mellitus encompasses a spectrum of metabolic disorders marked by hyperglycemia, which arises predominantly from inadequate insulin secretion, defective insulin action, or a combination thereof[1]. Prolonged hyperglycemia may result in chronic damage and dysfunction across various systemic organs[2]. Clinically, diabetes is typically categorized into four primary types: type 1 diabetes mellitus, type 2 diabetes mellitus (T2DM), gestational diabetes mellitus (GDM), and other specific forms of diabetes[1]. Type 1 Diabetes Mellitus and other specific forms of diabetes are relatively less common in adult female[3]–[4].
T2DM is predominantly observed in adults and represents the most common form of diabetes, comprising 90%-95% of all diabetes cases[5]. The prevalence of T2DM is intricately linked to factors such as urbanization, an aging population, dietary changes, sedentary lifestyles, and the obesity epidemic[5]. The global incidence of T2DM is escalating, with a marked increase particularly evident in low- and middle-income countries[5]. Recent years have witnessed a significant rise in the prevalence of T2DM across various regions, including Asia, the Middle East, and North Africa[5].
GDM can manifest during pregnancy, with its incidence varying among different populations and generally affecting approximately 14% of all pregnancies[6]. The potential risk factors for GDM include obesity, advanced maternal age, a history of gestational diabetes, polycystic ovary syndrome, and a familial genetic predisposition to diabetes[7]. The prevalence of GDM is notably higher in Asia and the Middle East, which can be attributed in part to the elevated rates of pre-pregnancy and pregnancy-related obesity in these regions[8].
Clinical methods for blood glucose testing primarily include fasting plasma glucose (FPG) tests, oral glucose tolerance test (OGTT), glycated hemoglobin A1c (HbA1c) measurements, and random plasma glucose tests[9]. In these tests, OGTT offers a dynamic assessment of the body's response to a glucose load, uncovering insulin resistance and impairments in glucose metabolism, making it particularly suitable for detecting early impaired glucose tolerance and GDM[10]. Additionally, HbA1c reflects the average blood glucose levels over the past 2-3mo, providing stable information on glucose control, and is appropriate for the diagnosis and monitoring of T2DM[10]. Optical coherence tomography angiography (OCTA) is an advanced, non-invasive imaging modality that acquires blood flow data by tracking the motion of red blood cells[11]–[12]. Compared to optical coherence tomography, fluorescein fundus angiography, and indocyanine green angiography, OCTA offers a safer, more precise, and faster approach for delineating the vascular structures and internal blood flow dynamics at multiple layers of the choroid and retina[13]–[14]. Additionally, OCTA enables targeted quantitative analysis of the blood flow signals[15]. Regular OCTA assessments can effectively evaluate the effects of various diseases on retinal microcirculation, facilitating early detection and long-term management of these conditions[16]–[18].
Both T2DM and GDM can significantly affect ocular vessels, predominantly presenting as diabetic retinopathy (DR)[19]–[20]. DR is a prevalent microvascular complication in diabetic patients, which, if not addressed promptly, may result in vision impairment or blindness. OCTA is capable of detecting reductions in vascular density and regions of capillary non-perfusion prior to the onset of clinical symptoms of DR[21]. Research indicates that even in T2DM patients without clinical manifestations of retinopathy, there may be a reduction in retinal microvascular blood flow density[22]. For GDM, OCTA serves as a valuable tool for monitoring the effects of blood glucose fluctuations on retinal microcirculation during pregnancy. Even in the absence of overt retinopathy in GDM patients, OCTA is capable of detecting subtle vascular alterations[23]. This capability is instrumental in elucidating the potential long-term impacts of GDM on retinal health.
Currently, a substantial body of OCTA research focuses on changes in retinal vascular density in T2DM, whereas studies examining retinal vascular density alterations in GDM are comparatively scarce. Furthermore, limited research has addressed the variations in retinal vascular density between GDM and T2DM. Consequently, this study seeks to employ OCTA to assess macular capillary density (MCD) and conjunctival capillary density in female patients with T2DM and GDM. The objective is to determine whether significant differences in vascular density exist between these two cohorts and to compare these findings with those of healthy adult women. Through the application of OCTA for the non-invasive, quantitative evaluation of conjunctival and retinal capillary density in female individuals with T2DM and GDM, this study explores its effectiveness for early detection of alterations in conjunctival and retinal circulation among these patients.
PARTICIPANTS AND METHODS
Ethical Approval
This study rigorously complies with the ethical standards delineated in the Declaration of Helsinki and has obtained formal approval from the Ethics Committee of the First Affiliated Hospital of Nanchang University (approval number: 2021039). Prior to their participation, all participants were comprehensively informed about the study's objectives, methodologies, and potential risks, and written informed consent was obtained from each participant.
Participants
This cross-sectional study, conducted in 2023 at the Ophthalmology Clinic of the First Affiliated Hospital of Nanchang University, included female participants from a uniform age cohort. All Participants were recruited from both the Endocrinology Clinic and the Clinical Research Center for Eye Diseases. Every patient diagnosed for the first time. Participants in healthy age-matched controls (HCs) group were in good health, and their ocular health was evaluated through clinical examinations and OCTA imaging by ophthalmologists at the medical center to ensure the absence of abnormalities. All examinations were independently conducted by the same physician.
Inclusion and Exclusion Criteria
The inclusion criteria were as follows: 1) females aged 18 years or older; 2) T2DM: FPG ≥7.0 mmol/L (126 mg/dL), 2-h plasma glucose ≥11.1 mmol/L (200 mg/dL) during an OGTT, HbA1c ≥6.5% (48 mmol/L), or a random plasma glucose ≥11.1 mmol/L (200 mg/dL); GDM: 75 g OGTT [fasting ≥5.1 mmol/L (92 mg/dL)], 1-h plasma glucose ≥10.0 mmol/L (180 mg/dL), 2-h plasma glucose ≥8.5 mmol/L (153 mg/dL)[9]; 3) no prior administration of medications such as interferon or other drugs that could affect ocular health; 4) all participants were right-handed.
Additionally, the exclusion criteria were defined as follows: 1) individuals who smoke; 2) individuals undergoing long-term treatment for depression or anxiety; 3) individuals with systemic diseases other than T2DM and GDM; 4) individuals with a history of pupil dilation or intolerance to local anesthetic treatment within the past six months; 5) individuals with ocular diseases; 6) individuals with a history of ophthalmic surgery; 7) individuals with refractive errors.
As illustrated in Figure 1, the study initially screened 238 female participants and subsequently recruited a total of 60 female participants, categorized into three groups: 20 healthy adult women, 20 women with T2DM, and 20 women with GDM.
Figure 1. Participant recruitment flowchart.

Clinical and Ophthalmological Examinations
The comprehensive examination protocol incorporated a multifaceted assessment, which included the scoring of the Hospital Anxiety and Depression Scale (HADS), measurement of blood pressure (systolic blood pressure, SBP; diastolic blood pressure, DBP), evaluation of visual acuity (VA), measurement of intraocular pressure (IOP), and an extensive assessment of dry eye symptoms (tear break-up time, tBUT; tear meniscus height, TMH; Schirmer's test, SIT).
For the fundus retinal OCTA examinations, all participants underwent scanning conducted by a single examiner utilizing the Angio OCT Optovue RTVue Avanti XR system, manufactured by Optovue Inc., USA. All parameter settings are consistent with those of Shi et al[18] and Wu et al[24]. And ultimately obtained 3×3 mm OCTA images. In the acquired OCTA images, we performed a comprehensive analysis of the densities of the macrovascular (MAR), microvasculature (MIR), and total microvascular (TMI) within both the superficial and deep retinal layers (Figures 2A, 3A). OCTA images were subsequently processed and examined using three distinct segmentation methods: the central circular segmentation method, the hemispheric quadrant segmentation method, and the early treatment diabetic retinopathy study (ETDRS) segmentation method (Figures 2B, 3B). Among them, the central circular segmentation method can delineate the changes in vascular density from the macular center to the periphery; the hemispheric quadrant segmentation method aids in identifying regional differences and asymmetries in vascular density; the ETDRS segmentation method is a standardized approach that provides a comprehensive assessment of vascular density in both the central and peripheral regions. Meanwhile, OCTA images of the right eye from all participants were directly analyzed for vascular density (Figure 2). In contrast, OCTA images of the left eye required a mirror reversal prior to data analysis (Figure 3).
Figure 2. OCTA images 3×3 mm2 of the macular retina in the right eye and schematic diagrams of the three segmentation methods.

A: OCTA images 3×3 mm2 of the macular retina in the right eye; B: Schematic diagrams of the three segmentation methods. sRCP: Superficial retinal capillary plexus; dRCP: Deep retinal capillary plexus; RE: Right eye; TMI: Total microvascular; MAR: Macrovascular; MIR: Microvasculature; ETDRS: Early treatment diabetic retinopathy study; S: Superior; I: Inferior; L: Left; R: Right; SR: Superior right; SL: Superior left; IL: Inferior left; IR: Inferior right.
Figure 3. OCTA images 3×3 mm2 of the macular retina in the left eye and schematic diagrams of the three segmentation methods.

A: OCTA images 3×3 mm2 of the macular retina in the left eye; B: Schematic diagrams of the three segmentation methods. sRCP: Superficial retinal capillary plexus; dRCP: Deep retinal capillary plexus; LE: Left eye; TMI: Total microvascular; MAR: Macrovascular; MIR: Microvasculature; ETDRS: Early treatment diabetic retinopathy study; S: Superior; I: Inferior; L: Left; R: Right; SR: Superior right; SL: Superior left; IL: Inferior left; IR: Inferior right.
During the acquisition of conjunctival microvascular images, the parameters were configured in accordance with previously established protocols. Participants were instructed to maintain a natural seated posture, with their forehead and chin securely positioned against the respective rests. They were directed to gaze nasally, refrain from blinking, and keep their eyes stationary. The examiner then adjusted the position of the lens adapter and the instrument's focus to achieve a clear image. All scans were conducted at the same time in the afternoon for all subjects to mitigate potential diurnal variations.
Statistical Analysis
In this study, data processing and visualization were performed using SPSS version 26.0 (IBM Corporation, Armonk, NY, USA) and GraphPad Prism version 8.0.2 (GraphPad Software, La Jolla, CA, USA). The results are expressed as mean±standard deviation. Comparative analyses among the GDM, T2DM, and HC groups were conducted using one-way analysis of variance (ANOVA), the Kruskal-Wallis H-test, and the Kruskal-Wallis one-way analysis of variance by ranks. Statistical significance was defined as a P-value of less than 0.05. Furthermore, a receiver operating characteristic (ROC) analysis was conducted on the OCTA parameters across the three groups to calculate the area under the ROC curve (AUC) and to identify the critical thresholds for each parameter.
RESULTS
General Information
The study included a total of 20 female patients with T2DM (40 eyes), 20 with GDM (40 eyes), and 20 HCs (40 eyes). No statistically significant differences were observed in age and DBP among the three groups (Table 1). As illustrated in Table 2 and Figure 4A, in comparison to the HCs and T2DM group, SBP was significantly reduced in GDM group. Additionally, the HADS score was significantly elevated in the T2DM group compared to the HCs, while a higher HADS score observed in GDM group compared to the T2DM group (Table 2, Figure 4B).
Table 1. Demographic and clinical characteristics of the three study groups.
| Parameters | HCs | T2DM | GDM | P |
| Age (y) | 28.6±2.66 | 28.6±2.62 | 28.4±3.07 | 0.966a |
| SBP (mm Hg) | 127.5±13.25 | 128.45±6.48 | 120.2±2.67 | <0.001b |
| DBP (mm Hg) | 82.5±5.81 | 81.6±9.58 | 76.15±9.17 | 0.078b |
| HADS | 2.6±1.14 | 6.6±1.1 | 9.1±1.94 | <0.001b |
| VA | 0.8±0.21 | 0.71±0.21 | 0.57±0.15 | <0.001b |
| IOP (mm Hg) | 15.44±1.61 | 15.66±1.27 | 14.82±1.73 | 0.013b |
| tBUT (s) | 11.68±3.62 | 4.97±1 | 5±0.93 | <0.001b |
| TMH (mm) | 0.48±0.2 | 0.16±0.05 | 0.16±0.05 | <0.001b |
| SIT (mm) | 12.95±1.26 | 3.25±1.21 | 3.2±0.72 | <0.001b |
aOne-way analysis of variance; bKruskal-Wallis H-test. HCs: Healthy controls; T2DM: Type 2 diabetes mellitus; GDM: Gestational diabetes mellitus; SBP: Systolic blood pressure; DBP: Diastolic blood pressure; HADS: Hospital anxiety and depression scale; VA: Visual acuity; IOP: Intraocular pressure; tBUT: Tear break-up time; TMH: Tear meniscus height; SIT: Schirmer's test.
Table 2. Multiple comparisons of parameters with statistically significant differences between the three groups in Table 1.
| Parameters | HCs-T2DM |
HCs-GDM |
T2DM-GDM |
|||
| P | P a | P | P a | P | P a | |
| SBP (mm Hg) | 0.164 | 0.493 | 0.001 | 0.003 | <0.001 | <0.001 |
| HADS | <0.001 | <0.001 | <0.001 | <0.001 | 0.014 | 0.043 |
| VA | 0.033 | 0.099 | <0.001 | <0.001 | 0.005 | 0.016 |
| IOP (mm Hg) | 0.529 | 1 | 0.029 | 0.088 | 0.005 | 0.015 |
| tBUT (s) | <0.001 | <0.001 | <0.001 | <0.001 | 0.975 | 1 |
| TMH (mm) | <0.001 | <0.001 | <0.001 | <0.001 | 0.73 | 1 |
| SIT (mm) | <0.001 | <0.001 | <0.001 | <0.001 | 0.519 | 1 |
Kruskal-Wallis one-way analysis of variance by ranks. aP-values have been adjusted for multiple comparisons using the Bonferroni correction method. HCs: Healthy controls; T2DM: Type 2 diabetes mellitus; GDM: Gestational diabetes mellitus; SBP: Systolic blood pressure; DBP: Diastolic blood pressure; HADS: Hospital anxiety and depression scale; VA: Visual acuity; IOP: Intraocular pressure; tBUT: Tear break-up time; TMH: Tear meniscus height; SIT: Schirmer's test.
Figure 4. Heat maps of the parameters with statistically significant differences among the three groups in Table 2.

A: Heat map for multiple comparisons of SBP among the three groups; B: Heat map for multiple comparisons of HADS scores among the three groups; C: Heat map for multiple comparisons of VA among the three groups; D: Heat map for multiple comparisons of IOP among the three groups; E: Heat map for multiple comparisons of tBUT among the three groups; F: Heat map for multiple comparisons of TMH among the three groups; G: Heat map for multiple comparisons of SIT among the three groups. HCs: Healthy controls; T2DM: Type 2 diabetes mellitus; GDM: Gestational diabetes mellitus; SBP: Systolic blood pressure; HADS: Hospital anxiety and depression scale; VA: Visual acuity; IOP: Intraocular pressure; tBUT: Tear break-up time; TMH: Tear meniscus height; SIT: Schirmer's test; ns: Not significant. aP<0.05; bP<0.01; cP<0.001.
Moreover, the subjects in the T2DM and GDM group exhibited significant dry eye symptoms, characterized by accelerated tBUT, decreased TMH, and reduced SIT values (Table 2, Figure 4E–4G). Actually, no statistically significant differences were observed between the T2DM and HCs groups in terms of VA and IOP (Table 2, Figure 4C and 4D). However, in comparison to the T2DM group, the GDM group exhibited significantly lower VA and IOP values (Table 2, Figure 4C, 4D).
Comparison of Macular Superficial Retinal Capillary Density Among the Three Groups
The comparison of vascular density in the macular superficial retinal capillary plexus (sRCP) among the three groups of subjects is presented in Tables 3 and 4. When comparing superficial retinal capillary density (SRCD) in the sRCP, it was observed that the densities of the STMI, SMIR, and SMAR in the T2DM group were significantly lower than those in the HCs group (Table 4, Figures 5A and 6A). Additionally, the SMIR density in the GDM group was significantly lower than that in the T2DM group (Table 4, Figures 5A and 6A).
Table 3. Comparison of macular superficial retinal capillary density among the three groups.
| Parameters | HCs | T2DM | GDM | P |
| STMI | 1.87±0.02 | 1.73±0.08 | 1.7±0.05 | <0.001 |
| SMIR | 1.78±0.02 | 1.7±0.06 | 1.61±0.11 | <0.001 |
| SMAR | 1.12±0.03 | 1.09±0.04 | 1.07±0.08 | <0.001 |
| SR | 1.68±0.02 | 1.61±0.05 | 1.55±0.08 | <0.001 |
| SL | 1.68±0.02 | 1.67±0.07 | 1.6±0.06 | <0.001 |
| IL | 1.69±0.02 | 1.57±0.05 | 1.53±0.06 | <0.001 |
| IR | 1.65±0.04 | 1.6±0.05 | 1.49±0.05 | <0.001 |
| S | 1.68±0.01 | 1.66±0.05 | 1.57±0.05 | <0.001 |
| I | 1.67±0.02 | 1.63±0.04 | 1.48±0.05 | <0.001 |
| R | 1.73±0.03 | 1.63±0.06 | 1.59±0.06 | <0.001 |
| L | 1.67±0.03 | 1.65±0.06 | 1.61±0.07 | <0.001 |
| C1 | 1.53±0.05 | 1.44±0.03 | 1.41±0.26 | <0.001 |
| C2 | 1.57±0.03 | 1.51±0.06 | 1.47±0.23 | <0.001 |
| C3 | 1.53±0.03 | 1.5±0.05 | 1.32±0.21 | <0.001 |
| C4 | 1.51±0.03 | 1.5±0.03 | 1.42±0.14 | <0.001 |
| C5 | 1.5±0.04 | 1.49±0.04 | 1.47±0.13 | 0.776 |
| C6 | 1.52±0.04 | 1.5±0.06 | 1.5±0.15 | 0.108 |
Kruskal-Wallis H-test. HCs: Healthy controls; T2DM: Type 2 diabetes mellitus; GDM: Gestational diabetes mellitus; STMI: Superficial total microvascular; SMIR: Superficial microvasculature; SMAR: Superficial macrovascular; SR: Superior right; SL: Superior left; IL: Inferior left; IR: Inferior right; S: Superior; I: Inferior; R: Right; L: Left.
Table 4. Multiple comparisons of parameters with statistically significant differences among the three groups in Table 3.
| Parameters | HCs-T2DM |
HCs-GDM |
T2DM-GDM |
|||
| P | P a | P | P a | P | P a | |
| STMI | <0.001 | <0.001 | <0.001 | <0.001 | 0.067 | 0.202 |
| SMIR | <0.001 | <0.001 | <0.001 | <0.001 | <0.001 | 0.001 |
| SMAR | 0.003 | 0.008 | <0.001 | <0.001 | 0.033 | 0.098 |
| SR | <0.001 | <0.001 | <0.001 | <0.001 | 0.003 | 0.009 |
| SL | 0.204 | 0.611 | <0.001 | <0.001 | <0.001 | <0.001 |
| IL | <0.001 | <0.001 | <0.001 | <0.001 | 0.063 | 0.189 |
| IR | 0.001 | 0.002 | <0.001 | <0.001 | <0.001 | <0.001 |
| S | 0.011 | 0.032 | <0.001 | <0.001 | <0.001 | <0.001 |
| I | 0.001 | 0.003 | <0.001 | <0.001 | <0.001 | <0.001 |
| R | <0.001 | <0.001 | <0.001 | <0.001 | 0.026 | 0.079 |
| L | <0.001 | 0.001 | <0.001 | <0.001 | 0.667 | 1 |
| C1 | <0.001 | <0.001 | 0.001 | 0.003 | 0.224 | 0.671 |
| C2 | <0.001 | <0.001 | <0.001 | <0.001 | 0.956 | 1 |
| C3 | 0.01 | 0.03 | <0.001 | <0.001 | 0.001 | 0.002 |
| C4 | 0.122 | 0.366 | <0.001 | <0.001 | 0.006 | 0.018 |
Kruskal-Wallis one-way analysis of variance by ranks. aP-values have been adjusted for multiple comparisons using the Bonferroni correction method. HCs: Healthy controls; T2DM: Type 2 diabetes mellitus; GDM: Gestational diabetes mellitus; STMI: Superficial total microvascular; SMIR: Superficial microvasculature; SMAR: Superficial macrovascular; SR: Superior right; SL: Superior left; IL: Inferior left; IR: Inferior right; S: Superior; I: Inferior; R: Right; L: Left.
Figure 5. OCTA images 3×3 mm2 of the macular superficial retina and schematic diagrams of the three segmentation methods for the three groups of subjects.

A: OCTA images of the macular retinal sRCP, STMI, SMAR, and SMIR in the HCs, T2DM, and GDM groups; B: Schematic diagrams representing the shallow retinal capillary density using the three segmentation methods for the HCs, T2DM, and GDM groups. The colored areas in the T2DM group represent statistically significant differences compared to the HCs; the colored areas in the GDM group represent statistically significant differences compared to the T2DM; and the colored areas in the merged figure represent overlapping regions with statistically significant differences identified by the three segmentation methods. sRCP: Superficial retinal capillary plexus; STMI: Superficial total microvascular; SMAR: Superficial macrovascular; SMIR: Superficial microvasculature; HCs: Healthy controls; T2DM: Type 2 diabetes mellitus; GDM: Gestational diabetes mellitus; ETDRS: Early treatment diabetic retinopathy study; S: Superior; I: Inferior; L: Left; R: Right; SR: Superior right; SL: Superior left; IL: Inferior left; IR: Inferior right.
Figure 6. Bar charts of macular superficial retinal capillary density with statistically significant differences among the three groups of subjects.

A: Bar charts of STMI, SMIR, and SMAR densities for the three groups of subjects; B: Bar charts of superficial retinal vascular density using the hemispheric quadrant segmentation method for the three groups of subjects; C: Bar charts of superficial retinal vascular density using the ETDRS segmentation method for the three groups of subjects; D: Bar charts of superficial retinal vascular density using the central circular segmentation method for the three groups of subjects. STMI: Superficial total microvascular; SMAR: Superficial macrovascular; SMIR: Superficial microvasculature; HCs: Healthy controls; T2DM: Type 2 diabetes mellitus; GDM: Gestational diabetes mellitus; ETDRS: Early treatment diabetic retinopathy study; S: Superior; I: Inferior; L: Left; R: Right; SR: Superior right; SL: Superior left; IL: Inferior left; IR: Inferior right; ns: Not significant. aP<0.05; bP<0.01; cP<0.001.
In this study, no statistically significant differences were observed in the SRCD among the three groups within the C5 and C6 regions (Table 3). These regions come from the central circular segmentation method, which partitioned the circular region, with a diameter ranging from 0.6 to 2.5 mm, into six concentric rings with a bandwidth of 0.16 mm, designated as C1–C6, after excluding the avascular zone with a diameter of 0.6 mm in the fovea. In the central circular segmentation method, the SRCD in the T2DM group was significantly lower than that in the HCs group in the C1, C2, and C3 regions (Table 4, Figures 5B and 6D). Additionally, the SRCD in the GDM group was significantly lower than that in the T2DM group in the C3 and C4 regions (Table 4, Figures 5B and 6D).
In our study, the hemispheric quadrant segmentation method partitioned the image into four quadrants—superior right (SR), superior left (SL), inferior left (IL), and inferior right (IR)—using horizontal and vertical lines. Upon conducting a comprehensive analysis employing the hemispheric quadrant segmentation method, it was observed that the SRCD in the SR, IR, and IL regions of the T2DM cohort was markedly reduced in comparison to the HCs (Table 4, Figures 5B and 6B). Additionally, the SRCD in the GDM group was significantly lower than that in the T2DM group in the SR, SL, and IR regions (Table 4, Figures 5B and 6B).
In this research, the ETDRS segmentation method divided the image into four quadrants—superior (S), inferior (I), left (L), and right (R)—along two diagonals intersecting at 90 degrees. Employing the ETDRS segmentation method, we observed that, compared to the HCs, the SRCD in T2DM patients was significantly reduced in the S, I, R, and L regions (Table 4, Figures 5B and 6C). Furthermore, compared to the T2DM group, the SRCD in GDM patients was significantly reduced in the S and I regions (Table 4, Figures 5B and 6C).
Comparison of Macular Deep Retinal Capillary Density Among the Three Groups
In patients with DR, the density of deep retinal capillaries typically decreases, which caused by an increase in microvascular occlusions and the expansion of non-perfused areas. In the macular deep retinal capillary plexus (dRCP) of this study, the vascular density comparisons among the three subject groups are presented in Tables 5 and 6. The study revealed no statistically significant differences in deep retinal capillary density (DRCD) among the three groups within the DMAR, SL, S, L, C5, and C6 regions. However, when examining the DRCD in other regions of the dRCP, the densities of DTMI and DMIR in the T2DM group were found to be significantly lower than those in the HCs group. Additionally, the DTMI density in the GDM group was significantly lower than that in the T2DM group (Table 6, Figures 7A and 8A).
Table 5. Comparison of macular deep retinal capillary density among the three groups of subjects.
| Parameters | HCs | T2DM | GDM | P |
| DTMI | 1.81±0.05 | 1.73±0.07 | 1.67±0.06 | <0.001 |
| DMIR | 1.67±0.06 | 1.56±0.06 | 1.49±0.11 | <0.001 |
| DMAR | 1±0.05 | 1±0.07 | 0.98±0.07 | 0.288 |
| SR | 1.64±0.05 | 1.56±0.04 | 1.48±0.11 | <0.001 |
| SL | 1.61±0.05 | 1.59±0.06 | 1.58±0.09 | 0.261 |
| IL | 1.63±0.05 | 1.51±0.19 | 1.49±0.14 | 0.001 |
| IR | 1.6±0.09 | 1.53±0.09 | 1.52±0.22 | 0.008 |
| S | 1.61±0.05 | 1.59±0.05 | 1.54±0.13 | 0.074 |
| I | 1.62±0.08 | 1.51±0.12 | 1.48±0.13 | <0.001 |
| R | 1.68±0.06 | 1.62±0.06 | 1.36±0.1 | <0.001 |
| L | 1.59±0.07 | 1.59±0.09 | 1.62±0.09 | 0.069 |
| C1 | 1.27±0.11 | 1.21±0.05 | 1.15±0.16 | <0.001 |
| C2 | 1.45±0.07 | 1.35±0.08 | 1.31±0.15 | <0.001 |
| C3 | 1.49±0.07 | 1.41±0.06 | 1.25±0.12 | <0.001 |
| C4 | 1.46±0.06 | 1.45±0.07 | 1.29±0.15 | <0.001 |
| C5 | 1.47±0.06 | 1.46±0.07 | 1.44±0.1 | 0.213 |
| C6 | 1.48±0.06 | 1.47±0.06 | 1.45±0.15 | 0.138 |
Kruskal-Wallis H-test. HCs: Healthy controls; T2DM: Type 2 diabetes mellitus; GDM: Gestational diabetes mellitus; DTMI: Deep total microvascular; DMIR: Deep microvasculature; DMAR: Deep macrovascular; SR: Superior right; SL: Superior left; IL: Inferior left; IR: Inferior right; S: Superior; I: Inferior; R: Right; L: Left.
Table 6. Multiple comparisons of parameters with statistically significant differences among the three groups in Table 5.
| Parameters | HCs-T2DM |
HCs-GDM |
T2DM-GDM |
|||
| P | P a | P | P a | P | P a | |
| DTMI | <0.001 | <0.001 | <0.001 | <0.001 | 0.002 | 0.005 |
| DMIR | <0.001 | <0.001 | <0.001 | <0.001 | 0.059 | 0.177 |
| SR | <0.001 | <0.001 | <0.001 | <0.001 | 0.003 | 0.008 |
| IL | 0.012 | 0.037 | <0.001 | 0.001 | 0.314 | 0.943 |
| IR | 0.002 | 0.006 | 0.253 | 0.759 | 0.054 | 0.161 |
| I | <0.001 | <0.001 | <0.001 | <0.001 | 0.501 | 1 |
| R | 0.007 | 0.021 | <0.001 | <0.001 | <0.001 | <0.001 |
| C1 | 0.013 | 0.04 | <0.001 | <0.001 | 0.135 | 0.405 |
| C2 | <0.001 | <0.001 | <0.001 | <0.001 | 0.773 | 1 |
| C3 | <0.001 | <0.001 | <0.001 | <0.001 | <0.001 | <0.001 |
| C4 | 0.569 | 1 | <0.001 | <0.001 | <0.001 | <0.001 |
Kruskal-Wallis one-way analysis of variance by ranks. aP-values have been adjusted for multiple comparisons using the Bonferroni correction method. HCs: Healthy controls; T2DM: Type 2 diabetes mellitus; GDM: Gestational diabetes mellitus; DTMI: Deep total microvascular; DMIR: Deep microvasculature; SR: Superior right; IL: Inferior left; IR: Inferior right; I: Inferior; R: Right.
Figure 7. Three-group subject macular deep retinal 3×3 mm2 OCTA images and schematic diagrams of the three segmentation methods.

A: OCTA images of the macular retinal dRCP, DTMI, DMAR, and DMIR for the HCs, T2DM, and GDM groups; B: Schematic diagrams representing deep retinal capillary density using the three segmentation methods for the HCs, T2DM, and GDM groups. The colored areas in the T2DM group represent statistically significant differences compared to the HCs; the colored areas in the GDM group represent statistically significant differences compared to the T2DM; and the colored areas in the merged figure represent overlapping regions with statistically significant differences identified by the three segmentation methods. dRCP: Deep retinal capillary plexus; DTMI: Deep total microvascular; DMAR: Deep macrovascular; DMIR: Deep microvasculature; HCs: Healthy controls; T2DM: Type 2 diabetes mellitus; GDM: Gestational diabetes mellitus; ETDRS: Early treatment diabetic retinopathy study; S: Superior; I: Inferior; L: Left; R: Right; SR: Superior right; SL: Superior left; IL: Inferior left; IR: Inferior right.
Figure 8. Bar charts of macular deep retinal capillary density with statistically significant differences among the three groups of subjects.

A: Bar charts of DTMI and DMIR densities for the three groups of subjects; B: Bar charts of deep retinal vascular density using the hemispheric quadrant segmentation method for the three groups of subjects; C: Bar charts of deep retinal vascular density using the ETDRS segmentation method for the three groups of subjects; D: Bar charts of deep retinal vascular density using the central circular segmentation method for the three groups of subjects. HCs: Healthy controls; T2DM: Type 2 diabetes mellitus; GDM: Gestational diabetes mellitus; DTMI: Deep total microvascular; DMIR: Deep microvasculature; I: Inferior; R: Right; SR: Superior right; IL: Inferior left; IR: Inferior right; ns: Not significant. aP<0.05; bP<0.01; cP<0.001.
Upon conducting a comprehensive analysis employing the hemispheric quadrant segmentation method, it was observed that the DRCD in the SR, IL, and IR regions of the T2DM cohort was markedly reduced in comparison to the HCs (Table 6, Figures 7B and 8B).
Employing the ETDRS segmentation method, we observed that the DRCD in T2DM patients was significantly reduced in the I and R regions compared to HCs. Furthermore, the DRCD in GDM patients was significantly lower in the R region compared to T2DM patients (P<0.001; Table 6, Figures 7B and 8C).
In the central circular segmentation method, it was observed that the DRCD in the T2DM group was significantly lower than that in the HCs group in the C1, C2, and C3 regions. Additionally, the DRCD in the GDM group was significantly lower than that in the T2DM group in the C3 and C4 regions (Table 6, Figures 7B and 8D).
Comparison of Temporal Conjunctival Vascular Density Among the Three Groups
Changes in conjunctival vessels not only reflect the ocular status but may also indicate alterations in systemic microvascular function. The variation in vascular density is correlated with the severity of diabetic retinopathy and can serve as a crucial marker for monitoring the progression of the disease. Consequently, we employed OCTA to measure the changes in temporal conjunctival vascular density (CVD) among the three groups of participants. In this study, temporal CVD demonstrated statistically significant differences among the HCs, T2DM, and GDM groups (Table 7). Following multiple comparisons, it was determined that the temporal CVD in the T2DM group was significantly lower than that in the HCs group. Additionally, the temporal CVD in the GDM group was significantly lower than that in the T2DM group (Table 8, Figure 9A). In the ROC curve analysis, the AUC for temporal CVD between T2DM and HCs was higher than that between GDM and T2DM (Figure 9B).
Table 7. Comparison of temporal conjunctival vascular density among the three groups.
| Parameters | HCs | T2DM | GDM | P |
| Temporal conjunctival vascular density | 1.61±0.05 | 1.57±0.04 | 1.53±0.07 | <0.001 |
Kruskal-Wallis h-test. HCs: Healthy controls; T2DM: Type 2 diabetes mellitus; GDM: Gestational diabetes mellitus.
Table 8. Multiple comparisons of temporal conjunctival vascular density among the three groups.
| Parameters | HCs-T2DM |
HCs-GDM |
T2DM-GDM |
|||
| P | P a | P | P a | P | P a | |
| Temporal conjunctival vascular density | 0.002 | 0.006 | <0.001 | <0.001 | 0.01 | 0.029 |
Kruskal-Wallis one-way analysis of variance by ranks. aP-values have been adjusted for multiple comparisons using the Bonferroni correction method. HCs: Healthy controls; T2DM: Type 2 diabetes mellitus; GDM: Gestational diabetes mellitus.
Figure 9. Heat maps and ROC curves of temporal CVD among the three groups of subjects.
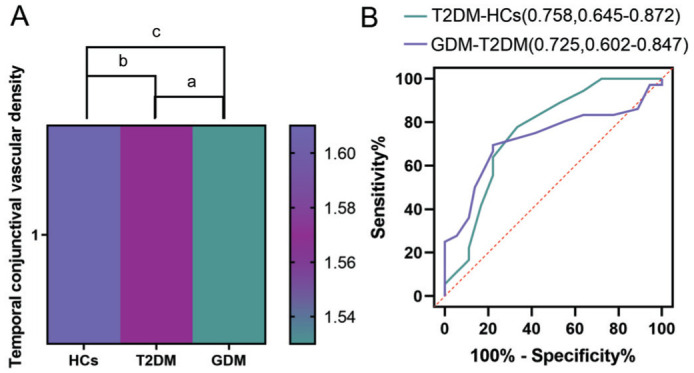
A: Heat maps of temporal CVD among the three groups of subjects; B: ROC curves of temporal CVD among the three groups of subjects. CVD: Conjunctival vascular density; HCs: Healthy controls; T2DM: Type 2 diabetes mellitus; GDM: Gestational diabetes mellitus; ROC: Receiver operating characteristic; AUC: Area under the ROC curve. aP<0.05; bP<0.01; cP<0.001.
ROC Curve Analysis
The retinal capillary density, as assessed by OCTA, demonstrated high specificity and sensitivity in differentiating T2DM patients from HCs and GDM patients from T2DM patients (Figures 10 and 11). ROC curve analysis was conducted separately for the comparisons of T2DM versus HCs and GDM versus T2DM. The areas exhibiting significant differences in retinal capillary density were subsequently plotted on the ROC curves. As illustrated in Figure 10, the vascular density in the superficial retina exhibited statistically significant differences between the T2DM group and the HCs group across the STMI, SMIR, SMAR, SR, IL, IR, S, I, R, L, C1, C2, C3, C4, and C6 regions, as determined by ROC curve analysis. In the deep retina, the T2DM group demonstrated significantly lower vascular density in the DTMI, DMIR, SR, IL, IR, I, R, C1, C2, and C3 regions compared to the HCs group. Among these, the AUC for vascular density in the IL region and the STMI region between T2DM and HCs groups were the highest and the second highest, respectively. In the deep retina, the region with the largest AUC was the DMIR.
Figure 10. ROC curves of macular capillary density in the superficial and deep layers for the T2DM versus HCs groups.

A: ROC curves for STMI, SMIR, and SMAR densities in the macular retina of the T2DM versus HCs groups; B: ROC curves for superficial retinal capillary density in the regions formed by the three segmentation methods for the T2DM versus HCs groups; C: ROC curves for DTMI, DMIR, and DMAR densities in the macular retina of the T2DM versus HCs groups; D: ROC curves for deep retinal capillary density in the regions formed by the three segmentation methods for the T2DM versus HCs groups. HCs: Healthy controls; T2DM: Type 2 diabetes mellitus; ROC: Receiver operating characteristic; AUC: Area under the ROC curve; STMI: Superficial total microvascular; SMAR: Superficial macrovascular; SMIR: Superficial microvasculature; DTMI: Deep total microvascular; DMIR: Deep microvasculature; SR: Superior right; IL: Inferior left; IR: Inferior right; S: Superior; I: Inferior; R: Right; L: Left.
Figure 11. ROC curves of macular capillary density in the superficial and deep layers for the GDM versus T2DM groups.

A: ROC curves for STMI, SMIR, and SMAR densities in the macular retina of the GDM versus T2DM groups; B: ROC curves for superficial retinal capillary density in the regions formed by the three segmentation methods for the GDM versus T2DM groups; C: ROC curves for DTMI, DMIR densities in the macular retina of the GDM versus T2DM groups; D: ROC curves for deep retinal capillary density in the regions formed by the three segmentation methods for the GDM versus T2DM groups. GDM: Gestational diabetes mellitus; T2DM: Type 2 diabetes mellitus; ROC: Receiver operating characteristic; AUC: Area under the ROC curve; STMI: Superficial total microvascular; SMAR: Superficial macrovascular; SMIR: Superficial microvasculature; DTMI: Deep total microvascular; DMIR: Deep microvasculature; SR: Superior right; SL: Superior left; IL: Inferior left; IR: Inferior right; S: Superior; I: Inferior; R: Right; L: Left.
As depicted in Figure 11, in the superficial retina, the vascular density in the STMI, SMIR, SMAR, SR, SL, IL, IR, S, I, R, C3, and C4 regions of the GDM group showed statistical significance compared to the T2DM group in the ROC curve analysis. In the deep retina, the vascular density in the DTMI, DMIR, SR, R, L, C1, C3, and C4 regions of the GDM group was significantly lower than that in the T2DM group. Among the regions analyzed, the area with the highest AUC in the superficial retina when comparing the GDM and T2DM groups was region I. In the deep retina, the region with the highest AUC was region R.
DISCUSSION
OCTA demonstrates high sensitivity in the diagnosis of DR, making it a powerful tool for identifying early-stage retinal pathology[25]. In a prospective study, researchers used OCTA to screen diabetic patients[26]. OCTA detected early signs of retinal microvascular pathology, allowing for treatment initiation before significant visual impairment occurred. In another study, compared to ultra-widefield color fundus photography and ultra-widefield fluorescein angiography, OCTA exhibits greater efficacy in identifying retinal neovascularization and intraretinal microvascular abnormalities in patients with DR[27].
In this study, we employed OCTA to examine alterations in conjunctival and retinal capillary density among female patients diagnosed with T2DM and GDM. Relative to HCs, T2DM patients demonstrated a significant reduction in both conjunctival and retinal capillary density. Notably, GDM patients exhibited an even more pronounced decrease in conjunctival and MCD compared to T2DM patients, with the most substantial changes observed in the deep retinal region.
T2DM impacts more than 25% of individuals over the age of 50, with a notable prevalence among postmenopausal women[28]. Nonetheless, recent lifestyle modifications, including unhealthy dietary habits, physical inactivity, and rising obesity rates, have led to a growing incidence of T2DM among younger women, including adolescents[29]. GDM is characterized by hyperglycemia first identified during pregnancy and predominantly occurs in women of reproductive age. Screening for GDM is typically performed between the 24th and 28th weeks of gestation[30]. In this study, the mean age of female patients diagnosed with T2DM was 28.6y while the mean age of patients with GDM was 28.4y.
Mental health screening is crucial for patients with diabetes, primarily because psychological issues such as stress, depression, and anxiety can affect insulin sensitivity and treatment compliance, thereby increasing the risk of complications[31]. Early identification and intervention can enhance the quality of life and the effectiveness of disease management, as well as improve overall health management capabilities. Moreover, regular mental health assessments contribute to a comprehensive and effective management of diabetes. In this study, we employed the HADS scoring system to assess the levels of anxiety and depression in patients with T2DM and GDM. The research findings indicated that the HADS scores in the T2DM group were significantly higher compared to the HCs, suggesting potential psychological issues within this population. Additionally, the HADS scores in the GDM cohort were even higher than those observed in the T2DM group. This may be ascribed to a variety of pregnancy-specific psychological and physiological factors. These include the inherent stress and anxiety associated with pregnancy, concerns regarding fetal health, the effects of hormonal fluctuations, and lifestyle modifications[32]. For patients with diabetes who have high HADS scores, comprehensive intervention measures include psychological intervention, pharmacological intervention, and lifestyle modification[33]. Psychological interventions mainly encompass counseling, cognitive-behavioral therapy, and stress management. Pharmacological treatment requires close monitoring of potential effects on blood glucose levels and pregnancy. Lifestyle interventions primarily involve healthy eating and regular physical exercise. Additionally, involvement of family members for patients are also crucial.
The results of this study demonstrate that there was no statistically significant difference in blood pressure levels between female patients with T2DM and HCs. Conversely, the SBP of patients with GDM was significantly lower compared to those with T2DM. The absence of a statistical difference in blood pressure between female T2DM patients and HCs may be attributable to factors such as age and disease duration. Specifically, the female T2DM subjects included in this study were younger individuals with a first diagnosis, and their disease had not yet advanced to a stage where it would impact blood pressure. Secondly, female patients generally exhibit superior cardiovascular health, healthier body mass index, and more favorable lifestyle habits compared to male patients, which may contribute to maintaining their blood pressure within the normal range[34]. The observed lower SBP in patients with GDM compared to those with T2DM may be attributable to hormonal influences. Specifically, during pregnancy, prostaglandin E2 produced by the placenta induces vasodilation, thereby reducing blood pressure[35].
Prolonged hyperglycemia can lead to DR, characterized by blurred vision, field defects, or the presence of dark shadows[36]. Severe retinopathy can result in the growth of abnormal blood vessels, which may increase intraocular pressure and impair vision[37]. In our study, the T2DM and GDM groups consisted of patients in the early stages of diagnosis without DR, hence there were no statistically significant differences in VA and IOP when compared to the HCs group. However, our findings indicate that the VA and IOP in patients with GDM were significantly lower than those in T2DM patients. This discrepancy may be explained by physiological ocular changes during pregnancy[38]. For instance, increases in corneal thickness, corneal curvature, and lens curvature during pregnancy may lead to alterations in IOP and VA.
Dry eye syndrome is notably more frequent among individuals suffering from diabetes[39]. Hyperglycemia can result in reduced tear production and decreased tear quality[40]. Additionally, diabetic neuropathy may also affect corneal sensitivity, leading to ocular discomfort[41]. Our study corroborated the presence of the same degree of dry eye syndrome in female patients with T2DM and GDM, which causes patients to experience increased ocular discomfort and diminishes their quality of life. Thus, individuals with diabetes require regular ophthalmic examinations, which aid in the early detection and management of dry eye syndrome and other ocular complications in diabetic patients, thereby enhancing their quality of life.
Alterations in the ocular fundus vasculature in patients with T2DM and GDM predominantly manifest as DR, a diabetes-induced condition that results in damage to the small retinal vessels[19]. OCTA is capable of detecting microvascular changes in the early stages of DR by quantifying retinal vascular density and the perfusion index, thereby facilitating the grading of DR[21]. A study using SS-OCTA reported that a reduction in the peripheral vascular density of the retinal sRCP was associated with the 2-year incidence of DR in patients with T2DM[42]. In another study, OCTA findings revealed that changes in the retinal capillaries of patients with T2DM precede the onset of DR[22]. In our study, OCTA findings revealed that the CVD was significantly reduced in the T2DM group compared to the HCs group. Furthermore, the GDM group exhibited an even greater reduction in CVD compared to the T2DM group. Additionally, the vascular density in the superficial retina regions, specifically STMI, SMIR, SMAR, SR, IL, IR, S, I, R, L, C1, C2, and C3, was markedly lower in T2DM patients relative to the HCs group. In the GDM group, the vascular density in the regions of SMIR, SR, SL, IR, S, I, C3, and C4 was further diminished compared to the T2DM group. In the deep retina, the vascular density in the DTMI, DMIR, SR, IL, IR, I, R, C1, C2, and C3 regions of patients with T2DM was significantly lower compared to the HCs group. Furthermore, the vascular density in the DTMI, SR, R, C3, and C4 regions of the deep retina in patients with GDM was further reduced in comparison to the T2DM group. This reduction in vascular density is attributed to long-term hyperglycemia, which induces endothelial cell damage and results in microvascular lesions[43].
In an OCTA study comparing pregnant women with healthy controls, researchers observed a significant increase in retinal vessel density in the macular area of the pregnant group[44]. In another OCTA study, the expansion of the retinal central foveal non-perfusion area in postmenopausal women was reported, and it was indicated that this phenomenon may be related to the decrease in estrogen levels[45]. Additionally, studies have reported that patients with GDM exhibit higher lipid levels compared to healthy women[46]. Hyperlipidemia can result in retinal vascular narrowing, occlusion, and microcirculatory disturbances[47], thereby reducing vascular density and impacting visual acuity and ocular health. This might explain why the reduction in ocular vascular density was more pronounced in the GDM group compared to the T2DM group in our study. Although estrogen and progesterone levels are elevated in GDM patients, the adverse effects of hyperglycemia and hyperlipidemia may predominate in GDM.
Additionally, we performed a ROC curve analysis to compare regions exhibiting statistically significant differences in macular superficial and deep retinal vascular density among the three subject groups. This analysis aimed to evaluate the sensitivity and specificity of these regions in differentiating T2DM from GDM. The findings revealed that, within the superficial retinal layer, the region with the highest AUC was the IL region when comparing the T2DM group to the HCs group, and the I region when comparing the GDM group to the T2DM group. The 95%CI for the retinal superficial IL area in the T2DM group and HCs group was 1-1, likely due to the relatively small sample size. Therefore, we assert that the second largest AUC region, STMI, exhibits superior sensitivity and specificity in distinguishing between T2DM and HCs. In terms of vascular density in the deep retinal layer, the MIR region demonstrated the highest AUC when comparing the T2DM group to the HC group, while the R region exhibited the highest AUC when comparing the GDM group to the T2DM group. The findings underscore the precision of OCTA in delineating the initial retinal microvascular alterations in patients with GDM and T2DM.
Certainly, our study has certain limitations. First, the sample size was relatively small, which may affect the precision of our results. Second, we did not further investigate the impact of blood glucose control levels in T2DM and GDM on conjunctival and retinal vascular density. Future studies should conduct additional time-series analyses to address this issue.
In conclusion, in female patients with T2DM, OCTA results demonstrated a significant reduction in CVD and MCD compared to HCs. ROC curve analysis indicated that the densities of retinal TMI and MIR exhibited higher diagnostic sensitivity for T2DM in the sRCP and dRCP, respectively. This implies that a reduction in TMI density within the sRCP and MIR density within the dRCP can be effectively utilized for the clinical diagnosis of T2DM. In patients with GDM, OCTA results revealed a further decline in CVD and MCD compared to those with T2DM. ROC curve analysis identified that the vascular densities in the retinal superficial I and deep R regions had higher specificity and sensitivity in differentiating GDM from T2DM. In clinical practice, early identification of GDM can aid in the development of a detailed postpartum follow-up plan, allowing for close monitoring of blood glucose and metabolic status, thereby reducing the risk of long-term complications. Moreover, early intervention can decrease the risk of retinal damage from hyperglycemia during pregnancy and the postpartum period.
Footnotes
Foundations: Supported by National Natural Science Foundation of China (No.82160195; No.82460203); The Science and Technology Innovation Program of Changde City (No.2023YD25).
Conflicts of Interest: Zhang J, None; Yu Y, None; Zhou XM, None; Liao X, None; Hu JY, None; Ling Q, None; Zou J, None; Chen C, None; He LQ, None; Wei H, None; Chen X, None; Wang YX, None; Shao Y, None; Li RM, None.
REFERENCES
- 1.Harreiter J, Roden M. Diabetes mellitus—definition, classification, diagnosis, screening and prevention (update 2019) Wien Klin Wochenschr. 2019;131(Suppl 1):6–15. doi: 10.1007/s00508-019-1450-4. [DOI] [PubMed] [Google Scholar]
- 2.Kolarić V, Svirčević V, Bijuk R, et al. Chronic complications of diabetes and quality of life. Acta Clin Croat. 2022;61(3):520–527. doi: 10.20471/acc.2022.61.03.18. [DOI] [PMC free article] [PubMed] [Google Scholar]
- 3.GBD Diabetes Collaborators. Global, regional, and national burden of diabetes from 1990 to 2021, with projections of prevalence to 2050: a systematic analysis for the Global Burden of Disease Study 2021. Lancet. 2023;402(10397):203–234. doi: 10.1016/S0140-6736(23)01301-6. [DOI] [PMC free article] [PubMed] [Google Scholar]
- 4.Kaser S, Hofer SE, Kazemi-Shirazi L, et al. Other specific types of diabetes and exocrine pancreatic insufficiency (update 2023) Wien Klin Wochenschr. 2023;135(Suppl 1):18–31. doi: 10.1007/s00508-022-02123-x. [DOI] [PMC free article] [PubMed] [Google Scholar]
- 5.Nanda M, Sharma R, Mubarik S, et al. Type-2 diabetes mellitus (T2DM): spatial-temporal patterns of incidence, mortality and attributable risk factors from 1990 to 2019 among 21 world regions. Endocrine. 2022;77(3):444–454. doi: 10.1007/s12020-022-03125-5. [DOI] [PubMed] [Google Scholar]
- 6.Modzelewski R, Stefanowicz-Rutkowska MM, Matuszewski W, et al. Gestational diabetes mellitus-recent literature review. J Clin Med. 2022;11(19):5736. doi: 10.3390/jcm11195736. [DOI] [PMC free article] [PubMed] [Google Scholar]
- 7.Zito G, Della Corte L, Giampaolino P, et al. Gestational diabetes mellitus: prevention, diagnosis and treatment. A fresh look to a busy corner. J Neonatal Perinatal Med. 2020;13(4):529–541. doi: 10.3233/NPM-190305. [DOI] [PubMed] [Google Scholar]
- 8.Wang H, Li NH, Chivese T, et al. IDF diabetes atlas: estimation of global and regional gestational diabetes mellitus prevalence for 2021 by international association of diabetes in pregnancy study group's criteria. Diabetes Res Clin Pract. 2022;183:109050. doi: 10.1016/j.diabres.2021.109050. [DOI] [PubMed] [Google Scholar]
- 9.American Diabetes Association Professional Practice Committee. 2. classification and diagnosis of diabetes: standards of medical care in diabetes-2022. Diabetes Care. 2022;45(Suppl 1):S17–S38. doi: 10.2337/dc22-S002. [DOI] [PubMed] [Google Scholar]
- 10.Sacks DB, Arnold M, Bakris GL, et al. Guidelines and recommendations for laboratory analysis in the diagnosis and management of diabetes mellitus. Clin Chem. 2011;57(6):e1–e47. doi: 10.1373/clinchem.2010.161596. [DOI] [PubMed] [Google Scholar]
- 11.Luo YQ, Xu ZS, Hu JY, et al. Retinal microvascular changes in patients with pancreatitis and their clinical significance. Sci Rep. 2024;14(1):18935. doi: 10.1038/s41598-024-69493-2. [DOI] [PMC free article] [PubMed] [Google Scholar]
- 12.Pujari A, Saluja G, Chawla R, et al. Optical coherence tomography angiography in amblyopia: a critical update on current understandings and future perspectives. Eur J Ophthalmol. 2022;32(3):1324–1332. doi: 10.1177/11206721211042554. [DOI] [PubMed] [Google Scholar]
- 13.Ho S, Ly A, Ohno-Matsui K, et al. Diagnostic accuracy of OCTA and OCT for myopic choroidal neovascularisation: a systematic review and meta-analysis. Eye(Lond) 2023;37(1):21–29. doi: 10.1038/s41433-022-02227-8. [DOI] [PMC free article] [PubMed] [Google Scholar]
- 14.Mao JB, Cheng D, Lin JJ, et al. Evaluating retinal angiomatous proliferation with optical coherence tomography angiography. Ophthalmic Surg Lasers Imaging Retina. 2020;51(3):136–144. doi: 10.3928/23258160-20200228-02. [DOI] [PubMed] [Google Scholar]
- 15.Wijesingha N, Tsai WS, Keskin AM, et al. Optical coherence tomography angiography as a diagnostic tool for diabetic retinopathy. Diagnostics. 2024;14(3):326. doi: 10.3390/diagnostics14030326. [DOI] [PMC free article] [PubMed] [Google Scholar]
- 16.Yang QC, Yao F, Li QY, et al. Ocular microvascular alteration in Sjögren syndrome. Quant Imaging Med Surg. 2022;12(2):1324–1335. doi: 10.21037/qims-21-234. [DOI] [PMC free article] [PubMed] [Google Scholar]
- 17.Lee HY, Chen J, Ying P, et al. Investigation of altered retinal microvasculature in female patients with rheumatoid arthritis: optical coherence tomography angiography detection. Biosci Rep. 2023;43(10):BSR20230045. doi: 10.1042/BSR20230045. [DOI] [PMC free article] [PubMed] [Google Scholar]
- 18.Shi WQ, Han T, Liu R, et al. Retinal microvasculature and conjunctival vessel alterations in patients with systemic lupus erythematosus-an optical coherence tomography angiography study. Front Med. 2021;8:724283. doi: 10.3389/fmed.2021.724283. [DOI] [PMC free article] [PubMed] [Google Scholar]
- 19.Cioana M, Deng JW, Nadarajah A, et al. Global prevalence of diabetic retinopathy in pediatric type 2 diabetes: a systematic review and meta-analysis. JAMA Netw Open. 2023;6(3):e231887. doi: 10.1001/jamanetworkopen.2023.1887. [DOI] [PMC free article] [PubMed] [Google Scholar]
- 20.Liu GD, Wang F. Macular vascular changes in pregnant women with gestational diabetes mellitus by optical coherence tomography angiography. BMC Ophthalmol. 2021;21(1):170. doi: 10.1186/s12886-021-01927-1. [DOI] [PMC free article] [PubMed] [Google Scholar]
- 21.Waheed NK, Rosen RB, Jia YL, et al. Optical coherence tomography angiography in diabetic retinopathy. Prog Retin Eye Res. 2023;97:101206. doi: 10.1016/j.preteyeres.2023.101206. [DOI] [PMC free article] [PubMed] [Google Scholar]
- 22.Lee KM, Lee GH, Lee SE, et al. Glycemic control and retinal microvascular changes in type 2 diabetes mellitus patients without clinical retinopathy. Diabetes Metab J. 2024;48(5):983–992. doi: 10.4093/dmj.2023.0149. [DOI] [PMC free article] [PubMed] [Google Scholar]
- 23.Pota ÇE, Doğan ME, Bülbül GA, et al. Optical coherence tomography angiography evaluation of retinochoroidal microvascular circulation differences in pregnant women with pregestational and gestational diabetes mellitus. Exp Clin Endocrinol Diabetes. 2024;132(9):522–530. doi: 10.1055/a-2316-3903. [DOI] [PubMed] [Google Scholar]
- 24.Wu JY, Hu JY, Ge QM, et al. Ocular microvascular alteration in patients with myocardial infarction—a new OCTA study. Sci Rep. 2024;14:4552. doi: 10.1038/s41598-023-50283-1. [DOI] [PMC free article] [PubMed] [Google Scholar]
- 25.Cunha-Vaz J. A central role for ischemia and OCTA metrics to follow DR progression. J Clin Med. 2021;10(9):1821. doi: 10.3390/jcm10091821. [DOI] [PMC free article] [PubMed] [Google Scholar]
- 26.Han YQ, Wang XG, Sun G, et al. Quantitative evaluation of retinal microvascular abnormalities in patients with type 2 diabetes mellitus without clinical sign of diabetic retinopathy. Transl Vis Sci Technol. 2022;11(4):20. doi: 10.1167/tvst.11.4.20. [DOI] [PMC free article] [PubMed] [Google Scholar]
- 27.Cui Y, Zhu Y, Wang JC, et al. Comparison of widefield swept-source optical coherence tomography angiography with ultra-widefield colour fundus photography and fluorescein angiography for detection of lesions in diabetic retinopathy. Br J Ophthalmol. 2021;105(4):577–581. doi: 10.1136/bjophthalmol-2020-316245. [DOI] [PMC free article] [PubMed] [Google Scholar]
- 28.Cerdas Pérez S. Menopause and diabetes. Climacteric. 2023;26(3):216–221. doi: 10.1080/13697137.2023.2184252. [DOI] [PubMed] [Google Scholar]
- 29.Strati M, Moustaki M, Psaltopoulou T, et al. Early onset type 2 diabetes mellitus: an update. Endocrine. 2024;85(3):965–978. doi: 10.1007/s12020-024-03772-w. [DOI] [PMC free article] [PubMed] [Google Scholar]
- 30.Moon JH, Jang HC. Gestational diabetes mellitus: diagnostic approaches and maternal-offspring complications. Diabetes Metab J. 2022;46(1):3–14. doi: 10.4093/dmj.2021.0335. [DOI] [PMC free article] [PubMed] [Google Scholar]
- 31.Basiri R, Seidu B, Rudich M. Exploring the interrelationships between diabetes, nutrition, anxiety, and depression: implications for treatment and prevention strategies. Nutrients. 2023;15(19):4226. doi: 10.3390/nu15194226. [DOI] [PMC free article] [PubMed] [Google Scholar]
- 32.Maguire PA, Cummings JA, Reay RE, et al. There's no sugar-coating psychological distress and illness perceptions in gestational diabetes mellitus: depression and anxiety are associated with negative illness perceptions. Australas Psychiatry. 2022;30(1):64–69. doi: 10.1177/10398562211038910. [DOI] [PubMed] [Google Scholar]
- 33.Franquez RT, de Souza IM, Bergamaschi CC. Interventions for depression and anxiety among people with diabetes mellitus: Review of systematic reviews. PLoS One. 2023;18(2):e0281376. doi: 10.1371/journal.pone.0281376. [DOI] [PMC free article] [PubMed] [Google Scholar]
- 34.Song JJ, Ma Z, Wang J, et al. Gender differences in hypertension. J Cardiovasc Transl Res. 2020;13(1):47–54. doi: 10.1007/s12265-019-09888-z. [DOI] [PubMed] [Google Scholar]
- 35.Wang L, Wu YQ, Jia ZJ, et al. Roles of EP receptors in the regulation of fluid balance and blood pressure. Front Endocrinol. 2022;13:875425. doi: 10.3389/fendo.2022.875425. [DOI] [PMC free article] [PubMed] [Google Scholar]
- 36.Lin KY, Hsih WH, Lin YB, et al. Update in the epidemiology, risk factors, screening, and treatment of diabetic retinopathy. J Diabetes Investig. 2021;12(8):1322–1325. doi: 10.1111/jdi.13480. [DOI] [PMC free article] [PubMed] [Google Scholar]
- 37.Tang YZ, Shi Y, Fan ZG. The mechanism and therapeutic strategies for neovascular glaucoma secondary to diabetic retinopathy. Front Endocrinol. 2023;14:1102361. doi: 10.3389/fendo.2023.1102361. [DOI] [PMC free article] [PubMed] [Google Scholar]
- 38.Qin Q, Chen CL, Cugati S. Ophthalmic associations in pregnancy. Aust J Gen Pract. 2020;49(10):673–680. doi: 10.31128/AJGP-10-19-5113. [DOI] [PubMed] [Google Scholar]
- 39.Bu YS, Shih KC, Tong L. The ocular surface and diabetes, the other 21st Century epidemic. Exp Eye Res. 2022;220:109099. doi: 10.1016/j.exer.2022.109099. [DOI] [PubMed] [Google Scholar]
- 40.Zhang S, Wang Q, Qu ML, et al. Hyperglycemia induces tear reduction and dry eye in diabetic mice through the norepinephrine-α1 adrenergic receptor-mitochondrial impairment axis of lacrimal gland. Am J Pathol. 2023;193(7):913–926. doi: 10.1016/j.ajpath.2023.03.015. [DOI] [PubMed] [Google Scholar]
- 41.Zhou QJ, Yang LL, Wang Q, et al. Mechanistic investigations of diabetic ocular surface diseases. Front Endocrinol. 2022;13:1079541. doi: 10.3389/fendo.2022.1079541. [DOI] [PMC free article] [PubMed] [Google Scholar]
- 42.Yuan M, Wang W, Kang SM, et al. Peripapillary microvasculature predicts the incidence and development of diabetic retinopathy: an SS-OCTA study. Am J Ophthalmol. 2022;243:19–27. doi: 10.1016/j.ajo.2022.07.001. [DOI] [PubMed] [Google Scholar]
- 43.Lee MW, Lee JW, Lee KH, et al. Peripapillary RNFL/vessel density ratio in patients with type2 diabetes without clinical diabetic retinopathy. Sci Rep. 2022;12(1):9463. doi: 10.1038/s41598-022-13567-6. [DOI] [PMC free article] [PubMed] [Google Scholar]
- 44.Kızıltunç PB, Varlı B, Büyüktepe TÇ, et al. Ocular vascular changes during pregnancy: an optical coherence tomography angiography study. Graefes Arch Clin Exp Ophthalmol. 2020;258(2):395–401. doi: 10.1007/s00417-019-04541-6. [DOI] [PubMed] [Google Scholar]
- 45.Çetinkaya Yaprak A, Erkan Pota Ç. Comparison of retinochoroidal microvascular circulation in menstrual and postmenopausal periods using swept-source optical coherence tomography angiography. Graefes Arch Clin Exp Ophthalmol. 2023;261(2):367–373. doi: 10.1007/s00417-022-05807-2. [DOI] [PubMed] [Google Scholar]
- 46.Jaacks LM, Barr DB, Sundaram R, et al. Pre-pregnancy maternal exposure to polybrominated and polychlorinated biphenyls and gestational diabetes: a prospective cohort study. Environ Health. 2016;15:11. doi: 10.1186/s12940-016-0092-5. [DOI] [PMC free article] [PubMed] [Google Scholar]
- 47.Inouye K, Petrosyan A, Moskalensky L, et al. Artificial intelligence in therapeutic management of hyperlipidemic ocular pathology. Exp Eye Res. 2024;245:109954. doi: 10.1016/j.exer.2024.109954. [DOI] [PubMed] [Google Scholar]