

Summary
Pancreatic ductal adenocarcinoma (PDAC) has a minimal (<15%) 5-year existence, in part due to resistance to chemoradiotherapy. Previous research reveals the impact of paricalcitol (P) and hydroxychloroquine (H) on altering the lysosomal fusion, decreasing stromal burden, and triggering PDAC to chemotherapies. This investigation aims to elucidate the molecular properties of the H and P combination and their potential in sensitizing PDAC to gemcitabine (G). PH potentiates the effects of G in in vitro, orthotopic mouse models, and a patient-derived xenograft model of PDAC. Proteomic and single-cell RNA sequencing (RNA-seq) analyses reveal that GPH treatment upregulates autophagy and endoplasmic reticulum (ER) stress-related transcripts. GPH treatment decreases the number of Ki67, fibroblast-associated protein (FAP), and alpha-smooth muscle actin (SMA)-expressing fibroblasts with a decrease in autophagy-related transcripts. The GPH treatment increases M1 polarization and CD4+ and CD8+ T cells and reduces CD4+ and CD8+ regulatory T cells (Tregs). These effects of GPH were confirmed in paired biopsies obtained from patients treated in a clinical trial (NCT04524702).
Keywords: chemotherapy, paricalcitol, hydroxychloroquine, vitamin D receptor, proteomics, single-cell RNA-seq analyses, cancer associated fibroblasts, immune cells, autophagy, pancreatic ductal adenocarcinoma
Graphical abstract
Highlights
-
•
Paricalcitol (P) and hydroxychloroquine (H) enhance the efficacy of chemotherapy in PDAC
-
•
Adding PH to gemcitabine (G) induces autophagy and its markers in PDAC
-
•
scRNA-seq analysis reveals that GPH treatment reduces cancer-associated fibroblasts
-
•
GPH treatment increases M1 polarization and CD4+ and CD8+ T cell activation
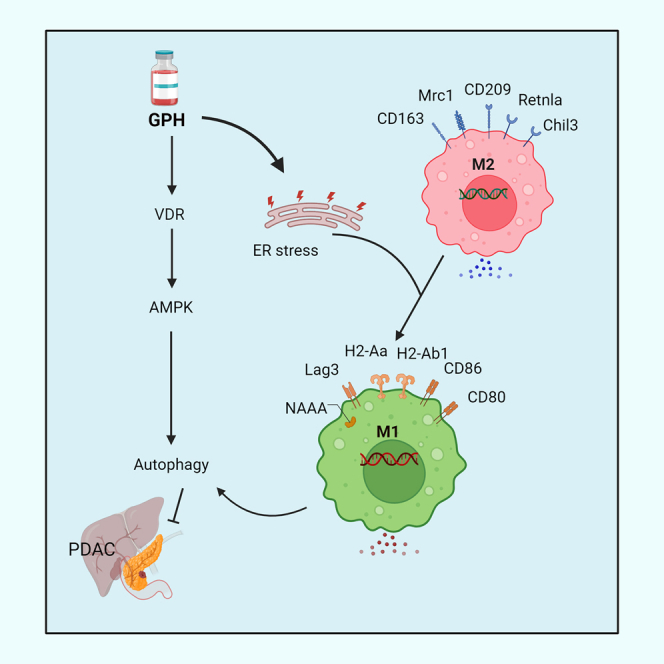
Nagaraju et al. have identified that paricalcitol (P) plus hydroxychloroquine (H) potentiates the efficacy of gemcitabine (G) in PDAC. GPH treatment induces ER stress and autophagy with M1 polarization and T cell activation. These findings in PDAC patient-derived data highlight the potential translational impact of GPH therapy in improving clinical outcomes.
Introduction
Pancreatic ductal adenocarcinoma (PDAC) is expected to be the second leading cause of cancer mortality in the United States before 2040.1 A significant clinical challenge in PDAC is the early occurrence of metastasis, and thus, effective systemic therapy is critical for improving survival.2,3 Unfortunately, the standard cytotoxic chemotherapy treatment regimens have only demonstrated a modest impact on survival.4 Mechanisms contributing to drug resistance include dense inflammatory stroma in the tumor microenvironment (TME) and activation of autophagy.5 The TME is characterized by low vasculature, absent or poorly activated immune cells, and dense extracellular matrix (ECM).5 Cancer-associated fibroblasts (CAFs) are central to supporting PDAC and its microenvironment (ME) through the production of ECM proteins and the secretion of cytokines and growth factors.6 The ECM, in turn, prevents tumor blood vessel formation and impairs chemotherapy transport. Thus, identifying more effective ways to target the TME in PDAC could complement existing chemotherapy or immune-based therapies and benefit patients.
Autophagy has gained attention as a biologically relevant process that can be targeted in tumors. This mechanism maintains tumor cell homeostasis by degrading cargo (pathogens, organelles, proteins, etc.).7 Although autophagy primarily promotes cell survival under stress, it can induce apoptosis through autophagic cell death.7 Autophagy is regulated by 18 known autophagy-related (ATG) genes.7 Various environmental factors, such as stress, can trigger this cellular process by activating AMP-activated protein kinase (AMPK) and inhibiting the mTOR pathway.8 Autophagy initiation is controlled by Beclin-1 and the ULK kinase complex, which then translocate to ATG9, an initiation site.9 PDAC cell lines and patient tumors show elevated autophagy under baseline conditions. Importantly, autophagy also plays a central role in the immune system. It indirectly impacts T cell activation and maturation by being involved in light chain 3 (LC3)-mediated phagocytosis10 and contributes to CD4+ T cell stimulation by promoting antigen presentation via major histocompatibility complex (MHC) class I and II molecules.11 These results suggest that autophagy-mediated proteins could be involved in the communication between cancer and immune cells.
Several efforts are ongoing to identify distinctive vulnerabilities in these cells that can enable more precise targeting. Aligned with this, previous reports demonstrate that CAFs have highly expressed vitamin D receptors (VDRs) compared to other cells within the TME.12,13 Vitamin D analogs can reduce activated CAF proportions in PDAC-ME.14,15 Activating VDR reprograms CAF phenotypes, improving antitumor immune response when combined with anti-PD-1 antibodies and with chemotherapy in PDAC.16 Recent studies also revealed that VDR agonists induced autophagy in various cancers by binding to the VDR-RXR complex and regulating genes essential for cancer growth and metastasis.17,18 Paricalcitol (P), a vitamin D analog administered with G, reduced stromal activation and tumor size and increased overall survival in orthotopic mouse models of PDAC.19,20 Previous studies have also shown that higher vitamin D levels correlate with a decreased risk of metastasis and death in patients with PDAC.21 Chloroquine (CQ) and its derivative hydroxychloroquine (H) are quinolone-based drugs that inhibit autophagy indirectly by blocking the fusion of autophagosomes with lysosomes.22 CQ can also have immune modulatory effects as it promotes M1 macrophages,23 while H has been shown to affect CAF activation and decrease transforming growth factor β secretion, which delays tumor development.24 As a monotherapy, H effectively impacted tumor progression; however, when combined with gemcitabine (G) in patients with PDAC, decreased CA19.9, increased LC3-II in PDAC tumor biopsy tissues, and improved progression-free survival (PFS) were noted.25,26 Finally, the combination of H G/nab-paclitaxel (GnP, neoadjuvant chemotherapy) enhanced complete response rates in 41% of patients and increased biochemical and histopathologic response in patients with PDAC.27
Independently, H and P have overlapping mechanisms of action in PDAC. Both agents can impact key resistance mechanisms, including CAFs, autophagy (H inhibiting and P inducing), and immune-suppressive TME. Preliminary preclinical and clinical data support that both P and H independently can potentiate the effects of systemic chemotherapy. Given the limited and nonoverlapping toxicities of P and H, we hypothesized that the combination of P and H would dramatically impact the biology of PDAC, CAFs, and immune activation and enhance the activity of standard cytotoxic chemotherapy.
Results
The combination of P and H potentiates G’s growth inhibition effects in mouse PDAC models
The effect of PH, G, and GPH on the short-term viability of PDAC cells was evaluated using an XTT cell proliferation assay. Human (Mia PaCa-2 and PANC-1; Figures S1A and S1B) and mouse PDAC lines (KPC-Luc and 5363, Figures S1C and S1D) were treated with PH, with or without G, for 36 h, and the cell viability was assessed. The combination GPH treatment significantly (∗∗p < 0.001 and ∗∗∗∗p < 0.00001) inhibits the growth of PDAC cell lines compared to sham or G or PH (Figures S1A–S1D) in all cell lines examined. The combination of GPH inhibited the colony formation of all PDAC cell lines compared to sham or G or PH-treated PDAC cell lines (PANC-1, Mia PaCa-2, and KPC-Luc and 5363; Figures S1E–S1H).
Next, we evaluated the impact of this combination on tumor growth in vivo. GPH-treated mice had a significantly lower change rate in bioluminescent signal over time than G, PH, or sham (Figures 1A and 1B). The body weight of all mouse groups was stable, suggesting that all treatment regimens were well tolerated (Figure S2A). End-of-study KPC-Luc tumor weight also confirmed the potentiation of G by PH (Figure S2B). Similar findings were reported in another KPC-Luc cell line, 5363, where GPH-treated mice showed significantly (p < 0.001) lower tumor weights and size than other treatment groups (Figure S2C). We also tested the clinically relevant regimens of G and nab-paclitaxel (GnP) combined with P, H, or both on KPC-Luc subcutaneous xenografts. GnP-PH treatment significantly reduced the tumor volume and weight compared to GnP-H, GnP-P, or sham (Figures 1C, 1D, and S2D). The body weight of all mouse groups was stable, suggesting that all treatment regimens were well tolerated (Figure S2E).
Figure 1.

Gemcitabine with paricalcitol and hydroxychloroquine increases growth inhibition of mouse and human PDAC cell lines in vivo
(A and B) KPC-Luc cells (1 × 10⁵) were injected into the central section of the pancreas of C57BL/6J male mice. Group 1 received PBS and served as a sham; the second group received gemcitabine (G) (60 mg/kg; weekly twice); the third group received paricalcitol (P) (0.3 μg/kg; weekly twice) plus hydroxychloroquine (H) (60 mg/kg; oral daily for 14 days), and the fourth group received GPH. The development of tumors (KPC-Luc cells) was evaluated by the IVIS system (bioluminescent imaging).
(C and D) KPC-Luc cells (1 × 10⁵) were administered subcutaneously into male mice (C57BL/6J strain). Group 1 received PBS and served as a sham, the second group received GnPH (G, 60 mg/kg [i.p.]; nP, 10 mg/kg [i.v.] weekly once; H [60 mg/kg; oral daily for 14 days]), the third group received GnPP (P, 0.3 μg/kg; weekly twice), and the fourth group received GnPPH for 4 weeks. Tumor sizes were measured once weekly with digital calipers. Terminal tumor weight of treated and untreated mice was noted.
(E and F) PDX mouse model. KRASG12V-mutated pancreaticobiliary-PDX cell suspension was injected into the pancreas of NSG mice. Mice were randomized into four groups and treated as indicated in (A) and (B). Terminal tumor weight and pictures of treated and untreated mice were noted.
(G and H) PDX mouse model. KRASG12D-mutated pancreatic cancer-PDX (∼10 mg) was implanted into the subcutaneous NSG mice. Mice were randomized into four groups and treated as indicated in (A) and (B). Terminal tumor volume and weight of treated and untreated mice were noted.
(I) Kaplan-Meier survival curves for KPC-Luc cells (1 × 10⁵) were injected into the central section of the pancreas (orthotropic) of C57BL/6J male mice. GPH treatment significantly (p < 0.001) increased the survival of mice as compared to mice receiving the other individual (G) and combination (PH) treatments. One-way ANOVA, followed by Tukey’s multiple comparisons test, considered p values. Asterisks (∗∗p < 0.001, ∗∗∗p < 0.0001, and ∗∗∗∗p < 0.00001) denote the level of significance (between the sham and treatment groups), Error bars designate SD. See also Figures S2 and S3.
The efficacy of GPH treatment was assessed in a pancreaticobiliary patient-derived xenograft (PDX).28 GPH treatment significantly reduced the PDX tumor size and weight (Figures 1E, 1F, and S2F) to a greater extent than G or the combination of P and H. Similar results were also observed in other KRAS mutant G12D PDX29 subcutaneous models (Figures 1G, 1H, and S2G). No significant difference was observed in the body weight of each group of animals, again indicating that this combination was well tolerated (Figure S2H). Finally, we evaluate the effects of GPH on the survival of mice implanted orthotopically with the KPC-Luc cell line. A significant improvement in survival was observed in favor of GPH compared to sham, G, GH, or GP-treated animals (Figures 1I and S3A–S3F). No significant difference was observed in the body weight of each group of animals, again indicating that this combination was well tolerated (Figure S3G).
Combination therapy with GPH increases autophagy in mouse and human PDAC cell lines
Next, we evaluated the effect of the combination (GPH) compared to PH vs. single-agent G treatment on autophagy in human and mouse PDAC cell lines. GPH treatment induced the upregulation of the autophagy-related proteins Beclin-1, Atg 7, LC3A/B, and VDR in mouse PDAC cell lines (KPC-Luc) and human PDAC cell lines (Mia PaCa-2 and PANC-1) (Figures 2A and S4). Similar results were observed in the in vivo evaluation of autophagy in the KPC-Luc PDAC model by western blotting for autophagy-related proteins LC3A/B, ATG5, VDR, and Beclin-1 (Figures 2B and S5). Furthermore, autophagosomes identified by the expression of the autophagy marker LC3A/B were noted using confocal microscopy in mouse and human PDAC cell lines (Figures S6A and S6B) and by transmission electron microscopy where autophagosomes exhibited a double-layered organelle containing cargo (Figures 2C–2H). Protein expression and imaging revealed that PH treatment also induced autophagosomes compared to sham and G, but this process was considerably enhanced with the combination of all three treatments (Figure 2). Overall, GPH treatment acted synergistically compared to G or PH in promoting the formation of autophagosomes.
Figure 2.

The combination of G with P and H enhances autophagy in human and mouse PDAC models
(A) Autophagy marker expression in KPC-Luc, PANC-1, and MIA PaCa-2 cells was evaluated using Immunoblot. The expression of autophagy markers LC3A/B, Atg7, Beclin-1, and VDR was examined by western blotting. Results are repeated in three independent experiments.
(B) Immunoblot to evaluate the expression of autophagy markers in tumor tissues. β-Actin was used as a loading control. Atg5 indicates autophagy-related 5; Beclin-1 indicates autophagy-related 7; LC3, light chain 3; and VDR, vitamin D receptor.
(C–H) The three PDAC (MIA PaCa-2, PANC-1, and KPC-Luc) cell line specimens were examined using a Hitachi H-7500 electron microscope operated at 75 kV. Autophagosomes (indicated “arrow”) are indicated in PH, G, and GPH-treated PDAC cells. Bars, 50 nm (PANC-1 cells) and 1.0 μm (MIA PaCa-2 and KPC-Luc), respectively. (D, F, and H) Quantification of autophagosome puncta. One-way ANOVA, followed by Tukey’s multiple comparisons test, considered p values. Asterisks (∗∗p < 0.001, ∗∗∗p < 0.0001, and ∗∗∗∗p < 0.00001) denote the level of significance (between the sham and treatment groups), ns denote non-significant. Error bars designate SD. See also Figures S4–S6.
The combination of GPH induces the upregulation of autophagy and ER stress-related pathways in tumor cells through VDR-dependent pathways
The aforementioned findings indicate that the combination of GPH significantly delays tumor growth through the induction of autophagy. To better understand this process, KPC-Luc orthotopic tumors were enzymatically disassociated into single cells, using a 10× Genomics platform for single-cell RNA sequencing (scRNA-seq). After quality control, cell types were identified using known cell type markers from the literature (Figures 3A and 3B). Using the t-distributed stochastic neighbor embedding (t-SNE plot), we identified 0–26 clusters and annotated cell types. The seven most notable cell types were PDAC, B, endothelial, T, fibroblast, natural killer (NK), and macrophages (Figures 3A and 3B). t-SNE plot analysis revealed that the proportions and numbers (Figure 3C) of PDAC and other immune cells decreased significantly in GPH-treated tumors compared to other treatments (Figure 3D). These results were consistent with H&E studies (Figure 3E). H&E analysis revealed that GPH treatment significantly (p < 0.00001) reduced mitotic bodies and Ki67 (Figure 5F)-expressing cells indicated arrested proliferation. Furthermore, H&E-stained specimens show mesenchymal features in sham and PH. G and GPH increase epithelial-type cells in KPC-Luc tumors.
Figure 3.

Single-cell RNA sequencing analysis reveals a marked reduction in orthotopic KPC-Luc intratumoral cell populations in mice treated with G, P, and H
(A) The t-distributed stochastic neighbor embedding (t-SNE) plot showed 0 to 26 clusters (7 identified main cell types in orthotopic KPC-Luc tumors).
(B) Violin plots display the well-established 21 gene markers representing seven main cell types.
(C) Number and percentage of orthotopic KPC-Luc intratumoral cell populations in sham and GPH or PH or G treatments.
(D) The t-SNE plot analysis showed that GPH treatment in orthotopic KPC-Luc tumors decreased all clusters and increased 8, 9, 19, and 26 PDAC clusters.
(E) H&E analysis revealed that GPH and other treatments like PH and G decrease the mitotic bodies in KPC-Luc tumors. Bar 50 μm; One-way ANOVA, followed by Tukey’s multiple comparisons test, considered p values. ∗∗∗∗p < 0.00001.
Figure 5.

G with P and H modulates the cancer-associated fibroblast phenotype and abundance in the orthotopic KPC-Luc-tumors
(A) t-SNE plot analysis showed five subsets of cancer-associated fibroblasts (CAFs): quiescent (qCAF), myofibroblastic (myCAF), inflammatory (iCAF), proliferative (pCAF), and antigen-present (apCAF).
(B) Dot plot represents established gene markers for identifying qCAFs, myCAFs, iCAFs, pCAFs, and apCAFs.
(C and D) t-SNE plot showed that GPH treatment decreases the percentage of active CAF (iCAF, myCAF, pCAF, and apCAF) population and increases the percentage of qCAF population.
(E) Dot plot showed that GPH treatment decreases the active CAF (iCAF, myCAF, pCAF, and apCAF)-associated gene markers and α-smooth muscle actin expression.
(F) Immunohistology quantification results showed that GPH treatment decreases the Ki67, fibroblast associated protein (FAP), and α-smooth muscle actin (α-SMA) expression and increases decorin expression in orthotopic KPC-Luc tumors. Bar, 50 μm. One-way ANOVA, followed by Tukey’s multiple comparisons test, considered p values. (∗p < 0.05, ∗∗∗p < 0.0001, ∗∗∗∗p < 0.00001; error bars indicate SD).
(G) Dot plot showed that GPH treatment decreases the autophagy gene markers.
(H) Dot plot showed ER stress molecules in various types of CAFs. GPH treatment decreases ER stress-associated markers. See also Figure S8.
Interestingly, gene expression analysis demonstrated that PDAC clusters (all PDAC, the eighth and ninth clusters individually) also showed higher expression of autophagy gene markers (Ambra1, Ulk1, Rb1cc1, Atgs, Pik3C3, Pik3r4, Becn1, Uvrag, Nrbf2, Nbr1, Sqstm1, Ins1 and 2, Casp8, Prkaa1, Fadd, Senp3, Ulk3, Clip1, and Cd74) and reduced expression of Gabarapl1, Gabarapl2, and Pik3cg in GPH-treated KPC-Luc tumor-bearing mice compared to PH, G, and sham (Figures 4A–4C). Quantitative proteomics and heatmap analysis data reveal that most of the autophagy markers (Atg 3, 4, 5, and 7, Becn1, Ins1 and 2, Gabarapl1, Fadd, Senp3, and Mhc class2) upregulated GPH-treated compared to sham or G or PH groups (Figure 4D). In vitro experiments (western blot, electron microscopy, and immunofluorescence data) also confirmed these results. As indicated in Figure 2, treating KPC-Luc and MIA PaCa-2 with G alone did not enhance autophagy; these observations are consistent with proteomics and in vitro studies (Figures 3D, 3G, 3H, and 3I).
Figure 4.

The combination of G with P and H on autophagy and endoplasmic reticulum stress pathways in orthotopic KPC-Luc tumors
(A–C) Single-cell RNA sequencing analysis reveals an increase in autophagy markers in GPH-treated orthotopic KPC-Luc tumors compared to PH and sham. Cluster 8 or 9 or all other PDAC subclusters also showed higher expression of autophagy markers in GPH treatment.
(D) Proteomics data support a single-cell RNA sequence. GPH treatment enhances the autophagy-associated markers in orthotopic KPC-Luc tumors.
(E) Single-cell RNA sequencing analysis reveals an increase in endoplasmic reticulum (ER) stress pathway markers in GPH-treated orthotopic KPC-Luc tumors compared to PH and sham.
(F) Gene-gene interaction analysis revealed that VDR is the master regulator for all autophagy-associated markers. VDR is connected to autophagy markers through Ins2, Caspase 3, Pdia3, and Sqstm1.
(G–I) VDR knockdown in 3 PDAC cell lines and treated with sham, PH, G, and GPH as indicated in Figure 2A. Knockdown of PDAC cells did not show significant response on LC3A/B and VDR expression when treated with PH, G, and GPH. Results are repeated in three independent experiments. See also Figure S7.
Insulin receptor expression on pancreatic tumors modulates cellular growth30 through MAPK, PI3K, and mTOR signaling pathways. In our study, GPH treatment caused an increased abundance of endoplasmic reticulum (ER) stress-related mRNAs (Figure 4E), in addition to Ins1, Ins2, and AMPK (Prkaa1) mRNA and protein (Figures 4C and 4D) when compared to sham, G, and the combination of PH. We discovered that a group of 32 genes within the network interact with each other (nodes) with significant confidence and are directly associated with autophagy (Figure 4F). Nodes are connected via edges, indicating functional association with this autophagy and its associated genes. The VDR-RXR complex regulates autophagy markers at the transcripts level and mediates autophagy through insulin signaling. Furthermore, VDR is connected to AMPK (Prkaa1) through insulin genes. Insulin genes are the connecting rod between VDR and autophagy genes. Yellow node borders indicate the gene differentially expressed in KPC-Luc tumors.
Next, we performed a genetic knockdown of VDR in PDAC cells. We assessed the effects of GPH in PANC-1, Mia PaCa-2, and murine KPC-Luc cell lines. Small interfering RNA knockdown of VDR expression revealed that downregulating VDR abrogated the autophagic impact of the combination of GPH on PDAC cell lines (Figures 4G–4I and S7). These observations suggest that autophagy is mediated through VDR signaling.
The combination of GPH modulates the abundance and phenotypes of CAFs
CAFs play an essential role in tumor progression and chemoresistance. scRNA-seq data analysis revealed five distinct subclusters of CAFs31,32 (Figures 5A and 5B), including quiescent (qCAF), myofibroblastic (myCAF), inflammatory (iCAF), proliferative (pCAF), and antigen-presenting (apCAF) CAFs (Figure 5B). GPH treatment decreased the percentage of iCAF, myCAF, apCAF, and pCAF and increased the percentage of qCAF (an inactive form of CAF) (Figures 5C and 5D). GPH treatment decreased more than 90% of the canonical mRNA markers used to CAF-associated markers compared to G, PH, or sham (Figures 5E and S8A). Immunohistochemistry analysis suggested that GPH treatment significantly (p < 0.00001) reduced α-smooth muscle actin (α-SMA), Ki67, and fibroblast-associated protein (FAP) and significantly (p < 0.05) increased decorin (DCN) in KPC-Luc tumor tissue compared to sham, G, and PH-treated animals (Figures 5F and S8B). These results well correlated with the increased percentage of qCAFs.
We also found the expression of autophagy and ER stress markers in various CAFs. Low expression of autophagy and ER stress markers was found in qCAFs (inactive form; Figure 5H). Furthermore, GPH treatment also inhibited autophagy and ER stress-associated markers’ expression compared to G, PH, or sham (Figures 5G, 5H, and S8C–S8H).
The combination of GPH modulates the proportion of innate immune cells and their activation status in the KPC-Luc-TME
scRNA-seq analysis of the myeloid section showed the presence of subsets such as monocytes, granulocytes, macrophages, and dendritic cells (Figures 6A and 6B). GPH treatment increased granulocytes, monocytes, and M1 polarization (Figures 6C and 6D). Multiparameter flow cytometry studies revealed that G or GPH increased the number of macrophages (gated on Live/Dead Aqualo CD45+ CD11b+ F4/80+) and decreased the abundance of granulocytes (gated on Live/Dead Aqualo CD45+ CD11b+ Ly6C+ Ly6G+) and cDC1 (gated on Live/Dead Aqualo CD45+ CD11b− MHCII+ XCR1+) subsets in the KPC-Luc-TME using an established gating methodology (Figures 6E and S9A–S9D). Furthermore, each treatment had a different impact on myeloid cell phenotypes with G or PH or GPH inducing upregulation of mRNA for M1 phenotypic markers (MHCII, Cd80, and Cd86) and downregulation of mRNA for M2 phenotypic markers (Arg1, C1q, and Mrc1) suggestive of M1 polarization (Figure 6F). Conversely, in sham and PH treatments, there was a predominant expression of mRNAs (Arg1, C1q, and Mrc1) associated with an M2 phenotype (Figure 6F) and comparable upregulation of MHCII and downregulation of CD206 on other myeloid subsets (Figure 6G) as assessed by proteomic and flow cytometric expression.
Figure 6.

The combination of G with P and H promotes M1 polarization and T cell activation in the KPC-Luc-TME
(A) t-SNE plot analysis showed ten subset clusters representing five major cell types (M1 and M2 macrophages, monocytes, granulocytes, and dendritic cells).
(B) Well-established gene markers recognized subclusters for macrophages.
(C and D) GPH treatment increases the percentage of M1 macrophages polarization, monocytes, and granulocytes.
(E) The percentages of CD45+ CD11b+ Ly6C− Ly6G− F4/80+ macrophage, CD11b+ Ly6G+ Ly6C+ gMDSC, CD11b+ Ly6G− Ly6Chi mMDSC, CD11b− CD11chi MHCIIhi XCR1+ cDC1, CD11b+ CD11chi MHCIIhi CD172α+ cDC2, and CD11b− CD11cint pDC subsets were evaluated in sham, PH, G, and GPH (N = 4 mice/group). Data are representative of a single experiment. One-way ANOVA run, followed by Tukey’s multiple comparisons test, determined p values. Error bars indicate SD.
(F) Dot plot showed that GPH treatment modulate the myeloid population representing gene markers. GPH treatment decreases the expression of M2 markers and increases dendritic cell (DC) markers.
(G) The percentages of macrophages CD45+ CD11b+ Ly6G− Ly6C− F4/80+ macrophage and median fluorescent intensity of MHCII and CD206 were evaluated in sham, PH, G, and GPH (N = 4 mice/group). Data are representative of a single experiment. One-way ANOVA run, followed by Tukey’s multiple comparisons test, determined p values. Error bars indicate SD.
(H and I) Well-established gene markers recognized subclusters for T cells.
(J) t-SNE plot showed that GPH treatment decreases the percentage of Cd4 and Cd8 Tregs and increases the percentage of Cd4+ and Cd8+ T cells as well as NK cells.
(K) Proportions of CD4+ Foxp3−, CD4+ Foxp3+, CD8+ T cells, γδ T cells, and NK cells in KPC-Luc-TME were evaluated in sham, PH, G, and GPH (N = 4 mice/group). Data are representative of a single experiment. One-way ANOVA run, followed by Tukey’s multiple comparisons test, determined p values.
(L–O) Dot plot showed that GPH treatment increases the expression of the Cd4, Cd3e, Nkg7, Ctla-4, and Pd-1 as well as Ifnγ, Prf1, and Tbx21 and decreases Foxp3. CD4+ FOXP3+ (M), CD4+ Foxp3− (N), and CD8+ T cell (O) subsets from KPC-Luc-TME were graphed as mean fluorescent intensity per mg tumor weight. Data are representative of a single experiment. Welch’s t test determined p values; Asterisks (∗p < 0.01, ∗∗p < 0.001, ∗∗∗p < 0.0001, and ∗∗∗∗p < 0.00001) denote the level of significance (between the sham and treatment groups), ns denote non-significant. Error bars indicate SD. See also Figures S9–S11.
The combination of GPH modulates the proportions and activation status of T cells in the KPC-Luc-TME
Next, we assessed the proportions of T and NK cell subsets by multiparameter flow cytometry (Figures S9E–S9K) using established gating schemes. T cell subclustering revealed diverse Cd4, Cd8, and NK cell populations (Figures 6H–6J). GPH treatment increased the percentage of Cd4+ and Cd8+ T cells and reduced Cd4+ and Cd8+ regulatory T cells (Tregs) (Figure 6J). Multiparameter flow cytometric analysis revealed an increase in proportions of CD4+ Foxp3+, CD4+ Foxp3−, CD3+ NK1.1+, CD3− NK1.1+ (NK), CD3+ TCRγδ+, and CD3+ CD4/CD8/NK1.1/TCR γδ− (DN T) cell subsets in G and GPH-treated KPC-Luc tumors (Figure 6K). The scRNA-seq analysis demonstrated that GPH treatment increased Cd4, Ctla4, and Cd3e and decreased FoxP3, Lag3, Granzyme B, and Tnfrsf4 (OX40) mRNA (Figures 6L and 6M). GPH treatment had no significant effect on Cd8. The proportions of Cd3+/Cd8+ T cells did not significantly change in G- and GPH-treated KPC-Luc tumors (Figure 6L). These findings are in agreement with the scRNA-seq data concerning Cd4 and innate-like NK and NKT cells, where mRNA for signature proteins that identify these subsets was increased. Furthermore, in agreement with scRNA-seq, expression of the protein Ctla-4 was increased in Cd4+ and Cd8+ T cell subsets (Figures 6N and 6O), whereas protein expression of PD-1 was upregulated in Cd4+Foxp3+, Cd4+Foxp3−, and Cd8+ T cells with the combination of G with PH (Figures 6N and 6O). Likewise, the PD-L1 expression increased in the macrophage population (Figure 6G). Evaluation of CD4+ and CD8+ T cell activation through expression of CD44, CD62L, and CD69 revealed an increase in CD44+CD62L− effector memory and a corresponding increase in CD44−CD62L− pre-effector-like T cells (Figure S10), which have been demonstrated to be an essential pool of T cells that are capable of replenishing effector memory T cells and capable of responses to immune checkpoint blockade therapy.33 Interestingly, there was a small but statistically insignificant increase in CD44hiCD62Lhi central memory T cells in CD4+ and CD8+ T cell populations in mice treated with the combination of GPH (Figure S10), suggesting that this combination may improve memory T cell responses.
To verify whether GPH increased T cell function, tumor single cells were activated in vitro with ionomycin and PMA in the presence of brefeldin A for 5 h. The intracellular IL-2, IL-17, granzyme B, IFNγ, and TNF-α expressions were evaluated in CD8+ and CD4+ T cells (Figures S13A–S13D). Cytokine production showed an increasing trend in CD4+ (Figures S11A–S11E) and CD8+ T cells (Figures S11F–S11J) taken from G or GPH-treated KPC-Luc tumors. In our study, GPH treatment caused an increased abundance of mRNAs Tbx21, Prf1, and IFNγ when compared to sham, G, and the combination of PH (Figure 6L). These scRNA and FLOW findings indicate that this combination enhances cytotoxic T cell activities.
Patients with PDAC
PDAC patient characteristics are summarized in Table S1. Of the 7 evaluable patients, 3 patients had radiographic partial response of measured target lesions, and 4 patients had stable disease. The objective response rate was 43% (90% confidence interval [CI], 0.1–0.82). Maximum percent change in target lesion size from baseline is shown in Figure 7A. The median PFS was 6 months (95% CI, 1.4 to 6.7 months). The 3- and 6-month PFS rates were 50.0% (95% CI, 18.4%–75.3%) and 80.0% (95% CI, 40.9%–94.6%). The median overall survival (OS) was 6.8 months (95% CI, 1.8 to 9.9 months) for all trial patients with PDAC (Figures 7B and C). The 3- and 6-month OS rates were 20.0% (3.1%–47.5%) and 70.0% (95% CI, 32.9%–89.2%).
Figure 7.

Human PDAC studies (scRNA and spatial studies)
(A) The waterfall plot denotes the maximum percentage change in target lesion size from the baseline; PR, partial response; and SD, stable disease (Methods S1).
(B) Kaplan-Meier survival curves for enrolled patients.
(C) Kaplan-Meier survival curves for progression-free survival.
(D) Percentage of cells observed in pre- and post-treatment samples from patient A and D.
(E) T cell exhaustion genes expression in the baseline and treated human biopsy samples.
(F) Comparison between CD8+ T cells and NK cells from TME (biopsy) and baseline level.
(G) Spatial analysis of liver metastases before and after therapy. Immunofluorescent stains of six markers covering various structural or immune characteristics. One region of each pre-treated sample is displayed. Markers displayed include DAPI (nuclear), β-actin (structural), E-cadherin (normal, PDAC tissue), collagen-IV (fibrotic), pan-cytokeratin (PCK, PDAC), and CD3e (T cell). A composite image including E-cadherin (green), collagen-IV (yellow), PCK (cyan), and CD3e (red).
(H) Cell annotations for select regions from pretreated samples A (left) and D (right). The left column shows the composite image with the same color scheme from (G). The right column displays the cell classification for each region.
(I) Adjacency analysis for the cell types annotated in (H) for pretreated samples A and D. Each square displays the log-odds ratio for finding a cell of one type adjacent to another. Red indicates a higher likelihood of being found near each other than random, and blue indicates a lower probability.
(J) Displaying individual fluorescent markers for select regions from post-treated samples A and D. The composite image uses the same color mappings as (G).
(K) A stacked barplot displays the percent area coverage of normal, fibrotic, and PCK+ malignant tissue for pre-treatment and post-treatment samples.
(L) Cell annotations for select regions from post-treated samples A and D, using the color scheme defined in (H).
(M) Adjacency analysis for the cell types annotated in (F) for the post-treated sample A (left) and D (right). See also Figure S12 and Tables S1 and S2.
Safety results
Drug-associated grade 3 serious adverse events and adverse events were stated in 6 (60%) of the 10 patients with PDAC comprised in safety assessment and are shown in Table S2. The common adverse effects were anemia, nausea, vomiting, thrombocytopenia, fatigue, hypercalcemia, constipation, neutropenia, dyspnea, diarrhea, and leukopenia.
scRNA-seq in patients with PDAC
Core biopsies of metastasized PDAC in the liver were dissociated using GentleMACs dissociation kit (Miltenyi Biotec) according to manufacturer’s instructions and viably frozen. For preliminary analysis, scRNA-seq library was prepared using Next GEM 3′ v.3.1 kit. The single-cell transcriptome profiles generated from pre-treatment (1,537 cells) and post-treatment (367 cells) human liver biopsy samples from one patient identified PDAC clusters as well as T cells and endothelial cells (Figure S12A). The top genes in PDAC clusters (P1–P4 and P5), T cells, and endothelial cells are shown in the heatmap (Figure S12B). Post-treatment sample showed more than 50% reduction in PDAC cells (Figure 7D) with most of the PDAC clusters (P1–P3 and P5) going down. Cluster P4 makes up most of the PDAC cells in the post-treatment needle biopsy sample. Of the two T cell clusters, T cell-2 is present mostly in the post-treatment sample and is a CD8+ cytotoxic T cell expressing various cytokine genes including Ifnγ and Ccl20 (Figure 7F). Further analysis of the T cell clusters showed that T cell-1 is a mix of CD4+ and CD8+ T cells with more expression of T cell activation marker genes, Cd69 and CD44 (Figure 7E). T cell-2 also showed enhanced expression of Cd69 and Cd44 as well as T cell activation maintenance marker genes, Tnfrsf4/9, in treated samples. Analysis of exhaustion marker genes showed enhanced expression of various exhaustion marker genes in T cell-2 (Lag3, Pdcd1, and Cd160) and T cell-1 (Vsir, Icos, and Lag3) in the treated samples indicative of active T cell response in the metastasized TME, post treatment. Biopsy samples exhibited greater expression of T cell activation marker genes (Cd69) and inflammatory cytokines genes (Ifng and Ccl5), especially T cell-2 cluster that is present in post-treatment biopsy sample (Figure 7F).
PDAC spatial analysis
Tissue sections from liver biopsies were taken and assessed using an Akoya Biosciences immunofluorescence assay before and after receiving GPH therapy. Paired samples were available from two patients (labeled A and D), while a third patient (labeled C) could only be assessed at baseline.
Immunofluorescence imaging confirms the fibrotic remodeling around PDAC metastases. The ductal formations strongly stain for pan-cytokeratin (PCK) and E-cadherin, consistent with PDAC (Figure 7G). Fibrotic regions lack E-cadherin expression entirely, unlike normal and metastatic tissue, but stain strongly for collagen-IV. Assessing immune markers found that these fibrotic regions contained a large number of T cells (Figure 7G), including CD4+ and CD8+ T cells. T cells show poor infiltration into the dense, PCK-high regions, primarily accumulating in this desmoplastic stroma.
Individual cells were segmented based on their nuclear stain and annotated based on marker expression into “normal,” “fibrotic,” “tumor,” “CD8+ T cell,” or “CD4+ T cell” (Figure 7H). Neighborhood spatial analysis was performed on these populations to assess the likelihood of cells of a given type being found near one another. Tumor regions show little association with all populations besides other tumor cells, indicating the tendency for the metastases to form dense tumor nests (Figure 7I). CD4 and CD8 T cells positively associate with other T cells and fibrotic regions while displaying shallow associations with normal tissue and tumor, confirming their tendency to accumulate in the desmoplastic stroma (Figure 7I).
Immunofluorescence imaging did identify some small PCK+ regions in sample A and the lower portion of sample D following therapy despite the lack of precise ductal formations (Figure 7J). These tumor regions are surrounded by fibrotic stroma with T cell infiltration as seen at baseline (Figure 7J). However, post-treated samples A and D generally have less fibrotic remodeling than their baseline (Figure 7K). Adjacency analysis of annotated cell regions post therapy confirms again the tendency for T cells to accumulate in these fibrotic regions and a generally higher likelihood that T cells will be found adjacent to PCK+ regions, possibly indicating improved tumor accessibility due to the reduced desmoplastic remodeling, and typically reduced tumor presence (Figures 7L and 7M).
Discussion
This study provides mechanistic insight into the collective effects of vitamin D analog P, H, and the chemotherapeutic agent G in accentuating VDR signaling, leading to ER stress-related autophagic tumor cell death. In this study, adding PH treatment G or GnP significantly decreased PDAC growth in multiple in vitro and in vivo PDAC models compared to chemotherapy or the doublet (HP) treatments. A recent randomized phase 2 clinical trial in patients with PDAC showed a significant improvement in overall response rate in favor of adding H to GnP but did not increase OS.27 These results suggest a limited benefit from adding H to GnP, and hence the rationale for building on this benefit by considering the addition of P.
The efficacy of this regimen in the clinical trial is hard to establish due to the early termination of the trial. The overall response rates from the small number of patients enrolled appear at least comparable to historic rates reported with chemotherapy. It is reassuring that no added toxicities were associated with adding PH to GnP. Adding PH to G resulted in several effects in the preclinical models, including increased autophagy in tumor cells, leading to a global reduction in CAF populations, with the remaining CAFs adopting a qCAF phenotype. Our data highlight a mechanism of promoting autophagy by GPH involving AMPK (Prkaa1), a key checkpoint for the cell’s energy source, which stimulates autophagy through phosphorylation of the ULK1 (ATG1; autophagy activating kinase 1).34 GPH treatment activates AMPK phosphorylation in PDAC. AMPK also inhibits cell growth and intermediary metabolism by inhibiting mTOR signaling (over TSC2 activation).35 The ULK1 complex has an autophagy-initiating role. Upon activation for autophagy initiation, ATG1 binds with the ATG17, an FAK family kinase, and Atg 101.36 This complex activates and increases the expression of class III PtdIns3K complex (AMBRA1, PIK3C3/VPS34, PIK3R4/VPS15, BECN1, ATG14 [UVRAG], and NRBF2).37 The ATG16L1-ATG12 complex accomplishes the increase of the phagophore-ATG5 complex, and ATG8-class proteins, GABARAP and LC3 subclasses, are allied to phosphatidylethanolamine (PE) employing them to the membrane of the phagophore. The coupling of LC3-I to PE affects the production of LC3-II in a manner that contributes to ATG4B and its assistance with ATG3 and ATG7. LC3-II relates to the complete autophagosome.37 NBR1 and SQSTM1/p62 are receptors for cargo, and they interact with ATG8-class proteins on the phagophore membrane.37 Our data prove that GPH elevated the Atg1, Atg17, and Atg 101 expressions and increased the Beclin-1 expression and activation of the class III PI3K complex. The ATG5-ATG12-ATG16 complex catalyzes lipidated LC3, which helps generate autophagosomes, which engulf protein aggregates and damaged organelles.36 Autophagosomes merge with the lysosomes to generate autophagolysosomes. In our study, GPH treatment showed elevated expression of LC3A/B and ATG7 and increased autophagic puncta (autophagosomes and their fusion with lysosomes). Further, our results also showed that GPH significantly enhanced the fluorescence of LC3A/B, as assessed by confocal microscopy.
Autophagy provides a complementary mechanism for cell death in PDAC with defective apoptosis.38 Autophagic pathways are critical in retaining the β cells necessary for insulin production and glucose homeostasis. Studies indicate that impairments in autophagy correlate with the reduction of β cells developing an insulin deficit, thereby causing diabetes.39 Interestingly, our findings demonstrate that GPH increased Ins1 and 2 in KPC-Luc tumors. Overall, these findings demonstrate the key role of insulin-driven energy metabolism in both β cell and PDAC cell survival, ensuring the ability to support the acquisition of glucose necessary for tumor cell survival. Autophagy behaves as a dual function (double-edged sword), and targeting it may affect the metabolic regulation of insulin-glucose levels in patients with PDAC.
Autophagy is also essential in regulating the biology of complex CAF populations in PDAC. CAFs are heterogeneous and can be classified into distinct subpopulations such as qCAFs, myCAFs, pCAFs, iCAFs, and apCAFs, among others.31,32 CAFs in the TME produce pro-inflammatory factors, growth factors, ECM components, and high-energy nutrients essential for survival, metastasis, resistance, and drug delivery interference cues to PDAC cells.6,40 Autophagy in the CAFs fuels tumor growth and metastasis.41 H or other lysosome inhibitors may restore the myCAFs by inhibiting their hyper-autophagy state.42 In PDAC preclinical models, P inhibiting VDR function by P shifts CAFs toward a quiescent phenotype with decreased tumor progression and enhanced chemotherapy delivery.43 Our gene expression data suggest that GPH treatment decreased the apCAF, pCAF, iCAF, and myCAF-associated markers (Hilpda, VEGFa, Higd1b, Cenpf, Pttg1, Stmn1, Cfd, Postn, etc.) and autophagy-associated markers (Atgs, Becn1, etc.) compared to G, PH, or sham. In support of this, immunohistochemistry studies revealed that GPH treatment decreased active CAF markers Ki67, α-SMA, and FAP and increased cell growth regulatory protein DCN. These observations suggest that the active CAFs reprogrammed into inactive healthy or quiescent CAFs.
The immune TME of PDAC is predominantly composed of myeloid cell subsets and smaller proportions of regulatory T and B cells, which exclude and suppress cytotoxic T cell responses to tumor cells.44 In particular, M2-polarized macrophage and myeloid-derived suppressor cells comprise a considerable fraction of the intratumoral leukocytes in animal models and patients with PDAC.45,46 Recent findings indicate that neo-adjuvant chemotherapies involving G with nab-paclitaxel or FOLFIRINOX partially promote anti-tumor immunity through M1 macrophage polarization and enhance T cell infiltration into the PDAC-ME.47,48 Of importance to this study is that VDR signaling also inhibits B cell activation.49 VDR signaling has positive and negative effects on innate cell activation, including inhibition of neutrophil activation but promoting NETosis.50,51 Our data indicate that the combination of GPH increased M1 macrophage polarization and T cell infiltration into the KPC-Luc-TME but did not significantly affect MHCII expression. Aligned with these macrophage changes, we also assessed integrin-associated protein (CD47), an immune checkpoint for macrophages that plays an essential function in immune avoidance in many malignancies, including PDAC.52,53 Low expression of Cd47 was observed in GPH-treated PDAC tissue compared to all other treatments. CD14/TLR4 priming possibly recalibrates and shows an anti-tumor effect in tumor-associated macrophage.54 GPH treatment increased the expression of Cd14 compared to sham and PH. Similar effects were observed in the paired biopsy samples from our patients on the trial, with an increase in M1 macrophages and a decrease in M2.
Several cellular activities are controlled by neutrophil (CD177 marker) recruitment and are involved in tumor lesions and tumorigenesis.55 CD177 is a neutrophil marker and was found to be decreased in GPH-treated tumors. CD276 (B7-H3) is an immune checkpoint that is over-expressed in malignant cells and stimulates cancer-infiltrating immune cells.56 CD276 also enhances malignant cells to avoid the NK and cytotoxic T cells.56 CD276 was reduced in GPH-treated tissues compared to PH and sham groups. It elevated IL-35-producing B regulatory cells with increased CD8+ T cell infiltration. In PDAC, B cell-mediated production of IL-35 induces tumor progression by reducing the CD8+ T cell infiltration via downregulating the chemotactic receptors (Cxcr3 and Ccr5) and reducing the secretion of the effector cytokine IFN-g.57 However, GPH treatment increases the expression of PD-1 and CTLA4 on T cells, suggesting robust activation of CD4+ and CD8+ T cells in the KPC-Luc murine model. Paired biopsies from patients with PDAC on trial and animal models receiving combination therapy increase T cells and exhaustion markers such as PD-1, LAG3, and CTLA-4. These data from preclinical and clinical samples suggest that proper sequencing of the GPH treatment with anti-PD-1, anti-CTLA-4, or both immune checkpoint blockades may enhance the therapeutic outcomes of this regimen.
Considerable evidence suggests the beneficial translational impact of either P or H with standard-of-care chemotherapy.25,58,59 This study demonstrates the benefit of combining PH with chemotherapy in PDAC. The underlying mechanisms include the upregulation of autophagy and cellular stress pathways that culminate with the death of tumor cells. The combination of GPH on the TME has a significant impact, including a favorable change in the phenotype of CAF and macrophages. Calcitriol treatment for PDAC cells caused transcript changes that improved the epithelial phenotype of PDAC cells using a baseline epithelial subtype. However, calcitriol did not visibly shift quasi-mesenchymal lines to an additional epithelial state.60 Understanding these baseline epithelial and quasi-mesenchymal states is vital for improving clinical trial strategies to target these subpopulations. In animal models and patient samples, we observed an increase in T cells and a shift in macrophage phenotypes, indicating the potential of this regimen to convert these immunologically “cold” tumors to hot. A remaining challenge is the increase in the expression of exhaustion makers, which suggests the need to combine this regimen with immune checkpoint inhibitors. Our results support exploring this combination in preclinical and clinical studies of GPH with immune therapy.
Limitations of the study
This study has some limitations. scRNA-seq analysis focused on PH, G, and combination. There is no evaluation of P and H as single agents. Also, we did not perform HP and GnP single-cell analysis. The low number of CAFs limits a more in-depth analysis. Another limitation is that we observed an increase in the expression of exhaustion markers on T cells; however, we did not evaluate the impact of immune checkpoint inhibitors to address this effect. The efficacy of adding PH to standard chemotherapy in clinical trial is not addressed due to the low enrollment of patients with PDAC.
Resource availability
Lead contact
Further information and requests for resources and reagents should be directed to and will be fulfilled by the lead contact, Dr. Bassel F. El-Rayes (belrayes@uabmc.edu).
Materials availability
This study did not generate new reagents.
Data and code availability
-
•
The data (scRNA-seq raw and proteomics) produced in this manuscript are listed in the key resources table.
-
•
The code pipeline generated in this manuscript is listed in the key resources table.
-
•
Any additional information required to reanalyze the data reported in this paper is available from the lead contact upon request.
Acknowledgments
This work was supported by the University of Alabama at Birmingham and Emory University, Atlanta, USA, the Comprehensive Cancer Center core support grant (5P30CAO13148-47), and the Morningside Foundation, Atlanta, USA. We thank all patients for participating in this study.
Author contributions
G.P.N., G.B.L., V.P.S., and B.F.E.-R. conceived and supervised the project. G.P.N., M.S.S., M.K.B., J.B.F., A.M.K., Y.G., D.S.R.B., S.S., S.P.R., J.S., C.H., and O.B.A. performed the experiments and analysis. M.K.B. provided human scRNA and spatial data, especially. G.P.N., M.S.S., J.B.F., O.B.A., M.K.B., and B.F.E.-R. wrote the manuscript with input from A.M., J.L.C., M.A., K.J.Y., U.M., G.B.L., V.P.S., and B.F.E.-R.
Declaration of interests
The authors declare no competing interests.
STAR★Methods
Key resources table
| REAGENT or RESOURCE | SOURCE | IDENTIFIER |
|---|---|---|
| Antibodies | ||
| PD-1 FITC | BioLegend | Cat#135214; RRID:AB_10680238 |
| CD206 FITC | BioLegend | Cat#141703; RRID:AB_10900988 |
| CD107α | BioLegend | Cat#121607; RRID:AB_571982 |
| TIM-3 PE | BioLegend | Cat#134003; RRID:AB_1626181 |
| F4/80 PE | BioLegend | Cat#123110; RRID:AB_893486 |
| IL-17F PE | BioLegend | Cat#517008; RRID:AB_10690818 |
| CD19 PE Cy7 | BioLegend | Cat#152417; RRID:AB_2927870 |
| Granzyme B PE Cy7 | BioLegend | Cat#372214; RRID:AB_2728381 |
| Ly6C PE Cy7 | BioLegend | Cat#128017; RRID:AB_1732093 |
| CD11 b PE Dazzle | BioLegend | Cat#101255; RRID:AB_2563647 |
| IFNγ PE Dazzle | BioLegend | Cat#505846; RRID:AB_2563980 |
| CD45 PerCP | BioLegend | Cat#103130; RRID:AB_893339 |
| CD11c APC | BioLegend | Cat#117309; RRID:AB_313778 |
| TNFα APC | BioLegend | Cat#506308; RRID:AB_315429 |
| CD172α Alexa Flour 700 | BioLegend | Cat#144022; RRID:AB_2650813 |
| CD62L APC Cy7 | BioLegend | Cat#104428; RRID:AB_830799 |
| CD86 APC Cy7 | BioLegend | Cat#105045; RRID:AB_2629769 |
| IL-2 APC 750 | BioLegend | Cat#503832; RRID:AB_2561750 |
| CD3 BV421 | BioLegend | Cat#100341; RRID:AB_2562556 |
| XCR1 BV421 | BioLegend | Cat#148216; RRID:AB_2565230 |
| Ly6G BV570 | BioLegend | Cat#127629; RRID:AB_10899738 |
| TCR γ/δ BV 605 | BioLegend | Cat#118129; RRID:AB_2563356 |
| PD-L1 BV 605 | BioLegend | Cat#153606; RRID:AB_2814056 |
| CD4 BV 650 | BioLegend | Cat#100469; RRID:AB_2783035 |
| MHCII BV 650 | BioLegend | Cat#107641;RRID:AB_2565975 |
| NK1.1 BV 711 | BioLegend | Cat#156541; RRID:AB_3097465 |
| CD103 BV 711 | BioLegend | Cat#121435; RRID:AB_2686970 |
| CD8a BV 785 | BioLegend | Cat#100750; RRID:AB_2562610 |
| CCR7 BV785 | BioLegend | Cat# 353230; RRID:AB_2563630 |
| Fc Block (CD16/CD32) | BioLegend | Cat#101320; RRID:AB_1574975 |
| Thy1.1 PE | BD Biosciences | Cat#551401;RRID:AB_394185 |
| CTLA-4 APCR700 | BD Biosciences | Cat#565778; RRID:AB_2739350 |
| CD44 BUV737 | BD Biosciences | Cat#612799; RRID:AB_2870126 |
| CD69 BUV395 | BD Biosciences | Cat#740220; RRID:AB_2739968; |
| CD45R/B220 BUV395 | BD Biosciences | Cat#563793;RRID:AB_2738427 |
| Foxp3 APC | Thermo Fisher Scientific | Cat#17-5773-82; RRID:AB_469457 |
| Live/Dead Aqua | Thermo Fisher Scientific | Cat#L34966 |
| FAP | Thermo Fisher Scientific | Cat#PA5-99313; RRID:AB_2818246 |
| Decorin (DCN) | Thermo Fisher Scientific | Cat#PA5-13538; RRID:AB_2090260 |
| Goat anti-Rabbit IgG (H + L) Cross-Adsorbed Secondary Antibody, Alexa Fluor™ 568 | Thermo Fisher Scientific | Cat# A-11011; RRID:AB_143157 |
| Beclin-1 (D40C5) | Cell signaling technology | Cat#3495; RRID:AB_1903911 |
| LC3A/B | Cell signaling technology | Cat#12741; RRID:AB_2617131 |
| Atg5 | Cell signaling technology | Cat#12994; RRID:AB_2630393 |
| Atg7 | Cell signaling technology | Cat#8558; RRID:AB_10831194 |
| Vitamin D3 Receptor | Cell signaling technology | Cat#12550; RRID:AB_2637002 |
| Ki67 | Cell signaling technology | Cat#12202; RRID:AB_2620142 |
| Anti-rabbit IgG, HRP-linked Antibody | Cell signaling technology | Cat#7074; RRID:AB_2099233 |
| Anti-mouse IgG, HRP-linked Antibody | Cell signaling technology | Cat#7076; RRID:AB_330924 |
| Actin | Santa Cruz Biotechnology | Cat#Sc-58673; RRID:AB_2223345 |
| α-SMA | Abcam | Cat#ab7817; RRID:AB_262054 |
| Bacterial and virus strains | ||
| DH5α competent cells | Thermo Scientific | Cat#EC0112 |
| Chemicals, peptides, and recombinant proteins | ||
| Matrigel Matrix | Corning | Cat#354234 |
| Pierce™ RIPA Buffer | Thermo Scientific | Cat#89901 |
| Chemiluminescent substrate | Thermo Scientific | Cat#34579 |
| RBC lysis buffer | Thermo Scientific | Cat#J62150.AK |
| iBlot 3 PVDF Regular stacks | Invitrogen | Cat#IB34001 |
| BSA | Fisher Scientific | Cat#BP1600 |
| 4-20% of precast gels | BIO-RAD | Cat#4568096 |
| Precision Plus Protein™ Kaleidoscope™ Prestained | BIO-RAD | Cat#1610375 |
| Mini Protease Inhibitor Cocktail | Roche | Cat#11836153001 |
| Liberase | Roche | Cat#05401127001 |
| Hematoxylin solution | Sigma-Aldrich | Cat#51275 |
| Eosin | Millipore Sigma | Cat#1737287-1 |
| collagenase D | Millipore Sigma | Cat#11088858001 |
| DNase I | Millipore Sigma | Cat#10104159001 |
| DMEM | ATCC | Cat#30-2002 |
| Penicillin-Streptomycin | ATCC | Cat#30-2300 |
| PBS | ATCC | Cat#30-2200 |
| Trypsin-EDTA | ATCC | Cat#30-2101 |
| FBS | Gibco | Cat#16170-078 |
| Horse Serum | Gibco | Cat#226050-088 |
| Critical commercial assays | ||
| XTT Cell Proliferation Assay Kit | ATCC | Cat#30-1011K |
| Pierce™ BCA Protein Assay Kit | Thermo Scientific | Cat#23225 |
| Vectastain Elite ABC Universal PLUS Kit | Vector | Cat#PK-8200 |
| Effectene transfection reagent | Qiagen | Cat#301425 |
| NextGem 3′V3.1 kit | 10X Genomics | Cat#CG000204 |
| Deposited data | ||
| scRNA-seq raw data deposited in GEO | This paper | Acc#GSE281518 |
| Proteomics raw data deposited in ProteomeXchange Consortium via the iProX partner repository | This paper | ID#PXD058067 |
| Code pipeline deposited in Github | This paper |
https://github.com/Pganji7353/PDAC_GPH v1.0.0 madhubioinformatics/PDAC_GPH: v1.0.0 https://doi.org/10.5281/zenodo.14061430 |
| Experimental models: Cell lines | ||
| PANC-1 | ATCC | Cat#CRL-1469; RRID:CVCL_0480 |
| MIA PaCa-2 | ATCC | Cat#CRL-1420; RRID:CVCL_0428 |
| HEK293T cells | ATCC | Cat#CRL-3216; RRID:CVCL_0063 |
| KPC_Luc cells | This paper | RRID:CVCL_UY60 |
| 5363 cells | This paper | RRID:CVCL_5363 |
| Experimental models: Organisms/strains | ||
| C57BL/6J male mouse | Jackson Labs | Strain #:000664 |
| NOD.Cg-PrkdcscidIl2rgtm1Wjl/SzJ | Jackson Labs | Strain #:005557 |
| Patient-derived tumor xenograft (PDX) mouse model | This paper | N/A |
| Recombinant DNA | ||
| pLKO.1 | Addgene | Cat#10878 |
| psPAX2 | Addgene | Cat#12260 |
| pMD2 | Addgene | Cat#12259 |
| hVDR | Sigma-Aldrich | TRC ID #N0000019504 |
| mVDR | Sigma-Aldrich | TRC ID #N0000027104 |
| Software and algorithms | ||
| FlowJo version 10.7.2 | FlowJo, LLC | RRID:SCR_008520 |
| Graphpad Prism | GraphPad software | RRID:SCR_002798 |
| ImageJ | This paper | RRID:SCR_003070 |
| BioRender | HomeStars | RRID:SCR_018361 |
| Proteome Discoverer version:2.4.1.15. | Thermo fisher scientific | RRID:SCR_014477 |
| Cell ranger 6.1 | 10X Genomics | RRID:SCR_017344 |
| Seurat R package v.4.3.0 | Paul Hoffman, Satija Lab and Collaborators |
RRID#SCR_016341 |
| Cytoscape 3.10.3 | Software (open source) | RRID#SCR_003032 |
| g:Profiler | Software (open source) | RRID:SCR_006809 |
| Other | ||
| Hydroxychloroquine | Spectrum Chemical MFG Corp | Cat#H1126 |
| Paricalcitol | Millipore | Cat#1499414 |
| Gemcitabine | AM Beed | Cat#A433642 |
| Nab-Paclitaxel | Selleckchem | Cat#E1068 |
Experimental model and study participant details
Human studies
The study was conducted by the U.S. Common Rule ethical principles and received approval and oversight from the Emory University Institutional Review Board (Phase II trial, IRB Protocol ID # Winship5079-20; Atlanta, Georgia; Methods S1). All participants provided written informed consent before any research-related procedures. Additionally, the study is registered at www.clinicaltrials.gov (NCT ID # NCT04524702).
In the current study, 10 PDAC patients were enrolled, which comprised 3 men and 7 women. Mean age (± Std Dev); 65.8(±11) and variable of age min-max; 41–78 years (as per Table S1). Patients in the trial received P at a dose of 25 μg i.v. three times weekly, H dosing started with 400 mg orally for seven days, followed by 600 mg twice daily. G was administered I.V. at 1000 mg/m2 over 30 min and nab paclitaxel at 100 mg/m2 on days 1, 8, and 15 of each 28-day cycle. Therapy continued until radiographic proof of disease progression, patient preference, withdrawal due to severe side effects, or physician recommendation.
PDAC patients who met suitability conditions but did not participate in efficacy evaluations were categorized as non-evaluable. This classification was applied when data on the primary endpoint were unavailable due to premature study departure before undergoing post-treatment radiographic evaluation and clinical response assessment. These patients' data were included in safety analyses but excluded from efficacy assessments. Blinding in this context means that the personnel handling the downstream analyses were unaware of certain key details that could influence their interpretation of the results. This minimizes bias and ensures the analysis is objective and not swayed by expectations or preconceived notions. By keeping the analysts blinded, the investigation aims to produce more reliable and unbiased results.
Attrition
Twelve metastatic PDAC patients were enrolled, but the investigation was ended prematurely due to COVID-19 and lower-than-expected enrollment (September 2020 to November 2022). Patient characteristics are summarized in Table S1. Two patients did not receive study medications and were dropped out. Three additional patients had clinical progression of disease after receiving one dose of the study drug but before the radiographic assessment for treatment response. Among the 7 patients evaluated, 3 demonstrated partial radiographic responses in their measured target lesions, while four patients achieved stable disease.
Animal studies
The IACUC (University of Alabama Institutional Animal Care and Use Committee) approved all mice studies were presented in this work. For PDAC efficacy in 5–6-week-old C57BL/6J (Strain #:000664; RRID: IMSR_JAX:000664; Jackson Labs) male mice were used. 1×10⁵ KPC-Luc cells (RRID:CVCL_UY60) in 30ul 1:1 1XPBS and Matrigel (Cat # 354263, Discovery Labware, Inc., Bedford, MA, USA) were injected into the central section of the pancreas (orthotropic) and separated into four groups (each group n = 5). Five days after injection, the establishment of KPC-Luc tumors was verified via bioluminescent images in mice, and treatment was initiated. Group one received PBS and served as a sham; the second group received G (60 mg/kg; weekly twice); the third group received P (0.3 μg/kg; weekly twice) plus H (60 mg/kg; oral daily for fourteen days), and the fourth group received GPH. On days 5 and 20 following treatment, tumor development was evaluated by the IVIS system (bioluminescent imaging). The experiment ended on day 21 when mice were exposed to CO2 for euthanasia as per IACUC instructions. KPC-Luc tumors were collected, weighed, preserved, and processed for further biomarker, proteomics, and single-cell RNA analysis.
The second set of experiments were performed in subcutaneous tumor models. The KPC-Luc cells (1×10⁵) were injected subcutaneously into the C57BL/6J male mice. Group one received PBS and served as a sham; the second group received GnP-H (G, 60 mg/kg (I.P.); nab-paclitaxel (nP), 10 mg/kg (i.v) weekly once; H (60 mg/kg; oral daily); the third group received GnP-P (P, 0.3 μg/kg; weekly twice), and the fourth group received GnP-PH for four weeks. Tumor volumes were measured weekly, once with the help of digital calipers. Tumor volume was determined using the formula v = LXW2/2. Terminal tumor weight of treated and untreated mice was noted.
The third set of experiments was performed using orthotopic pancreatic tumor models similar to that described above in the initial set of experiments to assess overall survival as the endpoint. This study’s treatment was given until the final observation week, excluding death or morbidity. This study was terminated on day 53. Survival estimates were calculated via Kaplan-Meier using Log -rank test (Mantel-Cox) survival curves from each group’s implanting KPC-Luc cells in the pancreas.
The fourth set of experiments was performed used a PDX model. For PDX tumor efficacy in 6–7-week-old NOD.Cg-Prkdcscid Il2rgtm1Wjl/SzJ (Strain # 005557; RRID: IMSR_JAX:005557; Jackson Labs) male mice were used. G12V mutated pancreaticobiliary-PDX (freshly acquired from an 81-year male patient with a previous history of PDAC; MPDX0028; Gly12Val;28) cell suspension (equal to 10 mg) was injected into the pancreas of NSG mice. After two weeks, the animals were randomized into four groups (each group n = 6). Treatment was given for two weeks, as indicated above. The experiment ended on day 19, when mice were exposed to CO2 for euthanization as per IACUC instructions. Tumors were collected and weighed, and body weight was measured.
For the fifth set of experiments, 10 mg PDAC-PDX fragments (KrasGly12D;29) immersed lightly in Matrigel were implanted subcutaneously and separated into four groups (each group n = 6) when the tumor reached nearly 100 mm3. Treatment was given the above-indicated doses for 33 days, and the digital calipers evaluated tumor development. Tumor volumes were measured weekly once with digital calipers, and PDX volume was determined using the formula v = LXW2/2. The experiment ended on day 33, when mice were exposed to CO2 for euthanization as per IACUC instructions. Tumors were collected and weighed, and body weight was measured.
In vitro studies
Cell lines, authentication and pathogen testing
Purchased and gifted cell lines were routinely authenticated according to ATCC guidelines. PDAC human (PANC-1, RRID:CVCL_0480, and Mia PaCa-2, RRID:CVCL_0428, ATCC, Manassas, VA, USA) and mouse cell lines (KPC-Luc, RRID:CVCL_UY60, a gift from Dr Craig Logsdon, MD Anderson Cancer Center; 5363,RRID:CVCL_5363 a gift from Chris Klug’s lab, University of Alabama) were used in present investigation. Additionally, all cell lines were tested for a comprehensive panel of pathogens, including mycoplasma, before in vivo investigations by the University of Alabama IACUC and ARP procedures.
Method details
Cell proliferation assay
Cell viability under both treated and untreated conditions was quantified using the XTT assay (Cat # 30-1011K, ATCC, Manassas, VA, USA). PDAC human and mouse cell lines were seeded into a 96-well plate at a 7.5x10³ cells/100μL density in each well. Cell confluence of 70% was attained after 16 h, followed by cell line treatment with drugs hydroxychloroquine (H; Cat. No. H1126, Portland, OR, USA), paricalcitol (P, Cat. No. 1499414 USP, Millipore Sigma, Burlington, MA, United States), and gemcitabine (G; Cat. No. A433642-5g, AM Beed, Arlington Hts, IL, USA) to a final concentration of 25μM, 300nM, and 7.5nM, respectively and incubated at 37°C incubator for 36hrs. Subsequently, the cells were given 40ul of XTT reagent in each well and incubated at 37°C for 2 h. Using a Bio-Tek 800TS microplate reader, the optical density (OD) was confirmed at 450 and 660 nm. The experiment was performed in triplicates, and the viability percentage is shown relative to sham cells.
Clonogenic assay
The colony-developing ability of the cells was assessed by the clonogenic test in both the treated and untreated PDAC cell lines. Initially, 500 cells (KPC-Luc, 5363, PANC, and Mia PaCa-2) were plated in triplicate wells of a 6-well plate and kept alive at 37°C in 5% CO2 overnight. H (25μM) plus P (300nM), without G (7.5nM), were administered in each cell line for 36 h. After 36 h, old media was substituted with fresh complete media every three days, and cells were grown for about two weeks in the incubator. The colonies were fixed and stained with 0.5% crystal violet in 20% methanol. Each colony (containing <50 cells) was considered and counted manually for each cell line. The experiment was performed in triplicate, and the survival percentage is shown relative to sham cells. The average number of colonies in sham triplicate wells was 1%.
Immunocytochemistry
KPC-Luc, 5363, and PANC-1 (1 X 10⁴) cells were seeded and allowed to grow overnight on an 8-well chamber plate. The cells were exposed to G, P, and H for 36 h. For fixation of cells, each chamber was filled with formalin (4%) 45 min and for permeabilization, Triton X-100 (0.25%) was added for 10 min to each chamber. Cells were blocked with 1.5% BSA (60 min at RT). The anti-LC3A/B (1:500, RRID: AB_2728823) was added to each chamber and incubated for 3 h at RT. After incubation, the chamber slides were washed (3X) with 1×PBS (ice-cold). The goat anti-rabbit (RRID: AB_10563566, 1:1500, Alexa Fluor 568) was added to each chamber for 1 h at RT, followed by washed (3X) with 1×PBS (ice-cold). The chamber slides were mounted with mounting medium (Prolong Gold antifade with DAPI; Invitrogen). Pictures of cells were captured and visualized using ECHO Revolution. Data was analyzed using a Java-based image processing program (NIH, LOCI, University of Wisconsin).
Electron microscopy
Hydroxychloroquine (H; 25μM) plus paricalcitol (P, 300nM), with or without gemcitabine (G, 7.5nM), were administered to each cell line for 36 h. After 36 h, cell lines were collected using trypsin and washed (2X) with 1×PBS (ice-cold). Cell lines (PANC-1, Mia PaCa-2, and KPC-Luc) were resuspended in ice-cold 1XPBS: fixative solution (2% paraformaldehyde plus 2.5% glutaraldehyde in 100mM cacodylate solution; pH 7.0). The cells post-fixed in osmium tetroxide plus 2% potassium ferrocyanide (Sigma-Aldrich) for 1 h on ice. Then, the samples were placed in an ethanol gradient (50–100%; Sigma-Aldrich) for 10 min. The cells were mounted in an embedding medium (Embed-812). Sections (60 nm) were obtained horizontally by ultramicrotome (Leica, Germany) and mounted on slot grids with a sample support film. The mounted slides were dual stained with uranyl acetate (2% Sigma-Aldrich) for 15 min and then citrated for 5 min. The specimens were examined using a Hitachi H-7500 electron microscope operated at 75 kV at Robert P. Apkarian Integrated Electron Microscopy Core facility in Emory University.
Stable cell line preparations
Specific VDR and non-silencing (NS) Short hairpin RNA (shRNAs; pLKO.1; RRID: Addgene_10878) of the human (TRC ID #N0000019504) and mouse (TRC ID #N0000027104) were acquired from Sigma Aldrich. Lentiviral particles were generated by pSPAX2 (RRID: Addgene_12260), pMD2 (RRID: Addgene_12259) and with VDR or NS shRNAs into HEK293T cells (RRID: CVCL_0063) with effectene (Cat. # 301425, Qiagen). The incubated medium was cleaned with a sterile filter (0.45μm). Stable PDAC cells were generated by infecting PDAC cell lines by adding puromycin (0.5 μg/ml for KPC-Luc, Mia PaCa-2, and 0.75 μg/ml for PANC-1).
Immunoblot analysis
Treated and non-treated cell lines were lysed using RIPA (containing phosphor-protease inhibitors) buffer. 30 μg of the protein sample was resolved with 4–20% of precast gels (BIO-RAD, Cat # 4568096) for polyacrylamide gel electrophoresis (PAGE) and blotted to Polyvinyl difluoride (PVDF) membrane (iBlot 3 PVDF Regular stacks Cat No: IB34001) using iBlot dry transfer technology (Invitrogen). The membrane was fixed with methanol and 2% BSA buffer blocking. The membrane was probed with primary antibody (ATG5 Rabbit mAb RRID:AB_2630393 (D5F5U); ATG7 Rabbit mAb RRID:AB_10831194 (D12B11); BECLIN-1 Rabbit mAb RRID:AB_1903911 (D40C5); LC3A/B Rabbit mAb RRID:AB_2728823 (D3U4C) and Vitamin D3 Receptor Rabbit mAb RRID:AB_2637002 (D2K6W) (1:1000 dilution) incubated, followed by HRP-conjugated secondary antibody (Anti-mouse, RRID:AB_330924; Anti-rabbit, RRID:AB_2099233) and incubation. Later, the membrane was developed with a chemiluminescent substrate (Cat # 34579). The results of the bands were evaluated using LI-COR Odyssey XF. The ImageJ, RRID:SCR_003070 program quantified the band intensity.
Immunohistochemistry
Fresh formalin fixed paraffin embedded (FFPE) slides were deparaffinized using xylene. Tissues were then serially dehydrated using ethanol and rehydrated before heat induced epitope retrieval (HIER). HIER was performed using citrate buffer at pH 9.0 by bringing the slides to sub-boiling temperature using a microwave oven. Endogenous peroxidase was quenched and blocked with the normal horse serum from the vector labs universal ABC kit (PK-8200). Overnight incubation at 4°C with Primary antibodies (αSMA (1:500), Ki67 (1:500), FAP, and Decorin at 1:1000 dilutions) was performed, and the ABC kit manufacturer protocol was followed for secondary and avidin-biotin staining. DAB from the kit was used to visualize the expression of the protein using a bright field setting of the ECHO revolution microscope at 20x magnification. Additionally, hematoxylin and eosin staining were also performed using FFPE to study the morphology and mitotic activity in the tissue samples.
Single-cell tumor processing
Portions of the tumor tissues (∼1g of tumor obtained in total from three animals of each group) were collected in a labeled C-tube with 5 mL of digesting media to isolate single cells from the tumor tissues. Digestion media is DMEM with 1% FBS, 1.5 mg/ml collagenase D, 2000 U DNase I, and 25 μg/ml of liberase. Tumors were manually excised into small pieces with sterile scissors into a C-tube containing digestion media. Tumors were dissociated twice on each tube using a gentle MACS dissociator followed by incubation at 370C for 15 min while constantly shaking. The cell suspension (Miltenyi Biotec) was passed through a 100μm cell strainer into a 50 mL conical tube. The cell suspension was washed with DPBS and spun at 1700rpm (575g) for 5 min. After several washes with DPBS, the cells were resuspended in an appropriate media for downstream analysis.
Viable tumor single cells were employed to produce scRNA-Seq libraries using a standard 10X genomics approach. After the filter, single-cell transcriptome results of 9705 cells from sham, 14840 cells from PH, 12715 cells from G, and 2520 cells from GPH-treated mice were obtained.
Preprocessing, clustering, and annotation
scRNA-seq raw data was demultiplexed, aligned to the mouse reference genome (mm10) for further quantification of gene expression, and preprocessed by cell ranger 6.1 with default setups. The cell ranger output count matrix files were further analyzed and visualized with Seurat R package v.4.3.0 (RRID: SCR_016341). We filtered as follows as a criteria nFeature_RNA (nGene) ≥ 250 & nCount_RNA (nUMI) < 30000 and percent.mt < 15 (15% mitochondrial genes). A global scaling method for single-cell normalization was used after filtering unwanted cells and mitochondrial genes to normalize data by Log Normalize. Then we calculated 4000 highly variable features for further analysis, such as scaling the data, linear dimensional reduction (LDR), non-LDR, and clustering the cells by PCA, t-SNE and UMAP with default parameters.
We used the top 30 PCs (principal components) with a 0.5 resolution to create 27 clusters using the FindClusters method. These created clusters were further annotated with the default method of FindAllMarkers used for each cluster’s differentially expressed genes (DEGs) with positive and negative markers and Wilcoxon rank-sum test. Another way we used to confirm the clusters with well-known canonical gene markers such as T cells (Cd3d, Cd3e, Cd3g), B cells (Cd79b, Ms4a1, Mzb1), Natural killer (NK) cells (Nkg7, Il2rb), Macrophage (Cd14, Ms4a7, Cd68, C1qc), Endothelial cells (Cdh5, Cldn5, Pecam1), Fibroblasts (Col1a1, Lum, Pdgfra), and PDAC (Krt18, Krt19, Mmp7). Finally, we assigned each cluster with their respective cell type names properly. Further, we were interested in a subset of the T cells, macrophages, and fibroblast cells, respectively. The cell types of interest were subsetted and then normalized, highly variable genes were identified, the data was scaled, and dimensional reduction analysis was applied using the Seurat R package. As mentioned above, we used well-known canonical gene markers for T cells, macrophages, and fibroblast subtypes. Using the Cytoscape tool, we constructed the gene-gene interaction network for autophagy genes with default parameters (https://cytoscape.org; RRID # SCR_003032).
Flow cytometry analysis
ACK lysis buffer was used to remove red blood cells from the media containing single cells. Cells were then washed with FACS buffer and blocked using an Fc blocking agent. Tumor single cells were labeled with primary fluorophore-conjugated antibodies and a live/dead stain for 60 min on ice, washed with PBS, and re-suspended in 2% BSA in PBS. After the wash, a single cell was stained for surface antigens in the dark at room temperature (RT). Leukocytes in the single cell suspension were stirred with BD GolgiPlug and BD leukocyte activation cocktail (Catalog no. BDB550583). In the dark, intracellular staining was done following permeabilization using an eBioscience Foxp3 kit (Catalog no. 00-5523-00). Cells were exposed to 2% Paraformaldehyde and filtered before data procurement. Flow cytometry (Symphony A5) was analyzed using the BD FACSymphony A5 cell Analyzer and FLOWJO software (version 10.7.2.; RRID: SCR_008520; Becton Dickinson).
Proteomics and sample preparation
Individual tumors were homogenized with a RIPA buffer, including a protease and phosphatase inhibitor cocktail (Cat # PPC1010; Sigma-Aldrich, St. Louis, MO, USA). The bicinchoninic acid method determined the protein concentration in each tumor sample. Iodoacetamide (10 mM) and dithiothreitol (5 mM) were mixed and added to each tumor lysate (100μg, 35 min). The tumor lysates were treated with endopeptidase (lysyl) for 16 h. The tumor lysates were further processed with 50 mM NH4HCO3 and trypsin (1:25 (w/w)) at RT for 16h. The digested samples were desalinized with a Sep-Pak C18 column (Waters) and vacuumed to remove wetness.
Tandem Mass tag (TMT) labeling
Peptide labeling utilized the TMTPro isobaric tags method (Thermofisher Scientific, A44520 Lot# UK297033). The labeling reagents were brought to room temperature, and 200 μL of acetonitrile was added to each channel, followed by vortexing for 3 min. Next, 20 μL of each reagent was added to the peptide samples and incubated at room temperature for 60 min. The reaction was stopped using 5% hydroxylamine (Pierce). Subsequently, all 16 channels were dried using a SpeedVac concentrator and then diluted with 1 mL of trifluoroacetic acid (TFA). The samples were acidified to 1% formic acid (FA) and 0.1% TFA. Desalination was performed using a 60 mg HLB plate (Waters), and the eluates were evaporated to dryness.
Fractionation in high pH conditions
Dried samples were reconstituted in a loading buffer (0.07% NH4OH, 0.045% FA, 2% CAN; high pH) and filled onto a Water’s BEH (2.1 mm × 150 mm with 1.7 μm beads), and fractionation carried out by a UPLC system (Thermo Vanquish). Each eluted fraction was collected in a gradient manner for 25 min (0.6 mL/min flow rate; 48 fractions) and dried with vacuum centrifugation.
Liquid chromatography TM spectrometry
All dried fractions were evaluated in a gradient manner (30 fractions per day) on the Evosep One system with a capillary column (15 cm, 75 μm i.d.) with C18 beads (1.9 μm; Dr. Maisch, Ammerbuch, Germany). Mass spectral analysis was conducted via Q-Exactive Plus (events:10 MS/MS per run limit). Each run contained one complete MS scan tracked by many events (10 MS/MS). Each MS scan was collected at 70,000 resolutions. Each HCD-MS/MS spectrum was obtained at 35,000 resolutions.
Data processing
Sequest HT obtained all raw data files with Proteome Discoverer software (Thermo’s, version:2.4.1.15; RRID:SCR_014477). Each spectrum was examined using a database (mouse UniProt; August 2020; 91413 target sequences). Razor (i.e., parsimonious) and individual peptides were counted for protein quantification. We analyzed gene ontology by g: Profiler (https://biit.cs.ut.ee/gprofiler; RRID:SCR_006809). The tool offered a structured query option that incorporates ranking during enrichment tests. The process involves iterative testing, beginning with the initial gene and progressively adding genes in sequence. For each term, it reports the smallest enrichment p-value alongside the size of the corresponding gene list.
Study endpoints
The primary endpoint determined the objective response rate (ORR), which evaluated partial responses (PR) and complete (CR) established on the criteria of RECIST version 1.1. Examining of cancer antigen (CA-19-9) levels did not happen routinely. Secondary endpoints involved overall survival (OS), progression-free survival (PFS), and safety. PFS spanned from treatment initiation to clinical or radiographic progression or death, with censoring at the last progression-free clinical evaluation. OS measured from treatment initiation to death or last follow-up.
Radiographic assessments and clinical evaluations occurred 8- and 16 weeks post-treatment initiation, followed by evaluations every eight weeks while patients remained on therapy. Independent imaging review did not take place. Serious adverse events (SAEs) and treatment-related adverse events (AEs) graded 3 to 5 were reported following CTCAE version 4.0.
For biopsies of metastasized PDAC in the liver, samples underwent dissociation using the GentleMACs dissociation kit (Miltenyi Biotec) per manufacturer instructions, followed by viably freezing. Single-cell RNA sequencing utilized the NextGem 3′V3.1 kit (10x Genomics) for preliminary analysis, distinguishing PDAC clusters alongside T cells and endothelial cells from pre-treatment (1537 cells) and post-treatment (367 cells) samples of patient D.
PDAC biopsies immunofluorescence assay
The spatial composition of PDAC metastases was assessed using an AKOYA bioscience CODEX immunofluorescence assay. Using the CodexMAV plugin for ImageJ, individual cells were segmented based on their DAPI expression. A Voronoi diagram was computed for each cell to establish cell area and the average fluorescent intensity of each marker in this region to generate per-cell expression profiles. These cells were clustered using X-shift clustering using the CodexMAV plugin, and clusters were annotated based on per-cell average marker expression. Clusters, such as T cells, were manually refined by gating for canonical marker expression, such as Cd4 vs. Cd8 expression. Clustering was performed independently on the baseline and post-treated samples, which were imaged in different rounds. Post-treated sample A contained an artifact from a fiber overlapping part of the visible region, which displayed autofluorescence for a subset of the stains. Regions from this artifact were manually marked and omitted from any downstream analysis.
Statistical considerations
The statistical methodology employed Simon’s optimal two-stage Minimax design, hypothesizing an ORR of 23% under null versus 45% under alternative hypotheses, with power and alpha set at 80% and 10%, respectively. Stage I required enrollment of 15 patients, closing if fewer than four achieved objective responses or expanding to stage II if warranted. The null hypothesis was rejected with at least eight objective responses, with primary endpoint summarization adjusted per the study’s two-stage design and 90% confidence intervals. Kaplan-Meier curves using Log -rank test (Mantel-Cox) (R v. 4.3.2) (GraphPad Prism 10.0.2; RRID # SCR_002798) estimated PFS and OS distributions and safety analyses encompassed all treated patients.
Quantification and statistical analysis
One-way ANOVA, followed by Tukey’s test for pairwise analysis (GraphPad Prism 10.0.2; RRID # SCR_002798), was run for various group comparisons of means. If the parametric test assumptions were not met, non-parametric test like Kruskal-Wallis test (for three or more groups). two-way ANOVA was considered for mean comparisons across two factors: treatment and phenotype. Results were shown as mean ± SD. Or SE. Survival was estimated using the Kaplan-Meier method, and survival distributions were compared using the Log -rank test (Mantel-Cox) (R v. 4.3.2) (GraphPad Prism 10.0.2; RRID # SCR_002798). A statistically significant deviation was deemed at p < 0.05. All tests were two-sided unless otherwise noted. The sample number for the power of 0.8 at α value of 0.05 was determined using G-power 3.1.9 (RRID:SCR_013726).
Additional resources
This study was registered prior to subject enrollment (clinicaltrials.gov identifier: NCT04524702).
Published: December 26, 2024
Footnotes
Supplemental information can be found online at https://doi.org/10.1016/j.xcrm.2024.101881.
Supplemental information
References
- 1.Rahib L., Wehner M.R., Matrisian L.M., Nead K.T. Estimated projection of US cancer incidence and death to 2040. JAMA Netw. Open. 2021;4:e214708. doi: 10.1001/jamanetworkopen.2021.4708. [DOI] [PMC free article] [PubMed] [Google Scholar]
- 2.Siegel R.L., Miller K.D., Wagle N.S., Jemal A. Cancer statistics, 2023. CA. Cancer J. Clin. 2023;73:17–48. doi: 10.3322/caac.21763. [DOI] [PubMed] [Google Scholar]
- 3.Jiang Y., Sohal D.P.S. Pancreatic adenocarcinoma management. JCO Oncol. Pract. 2023;19:19–32. doi: 10.1200/OP.22.00328. [DOI] [PubMed] [Google Scholar]
- 4.Di Costanzo F., Di Costanzo F., Antonuzzo L., Mazza E., Giommoni E. Optimizing First-Line Chemotherapy in Metastatic Pancreatic Cancer: Efficacy of FOLFIRINOX versus Nab-Paclitaxel plus Gemcitabine. Cancers. 2023;15:416. doi: 10.3390/cancers15020416. [DOI] [PMC free article] [PubMed] [Google Scholar]
- 5.Sherman M.H., Beatty G.L. Tumor microenvironment in pancreatic cancer pathogenesis and therapeutic resistance. Annu. Rev. Pathol. 2023;18:123–148. doi: 10.1146/annurev-pathmechdis-031621-024600. [DOI] [PMC free article] [PubMed] [Google Scholar]
- 6.Luong T., Golivi Y., Nagaraju G.P., El-Rayes B.F. Fibroblast heterogeneity in pancreatic ductal adenocarcinoma: Perspectives in immunotherapy. Cytokine Growth Factor Rev. 2022;68:107–115. doi: 10.1016/j.cytogfr.2022.09.001. [DOI] [PubMed] [Google Scholar]
- 7.Singh S.S., Vats S., Chia A.Y.-Q., Tan T.Z., Deng S., Ong M.S., Arfuso F., Yap C.T., Goh B.C., Sethi G., et al. Dual role of autophagy in hallmarks of cancer. Oncogene. 2018;37:1142–1158. doi: 10.1038/s41388-017-0046-6. [DOI] [PubMed] [Google Scholar]
- 8.Singh B.N., Kumar D., Shankar S., Srivastava R.K. Rottlerin induces autophagy which leads to apoptotic cell death through inhibition of PI3K/Akt/mTOR pathway in human pancreatic cancer stem cells. Biochem. Pharmacol. 2012;84:1154–1163. doi: 10.1016/j.bcp.2012.08.007. [DOI] [PubMed] [Google Scholar]
- 9.Zachari M., Ganley I.G. The mammalian ULK1 complex and autophagy initiation. Essays Biochem. 2017;61:585–596. doi: 10.1042/EBC20170021. [DOI] [PMC free article] [PubMed] [Google Scholar]
- 10.Cui B., Lin H., Yu J., Yu J., Hu Z., editors. Autophagy and the immune response. Springer; 2019. [DOI] [PMC free article] [PubMed] [Google Scholar]
- 11.Münz C. Autophagy beyond intracellular MHC class II antigen presentation. Trends Immunol. 2016;37:755–763. doi: 10.1016/j.it.2016.08.017. [DOI] [PubMed] [Google Scholar]
- 12.Zhao Z.-x., Zhang Y.-Q., Sun H., Chen Z.-Q., Chang J.-j., Wang X., Wang X., Tan C., Ni S.-J., Weng W.-W., et al. Calcipotriol abrogates cancer-associated fibroblast-derived IL-8-mediated oxaliplatin resistance in gastric cancer cells via blocking PI3K/Akt signaling. Acta Pharmacol. Sin. 2023;44:178–188. doi: 10.1038/s41401-022-00927-1. [DOI] [PMC free article] [PubMed] [Google Scholar]
- 13.Liu X., Iovanna J., Santofimia-Castaño P. Stroma-targeting strategies in pancreatic cancer: a double-edged sword. J. Physiol. Biochem. 2022;79:213–222. doi: 10.1007/s13105-022-00941-1. [DOI] [PubMed] [Google Scholar]
- 14.Yu Y., Schuck K., Friess H., Kong B. Targeting aggressive fibroblasts to enhance the treatment of pancreatic cancer. Expert Opin. Ther. Targets. 2021;25:5–13. doi: 10.1080/14728222.2021. [DOI] [PubMed] [Google Scholar]
- 15.Gorchs L., Ahmed S., Mayer C., Knauf A., Fernández Moro C., Svensson M., Heuchel R., Rangelova E., Bergman P., Kaipe H. The vitamin D analogue calcipotriol promotes an anti-tumorigenic phenotype of human pancreatic CAFs but reduces T cell mediated immunity. Sci. Rep. 2020;10:17444–17515. doi: 10.1038/s41598-020-74368-3. [DOI] [PMC free article] [PubMed] [Google Scholar]
- 16.Kong W., Liu Z., Sun M., Liu H., Kong C., Ma J., Wang R., Qian F. Synergistic autophagy blockade and VDR signaling activation enhance stellate cell reprogramming in pancreatic ductal adenocarcinoma. Cancer Lett. 2022;539 doi: 10.1016/j.canlet.2022.215718. [DOI] [PubMed] [Google Scholar]
- 17.Tavera-Mendoza L.E., Westerling T., Libby E., Marusyk A., Cato L., Cassani R., Cameron L.A., Ficarro S.B., Marto J.A., Klawitter J., Brown M. Vitamin D receptor regulates autophagy in the normal mammary gland and in luminal breast cancer cells. Proc. Natl. Acad. Sci. USA. 2017;114:E2186–E2194. doi: 10.1073/pnas.1615015114. [DOI] [PMC free article] [PubMed] [Google Scholar]
- 18.Suares A., Tapia C., González-Pardo V. VDR agonists down regulate PI3K/Akt/mTOR axis and trigger autophagy in Kaposi's sarcoma cells. Heliyon. 2019;5 doi: 10.1016/j.heliyon.2019.e02367. [DOI] [PMC free article] [PubMed] [Google Scholar]
- 19.Kanat O., Ertas H. Shattering the castle walls: Anti-stromal therapy for pancreatic cancer. World J. Gastrointest. Oncol. 2018;10:202–210. doi: 10.4251/wjgo.v10.i8.202. [DOI] [PMC free article] [PubMed] [Google Scholar]
- 20.Schwartz G.G., Eads D., Naczki C., Northrup S., Chen T., Koumenis C. 19-nor-1α, 25-Dihydroxyvitamin D2 (Paricalcitol) inhibits the proliferation of human pancreatic cancer cells in vitro and in vivo. Cancer Biol. Ther. 2008;7:430–436. doi: 10.4161/cbt.7.3.5418. [DOI] [PubMed] [Google Scholar]
- 21.Mukai Y., Yamada D., Eguchi H., Iwagami Y., Asaoka T., Noda T., Kawamoto K., Gotoh K., Kobayashi S., Takeda Y., et al. Vitamin D supplementation is a promising therapy for pancreatic ductal adenocarcinoma in conjunction with current chemoradiation therapy. Ann. Surg Oncol. 2018;25:1868–1879. doi: 10.1245/s10434-018-6431-8. [DOI] [PubMed] [Google Scholar]
- 22.Abdel-Aziz A.K., Saadeldin M.K., Salem A.H., Ibrahim S.A., Shouman S., Abdel-Naim A.B., Orecchia R. A Critical Review of Chloroquine and Hydroxychloroquine as Potential Adjuvant Agents for Treating People with Cancer. Future Pharmacology. 2022;2:431–443. doi: 10.3390/futurepharmacol2040028. [DOI] [Google Scholar]
- 23.Chen D., Xie J., Fiskesund R., Dong W., Liang X., Lv J., Jin X., Liu J., Mo S., Zhang T., et al. Chloroquine modulates antitumor immune response by resetting tumor-associated macrophages toward M1 phenotype. Nat. Commun. 2018;9:873. doi: 10.1038/s41467-018-03225-9. [DOI] [PMC free article] [PubMed] [Google Scholar]
- 24.Principe D.R., Timbers K.E., Atia L.G., Koch R.M., Rana A. TGFβ signaling in the pancreatic tumor microenvironment. Cancers. 2021;13:5086. doi: 10.1158/0008-5472.CAN-15-1293. [DOI] [PMC free article] [PubMed] [Google Scholar]
- 25.AlMasri S.S., Zenati M.S., Desilva A., Nassour I., Boone B.A., Singhi A.D., Bartlett D.L., Liotta L.A., Espina V., Loughran P., et al. Encouraging long-term survival following autophagy inhibition using neoadjuvant hydroxychloroquine and gemcitabine for high-risk patients with resectable pancreatic carcinoma. Cancer Med. 2021;10:7233–7241. doi: 10.1002/cam4.4211. [DOI] [PMC free article] [PubMed] [Google Scholar]
- 26.Fei N., Wen S., Ramanathan R., Hogg M.E., Zureikat A.H., Lotze M.T., Bahary N., Singhi A.D., Zeh H.J., Boone B.A. SMAD4 loss is associated with response to neoadjuvant chemotherapy plus hydroxychloroquine in patients with pancreatic adenocarcinoma. Clin. Transl. Sci. 2021;14:1822–1829. doi: 10.1111/cts.13029. [DOI] [PMC free article] [PubMed] [Google Scholar]
- 27.Karasic T.B., O’Hara M.H., Loaiza-Bonilla A., Reiss K.A., Teitelbaum U.R., Borazanci E., De Jesus-Acosta A., Redlinger C., Burrell J.A., Laheru D.A., et al. Effect of gemcitabine and nab-paclitaxel with or without hydroxychloroquine on patients with advanced pancreatic cancer: a phase 2 randomized clinical trial. JAMA Oncol. 2019;5:993–998. doi: 10.1001/jamaoncol.2019.0684. [DOI] [PMC free article] [PubMed] [Google Scholar]
- 28.Foote J.B., Mattox T.E., Keeton A.B., Chen X., Smith F., Berry K.L., Holmes T., Wang J., Huang C.-H., Ward A.B., et al. A Novel Pan-RAS Inhibitor with a Unique Mechanism of Action Blocks Tumor Growth in Mouse Models of GI Cancer. bioRxiv. 2024 doi: 10.1101/2023.05.17.541233. Preprint at. [DOI] [PMC free article] [PubMed] [Google Scholar]
- 29.Miller A.L., Garcia P.L., Gamblin T.L., Vance R.B., Yoon K.J. Development of gemcitabine-resistant patient-derived xenograft models of pancreatic ductal adenocarcinoma. Cancer Drug Resist. 2020;3:572–585. doi: 10.20517/cdr.2020.35. [DOI] [PMC free article] [PubMed] [Google Scholar]
- 30.Deng J., Guo Y., Du J., Gu J., Kong L., Tao B., Li J., Fu D. The intricate crosstalk between insulin and pancreatic ductal adenocarcinoma: a review from clinical to molecular. Front. Cell Dev. Biol. 2022;10 doi: 10.3389/fcell.2022.844028. [DOI] [PMC free article] [PubMed] [Google Scholar]
- 31.Elyada E., Bolisetty M., Laise P., Flynn W.F., Courtois E.T., Burkhart R.A., Teinor J.A., Belleau P., Biffi G., Lucito M.S., et al. Cross-species single-cell analysis of pancreatic ductal adenocarcinoma reveals antigen-presenting cancer-associated fibroblasts. Cancer Discov. 2019;9:1102–1123. doi: 10.1158/2159-8290.CD-19-0094. [DOI] [PMC free article] [PubMed] [Google Scholar]
- 32.Ma C., Yang C., Peng A., Sun T., Ji X., Mi J., Wei L., Shen S., Feng Q. Pan-cancer spatially resolved single-cell analysis reveals the crosstalk between cancer-associated fibroblasts and tumor microenvironment. Mol. Cancer. 2023;22:170. doi: 10.1186/s12943-023-01876-x. [DOI] [PMC free article] [PubMed] [Google Scholar]
- 33.Nakajima Y., Chamoto K., Oura T., Honjo T. Critical role of the CD44lowCD62Llow CD8+ T cell subset in restoring antitumor immunity in aged mice. Proc. Natl. Acad. Sci. USA. 2021;118 doi: 10.1073/pnas.2103730118. [DOI] [PMC free article] [PubMed] [Google Scholar]
- 34.Xu C., Wang Y., Tu Q., Zhang Z., Chen M., Mwangi J., Li Y., Jin Y., Zhao X., Lai R. Targeting surface nucleolin induces autophagy-dependent cell death in pancreatic cancer via AMPK activation. Oncogene. 2019;38:1832–1844. doi: 10.1038/s41388-018-0556-x. [DOI] [PubMed] [Google Scholar]
- 35.Xavier C.B., Marchetti K.R., Castria T.B., Jardim D.L.F., Fernandes G.S. Trametinib and Hydroxychloroquine (HCQ) combination treatment in KRAS-mutated advanced pancreatic adenocarcinoma: detailed description of two cases. J. Gastrointest. Cancer. 2021;52:374–380. doi: 10.1007/s12029-020-00556-z. [DOI] [PubMed] [Google Scholar]
- 36.Cao W., Li J., Yang K., Cao D. An overview of autophagy: Mechanism, regulation and research progress. Bull. Cancer. 2021;108:304–322. doi: 10.1016/j.bulcan.2020.11.004. [DOI] [PubMed] [Google Scholar]
- 37.Li X., He S., Ma B. Autophagy and autophagy-related proteins in cancer. Mol. Cancer. 2020;19:12–16. doi: 10.1186/s12943-020-1138-4. [DOI] [PMC free article] [PubMed] [Google Scholar]
- 38.Modi S., Kir D., Banerjee S., Saluja A. Control of apoptosis in treatment and biology of pancreatic cancer. J. Cell. Biochem. 2016;117:279–288. doi: 10.1002/jcb.25284. [DOI] [PMC free article] [PubMed] [Google Scholar]
- 39.Vivot K., Pasquier A., Goginashvili A., Ricci R. Breaking bad and breaking good: β-cell autophagy pathways in diabetes. J. Mol. Biol. 2020;432:1494–1513. doi: 10.1016/j.jmb.2019.07.030. [DOI] [PubMed] [Google Scholar]
- 40.Jacobetz M.A., Chan D.S., Neesse A., Bapiro T.E., Cook N., Frese K.K., Feig C., Nakagawa T., Caldwell M.E., Zecchini H.I., et al. Hyaluronan impairs vascular function and drug delivery in a mouse model of pancreatic cancer. Gut. 2013;62:112–120. doi: 10.1136/gutjnl-2012-302529. [DOI] [PMC free article] [PubMed] [Google Scholar]
- 41.Thuwajit C., Ferraresi A., Titone R., Thuwajit P., Isidoro C. The metabolic cross-talk between epithelial cancer cells and stromal fibroblasts in ovarian cancer progression: Autophagy plays a role. Med. Res. Rev. 2018;38:1235–1254. doi: 10.1002/med.21473. [DOI] [PMC free article] [PubMed] [Google Scholar]
- 42.Chi M.-S., Lee C.-Y., Huang S.-C., Yang K.-L., Ko H.-L., Chen Y.-K., Chung C.-H., Liao K.-W., Chi K.-H. Double autophagy modulators reduce 2-deoxyglucose uptake in sarcoma patients. Oncotarget. 2015;6:29808–29817. doi: 10.18632/oncotarget.5060. [DOI] [PMC free article] [PubMed] [Google Scholar]
- 43.Sherman M.H., Yu R.T., Engle D.D., Ding N., Atkins A.R., Tiriac H., Collisson E.A., Connor F., Van Dyke T., Kozlov S., et al. Vitamin D receptor-mediated stromal reprogramming suppresses pancreatitis and enhances pancreatic cancer therapy. Cell. 2014;159:80–93. doi: 10.1016/j.cell.2014.08.007. [DOI] [PMC free article] [PubMed] [Google Scholar]
- 44.Zhu Y.-H., Zheng J.-H., Jia Q.-Y., Duan Z.-H., Yao H.-F., Yang J., Sun Y.-W., Jiang S.-H., Liu D.-J., Huo Y.-M. Immunosuppression, immune escape, and immunotherapy in pancreatic cancer: focused on the tumor microenvironment. Cell. Oncol. 2023;46:17–48. doi: 10.1007/s13402-022-00741-1. [DOI] [PubMed] [Google Scholar]
- 45.Karamitopoulou E. Tumour microenvironment of pancreatic cancer: immune landscape is dictated by molecular and histopathological features. Br. J. Cancer. 2019;121:5–14. doi: 10.1038/s41416-019-0479-5. [DOI] [PMC free article] [PubMed] [Google Scholar]
- 46.Bayne L.J., Beatty G.L., Jhala N., Clark C.E., Rhim A.D., Stanger B.Z., Vonderheide R.H. Tumor-derived granulocyte-macrophage colony-stimulating factor regulates myeloid inflammation and T cell immunity in pancreatic cancer. Cancer Cell. 2012;21:822–835. doi: 10.1016/j.ccr.2012.04.025. [DOI] [PMC free article] [PubMed] [Google Scholar]
- 47.Peng H., James C.A., Cullinan D.R., Hogg G.D., Mudd J.L., Zuo C., Takchi R., Caldwell K.E., Liu J., DeNardo D.G., et al. Neoadjuvant FOLFIRINOX therapy is associated with increased effector T cells and reduced suppressor cells in patients with pancreatic cancer. Clin. Cancer Res. 2021;27:6761–6771. doi: 10.1158/1078-0432.CCR-21-0998. [DOI] [PMC free article] [PubMed] [Google Scholar]
- 48.Sams L., Kruger S., Heinemann V., Bararia D., Haebe S., Alig S., Haas M., Zhang D., Westphalen C.B., Ormanns S., et al. Alterations in regulatory T cells and immune checkpoint molecules in pancreatic cancer patients receiving FOLFIRINOX or gemcitabine plus nab-paclitaxel. Clin. Transl. Oncol. 2021;23:2394–2401. doi: 10.1007/s12094-021-02620-x. [DOI] [PMC free article] [PubMed] [Google Scholar]
- 49.Pawlik A., Anisiewicz A., Filip-Psurska B., Nowak M., Turlej E., Trynda J., Banach J., Gretkierewicz P., Wietrzyk J. Calcitriol and its analogs establish the immunosuppressive microenvironment that drives metastasis in 4T1 mouse mammary gland cancer. Int. J. Mol. Sci. 2018;19:2116. doi: 10.3390/ijms19072116. [DOI] [PMC free article] [PubMed] [Google Scholar]
- 50.Hirsch D., Archer F.E., Joshi-Kale M., Vetrano A.M., Weinberger B. Decreased anti-inflammatory responses to vitamin D in neonatal neutrophils. Mediat. Inflamm. 2011;2011 doi: 10.1155/2011/598345. [DOI] [PMC free article] [PubMed] [Google Scholar]
- 51.Agraz-Cibrian J.M., Giraldo D.M., Urcuqui-Inchima S. 1, 25-Dihydroxyvitamin D3 induces formation of neutrophil extracellular trap-like structures and modulates the transcription of genes whose products are neutrophil extracellular trap-associated proteins: A pilot study. Steroids. 2019;141:14–22. doi: 10.1016/j.steroids.2018.11.001. [DOI] [PubMed] [Google Scholar]
- 52.Liu X., Kwon H., Li Z., Fu Y.-x. Is CD47 an innate immune checkpoint for tumor evasion? J. Hematol. Oncol. 2017;10:12–17. doi: 10.1186/s13045-016-0381-z. [DOI] [PMC free article] [PubMed] [Google Scholar]
- 53.Alausa A., Lawal K.A., Babatunde O.A., Obiwulu E.N.O., Oladokun O.C., Fadahunsi O.S., Celestine U.O., Moses E.U., Akaniro I.R., Adegbola P.I. Overcoming immunotherapeutic resistance in PDAC: SIRPα-CD47 blockade. Pharmacol. Res. 2022;181 doi: 10.1016/j.phrs.2022.106264. [DOI] [PubMed] [Google Scholar]
- 54.Prakash H., Nadella V., Singh S., Schmitz-Winnenthal H. CD14/TLR4 priming potentially recalibrates and exerts anti-tumor efficacy in tumor associated macrophages in a mouse model of pancreatic carcinoma. Sci. Rep. 2016;6 doi: 10.1038/srep31490. [DOI] [PMC free article] [PubMed] [Google Scholar]
- 55.Jin L., Kim H.S., Shi J. Neutrophil in the pancreatic tumor microenvironment. Biomolecules. 2021;11:1170. doi: 10.3390/biom11081170. [DOI] [PMC free article] [PubMed] [Google Scholar]
- 56.Burugu S., Dancsok A.R., Nielsen T.O. Emerging targets in cancer immunotherapy. Semin. Cancer Biol. 2018;52:39–52. doi: 10.1016/j.semcancer.2017.10.001. [DOI] [PubMed] [Google Scholar]
- 57.Cinier J., Hubert M., Besson L., Di Roio A., Rodriguez C., Lombardi V., Caux C., Ménétrier-Caux C. Recruitment and Expansion of Tregs Cells in the Tumor Environment—How to Target Them? Cancers. 2021;13:1850. doi: 10.3390/cancers13081850. [DOI] [PMC free article] [PubMed] [Google Scholar]
- 58.Zeh H.J., Bahary N., Boone B.A., Singhi A.D., Miller-Ocuin J.L., Normolle D.P., Zureikat A.H., Hogg M.E., Bartlett D.L., Lee K.K., et al. A randomized phase II preoperative study of autophagy inhibition with high-dose hydroxychloroquine and gemcitabine/nab-paclitaxel in pancreatic cancer patients. Clin. Cancer Res. 2020;26:3126–3134. doi: 10.1158/1078-0432.CCR-19-4042. [DOI] [PMC free article] [PubMed] [Google Scholar]
- 59.Bigelsen S. Evidence-based complementary treatment of pancreatic cancer: A review of adjunct therapies including paricalcitol, hydroxychloroquine, intravenous vitamin C, statins, metformin, curcumin, and aspirin. Cancer Manag. Res. 2018;10:2003–2018. doi: 10.2147/CMAR.S161824. [DOI] [PMC free article] [PubMed] [Google Scholar]
- 60.Porter R.L., Magnus N.K.C., Thapar V., Morris R., Szabolcs A., Neyaz A., Kulkarni A.S., Tai E., Chougule A., Hillis A., et al. Epithelial to mesenchymal plasticity and differential response to therapies in pancreatic ductal adenocarcinoma. Proc. Natl. Acad. Sci. USA. 2019;116:26835–26845. doi: 10.1073/pnas.1914915116. [DOI] [PMC free article] [PubMed] [Google Scholar]
Associated Data
This section collects any data citations, data availability statements, or supplementary materials included in this article.
Supplementary Materials
Data Availability Statement
-
•
The data (scRNA-seq raw and proteomics) produced in this manuscript are listed in the key resources table.
-
•
The code pipeline generated in this manuscript is listed in the key resources table.
-
•
Any additional information required to reanalyze the data reported in this paper is available from the lead contact upon request.