

Summary
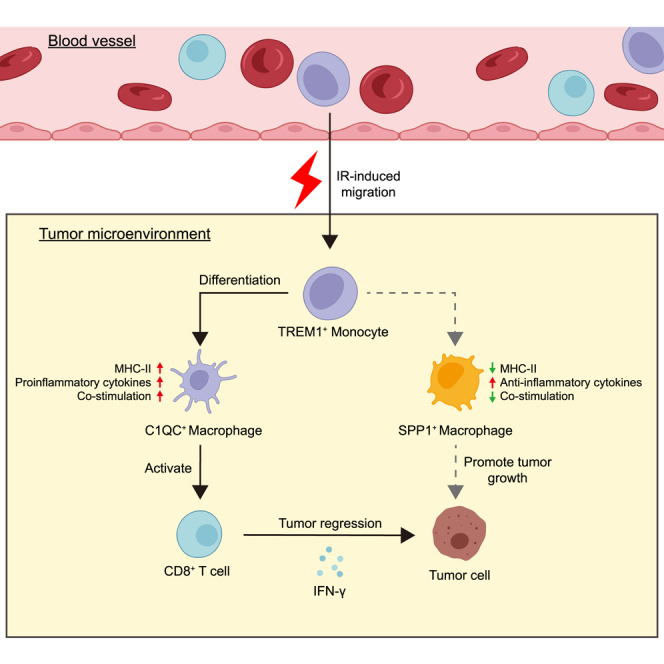
In our previously reported phase 2 and phase 3 studies, the combination of short-course radiotherapy and neoadjuvant immunochemotherapy (SIC) is established as effective cancer therapies for locally advanced rectal cancer (LARC). Here, we apply multi-omic analyses to paired pre- and post-treatment LARC specimens undergoing SIC. The peripheral blood-derived TREM1+ mono-macrophage subsets that display a pro-inflammatory phenotype are identified and correlate with complete response to SIC. Mechanically, ionizing radiation (IR) induces peripheral TREM1+ mono-macrophage expansion in tumors. Following IR, the loss of TREM1 in mono-macrophages undermines antitumor immunity by altering mono-macrophage differentiation and inhibiting CD8+ T cell infiltration and activation. The TREM1+ mono-macrophage response may rely on activation of key inflammatory pathways, including nuclear factor κB (NF-κB) signaling and Toll-like receptor pathway. Pharmacological inhibition of TREM1 signaling abolishes IR-induced immunoactivation and reduces combined IR and/or anti-PD-1 treatment. Thus, we establish a crucial role of a mono-macrophage state in mediating effective cancer therapy.
Keywords: peripheral blood-derived mono-macrophages, short-course radiotherapy, immunochemotherapy, macrophage phenotypic remodeling, locally advanced rectal cancer, TREM1
Graphical abstract
Highlights
-
•
Prospectively collected LARC specimens from a neoadjuvant platform clinical trial
-
•
IR skews TREM1+ Mo differentiation toward C1QC+ TAMs rather than SPP1+ TAMs
-
•
TREM1 pathway activation in mono-macrophages improves response to SIC
-
•
TREM1 elevation in peripheral mono-macrophages post IR correlates with better outcome
Wang et al. evaluate dynamic mono-macrophage compartment changes in tumor and peripheral blood following short-course radiotherapy combined with neoadjuvant immunochemotherapy (SIC) in locally advanced rectal cancer and identify a population of peripheral blood-derived TREM1+ mono-macrophages that may enhance systemic antitumor immunity and is an SIC-specific predictor of response and survival.
Introduction
Colorectal cancer is the second leading cause of cancer-related mortality worldwide with rectal cancer accounting for more than one-third of all cases.1 Approximately 75.4% of rectal cancers present with locally advanced disease and can undergo potentially curative therapy at diagnosis.2 For operable locally advanced rectal cancer (LARC), neoadjuvant chemoradiotherapy followed by surgery is the current standard of care. However, clinical benefits of this approach remain suboptimal with around 15%–30% of patients achieving pathological complete response (pCR) and even 30% developing distant metastases.3,4,5 Therefore, more effective treatments for LARC are needed to improve clinical outcomes.
Increasing numbers of immune checkpoint inhibitors (ICIs) have become available as a treatment option for various malignant tumors. However, for LARC, the efficacy of ICIs is limited to patients with microsatellite instability-high (MSI-H) or mismatch repair-deficient (dMMR) tumors, which could achieve 75%–100% complete response after neoadjuvant immunotherapy.6,7,8 Unfortunately, MSI-H/dMMR prevalence has been reported with a gradual decrease in its distribution from the proximal colon to the rectum and even less than 5% in LARC.9,10 The majority of microsatellite stable (MSS) or mismatch repair-proficient (pMMR) LARC tumors do not respond to treatment with individual ICIs.11 These clinical observations have led to a search for strategies combining immunotherapy and other therapies for patients with LARC with MSS/pMMR tumors. In particular, there is growing interest in combining immunotherapy with radiotherapy, most commonly strategies promoting the systemic activation of T cells. Our previous phase 2 and phase 3 trials demonstrated that short-course radiotherapy (SCRT) combined with neoadjuvant immunotherapy exhibited significant antitumor efficacy and tolerable safety in MSS/pMMR LARC tumors.12,13,14,15 However, the pCR rate was only ∼40%, while other cases showed poor or partial response to the combination treatment; the underlying mechanisms of treatment response and the identification of biomarkers that predict an effective response to the combination treatment have yet to be established.
Radiotherapy elicits numerous positive effects on the tumor microenvironment, such as enhanced leukocyte influx and increased antigen presentation, thereby promoting the systemic activation of CD8+ T cell and enhancing the efficacy of ICIs.16,17,18,19 Notably, the monocyte-macrophage lineage of cells constitutes a large proportion of leukocytes infiltrated to tumors and is implicated in initiating and modulating cytotoxic CD8+ T cell function in correlation with patient outcomes across multiple tumor types.20,21,22,23 A confounding factor in assessing the precise function and mechanism by which the mono-macrophages regulate antitumor T cell immunity is their apparent heterogeneity, which can exist in immunostimulatory or immunosuppressive states, respectively.24 Macrophages constitutively populate developing tissues and respond to inflammatory insults or tissue distress signals by in situ proliferation and/or de novo differentiation from monocytes.25 Nonetheless, the underlying responsive mechanisms and mono-macrophage subsets leading to divergent therapeutic responses remain to be clarified. Therefore, investigating radiotherapy-induced reprogramming of mono-macrophages could give us clues as to whether these cells could promote or suppress antitumor T cell immunity upon therapy.
In the current study, we aim to address these knowledge gaps by examining how radiotherapy shapes the mono-macrophage compartment and how treatment-induced reprogramming of mono-macrophages could influence the efficacy of ICIs. We identify a subset of mono-macrophages expressing TREM1 with pro-inflammatory phenotype that demonstrates enhanced responsiveness to combined radio-immunotherapy, revealing a promising biomarker to guide patient selection for LARC neoadjuvant therapy.
Results
Peripheral blood immune cell characteristics correlate with response to SCRT combined with immunochemotherapy
In our previously reported multicenter, phase 3 clinical trial (UNION, NCT04928807), patients with LARC were randomized to receive long-course radiotherapy sequential chemotherapy (LC) or SCRT followed by immunochemotherapy (SIC) as neoadjuvant therapy and subsequently underwent surgical resection after two treatments.15 There was a marked improved pCR rates in the SIC group versus the LC group. To investigate changes in peripheral blood mononuclear/macrophage system in LARC after neoadjuvant therapy with LC or SIC, we employed a large-scale transcriptomic analysis of peripheral blood mononuclear cells (PBMCs). Specimens were collected from 16 consecutive patients, with 5 patients receiving LC treatment and 11 receiving SIC treatment (Figure 1A; Table S1). By comparing baseline expression profiles (T1) with those post treatment (T3), we identified 603 upregulated and 705 downregulated transcripts in SIC-treated patients (false discovery rate [FDR] < 0.05, fold change ≥ 1.41) and 1,401 upregulated and 899 downregulated transcripts in the LC group, respectively (Figures S1A and S1B). Ingenuity pathway analysis of differential genes showed that SIC significantly induced immunogenic cell death, which was not found in LC, illustrating that SIC is more capable of activating antitumor immunity (Figures S1C and S1D).
Figure 1.

Transcriptomic response to SCRT followed by immunochemotherapy
(A) Schematic overview of the study design.
(B and C) Volcano plot showing differentially expressed genes between the non-pathological complete response (pCR) group (n = 5) and the pCR group (n = 6) at baseline (B) and post treatment (C).
(D) Ingenuity pathway analysis (IPA) revealed significantly upregulated pathways in the pCR group compared to the non-pCR group at baseline (T1) and post treatment (T3).
To identify markers potentially informative for response to SIC treatment, we performed differential expression analysis on PBMC expression profiles on pre- and post-treatment samples from patients with pCR (n = 6) and non-pCR (n = 5) tumors. The PBMC transcriptome characteristics significantly differed between treatment outcomes and across treatment time points (Figures 1B and 1C). Pathways in antigen presentation and inflammation response, such as phagosome formation, TREM1 signaling, nuclear factor κB (NF-κB) signaling, and the Toll-like receptor pathway, were significantly enriched pathways of upregulated genes in patients with pCR at baseline. However, there was a shift to the T cell activation signaling pathway (regulating IL-2 expression in activated and sensitized T cells) after SIC, suggesting that SIC induced a sustained effect on promoting the systemic immune responses in patients with pCR (Figure 1D). Also, between pre- and post-treatment patients, this difference was most significant in TREM1 signaling (Figure S1C). Moreover, we observed that the expression of TREM1, mainly expressed on the surface of myeloid cells, was elevated in PBMCs of treated vs. baseline tumors (Figures S1A and S1E). TREM1 pathway was reported to be associated with macrophage polarization and pro-inflammatory function.26 Collectively, these data indicate that TREM1 pathway activity in peripheral blood monocytes may be associated with complete response to SIC in patients with LARC.
Radiotherapy reshapes the composition of myeloid cell populations in blood and tumors
To investigate the cellular and molecular contexture of the tumor immune microenvironment (TIME) following SIC treatment, we characterized CD45+ immune cells isolated from 3 pairs of tumor tissue specimens before and after SIC by high-throughput single-cell RNA sequencing (scRNA-seq) (Figure 1A; Table S1). After quality-control filtering, we obtained the single-cell transcriptome data for 49,304 immune cells that included monocytes (Mo), tumor-associated macrophages (TAMs), dendritic cells (DCs), neutrophils, B cells, plasma, CD8+ T cells, CD4+ T cells, regulatory T cells (Tregs), T helper cells 17 (Th17), MKI67+ T cells, S100A8+ T cells, and mast cells (Figures S1F and S1G). We then characterized the dynamic changes in these cell subtypes. The proportion of CD4+ T cells, Tregs, macrophages, and neutrophils were markedly decreased, while CD8+ T cell subsets and monocyte subsets were increased post SIC (Figures S1H and S2A). We next conducted differential abundance analysis using Milo, a statistical framework that performs difference-in-presence tests by assigning cells to partially overlapping neighborhoods on a k-NN graph (Figure S2B). Compared to pre-treatment, the proportions of monocytes, plasma, and CD8+ T cells were increased, while the proportions of B cell, macrophage, neutrophil, Th17, and Treg subsets were decreased in patients post SIC (Figure S2C). Thus, SIC significantly changes the TIME in ways that alter tumor-infiltrating immune cells including monocytes, macrophages, DCs, neutrophils, and CD8+ T cells.
We next focused on the mono-macrophage compartments and sought to define specific features enabling their distinction from infiltrating CCR2+ peripheral blood-derived Mo, TREM1high inflammatory Mo, or TAMs in different polarization states. We used prior published work in human colorectal tumors as a reference to annotate cells and interpret changes in mono-macrophage abundance and gene expression.20,27,28 Seven mono-macrophage subsets were identified, which we named C0_CCR2+TREM1high Mo, C1_CCR2+TREM1low Mo, C2_CCR2−TREM1high Mo-like, C3_SPP1+ TAM, C4_C1QC+CD163low TAM, C5_C1QC+CD163high TAM, and C6_MKI67+ TAM (Figure S2D). C0_CCR2+TREM1high Mo exhibits cluster-specific expression of S100A8, S100A9, FCN1, and VCAN, indicative of a classical monocyte signature (Figure S2E). Notably, the immunosuppressive gene SPP1 was highly expressed in C2_CCR2−TREM1high Mo-like and C3_SPP1+ TAM clusters, suggesting a suppressive phenotype (Figure S2E). We found that the frequency of C0_CCR2+TREM1high Mo increased after SIC treatment, whereas the frequency of total TAMs decreased (Figures 2A and S2F). Among the mono-macrophage subsets, increased proportions of C0_CCR2+TREM1high Mo, C4_C1QC+CD163low TAM, C2_CCR2−TREM1high Mo-like, and C3_SPP1+ TAM cells and decreased proportions of C5_C1QC+CD163high TAM and C6_MKI67+ TAM subsets were observed in patients following SIC treatment as analyzed by Milo (Figures S2G and S2H). In line with our human data, ionizing radiation (IR) alters intra-tumoral mono-macrophage infiltration in a mouse colon model, specifically by increasing the proportion of CCR2+TREM1+ Mo and decreasing the proportion of TAM (CD45+CD11b+F4/80+) (Figure 2B). Interestingly, the percentage of TREM1+ mono-macrophages was increased in peripheral blood and unchanged in tumor tissues at 1 day post IR compared to controls. However, the aforementioned changes were reversed in peripheral blood versus tumor tissue 6 days after IR treatment (Figure 2B). These findings indicated that IR-induced intra-tumoral TREM1+ mono-macrophage aggregation originates mainly from the recruitment of peripheral blood-derived monocytes. We further investigated the role of TREM1 in IR-induced monocyte migration. Consistently, IR did not increase the expression of TREM1 on the surface of mono-macrophages (Figure 2C), but enhanced the migratory capacity toward the irradiated tumor cell-conditioned medium as evidenced by a migration assay. In the context of IR, the introduction of a TREM1 blocker LP17, which inhibited ligand-induced TREM1 signaling,29 significantly reduced the number of monocytes migrating (Figure 2D). Additionally, we used multiplex immunofluorescence for 19 pairs of human rectal tumor tissues from before and after radiotherapy to confirm our findings and noted that the infiltration of these mono-macrophage subsets, indicated by the co-expression of CCR2 and TREM1, was higher post radiotherapy in ten pCR tumors compared with matched pre-treatment tissues. However, we did not observe an increasing trend of CCR2+TREM1+ cells after treatment in the nine patients with non-pCR (Figure S2I). Together, our findings reveal that tumor-local IR remodeled the landscape of myeloid cell populations, possibly by inducing intra-tumoral infiltration of blood-derived TREM1+ mono-macrophages.
Figure 2.

TREM1+ mono-macrophages accumulate in tumors with SIC treatment
(A) Uniform manifold approximation and projection (UMAP) showing classification of mono-macrophage clusters in each condition (T1 vs. T3). Boxplots showing the alterations of cell clusters between T1 and T3.
(B) The percentage of each immune cell, including monocytes (CD11b+Ly6Chigh/CD45+), macrophages (CD11b+F4/80+/CD45+), TREM1+ monocytes (TREM1+/CD11b+Ly6Chigh), and CCR2+TREM1+ macrophages (CCR2+TREM1+/CD11b+F4/80+), was detected by flow cytometry in peripheral blood and tumor tissues at 1 and 6 days after ionizing radiation (IR) (5 Gy × 2 F). Each dot represents one mouse. Error bars depict means ± SEM. ∗p < 0.05; ∗∗p < 0.01; ∗∗∗p < 0.001; ∗∗∗∗p < 0.0001; ns, not significant, as determined by unpaired two-tailed Student’s t test.
(C) The expression of TREM1 in human mono-macrophages treated with different HCT116 cell supernatants (with or without IR treatment), n = 3 biological repeats. Error bars depict means ± SEM. ∗∗∗∗p < 0.0001, as determined by one-way ANOVA with Tukey’s correction.
(D) Migration of monocytes (with or without TREM1 blocking) toward conditioned medium from MC38 cells with or without IR was evaluated using in vitro transwell migration assay in triplicate (one-way ANOVA with Tukey’s correction), n = 3 biological repeats. Scale bar, 50 μm. Error bars depict means ± SEM. ∗p < 0.05; ∗∗p < 0.01; ∗∗∗p < 0.001; ∗∗∗∗p < 0.0001; ns, not significant.
TREM1 affects mono-macrophage differentiation in the context of IR
We next performed pseudotime trajectory analysis on the identified mono-macrophage cells, aiming to further explore the dynamic differentiation trajectory of TREM1+ mono-macrophages. Notably, the C0_CCR2+TREM1high population mainly evolves into the C1_CCR2+TREM1low Mo cluster, followed by branching into two separate paths: (1) C4_C1QC+CD163low TAM and (2) C5_C1QC+CD163high TAM (Figure 3A). We observed continuous differentiation along mono-macrophage states, with the relatively initial pseudotime value observed for C0_CCR2+TREM1high Mo and C2_CCR2−TREM1high Mo-like cells; this pattern was replicated by other algorithms, including monocle3, Slingshot, and CytoTRACE2. We ranked mono-macrophages according to their pseudotime, finding that C0_CCR2+TREM1high Mo and C2_CCR2−TREM1high Mo-like cells potentially remained at the initial stage, while C3_SPP1+ TAM, C4_C1QC+CD163low TAM, C5_C1QC+CD163high TAM, and C6_MKI67+ TAM remained at the terminus (Figure S3A). Notably, C2_CCR2−TREM1high Mo-like cells showed high similarity to C3_SPP1+ TAM (Figure S2E), indicating that C3_SPP1+ TAMs arise from infiltration of C2_CCR2−TREM1high Mo-like cells. We confirmed our scRNA-seq results showing that IR-induced differentiated macrophages expressed higher levels of C1QA, C1QB, and C1QC as compared with the control group; blocking TREM1 signaling abolished the transcriptional changes induced by IR (Figure S3B). Multiplex immunofluorescence also confirmed that C1QC+ TAM was significantly increased post SIC compared with matched baseline levels (p = 0.0067) in tumor tissues from patients with pCR. However, it was not significantly changed in the patients with non-pCR (Figures S3C and S3D). Collectively, our data suggested that both C1QC+ TAMs might develop from CCR2+TREM1high Mo, which may favor enhanced antitumor immunity in response to IR. Furthermore, the development of CCR2+TREM1high population was accompanied by a decrease in TREM1 gene expression upon the activation of TREM1 pathway (Figure 3B). This is consistent with the results in vitro, where PBMCs from patients with LARC were extracted and monocytes were obtained by adherent separation. Peripheral blood monocytes gradually differentiated into macrophages in the conditioned medium of irradiated HCT116 tumor cells, and the expression of TREM1 was downregulated with the differentiation and maturation of macrophages. Moreover, this phenomenon was simultaneously reversed by TREM1 blockade (Figure 3C). We further explored cell populations at the endpoint of differentiation, and significant gene expression differences existed between C1QC+CD163low TAM and C1QC+CD163high TAM (Figure 3D). Functional analysis revealed that genes related to apoptosis, tumor necrosis factor signaling pathway, T cell receptor signaling pathway, and NF-κB signaling pathway were highly enriched in C1QC+CD163low cells, whereas negative regulation of autophagy, ferroptosis, and Notch signaling pathways was enriched in C1QC+CD163high subsets (Figure 3E). Thus, we demonstrated that TREM1 pathway activation alters the mono-macrophage differentiation, and the effects are amplified by IR.
Figure 3.

Differentiation of CCR2+TREM1high mono-macrophages in the SIC-treated tumor microenvironment
(A) The trajectory distribution of each mono-macrophage population over time in all samples. The dark color above is the starting point of development, and the light color below is the development endpoint (left). Each subset was marked with a different color (right).
(B) The trajectory distribution of TREM1 expression in mono-macrophage cell population.
(C) The TREM1 expression in mono-macrophages at different time point, which were isolated from human peripheral blood mononuclear cells (PBMCs) treated with HCT116 cell supernatants with different treatment as indicated, n = 3 biological repeats. Statistical analysis was performed using one-way ANOVA with Tukey’s correction. Error bars depict means ± SEM. ∗∗∗∗p < 0.0001.
(D) Volcano plot demonstrating differentially expressed genes in C1QC+CD163high tumor-associated macrophage (TAM) and C1QC+CD163low TAM in tumor tissues after SIC treatment. Relevant genes were highlighted.
(E) Kyoto Encyclopedia of Genes and Genomes (KEGG) enrichment analysis of C1QC+CD163high TAM and C1QC+CD163low TAM in tumor tissues after SIC treatment.
To define the identity of CCR2+TREM1+ Mo that accumulate in tumors upon IR, their phenotype was also investigated. In in vitro efferocytosis assay, mono-macrophages educated from irradiated MC38 cell-conditioned medium engulfed apoptotic tumor cells, and blocking TREM1 treatment substantially inhibited this uptake (Figure S4A). Furthermore, we observed that blocking TREM1 impaired the IR-induced differentiation of monocytes toward an M1-like phenotype (Figure S4B), as further confirmed by reverse-transcription PCR analysis (Figure S4C). Mechanistically, the transcriptomic profiles of CCR2+ TREM1high Mo on pre- and post-treatment samples were analyzed (Figure S4D). Using scRNA-seq data, we first examined the expression of genes previously linked to antigen presentation, phagocytosis function, and chemokine signaling pathway. All of these immunoactivation signatures showed higher expression in CCR2+ TREM1high Mo post SIC compared with baseline (Figure S4E). We identified 238 transcripts differentially expressed (FDR < 0.05) after SIC treatment, with induced pathways including antigen processing and presentation, NF-κB pathway, Toll-like receptor signaling, and T cell activation signaling pathways (Figures S4F and S4G). Overall, these results suggest that IR not only induces intra-tumoral peripheral blood-derived TREM1+ mono-macrophage infiltration but also remodels its phenotype toward an antitumor phenotype, and this phenomenon may be related to the activation of inflammatory pathways.
Lack of TREM1 impacts tumor myeloid and lymphoid landscape
In light of the aforementioned findings, we speculated that TREM1 blockade would affect the response to IR. To test this, we constructed two murine colorectal cancer models, MC38 tumor-bearing C57BL/6J mice and CT26 tumor-bearing BALB/c mice (Figure 4A). In the murine colon carcinoma (MC38) model, blocking TREM1 signaling alone did not affect primary tumor proliferation, but IR significantly inhibited tumor growth. However, the combination of the two accelerated tumor progression to some extent (Figures 4B–4D). Taken together, blocking TREM1 signaling weakens the efficacy of IR, thereby accelerating tumor progression. The exertion of the effect after blocking TREM1 requires the involvement of IR.
Figure 4.

TREM1 blockade attenuates the response to IR by altering MC38 tumor immune infiltrates
(A) A schematic summary of the treatment regimen for MC38 tumor-bearing C57BL/6J mice or CT26 tumor-bearing BALB/c mice. When the tumor size reached 100–150 mm3, tumor-bearing mice were treated with local IR (5 Gy × 2 F) and/or TREM1 blockade (n = 6–8 per group). Tumor growth was monitored.
(B and C) Representative images (B) and tumor weights (C) in mice treated as described above.
(D) Tumor growth of MC38 tumor-bearing C57BL/6J mice treated with the indicated treatments.
(E) Percentages of tumor-infiltrating M2-like macrophages (CD206+CD86−/CD11b+F4/80+, left) and M1-like macrophages (CD86+CD206−/CD11b+F4/80+, right) in mice, with different treatment as indicated, were assessed by flow cytometry (n = 5 per group).
(F) Percentages of CD8+ T cells (CD8+/CD3+ T cells) in MC38 tumor-bearing mice with treatments as indicated 6 days after IR (n = 5 per group).
(G) Percentages of tumor-infiltrating IFN-γ+CD8+ T cells (IFN-γ+/CD8+ T cells) in tumor tissues (n = 5 per group). Statistical analysis was performed using one-way ANOVA with Tukey’s correction (C, D, E, F, and G). Error bars depict means ± SEM. ∗p < 0.05; ∗∗p < 0.01; ∗∗∗p < 0.001; ∗∗∗∗p < 0.0001; ns, not significant.
To understand the mechanism behind the combination treatment attenuating the efficacy of IR, we performed an immunophenotypic analysis of TIME in tumors post IR. IR alone reduced TAM infiltration in the TIME and was unaffected by the addition of TREM1 blocking peptide (Figure S5A). However, we observed that IR induced macrophage polarization toward a pro-inflammatory M1-like phenotype (CD11b+F4/80+CD86+CD206−), but combined with TREM1 blockade inhibited this effect (Figures 4E and S5B). For inflammatory monocytes (CD45+CD11b+Ly6Chigh) and DCs (CD45+CD11c+IA/IE+), their percentage of total immune cells, either by IR or TREM1 blockade or both in combination, did not differ from controls (Figure S5A).
Given that CD8+ T cells play a crucial role in antitumor immunity, we also examined the effects of blocking TREM1 on CD8+ T cell infiltration and activation. We observed that in TREM1 blockade-treated MC38 tumors, the presence or absence of IR did not increase CD8+ T cell infiltration, whereas IR alone did (Figures 4F and S5C). Tumor immunofluorescence also further confirmed that blocking TREM1 can reduce CD8+ T cell infiltration in TIME (Figures S5E and S5F). Moreover, IR induced CD8+ T cells to produce more IFN-γ, but this was counteracted by combination therapy (Figures 4G and S5D). Similarly, TREM1 blockade also disrupted the antitumor effects of IR in CT26 tumor-bearing BALB/c mice (Figures S5G–S5P). Taken together, these modifications of TREM1+ Mo-derived clusters resulted in reprogramming of the host immune microenvironment locally and systemically in favor of enhanced antitumor immunity in response to IR.
TREM1+ mono-macrophages interact with T cells in rectal cancer
Considering that SIC treatment induced alterations in the number and phenotype of TREM1+ mono-macrophages, we next investigated whether such reprogramming can drive changes in cell-cell crosstalk. CellChat was used to infer cell-cell communication in our scRNA-seq data. We detected the strongest incoming interactions among CD8+ T cells and moderate-intensity outgoing interactions coming from CCR2+TREM1high Mo (Figures 5A and S6A). After SIC treatment, the interaction of CCR2+TREM1high clusters and their differentiated endpoint cells, especially C1QC+CD163low TAM, with CD8+ T cells and NKT cells were enhanced in TIME. Conversely, the interaction of SPP1+ TAM with CD8+ T cells and NKT cells were attenuated after treatment (Figure 5A). Further, we observed that the interactions between cytokines CXCL9/CXCL10/CXCL11 and their receptor CXCR3 were stronger post treatment (Figure S6B). The expression of CXCL9/CXCL10/CXCL11 was dramatically elevated in the CCR2+TREM1high Mo of post-SIC vs. untreated tumors (Figure S6C). Taken together, the CCR2+TREM1high Mo might interact with CD8+ T cells through the CXCL9/CXCL10/CXCL11-CXCR3 axis.
Figure 5.

Mono-macrophages interact with T cells in rectal cancer
(A) Heatmap of Spearman correlation R values generated from the all identified T lymphocyte and mono-macrophage subsets in each condition (T1 and T3). The number of ligand-receptor interactions between different subsets derived from CellChat was recorded in 3 patients separately. Spearman correlation R values were constructed by comparing the ligand-receptor interaction counts of T and mono-macrophage cells in merged data (n = 3 patients). Spearman correlation R values are represented by color and circle size.
(B and C) In the presence or absence of TREM1 blocking, macrophages treated with conditioned medium from MC38 cells with or without IR were co-cultured with CD8+ T cells under different conditions as indicated. CD8+ T cell proliferation was measured by CFSE dilution (B), and the secretion of the cytokines IFN-γ by CD8+ T cells was assessed by flow cytometry (C) (n = 3 biological repeats).
(D) Quantitative reverse-transcription PCR of the BMDMs in different treatment groups (n = 3 biological repeats). Statistical analysis was performed using one-way ANOVA with Tukey’s correction (B, C, and D). Error bars depict means ± SEM. ∗p < 0.05; ∗∗p < 0.01; ∗∗∗p < 0.001; ∗∗∗∗p < 0.0001; ns, not significant.
To investigate the regulation of TREM1+ mono-macrophages on CD8+ T cells, we designed a co-culture experiment of macrophages and CD8+ T cells. We isolated bone-marrow-derived macrophages (BMDMs) from C57BL/6J wild-type mice and co-cultured them with activated CD8+ T cells in vitro (Figure S6D). CD8+ T cells co-cultured with radiation-induced BMDMs showed higher proliferative capacity (CFSE) and activation marker IFN-γ levels compared to controls. In particular, the increase in proliferative capacity and activation of CD8+ T cells was repressed by the addition of TREM1 blocker compared to the IR group (Figures 5B and 5C). Furthermore, in the absence of TREM1 signaling, expression levels of several T cell chemokine genes, including Ccl4, Ccl5, Ccl9, Cxcl9, and Cxcl10, were reduced in mono-macrophages (Figure 5D). Collectively, TREM1 appears to activate a gene expression program in TAMs, promoting antigen acquisition and presentation as well as immune cross-talk with T cells.
Pharmacological inhibition of TREM1 attenuates responses to radiotherapy and immunotherapy
Based on these clinical observations, we reasoned that TREM1+ mono-macrophages might promote immune activation and that TREM1 blockade could weaken the synergistic effect of IR and immunotherapy. To further explore this, MC38 tumor-bearing C57BL/6J mice and CT26 tumor-bearing BALB/c mice were treated with TREM1 blockade, IR, anti-PD-1 antibody (αPD1), or a combination of two or all three (Figure 6A). As expected, compared to any single treatment, IR combined with αPD1 significantly controlled tumor growth and prolonged survival in mice. Although antibody blockade of TREM1 alone had no durable effect on tumor burden or survival, it abolished the protection afforded by anti-PD-1 blockade or IR (Figures 6B–6E). Furthermore, blockade of TREM1 shifts macrophages toward M1 polarization to M2 polarization by IR combined with αPD1 (Figure 6F). For adaptive immunity, IR combined with αPD1 demonstrated the strongest intra-tumoral CD8+ T cell infiltration, which was also significantly attenuated by combined TREM1 blockade. And IFN-γ+CD8+ T cells showed the same trend (Figure 6G). The aforementioned findings were also observed in CT26 tumors (Figures S6E–S6I). These results suggest that blocking TREM1 signaling attenuated the synergistic antitumor effects of IR combined with immunotherapy, mainly by preventing macrophage “M1-like” phenotypic remodeling and CD8+ T cell infiltration and activation.
Figure 6.

TREM1 blockade attenuates responses to IR and immunotherapy in MC38 tumor tissues
(A) A schematic summary of the treatment regimen for MC38 tumor-bearing C57BL/6J mice or CT26 tumor-bearing BALB/c mice. When the tumor size reached 100–150 mm3, tumors were treated with local IR (5 Gy × 2 F), anti-PD1 antibody (2 doses per week, three doses total), and/or TREM1 blockade, as indicated. Tumor growth and survival was monitored. Mice with tumor volumes less than 1,500 mm3 were considered to be surviving.
(B) Survival curves of MC38 tumor-bearing C57BL/6J mice treated with the indicated treatments (n = 6–8 per group).
(C and D) Representative images (C) and tumor weights (D) in mice treated as described above (n = 4 per group).
(E) Tumor growth of MC38 tumor-bearing C57BL/6J mice treated with the indicated treatments (n = 6–8 per group).
(F) The percentages of M1-like macrophages (CD86+CD206−/CD11b+F4/80+) and M2-like macrophages (CD206+CD86−/CD11b+F4/80+) in tumor tissue, as assessed by flow cytometry (n = 4 per group).
(G) The percentages of CD8+ T cells (CD8+/CD3+ T cells) and IFN-γ+CD8+ T cells (IFN-γ+/CD8+ T cells) in tumor tissue (n = 4 per group). Flow cytometry analysis was done 2 days after the last anti-PD1 antibody. Error bars depict means ± SEM. Statistical analysis was performed using two-sided log-rank test (B) and one-way ANOVA with Tukey’s correction (D, E, F, and G). ∗p < 0.05; ∗∗p < 0.01; ∗∗∗p < 0.001; ∗∗∗∗p < 0.0001; ns, not significant.
Dynamic changes in blood TREM1+ monocyte content predict the response to SIC
Finally, we wanted to determine the relevance of peripheral blood TREM1+ monocyte response in patients with LARC treated with SIC. Peripheral blood was collected at the following time points: baseline (T1), 0 to 7 days after radiotherapy (T2), and 7 to 14 days before surgery (T3). Baseline blood samples were collected for 40 patients, while 9 patients failed to fulfill the subsequent two time points of sample collection, leaving 31 patients who completed the whole course of the study. Postoperative pathological examination showed that 10 (32.3%) patients had pCR (Tables S2 and S3). For major clinical features except for magnetic resonance tumor regression grade (mrTRG), their distribution in the pCR and non-pCR groups was not significantly different. The TREM1 expression in monocytes at T3 time point but not the T1 time point was significantly higher in the pCR group than in the non-pCR group (Figures 7A and 7B). Patients with elevated TREM1+ monocytes had significantly higher pCR rates than those with decreased TREM1+ monocytes (60.0% vs. 6.3%, p = 0.002) (Figure 7C). Of note, of the 15 patients with increased peripheral blood TREM1+ monocytes, 6 patients showed radiographic disease residuals by using the clinical complete response (cCR) standard in our previous study30 and were classified in the pCR group (Tables S2 and S3). As expected, there was an obviously increasing trend in TREM1 expression as treatment progressed for patients with pCR (p = 0.0041); however, patients with non-pCR showed a declining trend (Figures 7D–7F). We further evaluated the prognostic value of dynamic changes in TREM1+ monocyte content by receiver operating characteristic (ROC) curves (Figure 7G). The model incorporating both TREM1+ monocytes and mrTRG (i.e., combining model) had higher pCR/non-pCR prediction performance (area under the curve [AUC]: 0.957, 95% confidence interval [CI]: 0.879 to 1) than the mrTRG only model (AUC: 0.802, 95% CI: 0.657 to 0.948) or the TREM1+ monocyte only model (AUC: 0.881, 95% CI: 0.716 to 1), implying concordance between dynamic TREM1+ monocytes and pathological response (Figure 7G). Multivariate Cox regression analysis also showed that elevated TREM1+ monocyte percentage after treatment (T3-T1) was significantly associated with higher probability of pCR (Figure 7H). Representative cases in which cCR was not achieved by magnetic resonance imaging (MRI) evaluation, but TREM1 expression in monocytes was elevated after SIC treatment, and pCR was pathologically confirmed, are shown in Figure 7I. Furthermore, bulk RNA sequencing from LARC tumor tissues after radiation therapy in The Cancer Genome Atlas (TCGA) database revealed that high levels of TREM1 on human CCR2+ macrophages are associated with better outcome (Figure 7J). Overall, these results indicate that a therapy-elicited systemic TREM1+ monocyte response can positively correlate with disease outcome in patients with LARC treated with SIC.
Figure 7.

TREM1+ mono-macrophages predict response to SIC
(A and B) Boxplots showing the percentage of TREM1+ monocytes (TREM1+/CD14+) between the pCR group and the non-pCR group at baseline (A, n = 40 patients) and after treatment (B, n = 31 patients).
(C) Tumor response to SIC was compared in patients with LARC with decreased and increased percentage of TREM1+ monocytes post treatment. p value was calculated by chi-squared test.
(D and E) Dynamics of TREM1+ monocyte fraction in 31 patients with both baseline and post-SIC samples (pCR, n = 10; non-pCR, n = 21).
(F) Boxplots showing the dynamics of TREM1+ monocyte content between the pCR group and the non-pCR group.
(G) ROC curve demonstrated the treatment response predictive accuracy of dynamic changes of TREM1+ monocytes.
(H) Forest plot of multivariate Cox regression analysis of clinical factors and ΔTREM1+ monocytes for pCR.
(I) The post-SIC rectal MRI view (left), post-SIC surgical pathology H&E image (middle), and the dynamic changes of TREM1+ monocytes (right) of the two patients with LARC. Scale bar, 100 μm.
(J) Kaplan-Meier curves for overall survival according to the relative status of CCR2+TREM1high mono-macrophages in tumor tissues after radiation therapy in TCGA database (n = 714 patients). Statistical analysis was performed using unpaired two-tailed Student’s t test (A, B, D, E, and F), Chi-squared test (C), and two-sided log-rank test (J). Error bars depict means ± SEM. ∗p < 0.05; ∗∗p < 0.01; ∗∗∗p < 0.001; ∗∗∗∗p < 0.0001; ns, not significant.
Discussion
SCRT combined with neoadjuvant immunotherapy has emerged as a promising neoadjuvant strategy for LARC. Predicting which patients will benefit from preoperative therapy is the most important clinical objective to improve patient outcomes and to provide organ-preserving options for LARC. However, there is an unmet clinical need for developing mechanism/biomarker-based precision neoadjuvant therapy. Here, we conducted scRNA-seq on tumors from patients with LARC undergoing SIC treatment to uncover key immune cell features correlated with responsiveness. We identified peripheral pro-inflammatory TREM1+ mono-macrophages as an effective predictive biomarker for SIC therapy in LARC. Pharmacologic blockade of TREM1 weakens local radiotherapy and combined radio-immunotherapy effects by inhibiting mono-macrophage migration and antigen presentation functions and reshaping the mono-macrophage compartment.
Myeloid cells in the TIME can exist in immunosuppressive and immunostimulatory states that impede or promote antitumor immunity, respectively. Blocking suppressive myeloid cells or increasing stimulatory cells to enhance antitumor immune responses is an area of interest for therapeutic intervention.31 TREM1 is a pro-inflammatory receptor belonging to the immunoglobulin variable domain receptor superfamily, which is expressed primarily on neutrophils, monocyte subsets and tissue macrophages, and suppressive myeloid populations in the TIME. High expression of TREM1 in tumors predicts progression and poor prognosis. Furthermore, TREM1 can promote tumor growth in models of chronic inflammation-induced cancer.32,33 However, the pro-inflammatory function of TREM1 and its presence on tumor-associated myeloid cell populations make TREM1 an attractive target for activating myeloid cells in TIME, and a study had shown that stimulating TREM1 signaling by agonistic antibody can activate myeloid cells to stimulate antitumor immunity.34 The results presented here also suggest that hypofractionated radiotherapy promotes peripheral blood-derived TREM1+ mono-macrophage accumulation in tumors, polarizes them to an M1-like inflammatory phenotype, and thereby enhances the effect of immunotherapy and accelerates tumor control in mouse models. More importantly, we found that blocking TREM1 alone did not affect tumor control, but impaired the efficacy of radiotherapy. These findings indicate that TREM1+ mono-macrophages may be a group of relatively immature cell subsets and differentiate into mature macrophages upon radiotherapy to exert antitumor function.
We favor that the increase of TREM1+ mono-macrophages in tumors is mainly due to peripheral blood migration rather than remodeling of resident mono-macrophages in tumor tissues for three reasons: (1) we found CCR2 expression in TREM1+ mono-macrophages, (2) IR did not increase the expression of TREM1 on the surface of mono-macrophages, but enhanced the migratory ability of TREM1+ mono-macrophages, and (3) we observed the dynamic changes of TREM1+ mono-macrophage migration from peripheral blood to tumor site in mouse models. In addition, the peripheral blood-derived TREM1+ mono-macrophage cells could subsequently give rise to C1QC+ TAM populations upon TREM1 pathway activation in the context of IR. The expression of genes related to antigen presentation for C1QC+ TAMs was even higher compared with CCR2+TREM1high subsets, implicating their important roles in antigen presentation and a beneficial population in the clinical application. Further studies are needed to identify the mechanisms by which TREM1+ mono-macrophages regulate TAM development, a key event for the development of efficient antitumor immune responses. In addition, we also observed an increased infiltration of SPP1+ macrophage subpopulations after SIC treatment in patients with non-pCR. Consistent with the previous findings,35,36 the SPP1+ TAMs exhibit an immunosuppressive phenotype and possibly develop from tumor-resident mono-macrophages, which may contribute to the poor response to SIC treatment in these patients. Thus, exploring the mechanism of their origin is particularly important for improving patient outcomes in the future.
For patients with LARC with cCR, a “Watch and Wait” (W&W) approach can be adopted to improve the quality of life. However, the W&W approach may increase the recurrence risk in patients who are judged to be cCR but did not reach pCR. For patients with LARC who receive SIC therapy, there are no reliable indicators to accurately predict pCR before surgery. MRI is a major tool to evaluate response to SIC; however, its ability to predict pCR needs to be improved. Therefore, it is very important to develop more non-invasive detection indicators to further improve the efficiency of pCR prediction. In this prospective cohort study, we explored the value of peripheral TREM1+ mono-macrophages alone or combined with MRI in the prediction of pCR before surgery. The model incorporating both TREM1+ mono-macrophages and MRI (i.e., combining model) had higher pCR/non-pCR prediction performance than the MRI only model. A large number of samples are urgently needed to verify the predictive power of the model in the future.
Overall, our study demonstrates that peripheral blood-derived TREM1+ mono-macrophages exhibit remarkable plasticity and can acquire an antitumor phenotype in response to radiotherapy, which could support the induction of an enhanced adaptive immune response.
Limitations of the study
In this study, we first draw attention to a limitation of the small sample size of patients used to assess the dynamic changes in the immune microenvironment during treatment, which may introduce potential confounding statistic biases. In exploring the clinical potential of TREM1 in mono-macrophages, we used small-molecule peptide inhibitors to block TREM1 in the mouse model, but nonspecific inhibition in other cells may impact the results. Moreover, fully elucidating the specific molecular mechanism for complex mono-macrophage developmental trajectories occurring within tumors during IR requires additional in vitro cell differentiation and in vivo lineage tracing studies.
Resource availability
Lead contact
Further information and inquiries regarding resources and reagents should be directed to the lead contact, Dr. Tao Zhang (taozhangxh@hust.edu.cn), who will fulfill these requests.
Materials availability
This study did not generate new unique reagents.
Data and code availability
-
•
The sequencing data (including scRNA-seq and bulk RNA-seq) reported in this paper are deposited in NCBI Gene Expression Omnibus database with accession number GEO: GSE278406 and GEO: GSE278405 (URL: https://www.ncbi.nlm.nih.gov/geo/). Accession numbers are listed in the key resources table as well.
-
•
This paper does not report the original code.
-
•
Any additional information required to reanalyze the data reported in this paper is available from the lead contact upon request.
Acknowledgments
We thank Dr. Feng Li and Dr. Xiaochuan Wang for conceptualization and design of the work. This work was supported by the National Natural Science Foundation of China (nos. 82373050 and 82203808), National Key Technology Research and Development Program of Hubei Province (no. SHFZ202400031), and CSCO Research Foundation (Y-2022HER2AZZD-0374).
Author contributions
Conceptualization, H.W., Z.L., and T.Z.; methodology, M.Z., M.L., C. Han, and L.L.; investigation, C. Huang, L.Z., D.Y., K.T., and J.R.; writing – original draft, H.W., M.Z., M.L., and C. Han; writing – review and editing, J.R., Z.L., and T.Z.; funding acquisition, H.W., Z.L., and T.Z.; resources, C. Huang, L.Z., D.Y., and K.T.; supervision, H.W., Z.L., and T.Z.
Declaration of interests
The authors declare no competing interests.
STAR★Methods
Key resources table
| REAGENT or RESOURCE | SOURCE | IDENTIFIER |
|---|---|---|
| Antibodies | ||
| TruStain FcX anti-mouse CD16/32 (clone 93) | Biolegend | Cat# 101319; RRID:AB_1574973 |
| Human TruStain FcX | Biolegend | Cat# 422302; RRID:AB_2818986 |
| Anti-mouse CD45 (clone 30-F11) | Biolegend | Cat# 103126; RRID:AB_493535 |
| Anti-mouse CD11c (clone N418) | Biolegend | Cat# 117334; RRID:AB_2562415 |
| Anti-mouse F4/80 (clone W20065B) | Biolegend | Cat# 111604; RRID:AB_3082990 |
| Anti-mouse Ly6C (clone HK1.4) | Biolegend | Cat# 128014; RRID:AB_1732079 |
| Anti-mouse I-A/I-E (clone M5/114.15.2) | Biolegend | Cat# 107608; RRID:AB_313323 |
| Anti-mouse CD192 (CCR2) (clone SA203G11) | Biolegend | Cat# 150615; RRID:AB_2721549 |
| Anti-mouse Ly6G (clone 1A8) | Biolegend | Cat# 127643; RRID:AB_2565971 |
| Anti-mouse CD3 (clone 17A2) | Biolegend | Cat# 100236; RRID:AB_2561456 |
| Anti-mouse NK1.1 (clone PK136) | Biolegend | Cat# 108707; RRID:AB_313394 |
| Anti-mouse CD4 (clone RM4-5) | BD Biosciences | Cat# 553051; RRID:AB_398528 |
| Anti-mouse CD8a (clone 53–6.7) | Biolegend | Cat# 100730; RRID:AB_493703 |
| Anti-mouse CD86 (clone GL-1) | Biolegend | Cat# 105032; RRID:AB_2650895 |
| Anti-mouse CD206 (MMR) (clone C068C2) | Biolegend | Cat# 141708; RRID:AB_10900231 |
| Anti-mouse CD354 (TREM1) (clone 174031) | BD Pharmingen | Cat# 747905; RRID:AB_2872367 |
| Anti-mouse IFN-γ (clone XMG1.2) | Biolegend | Cat# 505830; RRID:AB_2563105 |
| Anti-mouse/human CD11b (clone M1/70) | Biolegend | Cat# 101206; RRID:AB_312789 |
| Anti-human CD45 (clone HI30) | Biolegend | Cat# 982316; RRID:AB_2876779 |
| Anti-human CD354 (TREM1) (clone TREM-26) | Biolegend | Cat# 314909; RRID:AB_10644181 |
| Anti-human CD86 (clone IT2.2) | Biolegend | Cat# 305430; RRID:AB_2563824 |
| Anti-human CD206 (MMR) (clone 15-2) | Biolegend | Cat# 321124; RRID:AB_10933248 |
| Anti-human CD68 (clone Y1/82A) | Biolegend | Cat# 333808; RRID:AB_1089056 |
| Anti-human CD14 (clone 63D3) | Biolegend | Cat# 367124; RRID:AB_2716229 |
| Purified anti-mouse CD3ε Antibody (clone 145-2C11) | Biolegend | Cat# 100301; RRID:AB_312666 |
| Purified anti-mouse CD28 Antibody (clone 37.51) | Biolegend | Cat# 102101; RRID:AB_312866 |
| Rabbit CD8 Monoclonal antibody | Abcam | Cat# ab217344; RRID:AB_2890649 |
| Mouse C1qC Monoclonal antibody | Proteintech | Cat# 66268-1-Ig; RRID:AB_2881653 |
| Rabbit CD68 Polyclonal antibody | Proteintech | Cat# 25747-1-AP; RRID:AB_2721140 |
| Rabbit SPP1 Monoclonal antibody | Abcam | Cat# ab214050; RRID:AB_2894860 |
| Rabbit CCR2a-specific Polyclonal antibody | Proteintech | Cat# 16153-1-AP; RRID:AB_2262945 |
| Rabbit TREM-1/CD354 Polyclonal antibody | Proteintech | Cat# 11791-1-AP; RRID:AB_2208556 |
| Biological samples | ||
| Human LARC tissues | Cancer Center, Union Hospital, Tongji Medical College, Huazhong University of Science and Technology | N/A |
| Human blood samples | Cancer Center, Union Hospital, Tongji Medical College, Huazhong University of Science and Technology | N/A |
| Chemicals, peptides, and recombinant proteins | ||
| Fetal Bovine Serum (FBS) | Solarbio | Cat# S9030 |
| DMEM medium | Gibco | Cat# 11965092 |
| RPMI1640 medium | Gibco | Cat# 11875119 |
| Penicillin-streptomycin | Solarbio | Cat# P1400 |
| LQVTDSGLYRCVIYHPP (LP17) | MedChemExpress | Cat# HY-P3400 |
| TRIzol | Invitrogen | Cat# 15596018CN |
| HEPES Buffer | Gibco | Cat# 15630106 |
| β-mercaptoethanol | Genom Bio | Cat# GNM21985-1 |
| Hyaluronidase | G-CLONE | Cat# 37326-33-3 |
| DNase I | G-CLONE | Cat# 9003-98-9 |
| Collagenase V | G-CLONE | Cat# 9001-12-1 |
| Intracellular Staining Permeabilization Wash Buffer (10X) | Biolegend | Cat# 421002 |
| Interleukin (IL)-2 | MedChemExpress | Cat# HY-P70646AF |
| Ionomycin | MedChemExpress | Cat# HY-13434 |
| Monensin sodium | MedChemExpress | Cat# HY-N0150 |
| Phorbol 12-myristate 13-acetate (PMA) | MedChemExpress | Cat# HY-18739 |
| InVivo MAb anti-mouse PD-1 | BioXcell | Cat# BE0146 |
| Macrophage colony stimulating factor (M-CSF) | PeproTech | Cat# 315-02-10UG |
| HiScript III RT SuperMix for qPCR (+gDNA wiper) | Vazyme | Cat# R323-01 |
| ChamQ SYBR qPCR Master Mix | Vazyme | Cat# Q311-02 |
| Triton X-100 Surfact-Amps | Thermo Fisher Scientific | Cat# 85111 |
| Critical commercial assays | ||
| RNA 6000 Nano Kit | Agilent | Cat# 5067-1511 |
| Tumor Dissociation Kit | Miltenyi Biotec | Cat# 130-095-929; RRID:SCR_020276 |
| Dead Cell Removal Kit | Miltenyi Biotec | Cat# 130-090-101 |
| Chromium Single Cell 3′ Reagent Kit v3 | 10x Genomics | N/A |
| MojoSort Mouse CD8+ T cell Isolation Kit | Biolegend | Cat# 480007 |
| MojoSort Human CD14+ Monocytes Isolation Kit | Biolegend | Cat# 480048 |
| Zombie NIR Fixable Viability Kit | Biolegend | Cat# 423105 |
| CFSE Cell Division Tracker Kit | Biolegend | Cat# 423801 |
| Deposited data | ||
| Single cell RNA-seq data of tumor tissues in LARC patients | This paper | GEO: GSE278406 |
| RNA-seq data of PBMCs in LARC patients | This paper | GEO: GSE278405 |
| TCGA pan-cancer cohorts (BRCA, GBM, COAD, LIHC, READ, ESCA) | https://portal.gdc.cancer.gov/ | N/A |
| Experimental models: Cell lines | ||
| Mouse MC38 | National Infrastructure of Cell-line Resource | 1101MOU-PUMC000523 |
| Mouse CT26 | American Type Culture Collection | CRL-2638 |
| Mouse RAW264.7 | American Type Culture Collection | TIB-71 |
| Human HCT116 | National Infrastructure of Cell-line Resource | 1101HUM-PUMC000158 |
| Primary macrophage from bone marrow of C57BL/6J mice | This paper | N/A |
| Primary mono-macrophage from human blood | This paper | N/A |
| Primary lymphocyte from human blood | This paper | N/A |
| Experimental models: Organisms/strains | ||
| Mouse: C57BL/6J (Male, 6- to 7-week-old) | WUHAN MOUBAILI BIOTECHNOLOGY Co., Ltd | N/A |
| Mouse: BALB/c (Male, 6- to 7-week-old) | WUHAN MOUBAILI BIOTECHNOLOGY Co., Ltd | N/A |
| Oligonucleotides | ||
| Primers for RT-qPCR | Table S4 | N/A |
| Software and algorithms | ||
| R version 4.3.1 | R Foundation | http://www.R-project.org; RRID:SCR_023486 |
| CellRanger version 4.0.0 | 10x Genomics | https://www.10xgenomics.com/support; RRID: SCR_023672 |
| Prism version 8.0 | GraphPad | https://www.graphpad.com/; RRID:SCR_002798 |
| FlowJo version 10.8.1 | BD Biosciences | https://www.flowjo.com/; RRID:SCR_000410 |
| SOAPnuke version 1.4.0 | BGI Genomics | https://github.com/BGI-flexlab/SOAPnuke; RRID:SCR_015025 |
| HISAT version 2.1.0 | BGI Genomics | http://ccb.jhu.edu/software/hisat2/index.shtml; RRID:SCR_015530 |
| Bowtie2 version 2.2.5 | BGI Genomics | http://bowtie-bio.sourceforge.net/bowtie2/index.shtml; RRID:SCR_016368 |
| RSEM version 1.2.8 | BGI Genomics | http://deweylab.biostat.wisc.edu/rsem/; RRID:SCR_000262 |
| DESeq version 1.39.0 | Bioconductor | http://bioconductor.org/packages/release/bioc/html/DESeq.html; RRID:SCR_000154 |
| ggplot2 version 3.4.4 | CRAN | https://cran.r-project.org/web/packages/ggplot2/index.html; RRID:SCR_014601 |
| Seurat version 4.3.0 | CRAN | https://cran.r-project.org/web/packages/Seurat/index.html; RRID:SCR_007322 |
| clusterProfiler version 4.12.6 | Bioconductor | http://bioconductor.org/packages/release/bioc/html/clusterProfiler.html; RRID:SCR_016884 |
| org.Hs.e.g.,.db version 3.19.1 | Bioconductor | https://bioconductor.org/packages/org.Hs.eg.db/; RRID:SCR_024739 |
| Monocle version 2.32.0 | Github | http://cole-trapnell-lab.github.io/monocle-release/docs/; RRID:SCR_016339 |
| Monocle3 version 1.3.1 | Github | https://cole-trapnell-lab.github.io/monocle3/; RRID:SCR_018685 |
| CellChat version 1.6.1 | Github | https://github.com/sqjin/CellChat; RRID:SCR_021946 |
| Harmony version 1.2.1 | Github | https://github.com/immunogenomics/harmony; RRID: SCR_023543 |
| SingleR version 2.6.0 | Bioconductor | https://www.bioconductor.org/packages/release/bioc/html/SingleR.html; RRID:SCR_023120 |
| Slingshot version 2.12.0 | Github | https://github.com/kstreet13/slingshot; RRID:SCR_017012 |
| Cytotrace2 version 1.0.0 | Github | https://github.com/digitalcytometry/cytotrace2 |
| miloR version 2.0.0 | Github | https://github.com/MarioniLab/miloR; RRID:SCR_025630 |
| scRNAtoolVis version 0.0.7 | Github |
https://github.com/junjunlab/scRNAtoolVis; RRID:SCR_023916 |
| ggrepel version 0.9.5 | CRAN |
https://cran.r-project.org/package=ggrepel; RRID:SCR_017393 |
| Other | ||
| 2100 Bioanalyzer | Agilent | N/A |
| Dr.Tom online platform | BGI Genomics | https://biosys.bgi.com |
| NovaSeq 6000 Sequencing System | Illumina |
https://www.illumina.com/systems/sequencing-platforms/novaseq.html; RRID:SCR_016387 |
| CytoFLEX flow cytometer | Beckman Kurt Trading Co., Ltd | N/A |
| StepOnePlus real-time PCR system | Thermo Fisher Scientific | Cat# 4376600 |
Experimental model and study participant details
Patients and samples
A total of 59 LARC patients treated in the trials NCT04928807 (the study was registered at https://clinicaltrials.gov/) at Union Hospital, Tongji Medical College, Huazhong University of Science and Technology were involved.15 The patients fulfilled the following inclusion criteria: a clinical diagnosis of LARC (according to the American Joint Committee on Cancer 8th Edition criteria, histologically confirmed rectum adenocarcinoma of T3-4/N+ by magnetic resonance imaging), an age range of 18–75 years, and with an Eastern Cooperative Oncology Group performance status of 0 or 1. Patients with a history of prior antitumor treatment were ineligible. Five patients received long-course radiotherapy sequential chemotherapy (LC) and the remaining patients received short-course radiotherapy followed by immunochemotherapy (SIC). We have collected a total of 103 blood samples (32 samples were used for bulk RNA-seq and 71 samples were used for flow cytometry) and 64 rectal cancer tissues (6 tissues were used for scRNA-seq and 58 tissues were used for immunofluorescence).
The studies and amendments were approved by Union Hospital, Tongji Medical College, Huazhong University of Science and Technology, with Institutional Review Board (No. 0271-89). The study complied with all ethical guidelines and obtained written informed consent from all patients. Age, sex and other details of participants are described in Tables S1 and S2.
Cell lines
MC38 and HCT116 tumor cells were purchased from National Infrastructure of Cell-line Resource in Beijing. CT26 tumor cells were purchased from American Type Culture Collection (USA). Mouse macrophage-like RAW264.7 cells were obtained from American Type Culture Collection (USA) as well.
All cell lines were cultured in DMEM (Gibco, USA) or RPMI1640 (Gibco, USA) supplemented with 10% fetal bovine serum (FBS) and 1% penicillin/streptomycin and maintained at 37°C in a 5% CO2 humidified incubator. All cells were authenticated and tested for mycoplasma contamination.
Mice
The male C57BL/6J and BALB/c mice (6–7 weeks old) were purchased from WUHAN MOUBAILI BIOTECHNOLOGY Co., Ltd. All mice were experimented in strict accordance with the protocol approved by the Institutional Animal Care and Use Committee, Huazhong University of Science and Technology (No. 3633). The mice were housed at 22°C–25°C temperature, 60 ± 10% humidity, under the 12 h light/dark cycle and pathogen-free conditions. Standard rodent laboratory diet and water were provided. Mice were randomly allocated into experimental groups.
Method details
Bulk RNA-seq analysis
Human PBMC samples were lysed with TRIzol reagent (Invitrogen, CA, USA) and sent for transcriptome sequencing in liquid nitrogen (BGI, Shenzhen, China). Total RNA was extracted from PBMC. RNA quantification and integrity were measured by an Agilent 2100 Bioanalyzer (Agilent RNA 6000 Nano Kit). The mRNA was purified using oligo (dT) -attached magnetic beads and DNA probes to eliminate contamination from other nucleic acids. The mRNA was then fragmented and reverse transcribed into cDNA for the construction of the final library. The RNA-seq libraries were prepared for sequencing at BGI Genomics (Shenzhen, China). For RNA-seq analysis, the raw sequencing data were filtered with SOAPnuke (v1.4.0) to obtain clean data in FASTQ format and then mapped to the reference genome using HISAT (v2.1.0). The clean data were mapped to the assembled unique gene by Bowtie2 (v2.2.5), and the expression level of genes was calculated by RSEM (v1.2.8). Differential expression analysis was performed using DESeq with a Q value corrected (Q value <0.05) by Bonferroni correction. The Dr.Tom online platform of BGI was used for data analysis (https://biosys.bgi.com). Analysis was performed for differentially expressed genes (Q < 0.05 and fold change ≥1.41) by Ingenuity Pathway Analysis (IPA, Genechem, Shanghai). The volcano plot was generated using ‘ggplot2 (v3.4.4)’ package in R (Q < 0.05 and fold change ≥1.41).
Single cell RNA-seq (scRNA) analysis
All sample collection procedures were in accordance with clinical routine. Single-cell suspensions were generated using the Tumor Dissociation Kit (Miltenyi Biotec) according to the manufacturer’s protocol. A Dead Cell Removal Kit (Miltenyi Biotec) was applied to eliminate dead cells from the single-cell suspensions. CD45+ cells were sorted from processed LARC tumors. Cell viability in single-cell suspensions was >90%. The concentration of single-cell suspension was adjusted to 700–1200 cells/uL. The cell suspension was loaded into Chromium microfluidic chips to establish single-cell gel beads in emulsion (GEMs) for the directed retrieval of approximately 5000 cells and barcoded with the Chromium Controller (10x Genomics). RNA from the barcoded cells was subsequently reverse transcribed, and sequencing libraries were constructed with reagents from a Chromium Single Cell 3′ Reagent Kit v3 (10x Genomics) according to the manufacturer’s instructions. Sequencing was performed with the Illumina sequencing platform (NovaSeq) in Novogene.
Raw reads were demultiplexed and mapped to the reference genome by 10x Genomics CellRanger pipeline (https://support.10xgenomics.com/single-cell-geneexpression/software/pipelines/latest/what-is-cell-ranger) using default parameters. For each gene and each cell barcode filtered by CellRanger, unique molecule identifiers (UMIs) were counted to construct digital expression matrices. The Seurat package was used to normalise data, dimensionality reduction, clustering, differential expression. A gene with expression in more than 3 cells was considered to be expressed, and each cell was required to have at least 200 expressed genes. Low-quality cells that met at least one of the following criteria: (i) > 5000 expressed genes, (ii) < 200 expressed genes, (iii) > 10% UMIs derived from the mitochondrial genome were removed. 49,304 cells saved and were used for downstream analysis process. Raw UMI counts were normalized, and the top 2,000 most variable genes were detected by the FindVariableFeatures function. Subsequently, ScaleData function was used for data scaling, batch effect was corrected and merged object was integrated by running Harmony package (Version 1.2.1). The top 20 harmony dimensions were provided as an input for UMAP. Visualization of the first two UMAP dimensions was performed at a clustering resolution of 0.6 and a total of 21 clusters were identified via FindClusters function. Differentially expressed marker genes among each cluster were discovered by FindAllMarkers function. The log2 fold change (FC) threshold value was less than 0.5, and “min.pct” equaled 0.3. Finally, celltype annotation was performed with the reference of SingleR package as well as CellMarker database (http://xteam.xbio.top/CellMarker/).
Differential abundance analysis of clusters in different conditions (T1 vs. T3) was performed by using miloR (version 2.0.0). The clusterProfiler R package and the org.Hs.e.g.,.db R package were applied to perform Gene Ontology (GO), and Kyoto Encyclopedia of Genes and Genomes (KEGG). R package Monocle2 (version 2.32.0), Monocle3 (version 1.3.1), Slingshot (version 2.12.0) and Cytotrace2 (version 1.0.0) were used to estimate the developmental pseudotime of monocytes and macrophages. To identify potential cell-cell interactions, the R package CellChat (version 1.6.1) was used to evaluate the expression of pairs of ligands and receptors within cell populations from the Seurat object. The number of interactions among cell types was visualized as heatmap to show the aggregated cell-cell communication network and signaling. All visualizations were done using three R packages of ggplot2, scRNAtoolVis, and ggrepel.
Generation of bone marrow-derived macrophages (BMDMs)
Bone marrow cells were collected from the femur of 6–7 week-old male C57BL/6J WT mice. After filtration through a 70 μm cell strainer and red blood cell lysis, bone marrow cells were seeded at a 6-well plate and cultured in RPMI1640 or DMEM complete medium with 10% FBS and 1% penicillin/streptomycin in the presence of 20 ng/mL macrophage colony stimulating factor (M-CSF, PeproTech) at 37°C with 5% CO2 for 7 days. Mature BMDMs were cultured in tumor cell conditioned medium for 24 h and then treated with 10 μM blocking TREM1 peptide LP17 (LQVTDSGLYRCVIYHPP, MCE, China) for 24 h for subsequent functional experiments.
Preparation of conditioned medium (CM)
To prepare for CM, MC38 and HCT116 tumor cells were inoculated in 10 cm dishes with 10 mL of medium and replaced with fresh complete medium after 24 h. Tumor cells were irradiated with 8 Gy, and the supernatants were harvested after 24 h, filtered through a 0.22 μm filter (Corning Inc, USA) and stored at −80°C.
Monocytes migration assay
Monocytes (RAW264.7 cells) migration was assessed using 24-well 6.5-mm transwell with 8 μm Pore Polycarbonate Membrane Insert (Corning Inc, USA). Macrophages were seeded (2x10⁵ cells/well) in the upper chamber containing basic culture medium without FBS. The CM (containing 10% FBS) of MC38 cells were added into the lower chamber. After 24 h, cells on the surface of the upper chamber were removed with a cotton swab, and cells on the lower surface of the membrane were fixed with 4% paraformaldehyde and stained with 0.1% crystal violet solution. Five visual fields were randomly selected under the microscope and counted. For this experiment, macrophages are treated with 10 μM LP17 24 h in advance.
CD8+ T cell preparation
Spleens of C57BL/6J WT mice (male, 6–7 weeks old) were harvested and filtered through a 40 μm cell strainer to produce a single-cell suspension. After red blood cell lysis, the single-cell suspension was purified using the MojoSort Mouse CD8+ T cell Isolation Kit (BioLegend, USA) according to the manufacturer’s instructions to obtain CD8+ T cells. The purity of CD8+ T cells isolation were assayed by flow cytometry. Purified CD8+ T cells were seeded in the anti-CD3-coated (5 μg/mL, BioLegend, clone 145-2C11) 24 well-plate in complete RPMI1640 medium (10% FBS, 1% Pencillin/Streptomycin, 1 mM Sodium Pyruvate, 10 mM HEPES, 50μM β-mercaptoethanol, 20 ng/mL interleukin (IL)-2, and 5 μg/mL anti-mouse CD28 antibodies (BioLegend, clone 37.51)) and cultured for 72 h for CD8+ T cell activation.
Macrophage and T cell co-culture
For proliferation assay, activated CD8+ T cells were labeled with 3 μM carboxyfluorescein diacetate succinimide ester (CFSE, BioLegend) at 37°C for 8 min and then co-cultured with pretreated differentiated mature BMDMs in RPMI1640 medium supplemented with 10% fetal bovine serum, 20 ng/mL interleukin (IL)-2 (BioLegend, USA) and 50 μM β-mercaptoethanol. BMDMs were seeded with activated T cells at a ratio of 1:10. After co-culture for another 72 h, the proliferation of CD8+ T cells and secretion of interferon (IFN)-γ by CD8+ T cells were analyzed using flow cytometry analysis.
Collection of human monocytes and macrophage phagocytosis assay
The different CMs of HCT116 tumor cells were collectd according to the previous protocol. CD14+ monocytes were isolated from PBMCs of human using the MojoSort Human CD14+ Monocytes Isolation Kit (BioLegend, USA). The purity of CD14+ monocytes isolation were assayed by flow cytometry. Purified CD14+ Monocytes were seeded in the 12 well-plate in 50% complete RPMI1640 medium (10% FBS, 1% Pencillin/Streptomycin) and 50% CMs of HCT116 tumor cells with or without 10 μM LP17. After 72 h, HCT116 cells were labeled with CFSE and co-cultured with Monocytes in complete RPMI1640 medium with or without 10 μM LP17 with 3:1 ratio for 4 h at 37°C. Monocytes were collected and labeled with Percp-cy5.5-conjugated anti-human CD11b antibody at 4°C for 30 min in darkness. Phagocytic efficiency was calculated as the percentage of CFSE+ cells in CD11b+ cells.
Real-time quantitative PCR
Total RNA from BMDMs and human peripheral blood-derived mono-macrophages were extracted by the TRIzol reagents (Invitrogen, CA, USA). The complementary DNA (cDNA) was generated following the protocol of HiScript III RT SuperMix for qPCR (+gDNA wiper) (Vazyme, Nanjing, China). The PCR was performed in triplicate using ChamQ SYBR qPCR Master Mix (Vazyme, Nanjing, China) in a StepOnePlus real-time PCR system (Thermo Fisher Scientific, Shanghai, China). Quantitative analysis was performed by the 2−ΔΔCt method. Primers used in this study are shown in Table S4.
Tumor models and in vivo treatments
MC38 (n = 3×10⁵) or CT26 (n = 3×10⁵) tumor cells were subcutaneously (s.c.) injected in the right flank of C57BL/6J or BABL/c mice.Mouse tumor size was monitored with vernier calipers every 2–3 days. Tumor size was calculated using the formula (length×width2)/2. When the tumor volume reached approximately 150 mm3, all mice were randomly divided into different groups. A dose division mode of 5 Gy × 2 was used for local radiotherapy of mouse tumors. The anti-mouse programmed cell death protein-1 (αPD-1) was administered intraperitoneally (200 μg/per mouse; clone:RMP1-14, BioXCell) every 3 days for a total of three times. TREM1 blockade LP17 (5 mg/kg, LQVTDSGLYRCVIYHPP, MCE, China) was injected intraperitoneally the day before radiotherapy and once daily thereafter until the end of the study. For survival studies, mice were euthanized when the tumor volume reached 1500 mm3 or ulcer ≥5 mm.
Immunofluorescence
The tissues were directly fixed with 4% paraformaldehyde for 15 min, then permeabilized with 0.3% Triton X-100. After washed with PBS (PH7.4) twice, the tissues were incubated with the primary antibodies overnight at 4°C. After washed with PBS three times, the tissues were covered with HRP secondary antibodies of the corresponding species of primary antibody, incubated for 50 min at room temperature in the dark, and washed three times with PBS again. Then, the tissues were incubated for 5 min with DAPI dye solution for nucleus staining. Finally, images were obtained with fluorescence and laser confocal microscopes. The following primary antibodies were used: anti-CD8 (1:100; Abcam), anti-CD68 (1:5000; Proteintech), anti-C1qC (1:400; Proteintech), anti-SPP1 (1:2000; Abcam), anti-TREM1 (1:200; Proteintech) and anti-CCR2a (1:200; Proteintech).
Flow cytometry
The flow cytometry samples involved in this study included tumor tissues, peripheral blood, and lymph nodes from mice, and human PBMC, as well as tumor cells, macrophages, and T-lymphocytes applied in in vitro functional experiments. Tumor tissues were cut into small pieces and digested in RPMI1640 medium (without FBS) containing 0.32 mg/mL collagenase V, 0.5 mg/mL hyaluronidase, and 5 μg/mL DNase I for 1 h at 37°C and filtered through a 70 μm filter to generate a single-cell suspension. Lymph nodes were ground with a 70 μm filter to isolate lymph node cells, and murine peripheral blood was lysed by erythrocyte lysis to obtain a single-cell suspension.
Cells were pre-incubated with TruStain FcX (anti-mouse CD16/32) antibody (BioLegend) or Human TruStain FcX (BioLegend) and stained with a Zombie NIR Fixable Viability Kit (BioLegend) for 20 min on ice followed by immunostaining. Appropriate cell surface marker antibodies were selected and stained in the dark at 4°C for 30 min, and/or fixed (1% paraformaldehyde)/permeated (Intracellular Staining Perm Wash Buffer, Biolegend), and intracellular antibodies (intracellular markers CD206 and IFN-γ) were stained at 4°C for 30 min. In addition, for intracellular cytokine staining (IFN-γ), cells were stimulated ex vivo with 100 ng/mL PMA, 1 μg/mL ionomycin and 1.5 μg/mL monensin for 4–6 h at 37°C in 10% FBS and 1% penicillin/streptomycin. All samples were detected by a CytoFLEX flow cytometer (Beckman Kurt Trading Co., Ltd, USA), and all data were analyzed in FlowJo software version 10.8.1. The flow cytometry antibodies involved in this study are detailed in key resources table. Gating strategies are displayed in Figure S7.
Cell deconvolution of the human pan-cancer bulk RNA-seq datasets
Our LARC scRNA-seq dataset with annotated mono-macrophages signature was used as a single-cell reference matrix. We computed the average expression matrices for each mono-macrophages clusterusing the AverageExpression function in Seurat object. The single-cell reference matrix, average expression matrices, and bulk RNA-seq data of pan-cancer in TCGA were utilized as inputs, while the other parameters were set as the algorithm’s default options.
Quantification and statistical analysis
To estimate the statistical significance of differences between two groups, we used a paired or un-paired Student’s t-tests to calculate two-tailed p values. Mann-Whitney test was used for comparison of nonparametric data between two groups. One-way analysis of variance (ANOVA) with Tukey’s post hoc comparisons was performed when more than two groups were compared. Survival analysis was performed using Kaplan-Meier curves and evaluated with log rank Mantel-Cox tests. Chi-squared test was used to compare the difference in composition ratio between two groups. Error bars indicate the standard error of the mean (SEM) unless otherwise noted. p values are labeled in the figures. p values were denoted as follows: ∗p < 0.05, ∗∗p < 0.01, ∗∗∗p < 0.001, ∗∗∗∗p < 0.0001. Apart from scRNA-seq analysis, statistical analyses were performed by using GraphPad Prism (version 8.0).
Additional resources
The human subjects used for analysis in this study were obtained from our previously reported clinical trial (NCT04928807),15 which was registered at https://clinicaltrials.gov/.
Published: January 9, 2025
Footnotes
Supplemental information can be found online at https://doi.org/10.1016/j.xcrm.2024.101887.
Contributor Information
Zhenyu Lin, Email: whxhlzy@hust.edu.cn.
Tao Zhang, Email: taozhangxh@hust.edu.cn.
Supplemental information
References
- 1.Bray F., Laversanne M., Sung H., Ferlay J., Siegel R.L., Soerjomataram I., Jemal A. Global cancer statistics 2022: GLOBOCAN estimates of incidence and mortality worldwide for 36 cancers in 185 countries. CA. Cancer J. Clin. 2024;74:229–263. doi: 10.3322/caac.21834. [DOI] [PubMed] [Google Scholar]
- 2.Kagawa Y., Smith J.J., Fokas E., Watanabe J., Cercek A., Greten F.R., Bando H., Shi Q., Garcia-Aguilar J., Romesser P.B., et al. Future direction of total neoadjuvant therapy for locally advanced rectal cancer. Nat. Rev. Gastroenterol. Hepatol. 2024;21:444–455. doi: 10.1038/s41575-024-00900-9. [DOI] [PMC free article] [PubMed] [Google Scholar]
- 3.Yang Z., Gao J., Zheng J., Han J., Li A., Liu G., Sun Y., Zhang J., Chen G., Xu R., et al. Efficacy and safety of PD-1 blockade plus long-course chemoradiotherapy in locally advanced rectal cancer (NECTAR): a multi-center phase 2 study. Signal Transduct. Target. Ther. 2024;9:56. doi: 10.1038/s41392-024-01762-y. [DOI] [PMC free article] [PubMed] [Google Scholar]
- 4.Aref A., Abdalla A. Total Neoadjuvant Therapy for Locally Advanced Rectal Cancer: Induction or Consolidation Chemotherapy? J. Clin. Oncol. 2022;40:2515–2519. doi: 10.1200/JCO.22.00506. [DOI] [PubMed] [Google Scholar]
- 5.van Gijn W., Marijnen C.A.M., Nagtegaal I.D., Kranenbarg E.M.-K., Putter H., Wiggers T., Rutten H.J.T., Påhlman L., Glimelius B., van de Velde C.J.H., Dutch Colorectal Cancer Group Preoperative radiotherapy combined with total mesorectal excision for resectable rectal cancer: 12-year follow-up of the multicentre, randomised controlled TME trial. Lancet Oncol. 2011;12:575–582. doi: 10.1016/S1470-2045(11)70097-3. [DOI] [PubMed] [Google Scholar]
- 6.Chalabi M., Fanchi L.F., Dijkstra K.K., Van den Berg J.G., Aalbers A.G., Sikorska K., Lopez-Yurda M., Grootscholten C., Beets G.L., Snaebjornsson P., et al. Neoadjuvant immunotherapy leads to pathological responses in MMR-proficient and MMR-deficient early-stage colon cancers. Nat. Med. 2020;26:566–576. doi: 10.1038/s41591-020-0805-8. [DOI] [PubMed] [Google Scholar]
- 7.Cercek A., Lumish M., Sinopoli J., Weiss J., Shia J., Lamendola-Essel M., El Dika I.H., Segal N., Shcherba M., Sugarman R., et al. PD-1 Blockade in Mismatch Repair-Deficient, Locally Advanced Rectal Cancer. N. Engl. J. Med. 2022;386:2363–2376. doi: 10.1056/NEJMoa2201445. [DOI] [PMC free article] [PubMed] [Google Scholar]
- 8.Hu H., Kang L., Zhang J., Wu Z., Wang H., Huang M., Lan P., Wu X., Wang C., Cao W., et al. Neoadjuvant PD-1 blockade with toripalimab, with or without celecoxib, in mismatch repair-deficient or microsatellite instability-high, locally advanced, colorectal cancer (PICC): a single-centre, parallel-group, non-comparative, randomised, phase 2 trial. Lancet. Gastroenterol. Hepatol. 2022;7:38–48. doi: 10.1016/S2468-1253(21)00348-4. [DOI] [PubMed] [Google Scholar]
- 9.Fan A., Wang B., Wang X., Nie Y., Fan D., Zhao X., Lu Y. Immunotherapy in colorectal cancer: current achievements and future perspective. Int. J. Biol. Sci. 2021;17:3837–3849. doi: 10.7150/ijbs.64077. [DOI] [PMC free article] [PubMed] [Google Scholar]
- 10.Zaanan A., Shi Q., Taieb J., Alberts S.R., Meyers J.P., Smyrk T.C., Julie C., Zawadi A., Tabernero J., Mini E., et al. Role of Deficient DNA Mismatch Repair Status in Patients With Stage III Colon Cancer Treated With FOLFOX Adjuvant Chemotherapy: A Pooled Analysis From 2 Randomized Clinical Trials. JAMA Oncol. 2018;4:379–383. doi: 10.1001/jamaoncol.2017.2899. [DOI] [PMC free article] [PubMed] [Google Scholar]
- 11.Weng J., Li S., Zhu Z., Liu Q., Zhang R., Yang Y., Li X. Exploring immunotherapy in colorectal cancer. J. Hematol. Oncol. 2022;15:95. doi: 10.1186/s13045-022-01294-4. [DOI] [PMC free article] [PubMed] [Google Scholar]
- 12.Lin Z., Cai M., Zhang P., Li G., Liu T., Li X., Cai K., Nie X., Wang J., Liu J., et al. Phase II, single-arm trial of preoperative short-course radiotherapy followed by chemotherapy and camrelizumab in locally advanced rectal cancer. J. Immunother. Cancer. 2021;9 doi: 10.1136/jitc-2021-003554. [DOI] [PMC free article] [PubMed] [Google Scholar]
- 13.Lin Z., Zhang P., Hou Z., Tao K., Zhang T. Neoadjuvant short-course radiotherapy followed by chemotherapy plus camrelizumab versus long-course chemoradiotherapy followed by chemotherapy for patients with locally advanced rectal cancer: A randomized, multicenter, open-label phase 3 trial (Union) J. Clin. Oncol. 2023;41:TPS3638. doi: 10.1200/JCO.2023.41.16_suppl.TPS3638. [DOI] [Google Scholar]
- 14.Zhang T., Tao K., Lin Z., Zhang P., Yin Y., Chi P., Huang Y., Xiao Y., Sun Z., Xu X., et al. LBA25 Neoadjuvant short-course radiotherapy followed by camrelizumab plus chemotherapy versus long-course chemoradiotherapy followed by chemotherapy in locally advanced rectal cancer: A randomized phase III trial (UNION) Ann. Oncol. 2023;34:S1266–S1267. doi: 10.1016/j.annonc.2023.10.017. [DOI] [PubMed] [Google Scholar]
- 15.Lin Z.Y., Zhang P., Chi P., Xiao Y., Xu X.M., Zhang A.M., Qiu X.F., Wu J.X., Yuan Y., Wang Z.N., et al. Neoadjuvant short-course radiotherapy followed by camrelizumab and chemotherapy in locally advanced rectal cancer (UNION): early outcomes of a multicenter randomized phase III trial. Ann. Oncol. 2024;35:882–891. doi: 10.1016/j.annonc.2024.06.015. [DOI] [PubMed] [Google Scholar]
- 16.Pointer K.B., Pitroda S.P., Weichselbaum R.R. Radiotherapy and immunotherapy: open questions and future strategies. Trends Cancer. 2022;8:9–20. doi: 10.1016/j.trecan.2021.10.003. [DOI] [PubMed] [Google Scholar]
- 17.Galluzzi L., Aryankalayil M.J., Coleman C.N., Formenti S.C. Emerging evidence for adapting radiotherapy to immunotherapy. Nat. Rev. Clin. Oncol. 2023;20:543–557. doi: 10.1038/s41571-023-00782-x. [DOI] [PubMed] [Google Scholar]
- 18.Rodríguez-Ruiz M.E., Vanpouille-Box C., Melero I., Formenti S.C., Demaria S. Immunological Mechanisms Responsible for Radiation-Induced Abscopal Effect. Trends Immunol. 2018;39:644–655. doi: 10.1016/j.it.2018.06.001. [DOI] [PMC free article] [PubMed] [Google Scholar]
- 19.Xu L., Zou C., Zhang S., Chu T.S.M., Zhang Y., Chen W., Zhao C., Yang L., Xu Z., Dong S., et al. Reshaping the systemic tumor immune environment (STIE) and tumor immune microenvironment (TIME) to enhance immunotherapy efficacy in solid tumors. J. Hematol. Oncol. 2022;15:87. doi: 10.1186/s13045-022-01307-2. [DOI] [PMC free article] [PubMed] [Google Scholar]
- 20.Nalio Ramos R., Missolo-Koussou Y., Gerber-Ferder Y., Bromley C.P., Bugatti M., Núñez N.G., Tosello Boari J., Richer W., Menger L., Denizeau J., et al. Tissue-resident FOLR2+ macrophages associate with CD8+ T cell infiltration in human breast cancer. Cell. 2022;185:1189–1207.e25. doi: 10.1016/j.cell.2022.02.021. [DOI] [PubMed] [Google Scholar]
- 21.Chow A., Schad S., Green M.D., Hellmann M.D., Allaj V., Ceglia N., Zago G., Shah N.S., Sharma S.K., Mattar M., et al. Tim-4+ cavity-resident macrophages impair anti-tumor CD8+ T cell immunity. Cancer Cell. 2021;39:973–988.e9. doi: 10.1016/j.ccell.2021.05.006. [DOI] [PMC free article] [PubMed] [Google Scholar]
- 22.Zhou Y., Fei M., Zhang G., Liang W.-C., Lin W., Wu Y., Piskol R., Ridgway J., McNamara E., Huang H., et al. Blockade of the Phagocytic Receptor MerTK on Tumor-Associated Macrophages Enhances P2X7R-Dependent STING Activation by Tumor-Derived cGAMP. Immunity. 2020;52:357–373.e9. doi: 10.1016/j.immuni.2020.01.014. [DOI] [PubMed] [Google Scholar]
- 23.Nixon B.G., Kuo F., Ji L., Liu M., Capistrano K., Do M., Franklin R.A., Wu X., Kansler E.R., Srivastava R.M., et al. Tumor-associated macrophages expressing the transcription factor IRF8 promote T cell exhaustion in cancer. Immunity. 2022;55:2044–2058.e5. doi: 10.1016/j.immuni.2022.10.002. [DOI] [PMC free article] [PubMed] [Google Scholar]
- 24.Nasir I., McGuinness C., Poh A.R., Ernst M., Darcy P.K., Britt K.L. Tumor macrophage functional heterogeneity can inform the development of novel cancer therapies. Trends Immunol. 2023;44:971–985. doi: 10.1016/j.it.2023.10.007. [DOI] [PubMed] [Google Scholar]
- 25.Mantovani A., Marchesi F., Malesci A., Laghi L., Allavena P. Tumour-associated macrophages as treatment targets in oncology. Nat. Rev. Clin. Oncol. 2017;14:399–416. doi: 10.1038/nrclinonc.2016.217. [DOI] [PMC free article] [PubMed] [Google Scholar]
- 26.Vandestienne M., Zhang Y., Santos-Zas I., Al-Rifai R., Joffre J., Giraud A., Laurans L., Esposito B., Pinet F., Bruneval P., et al. TREM-1 orchestrates angiotensin II-induced monocyte trafficking and promotes experimental abdominal aortic aneurysm. J. Clin. Invest. 2021;131 doi: 10.1172/JCI142468. [DOI] [PMC free article] [PubMed] [Google Scholar]
- 27.Liu Y., Zhang Q., Xing B., Luo N., Gao R., Yu K., Hu X., Bu Z., Peng J., Ren X., Zhang Z. Immune phenotypic linkage between colorectal cancer and liver metastasis. Cancer Cell. 2022;40:424–437.e5. doi: 10.1016/j.ccell.2022.02.013. [DOI] [PubMed] [Google Scholar]
- 28.Zhang L., Li Z., Skrzypczynska K.M., Fang Q., Zhang W., O'Brien S.A., He Y., Wang L., Zhang Q., Kim A., et al. Single-Cell Analyses Inform Mechanisms of Myeloid-Targeted Therapies in Colon Cancer. Cell. 2020;181:442–459.e29. doi: 10.1016/j.cell.2020.03.048. [DOI] [PubMed] [Google Scholar]
- 29.Wu K., Liu Y.-Y., Shao S., Song W., Chen X.-H., Dong Y.-T., Zhang Y.-M. The microglial innate immune receptors TREM-1 and TREM-2 in the anterior cingulate cortex (ACC) drive visceral hypersensitivity and depressive-like behaviors following DSS-induced colitis. Brain Behav. Immun. 2023;112:96–117. doi: 10.1016/j.bbi.2023.06.003. [DOI] [PubMed] [Google Scholar]
- 30.Zhai M., Lin Z., Wang H., Yang J., Li M., Li X., Zhang L., Zhang T. Can rectal MRI and endorectal ultrasound accurately predict the complete response to neoadjuvant immunotherapy for rectal cancer? Gastroenterol. Rep. 2024;12 doi: 10.1093/gastro/goae027. [DOI] [PMC free article] [PubMed] [Google Scholar]
- 31.Toledo B., Zhu Chen L., Paniagua-Sancho M., Marchal J.A., Perán M., Giovannetti E. Deciphering the performance of macrophages in tumour microenvironment: a call for precision immunotherapy. J. Hematol. Oncol. 2024;17:44. doi: 10.1186/s13045-024-01559-0. [DOI] [PMC free article] [PubMed] [Google Scholar]
- 32.Ajith A., Mamouni K., Horuzsko D.D., Musa A., Dzutsev A.K., Fang J.R., Chadli A., Zhu X., Lebedyeva I., Trinchieri G., Horuzsko A. Targeting TREM1 augments antitumor T cell immunity by inhibiting myeloid-derived suppressor cells and restraining anti-PD-1 resistance. J. Clin. Invest. 2023;133 doi: 10.1172/JCI167951. [DOI] [PMC free article] [PubMed] [Google Scholar]
- 33.Zhou X., Lin K., Fu L., Liu F., Lin H., Chen Y., Zhuang B., Liang H., Deng Q., Wang Z., et al. Overexpression of TREM1 is Associated with the Immune-Suppressive Microenvironment and Unfavorable Prognosis in Pan-Cancer. J. Inflamm. Res. 2023;16:1375–1391. doi: 10.2147/JIR.S398284. [DOI] [PMC free article] [PubMed] [Google Scholar]
- 34.Juric V., Mayes E., Binnewies M., Lee T., Canaday P., Pollack J.L., Rudolph J., Du X., Liu V.M., Dash S., et al. TREM1 activation of myeloid cells promotes antitumor immunity. Sci. Transl. Med. 2023;15 doi: 10.1126/scitranslmed.add9990. [DOI] [PubMed] [Google Scholar]
- 35.Liu Y., Xun Z., Ma K., Liang S., Li X., Zhou S., Sun L., Liu Y., Du Y., Guo X., et al. Identification of a tumour immune barrier in the HCC microenvironment that determines the efficacy of immunotherapy. J. Hepatol. 2023;78:770–782. doi: 10.1016/j.jhep.2023.01.011. [DOI] [PubMed] [Google Scholar]
- 36.Song G., Shi Y., Meng L., Ma J., Huang S., Zhang J., Wu Y., Li J., Lin Y., Yang S., et al. Single-cell transcriptomic analysis suggests two molecularly subtypes of intrahepatic cholangiocarcinoma. Nat. Commun. 2022;13:1642. doi: 10.1038/s41467-022-29164-0. [DOI] [PMC free article] [PubMed] [Google Scholar]
Associated Data
This section collects any data citations, data availability statements, or supplementary materials included in this article.
Supplementary Materials
Data Availability Statement
-
•
The sequencing data (including scRNA-seq and bulk RNA-seq) reported in this paper are deposited in NCBI Gene Expression Omnibus database with accession number GEO: GSE278406 and GEO: GSE278405 (URL: https://www.ncbi.nlm.nih.gov/geo/). Accession numbers are listed in the key resources table as well.
-
•
This paper does not report the original code.
-
•
Any additional information required to reanalyze the data reported in this paper is available from the lead contact upon request.