

Abstract
Growth of the Pacific white shrimp Litopenaeus vannamei, the most important farmed crustacean, has consistently been a focal point for breeders. Over the past decades, some candidate genes for shrimp growth have been identified. However, further research is needed to elucidate the molecular regulatory mechanism of these genes. LvMmd2 was previously identified as a candidate gene that may inhibit the growth of L. vannamei. In this study, we analyzed the genotype and expression of the LvMmd2 gene in a breeding family and indicated its role as a growth-inhibiting gene. We found that LvMmd2 co-localized with its homolog LvPAQR3 at the Golgi apparatus. Using co-immunoprecipitation (Co-IP) and DUAL membrane system yeast two-hybrid (MbY2H), we indicated the interactions between LvMmd2 and LvPAQR3, LvPAQR3 and LvRaf1, as well as LvMmd2 and LvRho. These results suggest that LvMmd2 directly and indirectly regulates the Ras signaling pathway. Furthermore, we show that the LvMmd2 gene may indirectly affect the PI3K/AKT, insulin, and Hippo signaling pathways to regulate cell proliferation and differentiation via LvPAQR3 and LvRaf1. Through transcriptome and MbY2H analyses, we have also revealed the interaction between LvMmd2 and proteins involved in growth, immunity, protein transport, synthesis, and modification. These findings demonstrate the various molecular pathways through which LvMmd2 regulates L. vannamei growth. This study provides insights into the mechanism of shrimp growth regulated by Mmd2, enhances our understanding of LvMmd2 function, and highlights its potential application in shrimp breeding.
Supplementary Information
The online version contains supplementary material available at 10.1007/s42995-024-00273-7.
Keywords: Pacific white shrimp, Monocyte to macrophage differentiation factor 2, Growth-inhibiting gene, Function, Ras signaling pathway
Introduction
Penaeid shrimp are a major target group in commercial fisheries and aquaculture (Cheng et al. 2018; De Grave and Fransen 2011). In recent decades, numerous efforts have been made to improve the important economic traits of shrimp, such as growth, fertility, disease resistance, and stress tolerance (Yuan et al. 2023). Of these traits, growth has been the focus of breeders as it is directly related to shrimp production. However, the relatively weak research base and lack of suitable model organisms have hindered the progress of research on growth-related genes in shrimp, resulting in a limited understanding of the molecular mechanisms of growth in these species.
The growth of shrimp is polygenic controlled by multiple quantitative trait loci (QTLs) and genes (Wang et al. 2020). In earlier studies, some growth-related genes have been identified and investigated in shrimp, such as myostatin (Lee and McPherron 2001; Lee et al. 2011; Yan et al. 2020), myosin (Kamimura et al. 2008), FABP (fatty-acid-binding protein) (Storch and Thumser 2010), and amylase (Warren et al. 2011). With the completion of a high-density genetic linkage map and a whole genome map of the Pacific white shrimp Litopenaeus vannamei (Yu et al. 2015; Zhang et al. 2019), the capacity to accurately locate genes associated with shrimp traits using QTL and genome-wide association studies (GWAS) has improved. Recently, researchers have identified multiple genes related to growth in L. vannamei. These genes include PKC-δ (protein kinase C-delta) and Rap-2a (Ras-related protein) (Yu et al. 2019), SRC (class C scavenger receptor) (Wang et al. 2019), Mmd2 (monocyte to macrophage differentiation factor 2) (Wang et al. 2020), dCMPD (deoxycytidylate deaminase), and NPTK (non-receptor protein tyrosine kinase) (Lyu et al. 2021). Among these studies, Wang et al. (2020) found that the SNP associated with the growth of L. vannamei located on the Mmd2 gene, with a nonsynonymous mutation named MMD_5 contributing the most to the trait, explaining ~ 10% of the phenotypic variance. This finding suggests that Mmd2 may serve as a crucial candidate gene for shrimp growth (Wang et al. 2020).
The Mmd2 gene encodes the PAQR10 protein, which belongs to the progesterone and adiponectin receptor (PAQR) family (Tang et al. 2005; Thomas et al. 2007). PAQR is a group of membrane receptor proteins that share a conserved seven-transmembrane domain. In prokaryotes, PAQR family genes encode hemolysin-type proteins. In eukaryotes, these genes code for adiponectin or progestin-related receptors and have extensive and apparent ligand specificity (Baida and Kuzmin 1995, 1996; Tang et al. 2005). The adiponectin receptors (PAQR1 and PAQR2) were the first family discovered, and they play a crucial role in regulating glucose and lipid metabolism (Yamauchi et al. 2001, 2002, 2003). PAQR3, renamed Raf1 kinase trapping to Golgi (RKTG), was found to sequester Raf1 kinase to the Golgi apparatus, inhibiting the Ras-Raf-ERK signaling pathway (Feng et al. 2007). The Raf1 protein kinase is an important component of the Ras/Raf/MEK/ERK signaling pathway in mammals, and its knockdown in mice could lead to cell apoptosis, mainly in the liver and hematopoietic system (Chen et al. 2001; Hüser et al. 2001). In addition, there is increasing evidence that Raf1 may use multiple effectors, including its established target MEK, to mediate cellular functions. PAQR3 negatively regulates the PI3K/AKT signaling pathway by interacting with the catalytic subunit of PI3K (p110a), and subsequently negatively regulates the insulin signaling pathway (Qiao et al. 2021; Xiao et al. 2022). PAQR10 and PAQR11, which have the highest similarity to bacterial hemolysin proteins, are most likely the descendants of the original PAQR genes (Jin et al. 2012a). However, there is limited research on PAQR10 (Mmd2). Researchers have found that PAQR10 and PAQR11 are involved in delaying and prolonging Ras signaling, as well as regulating the Ras pathway, which plays a crucial role in normal cell proliferation and serves as a nodal point for multiple growth signaling pathways (Cass and Meinkoth 1998; Crespo and Leon 2000; Jin et al. 2012a, b, 2015). Considering the potentially important role of PAQR10 in growth and development, further research is needed to elucidate the molecular mechanisms of the Mmd2 gene in regulating shrimp growth.
Recently, we cloned and identified the Mmd2 gene of L. vannamei (LvMmd2) and found that body length and weight gain could be significantly enhanced following the knockdown of LvMmd2 by RNA interference (RNAi), suggesting its role as an inhibitor of shrimp growth (Si et al. 2023). However, the mechanism through which LvMmd2 exerts negative regulation on shrimp growth remains unclear. In this study, we first support the genotype of LvMmd2 in a shrimp family and indicate its role as a growth suppressor gene. Subsequently, utilizing evidence from cellular localization, co-immunoprecipitation (Co-IP), and DUAL membrane system yeast two-hybrid assay (MbY2H), along with transcriptome analysis after RNAi, we demonstrated that LvMmd2 regulates shrimp growth through various signaling pathways, including Ras, Hippo, and insulin signaling pathways. These results provide valuable insights for future research and use of the Mmd2 gene in shrimp and crustaceans.
Materials and methods
Experimental animals
For the RNA interference (RNAi) experiment, ~ 1000 L. vannamei were obtained from Rizhao Xingguang Marine Ranch Fishery Co (Rizhao, Shandong, China) and shipped to the Institute of Oceanology, Chinese Academy of Sciences (Qingdao, Shandong, China). These shrimp came from the same culture family and had similar body length and weight. Cultures were maintained at 25 °C and natural seawater (30 PSU). The seawater was changed every day. Shrimp were fed food pellets (Dell Feed Company, Yantai, China) three times a day, at 0.016 g of food per g of shrimp body mass. A total of 480 individuals were used for the RNA interference (RNAi) experiment; these had an average initial body weight of 3.5 ± 1.8 (SD) g and an average initial body length of 6.5 ± 1.6 (SD) cm.
For the genotype and gene expression analysis experiment, another 100 shrimp were selected from the same family (Family 21253), which were bred in Bohai Aquaculture Breeding (Hainan) Co. Ltd (Wenchang, Hainan, China). These shrimp have been cultured for a uniform duration of 30 days; however, they exhibit variations in size. They were sorted by weight, with 20 individuals from the top 30 were selected as the fast-growing group (3.3 ± 1.1 g), and 20 individuals from the bottom 30 were selected as the slow-growing group (1.2 ± 0.5 g).
Preparation of double-strand RNA (dsRNA) and RNA interference
To knock down the target gene LvMmd2, two pairs of primers, EGFP-F/R and LvMmd2-F/R, were designed to amplify the EGFP and LvMmd2 genes. Primers for dsEGFP-F/R and dsMmd2-F/R, with T7 promoter sequences, were used to clone a 289 bp DNA fragment and a 507 bp DNA fragment for dsRNA synthesis. PCR was performed according to the manufacturer’s protocol of the Premix Ex Taq™ Hot Start Version (TaKaRa, Japan). PCR products were detected by electrophoresis on 1% agarose gel and purified using the MiniBEST DNA fragment purification kit (TaKaRa, Japan). The purified products were used to synthesize the corresponding dsRNAs using the Transcript Aid T7 High Yield Transcription Kit (Thermo Fisher Scientific, USA). The dsRNAs were then purified using a phenol and chloroform mixture, and any redundant single-strand RNA was removed by RNaseA. The qualified dsRNAs were stored at − 80 °C for subsequent RNA interference experiments.
Three doses of dsRNA (2, 6, 10 μg) were injected into the last abdominal segment of each shrimp. The same doses of EGFP dsRNA and 10μl PBS were injected into the shrimp as the control group. After detecting the transcription level of LvMmd2 at 48 h post injection, the dosage of 2 μg dsRNA was selected for further RNAi experiments. A total of 480 shrimp (premolt stage D1–D2) were randomly divided into three groups: the dsMmd2 experimental group and two control groups (dsEGFP and PBS). Each group consisted of 160 individuals, which were further divided into three replicates immediately and raised in separate tanks. 2 μg of dsMmd2, 2 μg of dsEGFP, and 10 μl PBS were injected into the last abdominal segment of each group of shrimp. The same injection was repeated every four days, and the experiment lasted for two weeks (Si et al. 2023). Before and after the experiment, the body weight and body length of every shrimp were measured and recorded.
Tissue collection
For the RNA interference (RNAi) experiment, the knockdown efficiency of LvMmd2 was detected after 48 h of injection. To reduce the inter-individual error of shrimp, the hepatopancreas of four shrimp was taken as one biological replicate. Sixteen shrimp from each separate tank were divided into four biological replicates, and a total of twelve biological replicates were obtained from three separate tanks with the same group (treatment group or control groups). The muscle was collected in the same manner. For the dsMmd2 group (and its control), three hepatopancreas replicates were collected for transcriptome sequencing (OE Biotech Co., Ltd., Shanghai, China).
For the genotype and gene expression analysis experiment, muscle and hepatopancreas samples were individually collected from 40 individuals of Family 21253, and the tissues of each individual were stored separately. All tissues were frozen in liquid nitrogen and stored at − 80 °C before analysis.
DNA extraction
DNA was extracted from the muscles using the plant genome DNA kit (TIANGEN, Beijing, China), following the manufacturer’s instructions. The purity and quality of the DNA extracts were determined using a NanoDrop 2000 spectrophotometer (Thermo Fisher Scientific, USA) and 1% agarose gel electrophoresis. The high-quality DNA samples were stored at − 20 °C before analysis.
RNA isolation and cDNA synthesis
RNA was isolated from the different tissues of the shrimp using the RNAiso Plus reagent (TaKaRa, Japan), following the manufacturer’s instructions. Approximately 100 mg of tissue from each sample was used for RNA extraction. The quality and concentration of RNA were assessed by electrophoresis on a 1% agarose gel and Nanodrop 2000 (Thermo Fisher Scientific, USA). All cDNA samples were synthesized from 1 µg total RNA with the PrimeScript RT Reagent Kit (TaKaRa, Japan). According to the manufacturer’s instructions, genomic DNA (gDNA) was removed using a genomic DNA eraser buffer, followed by the synthesis of the first strand cDNA using PrimeScript RT Enzyme with random primers. Finally, all cDNA samples were stored at − 80 °C before analysis.
Quantitative real-time PCR analysis (qRT-PCR)
The SuperReal PreMix Plus (SYBR Green) (Tiangen, China) was used to detect the expression of related genes in RNAi-treated samples, with 18S rRNA selected as an internal reference gene (primer sequences are listed in Supplementary Table S1). QRT-PCR was performed using the Eppendorf Mastercycler ep realplex (Eppendorf, Hamburg, Germany). All reagents were mixed according to the manufacturer’s protocol, and each biological replicates included four technical replicates. The PCR steps were as follows: 94 °C for 2 min, 40 cycles of 94 °C for 15 s, annealing temperature for 20 s, and 72 °C for 20 s. The specificity of the primers was tested using melting curves. Finally, the relative expression level of the genes was calculated using the 2−△△Ct method (Livak and Schmittgen 2001).
The data obtained from each qRT-PCR experiment were analyzed to calculate the mean and standard deviation of triplicate assays. Statistical significance between the control and different treatment groups was determined by one-way ANOVA using SPSS (https://www.ibm.com/cn-zh/analytics/spss-statistics-software) (version 20), with Prism software used to visualize column plots.
Gene cloning and sequence analysis
To obtain the full length of LvMmd2 and other genes, PrimeStar GXL DNA polymerase (TaKaRa, Japan) was used for PCR amplification (for primer sequences see Supplementary Table S2). The PCR profile was as follows: 1 cycle of denaturation at 98 °C for 5 min, 35 cycles of amplification (98 °C for 10 s, annealing temperature for 15 s, 68 °C for extension), and finally extension at 68 °C for 10 min. The PCR products were qualified using 1% agarose gel electrophoresis, collected and purified using the Gel Extraction Kit (Omega, Norcross, GA, USA). The purified products were then inserted into the pMD19-T vector (TaKaRa, Kyoto, Japan), and transformed into Trans5α chemically competent cells (TransGen Biotech, Beijing, China) for sequencing.
We used ORF Finder (https://www.ncbi.nlm.nih.gov/orffinder/) and ExPASy translation tool (http://web.expasy.org/translate/) to obtain the deduced amino acid sequences. The amino acid sequences were further analyzed by SMART (http://smart.embl-heidelberg.de/). In addition, we used STRING (https://cn.string-db.org/) to predict the genes interacting with LvMmd2.
Plasmid construction
Construction of co-immunoprecipitation (Co-IP) expression plasmid: the pDHsp-70-V5-His vector and pDHsp-70-Flag-His vector were digested with the appropriate restriction enzymes (Hind III and BamH I) to generate linearized vectors. The complete ORF region of LvMmd2 was amplified using the primers pDHsp-70-LvMmd2-F/R. The half region of LvPAQR3 (LvPAQR3-ΔXb: with the partial transmembrane domain) was amplified using pDHsp-70-LvPAQR3-ΔXb-F/R. The C-terminus of LvPAQR3 (LvPAQR3-ΔC) was amplified using pDHsp-70-LvPAQR3-ΔC-F/R. The STKC domain of LvRaf1 was amplified using pDHsp-70-LvRaf1-ΔSTKC-F/R. The primers with homologous arms on both sides of the digested vector are listed in Supplementary Table S3. LvMmd2 was inserted into the digested pDHsp-70-Flag-His vector using the In-Fusion® Snap Assembly Master Mix (TaKaRa, Kyoto, Japan) to construct the Flag-His-tagged LvMmd2 expression plasmid. LvPAQR3-ΔXb was inserted into the digested pDHsp-70-V5-His vector to construct the V5-His-tagged LvPAQR3-ΔXb expression plasmid, and LvPAQR3-ΔC was inserted into the digested pDHsp-70-V5-His vector to construct the V5-His-tagged LvPAQR3-ΔC expression plasmid. LvRaf1-ΔSTKC was inserted into the digested pDHsp-70-Flag-His vector to construct the Flag-His-tagged LvRaf1-ΔSTKC expression plasmid. LvRho was inserted into the digested pDHsp-70-V5-His vector to construct the V5-His-tagged LvRho expression plasmid.
The construction of cell localization plasmid: the pDHsp-70-V5-His vector and the pDHsp-70-Flag-His vector were digested with appropriate restriction enzymes (EcoR I and BamH I) to generate linearized vectors. The primers pDhsp-70-EGFP-F/R and pDhsp-70-mCherry-F/R (Supplementary Table S3) were then used to amplify EGFP and mCherry tag protein fragments, respectively. The purified products were inserted into their corresponding linearization vectors using the in-fusion HD cloning kit (Clontech, Mountain View, CA, USA) to obtain plasmids pDhsp-70-EGFP-flag-His and pDhsp-70-mCherry-V5-His. The plasmids were then linearized using BamH I and Hind III, and the ORF regions of LvMmd2 and the C-terminus of LvPAQR3 were amplified using the primer pDhsp-70-LvMmd2-EGFP-F/R and pDhsp-70-LvPAQR3-ΔC-mCherry-F/R (Supplementary Table S3), respectively. The purified products were then inserted into the corresponding linearization vectors using the in-fusion HD cloning kit to obtain plasmids pDhsp-70-LvMmd2-EGFP-flag-His and pDhsp-70-LvPAQR3-ΔC-mCherry-V5-His.
All of the recombinant plasmids listed in Supplementary Table S4 were used to transform Trans5α chemically competent cells (TransGen Biotech, Beijing, China) for sequencing. The positive clones were used to inoculate 10 mL of low-salt LB medium for zeocin selection and culture. The plasmids were then extracted using the endotoxin-free plasmid Mini Kit I (Omega, Lyndhurst, NJ) and stored at − 20 °C until use.
Cells culture and transient transfection
Sf9 insect cells were cultured in Sf-900™ II SFM (Gibco, Grand Island, NY, USA) at 27 ℃ and subcultured every 3–4 days. The cells were seeded on a 24-well plate, and after 24 h, the EGFP plasmid was transfected into Sf9 insect cells using Lipofectamine 3000 reagent (Life Technologies, Carlsbad, CA, USA). After 6 h, to activate the pDHsp70 promoter, the cells were treated with heat shock at 42 °C for 30 min. The transfection and expression efficiency of the cells were observed using a fluorescence microscope (Nikon Eclipse Ti, Japan) after 24 h of culture.
Co-immunoprecipitation (Co-IP) plasmid transfection: Sf9 insect cells were seeded on six-well plates 24 h before transfection. The plasmid combinations were co-transfected into the cells using Lipofectamine 300 (for details see Table 1).
Table 1.
Recombinant plasmid combinations for co-transfection
| Recombinant plasmid combinations | Group name | Purpose |
|---|---|---|
| pDHsp-70-LvMmd2-Flag-His | experimental group 1 | CO-IP |
| pDHsp-70-LvPAQR3-ΔC-V5-His | ||
| pDHsp-70-LvMmd2-Flag-His | Control group 1-1 | |
| pDHsp-70-V5-His | ||
| pDHsp-70-Flag-His | Control group 1-2 | |
| pDHsp-70-LvPAQR3-ΔC-V5-His | ||
| pDHsp-70-LvPAQR3-ΔXb-V5-His | Experimental group 2 | |
| pDHsp-70-LvRaf1-ΔSTKC-Flag-His | ||
| pDHsp-70-LvPAQR3-ΔXb-V5-His | Control group 2-1 | |
| pDHsp-70-Flag-His | ||
| pDHsp-70-V5-His | Control group 2-2 | |
| pDHsp-70-LvRaf1-ΔSTKC-Flag-His | ||
| pDHsp-70-LvMmd2-Flag-His | Experimental group 3 | |
| pDHsp-70-LvRho-V5-His | ||
| pDHsp-70-LvMmd2-Flag-His | Control group 3-1 | |
| pDHsp-70-V5-His | ||
| pDHsp-70-Flag-His | Control group 3-2 | |
| pDHsp-70-LvRho-V5-His | ||
| pDHsp-70-Flag-His | Control group | |
| pDHsp-70 -V5-His | ||
| pDhsp-70-LvMmd2-EGFP-flag-His | Experimental group | Cell co-location |
| pDhsp-70-LvPAQR3-ΔC-mCherry-V5-His | ||
| pDhsp-70-LvMmd2-EGFP-flag-His | Control group 1 | |
| pDhsp-70-mCherry-V5-His | ||
| pDhsp-70-EGFP-flag-His | Control group 2 | |
| pDhsp-70-LvPAQR3-ΔC-mCherry-V5-His | ||
| pDhsp-70-EGFP-flag-His | Control group 3 | |
| pDhsp-70-mCherry-V5-His |
Cell co-location plasmid transfection: Sf9 insect cells were seeded on petri dishes 24 h before transfection for cell co-location plasmid transfection. Each respective combination listed in Table 1 was co-transfected. After transfection for 6 h and heat shock at 42 ℃ for 30 min, fluorescence microscope images of LvMmd2 and LvPAQR3 distribution patterns were recorded after 24 h of culture.
Golgi staining treatment: Sf9 insect cells were seeded on a petri dish 24 h before transfection. PDhsp-70-LvMmd2-EGFP-flag-His and pDhsp-70-EGFP-flag-His plasmids were transfected separately. After transfection for 6 h, heat shock was applied at 42 °C for 30 min, followed by 24 h of culture. The culture medium was then removed, and the cells were washed three times with the pre-cooled Sf-900™ II SFM (Gibco, Carlsbad, CA, USA) culture medium at 4 °C. A diluted Golgi Tracker Red working solution (1:100) was then added to the cells. The cells were incubated in the dark at 4 °C for 30 min, washed three times with the appropriate culture medium at 4 °C, and observed using a fluorescence microscope (Nikon Eclipse Ti, Japan).
Co-immunoprecipitation (Co-IP) and western blot
After 24 h of pDHsp70 promoter activation, the culture medium was discarded, and the cells were washed three times with PBS. Cell lysis buffer (BeyoTime, Shanghai, China) supplemented with protease inhibitor phenylmethylsulfonyl fluoride (PMSF, 1 mmol/L) was used to lyse the cells and collect proteins. The lysate was then centrifuged at 4 °C at 12,000 rpm for 10 min to remove cell fragments. A quarter of the supernatant (input) was mixed with SDS-PAGE loading buffer and boiled for 10 min to be used as samples to indicate the expression of pDHsp-70-LvMmd2-Flag-His, pDHsp-70-LvPAQR3-ΔC-V5-His, pDHsp-70-LvPAQR3-ΔXb-V5-His, and pDHsp-70-LvRaf1-ΔSTKC-Flag-His. The remaining supernatant was subjected to incubation with Anti-FLAG® M2 magnetic beads (Sigma, St. Louis, MO, USA) at 4 °C for 2 h to attract the bait and prey proteins. The magnetic beads were washed twice using PBS and cell lysis buffer. Afterward, they were mixed with 60 μL 2 × SDS-PAGE loading buffer and boiled for 10 min to isolate the proteins from the magnetic beads.
All of the protein samples mentioned above were separated using 15% sodium dodecyl sulfate–polyacrylamide gel electrophoresis (SDS-PAGE) and then transferred onto polyvinylidene difluoride (PVDF) membranes. The protein–protein interactions between pDHsp-70-LvMmd2-Flag-His and pDHsp-70-LvPAQR3-ΔC-V5-His, pDHsp-70-LvPAQR3-ΔXb-V5-His, and pDHsp-70-LvRaf1-ΔSTKC-Flag-His were detected using Western blot. The expression of Flag-His-tagged proteins was detected using the Anti-His antibody (rabbit mAb, Cell Signaling Technology, Danvers, MA, USA), and the anti-V5 antibody was used to detect the result of the CO-IP samples and the expression of V5-His-tagged proteins.
DUAL membrane system yeast two-hybrid assay (MbY2H)
MbY2H was used to identify LvMmd2-interacting proteins. A yeast two-hybrid cDNA was constructed using the Gateway method. Twelve tissues of L. vannamei were used as templates: heart, eyestalk, intestine, ventral nerve, hepatopancreas, muscle, brain, stomach, gills, hemocytes, lymphoid organ (Oka), and epidermis. The resulting NubG-X library (pPR3-N library) was constructed by combining it with the NubG fusion cDNA library. The ORF region of LvMmd2 was cloned into a pBT3-STE vector to construct the bait vector LvMmd2-pBT3-STE. Afterward, LvMmd2-pBT3-STE and the yeast two-hybrid library of L. vannamei were co-transformed into NMY51 and cultured on QDOX-gal 1 mM 3-AT (3-amino-1,2,4-triazole) screening medium. Positive clones were then screened and re-cultured.
The interactions between the obtained positive clones and the LvMmd2-pBT3-STE bait protein were supported through one-to-one reactions. The prey plasmid containing the positive clone protein and the bait plasmid LvMmd2-pBT3-STE were co-transformed into the NMY51 yeast strain for support. The bait pTSU2-APP, which expresses the type I integral membrane protein APP (amyloid A4 precursor protein), and the prey pNubG-Fe65, which expresses the cytosolic protein Fe65 (amyloid beta A4 precursor protein-binding family B member 1), served as positive controls in the DUAL membrane functional assay. LvMmd2-pBT3-STE and pPR3-N, pTSU2-APP and pPR3-N were employed as negative controls. The growth of yeast colonies on SD/-leu/-trp/-his/-ade/X-gal + 1 mM 3-AT medium indicated protein–protein interaction. In addition to the growth reporters HIS3 and ADE2, strain NMY51 also contains the color reporter lacZ, which encodes the bacterial enzyme β-galactosidase. This enzyme catalyzes the conversion of the substrate X-gal into a blue compound, turning yeast cells expressing β-galactosidase blue when incubated with X-gal or a similar substrate. The lacZ reporter gene was used to determine the strength of individual transformant interactions in a library screen.
Results
Analysis of genotype and expression of LvMmd2 in a shrimp family
In this study, slow-growing shrimp (Family 21253) had significantly higher expression of LvMmd2 than fast-growing shrimp (Fig. 1A, B). The genotype of ref-259780-6 of LvMmd2 was supported, and the AA and AG types were predominant in the slow-growing shrimp, while the GG type was more common in the fast-growing shrimp (Fig. 1C). Similarly, the support of the MMD_5 marker of LvMmd2 showed that the TT and CT types were prevalent in the slow-growing shrimp, while the CC type was more common in the fast-growing shrimp (Fig. 1D).
Fig. 1.

Analysis of genotype and expression of LvMmd2 in the Family 21253. A, B Expression analysis of LvMmd2 in the Family 21253 (n = 10). C Genotypes of LvMmd2 at marker ref-259780-6 in Family 21253 (n = 40). D Genotypes of LvMmd2 at marker MMD_5 in Family 21253 (n = 40). E Expression of LvMmd2 ref-259780-6 marker sites in shrimp with fast growth rate (n = 40). F Expression of LvMmd2 ref-259780-6 marker sites in shrimp with slow growth rate (n = 40). G Expression of LvMmd2 MMD_5 marker sites in shrimp with fast growth rate (n = 40). H Expression of LvMmd2 MMD_5 marker sites in shrimp with slow growth rate (n = 40). The results were shown as mean values ± SD. Significant differences of the gene expression levels are shown as *P < 0.05
The LvMmd2 expression level of the dominant genotype shrimp in family 21253 was analyzed. The results indicated that the AG type of LvMmd2 marker ref-259780-6 showed higher expression than the GG type (Fig. 1E, F), while the TC type of MMD_5 marker had higher expression than the CC type (Fig. 1G, H). Moreover, individuals with the GG genotype at ref-259780-6 and the CC genotype at MMD_5 exhibited faster growth rates compared to other genotypes at each marker.
Expression of growth-related genes after LvMmd2 knockdown
After LvMmd2 knockdown, differentially expressed genes (DEGs) in the transcriptome were enriched in growth-related signaling pathways, Ras, Hippo, PI3K/AKT, and insulin signaling pathways (Table 2). In the LvMmd2 RNAi group, the expression of genes related to the Ras signaling pathway, such as MRas, Rhes, Ras-like protein family member 10B, and MAPK, showed significant upregulation. The DEGs were also enriched in the Hippo signaling pathway, showing significant upregulation of the upstream regulatory factors LIX1-like protein and Protein eiger genes. However, the genes in the Hippo signaling pathway (Mer, Hippo, STK3, Sav, LATS1, Mats, yap1) showed downregulation, while the downstream effectors (actins) were significantly upregulated (Fig. 2B). In addition, some upregulated DEGs (AKT, IRS, Foxo, and mTOR) were also found to be enriched in PI3K/AKT and insulin signaling pathways. Moreover, several immune-related genes, including SVWC domain proteins, c-type lectin domain family 17 (CLEC17A), and c-type mannose receptor 2 (MRC2), showed significant upregulation following LvMmd2 knockdown (Table 2). Furthermore, the expression levels of actin and myosin genes, which are responsible for muscle composition, were found to be significantly upregulated in the hepatopancreas and muscle after LvMmd2 knockdown (Fig. 2A, B).
Table 2.
Expression of growth-related genes in the transcriptome after LvMmd2 knockdown
| Gene no. | Annotation | Log2(fold change) | Regulation | Related pathways |
|---|---|---|---|---|
| LOC113800348 | Ras-related protein M-Ras | 1.08530916696404 | Up | Ras signaling pathway |
| LOC113803395 | Ras-like protein family member 10B | 0.450762057806748 | Up | |
| LOC113812868 | GTP-binding protein Rhes | 1.4662980021518 | Up | |
| LOC113804554 | Mitogen-activated protein kinase 15 | 1.3829435959657 | Up | |
| LOC113801201 | Mitogen-activated protein kinase 1 | 0.42690987456159 | Up | |
| LOC113811918 (MZ-ZXJ-Mmd2-AD-7) | Galactose-specific lectin nattectin-like | 0.178476 | Up | Immune-related gene |
| LOC113820990 (MZ-ZXJ-Mmd2-AD-16) | Ribonuclease kappa-B-like | − 0.27369 | Down | |
| LOC113807266 (MZ-ZXJ-Mmd2-AD-19) | Single VWC domain protein 3 | 1.372891304 | Up | |
| LOC113825092 | C-type lectin domain family 17 | 4.032764854 | Up | |
| LOC113804438 | C-type mannose receptor 2 | 2.82362366 | Up | |
| LOC113813212 | LIX1-like protein | 1.456045 | Up | Hippo signaling pathway upstream regulatory genes |
| LOC113803068 | Protein eiger | 1.751146 | Up | |
| LOC113801638 | Mer | − 0.35699 | Down | Hippo signaling pathway-related genes |
| LOC113816519 | hippo | − 0.28407 | Down | |
| LOC113809965 | STK3 | − 0.094078 | Down | |
| LOC113804778 | Sav | − 0.36141 | Down | |
| LOC113801272 | LATS1 | − 0.05612 | Down | |
| LOC113821688 | Mats | − 0.16578 | Down | |
| LOC113804912 | yap1 | − 0.19537 | Down | |
| LOC113804918 | yap1 | − 0.072591 | Down | |
| LOC113803355 | Actin-57B | 4.54572563207977 | Up | Hippo signaling pathway downstream effector genes |
| LOC113803358 | Actin-57B | 3.54281904464244 | Up | |
| LOC113815117 | Actin, muscle | 2.15251766783627 | Up | |
| LOC113815142 | Actin-2, muscle-specific | 3.29156325220765 | Up | |
| LOC113819252 | Actin-3, muscle-specific | 4.95769196309714 | Up | |
| LOC113812859 | RAC serine/threonine-protein kinase(Akt1) | 0.0665002261071522 | Up | PI3K/AKT signaling pathway and insulin/IGF signaling pathway |
| LOC113821147 | Insulin receptor substrate 1(IRS) | 0.405799142101389 | Up | |
| LOC113820016 | Forkhead box protein O(FOXO) | 0.0575144545810142 | Up | |
| LOC113820097 | Serine/threonine-protein kinase mTOR | 0.122467578651863 | Up |
Fig. 2.
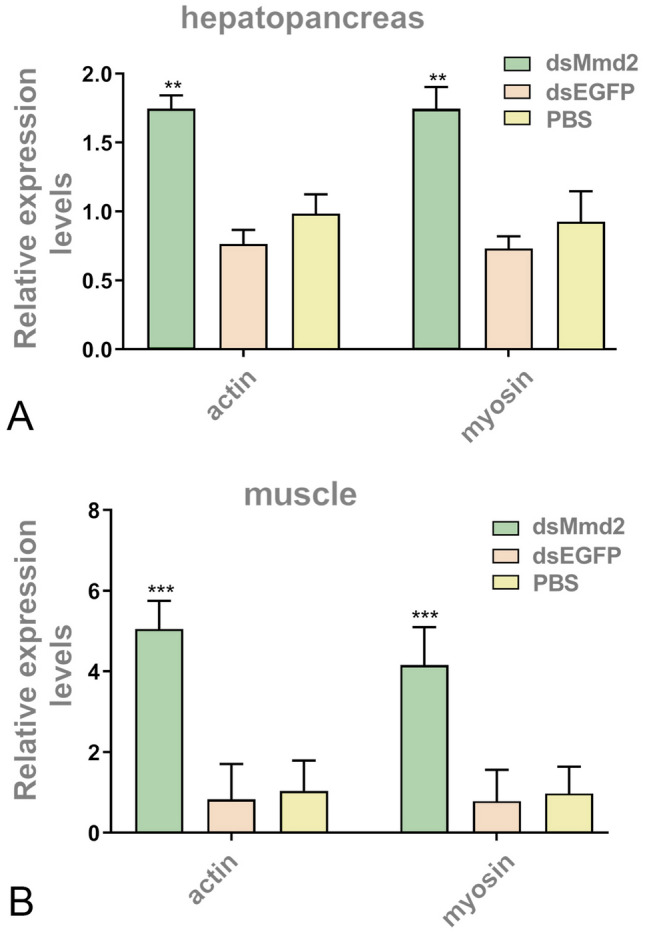
Expression of growth-related genes. A Expression of actin and myosin genes in hepatopancreas (n = 36). B The expression of actin and myosin genes in muscle (n = 36). The results were shown as mean values ± SD. Significant differences of the gene expression levels are shown as **P < 0.01 and ***P < 0.001
The role of LvMmd2 in regulating Ras signaling pathway
STRING predicted that there was an interaction between LvMmd2 (PAQR10) and its homologous protein LvPAQR3 (Fig. 3A). The results of expression analysis showed significant downregulation of LvPAQR3 expression after LvMmd2 knockdown (Fig. 3B). In addition, it was observed that shrimp with a slow growth rate had higher expression of LvPAQR3 compared to those with a fast growth rate in Family 21253 (Fig. 3C). The co-immunoprecipitation results showed an interaction between LvMmd2 and LvPAQR3-ΔC (Fig. 4A, B). Furthermore, the interaction between LvMmd2 and LvPAQR3-ΔC was also supported through MbY2H (Fig. 4C). Yeast cells expressing β-galactosidase turned blue when incubated with X-gal or a similar substrate (Fig. 4D).
Fig. 3.

Effect of LvMmd2 on LvPAQR3. A Genes predicted to interact with LvMmd2 on String website (https://cn.string-db.org/). B Expression of LvPAQR3 in muscle tissue after dsMmd2 interference (n = 36). C Expression of LvPAQR3 in fast- and slow-growing shrimp muscle tissue of Family 21253 (n = 10). The results were shown as mean values ± SD. Significant differences of the gene expression levels are shown as *P < 0.05
Fig. 4.

Interaction of LvMmd2 with its homolog LvPAQR3. A Protein structure model of LvPAQR3. B Co-immunoprecipitation assay of LvMmd2 and LvPAQR3-ΔC. C Yeast two-hybrid assay of LvMmd2 and LvPAQR3-ΔC. D One-to-one validation of yeast two-hybrid assay of LvMmd2 and LvPAQR3-ΔC
The co-immunoprecipitation result showed that LvPAQR3-ΔXb interacted with LvRaf1-ΔSTKC (Fig. 5C). The LvRho gene, which was significantly downregulated in the LvMmd2 RNAi transcriptome, was cloned and expressed in Sf9 insect cells. The co-immunoprecipitation result showed an interaction between LvRho and LvMmd2 (Fig. 5D), indicating that LvMmd2 can directly affect the Ras signaling pathway by interacting with LvRho (Fig. 5E).
Fig. 5.

LvMmd2 affects Ras signaling pathway. A Protein structure model of LvPAQR3. B Protein structure model of LvRaf1. C Co-immunoprecipitation result of interaction between LvRaf1-ΔSTKC and LvPAQR3-ΔXb. D Co-immunoprecipitation result of interaction between LvMmd2 and LvRho. E LvMmd2 directly or indirectly regulates Ras signaling pathway
Subcellular co-location of LvMmd2 and LvPAQR3
The results of subcellular co-location further investigated the subcellular localization of LvMmd2 and LvPAQR3. In the negative control group, the green and red fluorescence signals expressed by pDhsp-70-EGFP-flag-His and pDhsp-70-mCherry-V5-His, respectively, were evenly distributed in the cytoplasm of sf9 insect cells (Fig. 6A) However, LvMmd2-EGFP protein fluorescence signals were found to aggregate into bright spots in sf9 insect cells by co-transfecting with pDhsp-70-LvMmd2-EGFP-flag-His and pDhsp-70-mCherry-V5-His (Fig. 6B), while the mCherry fluorescence signals were still evenly distributed in the cytoplasm. When pDhsp-70-EGFP-flag-His and pDhsp-70-LvPAQR3-ΔC-mCherry-V5-His were co-transfected into sf9 insect cells, the fluorescence signals were evenly distributed in the cytoplasm, similar to the negative control (Fig. 6C). However, when pDhsp-70-LvMmd2-EGFP-flag-His and pDhsp-70-LvPAQR3-ΔC-mCherry-V5-His were co-transfected, the green and red fluorescence signals aggregated into bright spots in sf9 insect cells (Fig. 6D).
Fig. 6.
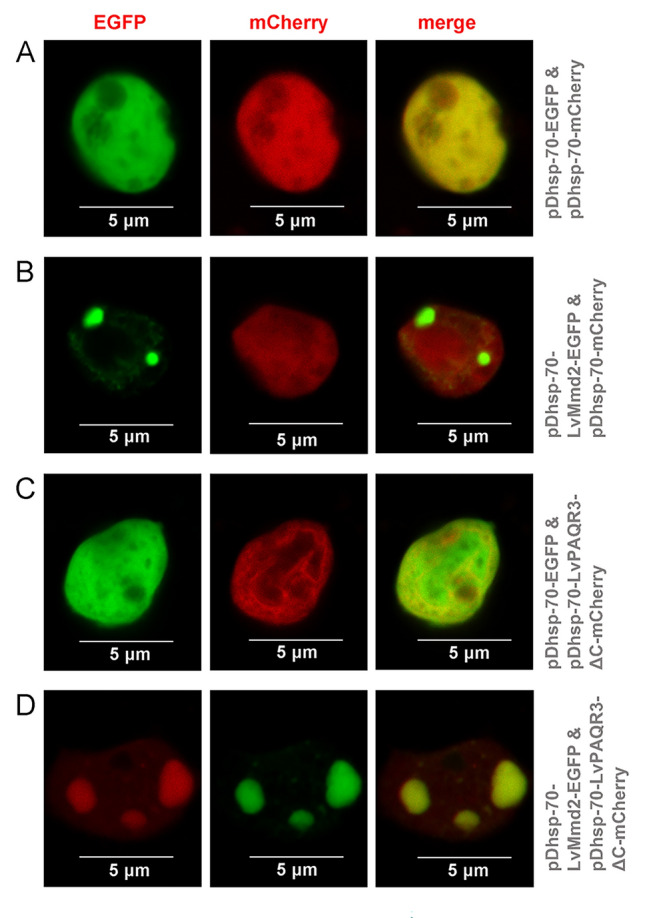
Subcellular co-location of LvMmd2 and LvPAQR3. A Subcellular location of EGFP and mCherry. B Subcellular location of LvMmd2 and mCherry. C Subcellular location of EGFP and LvPAQR3. D Subcellular location of LvMmd2 and LvPAQR3
LvMmd2-EGFP was observed to be distributed in dots in the sf9 insect cells, which exhibited a pattern similar to the Golgi labeled with Golgi Tracker Red (Supplementary Fig. S3).
Other genes interacting with LvMmd2
LvMmd2-pBT3-STE and the yeast library from L. vannamei were co-transformed into the yeast strain NMY51, and a total of 21 positive candidate clones were obtained (Supplementary Table S6). The annotations of these clones were summarized into nine candidate genes (Table 3). These genes were further indicated to interact with LvMmd2 through one-to-one rotation support with LvMmd2-pBT3-STE (Supplementary Fig. S1). The genes include myotrophin-like, cuticular protein 47Eg-like, galactose-specific lectin nattectin-like, ribonuclease kappa-B-like, single VWC domain protein, translocon-associated protein subunit gamma-like, signal peptidase complex subunit 2 isoform X2, rhodopsin and NADH-ubiquinone oxidoreductase chain 1-like.
Table 3.
The nine positive clones interacting with LvMmd2 screened by yeast two-hybrid assay
| Gene number | Gene name | E_value | Genbank accession no. | Pairwise QDOX-gal + 1 mM 3-AT |
|---|---|---|---|---|
| Mmd2-AD-7 | Galactose-specific lectin nattectin-like | 2.42854E−63 | XP_027219573.1 | Blue |
| Mmd2-AD-8 | Myotrophin-like | Inf | XM_027355709.1 | Blue |
| Mmd2-AD-13 | Cuticular protein 47Eg-like | 1.69273E−34 | XP_027213691.1 | Blue |
| Mmd2-AD-16 | Ribonuclease kappa-B-like | 4.73362E−58 | XP_027229213.1 | Blue |
| Mmd2-AD-18 | Translocon-associated protein subunit gamma-like | 4.6811E-111 | XP_027232600.1 | Blue |
| Mmd2-AD-19 | Single VWC domain protein | 6.01705E−67 | XP_027214279.1 | Blue |
| Mmd2-AD-20 | Signal peptidase complex subunit 2 isoform X2 | 2.3967E−134 | XP_027214317.1 | Blue |
| Mmd2-AD-22 | Rhodopsin | 0 | ROT66570.1 | Blue |
| Mmd2-AD-26 | NADH-ubiquinone oxidoreductase chain 1-like | 3.0659E−172 | XP_027228409.1 | Blue |
Discussion
LvMmd2 is a growth-inhibiting gene
LvMmd2, identified as a growth-related gene (Wang et al. 2020), is a conserved membrane protein gene whose knockdown significantly increases shrimp growth, indicating its inhibitory role (Si et al. 2023). Here, we explored the molecular mechanism by which LvMmd2 regulates shrimp growth by validating its expression and genotyping within a family with varying growth rates. We observed higher levels of LvMmd2 expression were observed in the slow-growing group, with the AG/TC genotype predominating in this group and GG/CC being more common in the fast-growing group. This supports the prediction of LvMmd2 is a growth-inhibiting gene (Si et al. 2023). Since marker ref-259780-6 is located in the intron region of LvMmd2 and MMD_5 is located in the fourth exon of LvMmd2, further research is needed to elucidate the relationship between the location of causative loci and LvMmd2 expression.
LvMmd2 affects Ras signaling pathway
In our previous study, we identified the Ras signaling pathway as a critical pathway affected by LvMmd2 knockdown (Si et al. 2023). To explore the impact of LvMmd2 on Ras signaling pathway in shrimp, we conducted protein interaction assays and found a potential interaction between Mmd2 and its homolog PAQR3. Furthermore, LvPAQR3 expression decreased after LvMmd2 knockdown (Fig. 3B). Moreover, LvPAQR3 expression was significantly higher in slow-growing shrimp compared to their fast-growing counterparts. CO-IP and MbY2H results indicated the interaction between LvMmd2 and LvPAQR3 at both molecular and cellular levels. Fluorescence co-localization studies showed LvMmd2 increased the retention of LvPAQR3-ΔC in the Golgi apparatus, suggesting an interaction that promotes its aggregation. Previous research has demonstrated that PAQR3 regulates the Ras signaling pathway by trapping Raf1 (Fan et al. 2008; Feng et al. 2007). Our CO-IP results further revealed that LvPAQR3-ΔXb interacts with LvRaf1-ΔSTKC in sf9 insect cells. In conclusion, LvMmd2 interacts with LvPAQR3, and LvPAQR3 interacts with LvRaf1. Therefore, LvMmd2 may affect the capture of Raf1 by interacting with LvPAQR3, thus indirectly regulating the Ras signaling pathway in shrimp.
Besides its indirect effect through PAQR3, LvMmd2 may directly influence the Ras signaling pathway in shrimp. Jin et al. (2012a) have reported the interaction between PAQR10 and Ras in the human cell Golgi apparatus, leading to the activation of the ERK signaling pathway. This discovery has identified PAQR10 as a new class of Ras modulators. In mammals, Mmd2 directly interacts with the three Ras family members HRas, NRas, and KRas4A in regulating the Ras signaling pathway (Jin et al. 2012b). Ras, as a major upstream regulator, plays a crucial role in maintaining organismal homeostasis (Khan et al. 2019). Interestingly, our study found an interaction between LvMmd2 and LvRho (a member of the Ras superfamily). LvRho, which is significantly downregulated after LvMmd2 knockdown, is known to regulate the actin cytoskeleton (Khosravi-Far and Der 1994). These results suggest that LvMmd2 may also regulate shrimp growth by directly affecting the Ras signaling pathway.
LvMmd2 affects shrimp growth through PAQR3 and Raf1
PAQR3 plays crucial roles in growth-related signaling pathways and is a key regulator of inflammation and metabolism, negatively regulating the PI3K/AKT signaling pathway. PI3K/AKT, central to the insulin signaling pathway, regulates glucose and lipid metabolism (Xiao et al. 2022). In diabetic patients, PAQR3 is upregulated, which shunts p110a to the Golgi apparatus, preventing p110a from forming a PI3K complex with p85a and thus negatively regulating the insulin signaling pathway (Qiao et al. 2021). In this study, when LvMmd2 was knocked down, the expression of LvPAQR3 also decreased (Fig. 3B), and the genes related to PI3K/AKT and insulin signaling pathway were upregulated, such as Akt, IRS, Foxo, and mTOR (Table 2). These findings may explain why LvMmd2 affects the growth of L. vannamei.
As a homolog of Mmd2 (PAQR10), PAQR3 has been reported to regulate the Ras signaling pathway by recruiting Raf1 (Feng et al. 2007). When LvPAQR3 expression decreases, more LvRaf1 may be released to participate in other signaling pathways. Raf1 may also play an important role in the growth of organisms. Raf1 is a negative regulator of apoptosis (Nolan et al. 2021). Raf1 can inhibit apoptosis in two different activation states: by binding MST2 when inactivated and by binding ASK1 when activated (Alavi et al. 2007; Dhillon et al. 2002). Raf1 was found to inhibit ASK1 pro-apoptotic signaling through overexpression (Chen et al. 2001). Moreover, Raf1 can bind to and inhibit the activation of MST2 kinase, thereby suppressing MST2-mediated apoptosis (O'Neill et al. 2005). MST2 kinase serves as an upstream regulator of Hippo signaling pathway to inhibit cell growth (Aihara et al. 2022; García-Gutiérrez et al. 2022). In the LvMmd2 RNAi transcriptome, the upregulation of upstream inhibitor genes of the Hippo signaling pathway, Lft (Lix1) and Egr, suggests pathway inhibition. The downregulation of Mer, Hippo (hpo, STK3), Salvador (sav), Warts (LATS1), Mats, and Yki (Yap1) further indicates suppressed Hippo signaling pathway after LvMmd2 knockdown (Table 2). In addition, Raf1 was reported to promote cell survival by inactivating BAD through direct phosphorylation (Wang et al. 1996). It acts as an adaptor protein, facilitating BAD binding to protein kinase theta (PKCθ), which phosphorylates and subsequently inactivates BAD (Hindley and Kolch 2007). Therefore, Raf1 can inhibit cell apoptosis through three mechanisms.
In addition, Raf1 is involved in various signaling pathways related to cell growth. It facilitates cell proliferation and migration, as well as protects cells from DNA damage. Raf1 interacts with ROK-α, inhibiting its kinase activity, which subsequently activates STAT3 and MYC, leading to cell dedifferentiation (Nolan et al. 2021). Conversely, the binding of RHO to ROK-α alleviates Raf1’s inhibitory effect, thereby promoting cell migration and differentiation through EZRIN (Ehrenreiter et al. 2005, 2009). Unlike its inhibitory interactions with MST2, ASK1, or ROK-α, Raf1 enhances PLK1 activation, thus promoting cell division (Nolan et al. 2021). Besides, Raf1 binds to the Ser/Thr kinase CHK2, promoting DNA repair and safeguarding cells from DNA damage (Zannini et al. 2014).
In conclusion, our results suggest that LvMmd2 not only controls shrimp muscle growth through PAQR3 and Raf1 but also regulates various cellular processes, such as cell proliferation, migration and differentiation, as well as protects cells from DNA damage (Fig. 7).
Fig. 7.
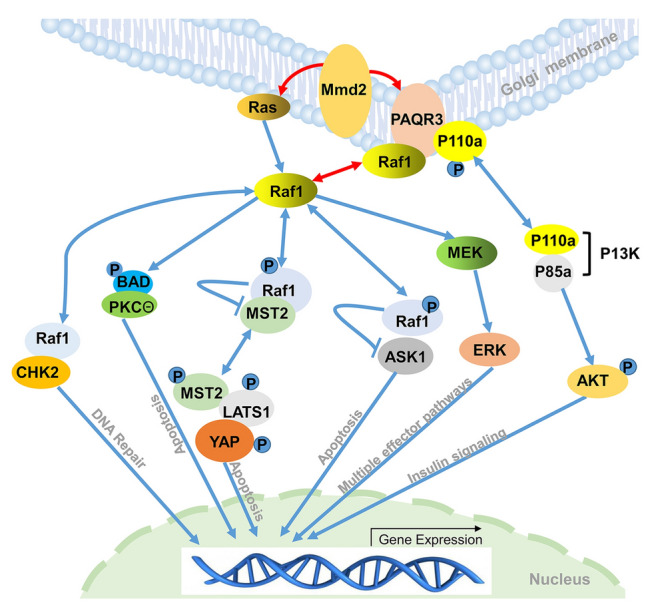
Deduced signaling pathways regulated by LvMmd2. The blue lines indicate that the relationship was demonstrated by other researchers, and the red lines indicate that the relationship was demonstrated in this study
LvMmd2 affects the shrimp growth through other aspects
Our previous transcriptome analyses suggested that LvMmd2 may affect growth, immunity, and metabolism in shrimp (Si et al. 2023). In the present study, the MbY2H results indicated that LvMmd2 interacts with multiple proteins related to shrimp growth and immunity. Among them, myotrophin and cuticular protein are associated with muscle formation, growth, and molting in shrimp. Galactose-specific lectin nattectin-like, ribonuclease kappa-B-like, and single VWC domain protein are related to the immune response of shrimp. Translocon-associated protein subunit gamma-like and signal peptidase complex subunit 2 play roles in protein transport, synthesis, and modification. In addition, LvMmd2 also interacts with rhodopsin and NADH-ubiquitin oxidoreductase chain 1-like.
LvMmd2 not only enhances shrimp growth and suppresses cell apoptosis by interacting with Raf1, Ras, and Hippo signaling pathways, but also has connections with other genes related to shrimp growth. In Simmental beef cattle, myotrophin has been identified as a candidate gene for muscle development and net meat weight (NMW). It promotes skeletal muscle cell differentiation and skeletal muscle hypertrophy (Bordbar et al. 2020). Porcine S-myotrophin leads to the hypertrophy of skeletal muscle cells through the accumulation of muscle structural proteins (Hayashi et al. 1998, 2001). In addition, S-myotrophin can also increase the production of fast myosin in mice (Shiraishi et al. 2006). In L. vannamei, LvMmd2 interacts with myotrophin, potentially increasing the accumulation of muscle structural proteins and promoting the growth of muscle fibers in shrimp. It was observed in the LvMmd2 RNAi transcriptome that multiple actin and myosin genes were significantly upregulated (Fig. 2).
The cuticle is primarily composed of chitin and cuticular proteins (CPs) (Pan et al. 2018). The CPs influence cuticle structure during insect growth, reproduction, and environmental adaptation processes (Xie et al. 2022). In the LvMmd2 RNAi transcriptome, the significantly upregulated gene enrichment reveals biological functions in chitin metabolism and morphogenesis (Si et al. 2023). The results of MbY2H demonstrated the interaction between LvMmd2 and CPs, suggesting that LvMmd2 potentially affects cuticle formation and chitin metabolism in shrimp.
LvMmd2 may also affect shrimp growth by regulating the immune system. C-type lectin-nattectin-like protein (CaNTC) binds to pathogen-associated molecular patterns (PAMPs) (Lopes-Ferreira et al. 2021) and participates in antibacterial and antiviral immunity (Wang et al. 2017). EsSVWC helps to resist bacterial infection and improve survival (Qin et al. 2022). Ribonuclease kappa-B-like (Rnasek-b) is specifically expressed in hepatopancreas, gills, and hemocytes, which are all immune-related organs in L. vannamei (Supplementary Fig. S2). In our MbY2H results, the galactose-specific lectin nattectin-like, the ribonuclease kappa-B-like, and a single VWC domain protein interacted with LvMmd2. The expression of these three genes was significantly upregulated after LvMmd2 knockdown. In addition, many other immune-related genes, such as C-type lectin family member 17 and C-type mannose receptor 2, were also significantly upregulated in the LvMmd2 RNAi transcriptome (Table 2). These results indicate that LvMmd2 is involved in shrimp immunity. Therefore, LvMmd2 may also impact shrimp growth by regulating the immune system.
LvMmd2 also interacts with proteins involved in protein transport, synthesis, and modification, such as translocon-associated protein subunit gamma-like (TRAPγl). The translocon-associated protein (TRAP) complex facilitates the insertion or translocation of newly synthesized proteins in eukaryotic cells (Li et al. 2005). In addition, LvMmd2 may also be present in the Golgi apparatus, which serves as the primary location for protein processing and modification. Therefore, LvMmd2 may interact with the translocon-associated protein and the signal peptidase complex subunit 2, contributing to protein processing and modification in the Golgi apparatus.
In this study, we found that LvMmd2 regulates the growth of L. vannamei through multiple mechanisms, including the Ras, Hippo, and insulin signaling pathways, which are crucial in crustacean biological processes. Understanding the role of Mmd2 in these pathways is conducive to gradually elucidating the regulation of the Ras, Hippo, and insulin signaling pathways on shrimp growth. Through further research, we hope to uncover more about the mechanisms of the Mmd2 gene in the growth and development of L. vannamei and apply this knowledge to improve the growth efficiency of shrimp.
Conclusion
This study provides a preliminary analysis of the molecular mechanisms through which LvMmd2 regulates the growth of L. vannamei. LvMmd2 is found to be located in the Golgi apparatus, where it interacts with LvPAQR3 and LvRho. Furthermore, LvPAQR3 interacts with LvRaf1. LvMmd2 is involved in regulating the Ras, PI3K/AKT, Hippo, and insulin signaling pathways, ultimately affecting cell proliferation and differentiation. Moreover, the interaction between LvMmd2 and other proteins related to immunity, growth, and protein modification suggests that it regulates growth through multiple mechanisms. These findings lay a foundation for further studies on the role of the Mmd2 gene in the growth of shrimp and crustaceans in general.
Supplementary information
Below is the link to the electronic supplementary material.
Acknowledgements
This study was funded by the National Key R&D Program of China (2022YFF1000304), the National Natural Sciences Foundation of China (32273102 and 31972782), the Strategic Priority Research Program of the Chinese Academy of Sciences (Grant No. XDA24030105), and the Taishan Scholars Program. We thank Dr. Mingzhe Sun, Dr. Xuechun Li, Dr. Xinjia Lv, Dr. Quanchao Wang, Dr. Zhenning Bao, Ms. Yanting Xia, Mr. Ruigang Niu and Mr. Junqing Yang for their help in the sampling, experiments and data analyses. This study was supported by the Oceanographic Data Center, IOCAS.
Author contributions
XJZ and FL conceived and designed the study, SS and XJZ conducted the experiments and data analyses and wrote the manuscript, and YY collected the experiment materials. XXZ, XYZ, JY, and KHC revised the manuscript. All authors have read and agreed to the published version of the manuscript.
Data availability
The data presented in the study are deposited in the NCBI Sequence Read Archive (https://www.ncbi.nlm.nih.gov/sra), accession numbers: PRJNA918508, SRR22981843-SRR22981848.
Declarations
Conflict of interest
The authors declare that they have no conflict of interest.
Animal and human rights statement
The animal study was reviewed and approved by the Ethics Committee [2020(37)] of the Institute of Oceanology, Chinese Academy of Sciences. We declare that all animal experiments in this study were conducted in accordance with the guidelines of the UK Animals Act, 1986 and EU Directive 2010/63/EU. This work does not contain any studies with human participants.
References
- Aihara A, Iwawaki T, Abe-Fukasawa N, Otsuka K, Saruhashi K, Mikashima T, Nishino T (2022) Small molecule LATS kinase inhibitors block the Hippo signaling pathway and promote cell growth under 3D culture conditions. J Biol Chem 298:101779 [DOI] [PMC free article] [PubMed] [Google Scholar]
- Alavi A, Acevedo L, Min W, Cheresh D (2007) Chemoresistance of endothelial cells induced by basic fibroblast growth factor depends on Raf-1-mediated inhibition of the proapoptotic kinase, ASK1. Cancer Res 67:2766–2772 [DOI] [PubMed] [Google Scholar]
- Baida GE, Kuzmin NP (1995) Cloning and primary structure of a new hemolysin gene from Bacillus cereus. Biochim Biophys Acta 1264:151–154 [DOI] [PubMed] [Google Scholar]
- Baida GE, Kuzmin NP (1996) Mechanism of action of hemolysin III from Bacillus cereus. Biochim Biophys Acta 1284:122–124 [DOI] [PubMed] [Google Scholar]
- Bordbar F, Jensen J, Abied A, Guo W, Xu L, Gao H-J, Zhang L, Li J (2020) Identification and validation of a novel candidate gene regulating net meat weight in Simmental beef cattle based on imputed next-generation sequencing. Cell Prolif 53:e12870 [DOI] [PMC free article] [PubMed] [Google Scholar]
- Cass LA, Meinkoth JL (1998) Differential effects of cyclic adenosine 3’,5’-monophosphate on p70 ribosomal S6 kinase. Endocrinology 139:1991–1998 [DOI] [PubMed] [Google Scholar]
- Chen J, Fujii K, Zhang L, Roberts T, Fu H (2001) Raf-1 promotes cell survival by antagonizing apoptosis signal-regulating kinase 1 through a MEK-ERK independent mechanism. Proc Natl Acad Sci USA 98:7783–7788 [DOI] [PMC free article] [PubMed] [Google Scholar]
- Cheng J, Chan TY, Zhang N, Sun S, Zhongli S (2018) Mitochondrial phylogenomics reveals insights into taxonomy and evolution of penaeoidea (Crustacea: Decapoda). Zool Scr 47:582–594 [Google Scholar]
- Crespo P, Leon J (2000) Ras proteins in the control of the cell cycle and cell differentiation. Cell Mol Life Sci 57:1613–1636 [DOI] [PMC free article] [PubMed] [Google Scholar]
- De Grave S, Fransen C (2011) Carideorum catalogus: the recent species of the dendrobranchiate, stenopodidean, procarididean and caridean shrimps (Crustacea: Decapoda). Zoologische Mededelingen 85:195–588 [Google Scholar]
- Dhillon AS, Meikle S, Yazici Z, Eulitz M, Kolch W (2002) Regulation of Raf-1 activation and signalling by dephosphorylation. EMBO J 21:64–71 [DOI] [PMC free article] [PubMed] [Google Scholar]
- Ehrenreiter K, Piazzolla D, Velamoor V, Sobczak I, Small J, Takeda J, Leung T, Baccarini M (2005) Raf-1 regulates rho signaling and cell migration. J Cell Biol 168:955–964 [DOI] [PMC free article] [PubMed] [Google Scholar]
- Ehrenreiter K, Kern F, Velamoor V, Meissl K, Galabova G, Sibilia M, Baccarini M (2009) Raf-1 addiction in Ras-induced skin carcinogenesis. Cancer Cell 16:149–160 [DOI] [PubMed] [Google Scholar]
- Fan F, Feng L, He J, Wang X, Jiang X, Zhang Y, Wang Z, Chen Y (2008) RKTG sequesters B-Raf to the golgi apparatus and inhibits the proliferation and tumorigenicity of human malignant melanoma cells. Carcinogenesis 29:1157–1163 [DOI] [PubMed] [Google Scholar]
- Feng L, Xie X, Ding Q, Luo X, He J, Fan F, Liu W, Wang Z, Chen Y (2007) Spatial regulation of Raf kinase signaling by RKTG. Proc Natl Acad Sci USA 104:14348–14353 [DOI] [PMC free article] [PubMed] [Google Scholar]
- García-Gutiérrez L, Fallahi E, Aboud N, Quinn N, Matallanas D (2022) Interaction of LATS1 with SMAC links the MST2/Hippo pathway with apoptosis in an IAP-dependent manner. Cell Death Dis 13:692 [DOI] [PMC free article] [PubMed] [Google Scholar]
- Hayashi T, Takeshita K, Tsuchida N, Kitano K, Kawabata S, Iwanaga S, Ito T (1998) Purification of a novel muscle cell growth factor S-myotrophin from porcine skeletal muscle. Int J Biochem Cell Biol 30:897–908 [DOI] [PubMed] [Google Scholar]
- Hayashi T, Ogawa T, Sato M, Tsuchida N, Fotovati A, Iwamoto H, Ikeuchi Y, Cassens RG, Ito T (2001) S-myotrophin promotes the hypertrophy of myotube as insulin-like growth factor-I does. Int J Biochem Cell Biol 33:831–838 [DOI] [PubMed] [Google Scholar]
- Hindley A, Kolch W (2007) Raf-1 and B-Raf promote protein kinase C theta interaction with BAD. Cell Signal 19:547–555 [DOI] [PubMed] [Google Scholar]
- Hüser M, Luckett J, Chiloeches A, Mercer K, Iwobi M, Giblett S, Sun XM, Brown J, Marais R, Pritchard C (2001) MEK kinase activity is not necessary for Raf-1 function. EMBO J 20:1940–1951 [DOI] [PMC free article] [PubMed] [Google Scholar]
- Jin T, Ding Q, Huang H, Xu D, Jiang Y, Zhou B, Li Z, Jiang X, He J, Liu W, Zhang Y, Pan Y, Wang Z, Thomas WG, Chen Y (2012a) PAQR10 and PAQR11 mediate Ras signaling in the Golgi apparatus. Cell Res 22:661–676 [DOI] [PMC free article] [PubMed] [Google Scholar]
- Jin T, Xu D, Ding Q, Zhang Y, Mao C, Pan Y, Wang Z, Chen Y (2012b) Identification of the topology and functional domains of PAQR10. Biochem J 443:643–653 [DOI] [PubMed] [Google Scholar]
- Jin Y, Ha N, Forés M, Xiang J, Gläßer C, Maldera J, Jimenez G, Edgar B (2015) EGFR/Ras signaling controls Drosophila intestinal stem cell proliferation via capicua-regulated genes. PLoS Genet 11:e1005634 [DOI] [PMC free article] [PubMed] [Google Scholar]
- Kamimura M, Meier K, Cavalli R, Laurino J, Maggioni R, Marins L (2008) Characterization of growth-related genes in the south-western Atlantic pink shrimp Farfantepenaeus paulensis (Pérez-Farfante 1967) through a modified DDRT-PCR protocol. Aquac Res 39:200–204 [Google Scholar]
- Khan AQ, Kuttikrishnan S, Siveen KS, Prabhu KS, Shanmugakonar M, Al-Naemi HA, Haris M, Dermime S, Uddin S (2019) Ras-mediated oncogenic signaling pathways in human malignancies. Semin Cancer Biol 54:1–13 [DOI] [PubMed] [Google Scholar]
- Khosravi-Far R, Der CJ (1994) The ras signal transduction pathway. Cancer Metastasis Rev 13:67–89 [DOI] [PubMed] [Google Scholar]
- Lee SJ, McPherron AC (2001) Regulation of myostatin activity and muscle growth. Proc Natl Acad Sci USA 98:9306–9311 [DOI] [PMC free article] [PubMed] [Google Scholar]
- Lee JY, Hopkinson NS, Kemp PR (2011) Myostatin induces autophagy in skeletal muscle in vitro. Biochem Biophys Res Commun 415:632–636 [DOI] [PubMed] [Google Scholar]
- Li D-H, Chan T, Satow R, Komozaki S, Hashizume K, Asashima M (2005) The role of XTRAP-gamma in Xenopus pronephros development. Int J Dev Biol 49:401–448 [DOI] [PubMed] [Google Scholar]
- Livak KJ, Schmittgen TD (2001) Analysis of relative gene expression data using real-time quantitative PCR and the 2(-delta delta C(T)) method. Methods 25:402–408 [DOI] [PubMed] [Google Scholar]
- Lopes-Ferreira M, Sosa-Rosales I, da Silva JP, Conceição K, Maleski A, Balan-Lima L, Disner G, Lima C (2021) Molecular characterization and functional analysis of the nattectin-like toxin from the venomous fish Thalassophryne maculosa. Toxins (Basel) 14:2 [DOI] [PMC free article] [PubMed] [Google Scholar]
- Lyu D, Yu Y, Wang Q, Luo Z, Zhang Q, Zhang X, Xiang J, Li F (2021) Identification of growth-associated genes by genome-wide association study and their potential application in the breeding of pacific white shrimp (Litopenaeus vannamei). Front Genet 12:611570 [DOI] [PMC free article] [PubMed] [Google Scholar]
- Nolan A, Aboud N, Kolch W, Matallanas D (2021) Hidden targets in Raf signalling pathways to block oncogenic Ras signalling. Genes 12:553 [DOI] [PMC free article] [PubMed] [Google Scholar]
- O’Neill E, Rushworth L, Baccarini M, Kolch W (2005) Role of the kinase MST2 in suppression of apoptosis by the proto-oncogene product Raf-1. Science 306:2267–2270 [DOI] [PubMed] [Google Scholar]
- Pan P-L, Ye Y-X, Lou Y-H, Lu J-B, Cheng C, Shen Y, Moussian B, Zhang C-X (2018) A comprehensive omics analysis and functional survey of cuticular proteins in the brown planthopper. Proc Natl Acad Sci USA 115:5175–5180 [DOI] [PMC free article] [PubMed] [Google Scholar]
- Qiao S, Yang D, Li X, Li W, Zhang Y, Liu W (2021) Silencing PAQR3 protects against oxygen-glucose deprivation/reperfusion-induced neuronal apoptosis via activation of PI3K/AKT signaling in PC12 cells. Life Sci 265:118806 [DOI] [PubMed] [Google Scholar]
- Qin Y, Luo Z, Zhao K, Nan X, Guo Y, Li W, Wang Q (2022) A new SVWC protein functions as a pattern recognition protein in antibacterial responses in Chinese mitten crab (Eriocheirsinensis). Fish Shellfish Immunol 131:1125–1135 [DOI] [PubMed] [Google Scholar]
- Shiraishi S, Nakamura Y-N, Iwamoto H, Haruno A, Sato Y, Mori S, Ikeuchi Y, Chikushi J, Hayashi T, Sato M, Cassens RG, Ito T (2006) S-myotrophin promotes the hypertrophy of skeletal muscle of mice in vivo. Int J Biochem Cell Biol 38:1114–1122 [DOI] [PubMed] [Google Scholar]
- Si S, Zhang X, Yu Y, Zhang X, Zhong X, Yuan J, Yang S, Li F (2023) Structure and function analyses of the Mmd2 gene in pacific white shrimp Litopenaeus vannamei. Front Genet 14:1151193 [DOI] [PMC free article] [PubMed] [Google Scholar]
- Storch J, Thumser AE (2010) Tissue-specific functions in the fatty acid-binding protein family. J Biol Chem 285:32679–32683 [DOI] [PMC free article] [PubMed] [Google Scholar]
- Tang YT, Hu T, Arterburn M, Boyle B, Bright JM, Emtage PC, Funk WD (2005) PAQR proteins: a novel membrane receptor family defined by an ancient 7-transmembrane pass motif. J Mol Evol 61:372–380 [DOI] [PubMed] [Google Scholar]
- Thomas P, Pang Y, Dong J, Groenen P, Kelder J, Vlieg J, Zhu Y, Tubbs C (2007) Steroid and G protein binding characteristics of the seatrout and human progestin membrane receptor alpha subtypes and their evolutionary origins. Endocrinology 148:705–718 [DOI] [PubMed] [Google Scholar]
- Wang H-G, Rapp UR, Reed JC (1996) Bcl-2 targets the protein kinase Raf-1 to mitochondria. Cell 87:629–638 [DOI] [PubMed] [Google Scholar]
- Wang L, Zhang J, Kong X, Zhao X, Pei C, Li L (2017) A c-type lectin, nattectin-like protein (CaNTC) in qihe crucian carp Carassius auratus: binding ability with LPS, PGN and various bacteria, and agglutinating activity against bacteria. Fish Shellfish Immunol 67:382–392 [DOI] [PubMed] [Google Scholar]
- Wang Q, Yu Y, Zhang Q, Zhang X, Yuan J, Huang H, Xiang J, Li F (2019) A novel candidate gene associated with body weight in the pacific white shrimp Litopenaeus vannamei. Front Genet 10:520 [DOI] [PMC free article] [PubMed] [Google Scholar]
- Wang Q, Yu Y, Zhang Q, Luo Z, Zhang X, Xiang J, Li F (2020) The polymorphism of LvMmd2 and its association with growth traits in Litopenaeus vannamei. Mar Biotechnol 22:564–571 [DOI] [PubMed] [Google Scholar]
- Warren FJ, Royall PG, Gaisford S, Butterworth PJ, Ellis PR (2011) Binding interactions of α-amylase with starch granules: the influence of supramolecular structure and surface area. Carbohydr Polym 86:1038–1047 [Google Scholar]
- Xiao H, Sun X, Lin Z, Yang Y, Zhang M, Xu Z, Liu P, Liu Z, Huang H (2022) Gentiopicroside targets PAQR3 to activate the PI3K/AKT signaling pathway and ameliorate disordered glucose and lipid metabolism. Acta Pharm Sin B 12:2887–2904 [DOI] [PMC free article] [PubMed] [Google Scholar]
- Xie J, Peng G, Wang M, Zhong Q, Song X, Bi J, Tang J, Feng F, Gao H, Li B (2022) RR-1 cuticular protein TcCPR69 is required for growth and metamorphosis in Tribolium castaneum. Insect Sci 29:1612–1628 [DOI] [PubMed] [Google Scholar]
- Yamauchi T, Kamon J, Waki H, Terauchi Y, Kubota N, Hara K, Mori Y, Ide T, Murakami K, Tsuboyama-Kasaoka N, Ezaki O, Akanuma Y, Gavrilova O, Vinson C, Reitman ML, Kagechika H, Shudo K, Yoda M, Nakano Y, Tobe K et al (2001) The fat-derived hormone adiponectin reverses insulin resistance associated with both lipoatrophy and obesity. Nat Med 7:941–946 [DOI] [PubMed] [Google Scholar]
- Yamauchi T, Kamon J, Minokoshi Y, Ito Y, Waki H, Uchida S, Yamashita S, Noda M, Kita S, Ueki K, Eto K, Akanuma Y, Froguel P, Foufelle F, Ferre P, Carling D, Kimura S, Nagai R, Kahn BB, Kadowaki T (2002) Adiponectin stimulates glucose utilization and fatty-acid oxidation by activating AMP-activated protein kinase. Nat Med 8:1288–1295 [DOI] [PubMed] [Google Scholar]
- Yamauchi T, Kamon J, Ito Y, Tsuchida A, Yokomizo T, Kita S, Sugiyama T, Miyagishi M, Hara K, Tsunoda M, Murakami K, Ohteki T, Uchida S, Takekawa S, Waki H, Tsuno NH, Shibata Y, Terauchi Y, Froguel P, Tobe K et al (2003) Cloning of adiponectin receptors that mediate antidiabetic metabolic effects. Nature 423:762–769 [DOI] [PubMed] [Google Scholar]
- Yan Y, Lu X, Kong J, Meng X, Luan S, Dai P, Chen B, Cao B, Luo K (2020) Molecular characterization of myostatin and its inhibitory function on myogenesis and muscle growth in Chinese shrimp, Fenneropenaeus chinensis. Gene 758:144986 [DOI] [PubMed] [Google Scholar]
- Yu Y, Zhang X, Yuan J, Li F, Chen X, Zhao Y, Huang L, Zheng H, Xiang J (2015) Genome survey and high-density genetic map construction provide genomic and genetic resources for the pacific white shrimp Litopenaeus vannamei. Sci Rep 5:15612 [DOI] [PMC free article] [PubMed] [Google Scholar]
- Yu Y, Wang Q, Zhang Q, Luo Z, Wang Y, Zhang X, Huang H, Xiang J, Li F (2019) Genome scan for genomic regions and genes associated with growth trait in pacific white shrimp Litopeneaus vannamei. Mar Biotechnol 21:374–383 [DOI] [PubMed] [Google Scholar]
- Yuan J, Yu Y, Zhang X, Li S, Xiang J, Li F (2023) Recent advances in crustacean genomics and their potential application in aquaculture. Rev Aquac 15:1501–1521 [Google Scholar]
- Zannini L, Delia D, Buscemi G (2014) CHK2 kinase in the DNA damage response and beyond. J Mol Cell Biol 6:442–457 [DOI] [PMC free article] [PubMed] [Google Scholar]
- Zhang X, Yuan J, Sun Y, Li S, Gao Y, Yu Y, Liu C, Wang Q, Lv X, Zhang X, Ma KY, Wang X, Lin W, Wang L, Zhu X, Zhang C, Zhang J, Jin S, Yu K, Kong J et al (2019) Penaeid shrimp genome provides insights into benthic adaptation and frequent molting. Nat Commun 10:356 [DOI] [PMC free article] [PubMed] [Google Scholar]
Associated Data
This section collects any data citations, data availability statements, or supplementary materials included in this article.
Supplementary Materials
Data Availability Statement
The data presented in the study are deposited in the NCBI Sequence Read Archive (https://www.ncbi.nlm.nih.gov/sra), accession numbers: PRJNA918508, SRR22981843-SRR22981848.