

Abstract
A potential strategy to increase agricultural yields and maximize resource use has emerged: smart agriculture. In order to monitor numerous environmental characteristics, wireless sensor networks (WSNs) are essential. Individual sensor data may be noisy, redundant, and not correctly reflect the status of the farm as a whole. The energy constraints of WSN nodes and the need for accurate event detection, however, make it difficult to develop reliable and efficient systems. This research proposes a fresh approach to these issues by using hierarchical clustering-based dynamic data fusion techniques for WSNs in smart agriculture. In order to increase energy efficiency and event detection precision in smart agriculture, this study suggests employing dynamic data fusion for WSNs that is based on hierarchical clustering. The hierarchical clustering technique is used initially in the suggested method to group sensor nodes into clusters. A dynamic data fusion method is used to collect and fuse data inside each cluster, generating indicative information about the cluster’s status. This guarantees effective network resource utilization while minimizing data redundancy. In order to classify and anticipate events, the Extreme Learning Machine (ELM) technology is also used, allowing for the real-time identification of key events. The experimental outcomes show considerable increases in energy effectiveness and event detection precision, which makes this strategy an important contribution to the field of smart agriculture. The proposed model is implemented in Python software and has an accuracy of about 99.54% which is 1.81% higher than other existing methods like CH selection, K- prediction and data aggregation.
Keywords: Smart agriculture, WSN, Clustering, Dynamic data fusion, Event detection
Subject terms: Agroecology, Engineering, Mathematics and computing
Introduction
WSNs have become a game-changing technology in the field of smart agriculture, revolutionizing conventional farming methods and opening up new possibilities for resource management and precision farming1. In an agricultural field, WSNs are a network of autonomous sensor nodes that can monitor and gather real-time data from various points using a variety of sensors, including temperature, humidity, soil moisture, light, and even cameras. Then, for additional processing and analysis, this data is wirelessly sent to a central base station or gateway. The use of WSNs in smart agriculture has a number of benefits that have had a big impact on how farmers manage their livestock and crops2. One of the main advantages of WSNs is their capacity to offer a wealth of data with spatial and temporal granularity, allowing farmers to continuously and in real-time monitor the conditions of the farm. Farmers are better equipped to respond to changing environmental conditions or potential threats, such as pests, diseases, or unfavorable weather patterns, thanks to this data-driven approach3. WSNs make it possible to automate a variety of farming processes in addition to providing real-time monitoring4. WSNs can enable precise and targeted resource use, reducing water consumption, fertilizer use, and pesticide use, with the integration of actuators, such as automated irrigation systems or smart agricultural machinery. This encourages sustainable agricultural practices by optimizing resource allocation while minimizing environmental effects5,6. WSNs are suitable for farms of different sizes and types, from small family-owned farms to large commercial agricultural enterprises, due to their scalability and flexibility. WSNs’ modular design enables quick deployment and expansion, ensuring coverage of wide areas while taking into account the unique requirements of various crops or livestock7.
Farmers can save money thanks to WSNs. Farmers can use targeted treatments and just-in-time interventions to reduce unnecessary input costs and ensure the highest yield by receiving real-time data on crop health and soil conditions8. Furthermore, WSNs’ remote monitoring capabilities eliminate the need for in-person inspections, saving both time and money9–11. Despite these advantages, there are some difficulties in implementing WSNs in smart agriculture12,13. Since sensor nodes are frequently battery-powered and installed in remote locations, making battery replacement or recharging challenging and expensive, energy efficiency is a crucial concern. In order to address this, scientists and engineers are consistently working to create sensor nodes, communication protocols, and data aggregation algorithms that are energy-efficient14.
There are other important factors that need consideration, such as security and data privacy. It is crucial to implement strong encryption and authentication mechanisms because the data collected by WSNs may contain sensitive information about the farm’s productivity and operations15. This protects against unauthorized access and data breaches. By enabling precision farming techniques and supplying real-time data, WSNs have revolutionized smart agriculture. WSNs are an essential tool for modern farmers on their path to greater productivity and environmental stewardship because they have the potential to increase resource efficiency, optimize yields, and promote sustainable agricultural practices. The role of WSNs in smart agriculture is anticipated to expand as technology develops, helping to create a more effective, resilient, and environmentally friendly food production system.
One of the most important sectors of the global economy, agriculture is essential to sustaining human life and supplying the world’s expanding food demand16. Traditional agricultural methods, however, frequently waste resources and are inefficient, which damages the environment and causes financial losses. Smart agriculture has become a promising solution to these problems and the rising demand for food production17. Utilizing cutting-edge technologies like the IoT and WSNs, smart agriculture gathers real-time information from a variety of sources on the farm, such as soil conditions, weather parameters, crop health, and livestock behavior. Farmers can use these data-driven insights to make wise decisions, use resources more effectively, and apply precision farming methods. The infrastructure for data collection and transmission is provided by WSNs, the backbone of which is autonomous sensor nodes placed throughout the agricultural field18.
There are many difficulties in deploying WSNs in smart agriculture19. The sensor nodes’ constrained energy capacity is one of the main issues. It is not practical to replace or recharge the batteries frequently due to their dispersed and remote locations20. As a result, energy efficiency becomes essential for the WSNs’ sustainable operation. To ensure long-term success, extending the network lifetime and lowering node energy consumption are crucial goals. Accurate event detection is essential for the effectiveness of smart agriculture systems, in addition to energy efficiency. Events can include a wide range of elements, such as abrupt changes in soil moisture, temperature, humidity, or pest infestations or disease outbreaks. Farmers can improve overall farm productivity by taking proactive steps, averting potential losses, and implementing targeted interventions thanks to the prompt and accurate detection of these events21.
WSNs data fusion algorithms have been developed as an effective method of dealing with huge volumes of raw data collected by various sensor nodes in WSNs applications, including smart agriculture. These algorithms create models that integrate information from several sensors in order to generate more accurate, reliable and significant data as compared to data generated by single sensor. Thus, the main goals of data fusion in WSNs comprise of reducing the amount of data transmitted and received, further increasing the accuracy of collected data and at the same time minimizing the energy utilization by the nodes due to limited battery power. In the past, the data fusion process incorporates simple means average filter, Kalman filter, and Bayesian probabilities that attempt at combining data to make it more reliable and accurate. However, these methods do not work well especially in complex and changing conditions such as the agriculture field where the sensor data is noisy, correlated and has high variance caused by environmental factors. To overcome these problems, new sophisticated data fusion techniques, consisting in hierarchical and dynamic DDA, have been created.
The choice of Cluster Heads (CHs) in Wireless Sensor Networks (WSNs) is very significant to increase the network performance and energy accomplishment. New development: Through these new techniques like, Genetic Algorithm-based methods, it has also identified much improvement in the CH selection with the modification to the dynamic network environment and reduced communication overhead. This approach not only helps to increase the lifetime of the sensor nodes but also improve the reliability of the data transmission in the network.
Analyzing the general notion of smart agriculture, the above-discussed hierarchical clustering based dynamic data fusion approach utilizes these innovative technologies towards enhancing the performance of WSNs. This algorithm divides sensor nodes into clusters and means less information should be communicated through the whole system, thus saving energy. First, to handle noise and reduce the redundancy within the clusters, dynamic data fusion is functioned within every cluster to assimilate the low-level sensor scans. Besides reducing demand of communication, this approach also improves the accuracy of event detection which is vital for making right decision at the right time in agriculture. Dynamic data fusion means that the system can respond to changing environmental situation, which means only the most pertinent and accurate data are used to assess the state of the farm. These techniques complement Extreme Learning Machine (ELM) that enables the system to classify and predict important events in real time making the system suitable for enhancing food production and resources in agriculture. Using the Extreme Learning Machine (ELM) for real time event detection becomes a problem since with increasing occurrences of updates for different patterns in the agricultural data, the process becomes a tedious and time-consuming process since it involves retraining the model every time it is fed with new information which increases the rate of power consumption due to the computational requirement. To address this problem, our method suggests combining the ELM with incremental learning methods Thus; the model is able to learn incrementally without requiring a full retraining and consequently decreasing latency and energy consumption, but maintaining accuracy in dynamic agricultural situations.
This research suggests a novel strategy based on hierarchical clustering-based dynamic data fusion algorithms for WSNs to address the issues of energy efficiency and event detection accuracy in smart agriculture22.The basic concept is to build an intelligent framework that organizes sensor nodes into clusters in the best way possible and uses dynamic data fusion techniques to process the data gathered from these clusters. By addressing the issues of energy efficiency and event detection accuracy in WSNs, this research seeks to significantly advance smart agriculture. The proposed method offers a strong and scalable solution for resource optimization, increased crop productivity, and sustainable farming practices in the age of smart agriculture by introducing hierarchical clustering-based dynamic data fusion algorithms.
The key contributions of the article is,
The study presents a novel hierarchical clustering-based method for setting up the WSN’s sensor nodes. The suggested method effectively clusters sensor nodes by using spatial proximity and data similarity. This hierarchical structure minimizes data transmissions within the WSN and lowers communication overhead.
By utilizing the ELM technique’s strength in event classification and prediction, the suggested approach enables the prompt and precise identification of crucial events in the agricultural sector. Farmers are equipped to take preventative measures and maximize resource use thanks to this proactive approach.
Integrating a Genetic Algorithm for technical selection of Cluster Head’s in Wireless Sensor Networks enhances energy management and communication traffic distribution and equally enhances dynamic network terrain.
A unique strategy is the combination of dynamic data fusion and hierarchical clustering. Although data fusion and clustering are both well-established methods, their dynamic and hierarchical combination in the context of smart agriculture represents a novel contribution.
The aspect that distinguishes this work is its particular focus on smart agriculture. The requirements and data characteristics in the agricultural domain differ from those in other applications, so the system is specifically designed for this domain. This system makes a unique and valuable contribution by trying to increase event detection accuracy while also improving energy efficiency.
The study tackles the critical problem of energy efficiency in wireless sensor networks in the agriculture industry, which is necessary for the long-term viability and operation of the network. Notably novel are the suggested methods for optimizing energy consumption.
This article’s remainder is organized as follows: In Sect. 2, a summary of related research is provided. Section 3 presents the problem statement. The suggested approach’s methodology and architecture are explained in Sect. 4 of the article. The findings and subsequent discussion are covered in Sect. 5. The conclusion is covered in Sect. 6.
Related works
The study explores how remote sensing in agriculture may be improved by combining IoT technology with high-resolution satellite and drone imaging, which can provide more frequent and accessible data updates23. It draws attention to how important WSNs are for gathering information on ecosystems, especially when it comes to controlling water levels in farming areas. Nevertheless, because of sensor node restrictions, data transfer from WSNs to drones for processing is still difficult. The paper suggests a fuzzy logic-based cluster election technique to maximize energy efficiency and prolong the lifetime of WSNs. This is a viable approach for smart agriculture, as the results demonstrate significant enhancements in energy efficiency, active node count, and total network resource utilization compared to conventional techniques.
The research emphasizes the IoT and its goal of making it possible to identify, measure, and analyze environmental parameters at a reasonable cost in spite of drawbacks such short battery life, insufficient storage, and inaccurate sensors24.The researchers suggest Hydra, a three-layer data fusion structure that aims to increase decision-making, pinpoint target events, while enhancing sensor accuracy. The system was used in smart agriculture, namely for smart water management, in conjunction with Embrapa. It addressed irrigation requirements and scheduling utilizing the amount of soil moisture and evapotranspiration prediction. According to the findings of the experiment, outliers may be successfully identified and removed using the ESD approach in conjunction with the WRKF filter. An appropriate evapotranspiration model is produced using an SVM quadratic machine-learning model, which closely resembles the Penman-Monteith model of reference. Hydra shows promise for improving Internet of Things applications in the agricultural sector.
In the framework of smart agriculture, the study focuses on how the Internet of Things facilitates communication between equipment and devices to provide useful data. In IoT-based WSNs, the suggested ACM seeks to improve the gathering of data and lower energy usage25. To enable effective data aggregation, the research project builds an energy model, an objective approach, and an integrated model. GWO is a strategy that maximizes node selection and enhances the effectiveness of data aggregation, emphasizing location accuracy and reducing localization mistakes. By creating effective routing pathways, EAODV lowers routing overhead and congestion. To increase agricultural productivity, this system uses sensor nodes to automate accurate farming and monitor the condition of crops using Internet of Things-based WSN.
Zhang et al.26 presents the Wind turbines are now an essential component of the green energy industry due to the ongoing growth of wind energy supplies. However, a number of issues might arise when they’re in use, which would impact their lifespan and performance. Frequent maintenance and inspections are necessary to guarantee the effectiveness and safety of wind turbines. UAV technologies have advanced quickly in recent years, creating new opportunities for wind turbine repair and inspection. The most important parts of wind turbines are their blades, and this research article offers a thorough examination of UAV applications for wind turbine blade identification, inspection, and diagnosis. It highlights the benefits and drawbacks of the main UAV inspection systems for both stationary and spinning blades of wind turbines. The study also examines the control algorithms that UAVs employ for blade inspection, confirming their precision and applicability in this domain. Future technological developments are suggested in light of these discoveries, such as intelligent defect detection, edge computing-based online surveillance, and UAV navigation that is autonomous. In the future, it is expected that UAV inspection technologies would become more and more important for wind turbine blade inspection and maintenance.
An adaptive Siamese network with a channel attention mechanism is proposed to improve fault diagnosis in UAVs, particularly with the challenges of limited and noisy multichannel data27. Traditional methods rely heavily on accurate mathematical models and expert knowledge, making them less effective with constrained data and coupled signals. The network utilizes two parallel feature extractors with shared weights, allowing it to adaptively weigh features based on each channel’s significance. This reduces the coupling effect in multichannel data, enhancing feature extraction precision. Additionally, random and repeated data sampling improves sample utilization, effectively addressing data scarcity. Experimental results show that this adaptive approach achieves high diagnostic accuracy, strong resilience to noise, and reduced dependency on extensive datasets, making it particularly suitable for fault diagnosis in UAVs operating with limited data. However, the model’s reliance on specific training parameters and data preprocessing techniques presents potential limitations.
An automated method for detecting defects in vibration dampers and insulators on transmission lines using UAV imagery and an enhanced YOLOv5 model is presented in the study28. A custom dataset, DVDI, was developed, capturing images of these components, which are challenging to identify due to their small size, diverse shapes, colors, and visually complex backgrounds. To improve detection accuracy, the proposed method integrates a coordinate attention (CA) module into YOLOv5, allowing the network to capture spatial details and focus on target features amidst background clutter. Additionally, the original PANet feature fusion framework was replaced with a bidirectional feature pyramid network (BiFPN), enabling the network to prioritize features with learnable weights. Testing on the DVDI dataset yielded a mean average precision (mAP@0.5) of 89.1%, surpassing YOLOv5’s baseline by 2.7%. Despite these improvements, limitations remain in addressing diverse environmental conditions and component occlusions.
An intelligent fault diagnosis approach for UAV blade damage using a stack pruning sparse denoising autoencoder and convolutional neural network (sPSDAE-CNN) is presented29. The method begins with data enhancement via a one-dimensional sliding window and converts time-domain data to two-dimensional grayscale images, boosting the model’s deep learning capabilities. Unlike traditional autoencoders, sPSDAE-CNN employs a stack pruning approach, connecting earlier and later network layers to preserve more features and reduce information loss. Pruning further enhances training speed, accuracy, and adaptability to noisy signals, while mitigating CNN overfitting. Experimental results demonstrate that the sPSDAE-CNN model achieves robust diagnostic accuracy, even in high-noise environments, maintaining a 90% accuracy rate at a − 4 dB signal-to-noise ratio, surpassing traditional CNNs. However, limitations remain in managing extreme noise levels and varied operational conditions.
This article presents a fault detection model acceleration engine (FDMAE) designed for real-time UAV fault detection under airborne constraints30. Given the limited size, weight, and power of UAVs, deploying deep learning-based detection methods is challenging. The FDMAE addresses these limitations by using a high-performance detection model based on stacked long short-term memory (LSTM) networks, with fault detection achieved through a statistical threshold approach. To enhance computational efficiency, a model pruning method based on principal component analysis is applied. The optimized model is then integrated as an acceleration engine using high-level synthesis and deployed on an airborne field-programmable gate array (FPGA). Tested with real UAV flight data, FDMAE demonstrated high accuracy, strong performance in the area under the ROC curve, rapid processing speed, and reduced power consumption, validating its suitability for real-time applications. However, limitations exist in managing extremely high-dimensional data and varying operational conditions.
Employing sensor systems and information mining strategies, numerous agricultural processes may be greatly improved and it is investigated by Pandiyaraju et al.31. The most important of these procedures is controlling the amount of water used in agricultural crops. Furthermore, in the past few decades, wireless sensor networks have emerged as an increasingly significant component of precise farming. The efficient use of resources and the extension of the sensor nodes’ useful lives are crucial considerations in the development of sensor networks that are wireless. In order to increase the longevity of the network and offer reduced energy consumption in the routing procedure, which is utilized to give information to the watering system, a novel automated routing protocols has been presented in the study. Terrain oriented Routing utilizing Fuzzy Principles for precise farming is an acronym of the revolutionary sophisticated environmentally friendly routing system that makes utilization of fuzzy regulations. The routing selections were made using the fuzzy reasoning method described in the study. The Equalized Cluster Heads Electoral Navigation Protocols and Regional Dependent Navigation constitute two methods of routing that have been constructed to be contrasted with the overall framework. The empirical findings demonstrate that the suggested method outperforms the previously available techniques.
The fundamental component of contemporary technological infrastructure, which is built on the IoT, 5G technology, and WSNs, are sensor networks that are wireless32. WSNs are often employed in businesses and factories, including smart electricity networks, power management infrastructure, intelligent buildings, precise farming, animals tracking devices, tracking the environment, etc. The dispersed and ad hoc nature of WSNs places extremely particular requirements on the design of clustered and routing algorithms. Managing power and extending the lifespan of networks are the most crucial requirements for developing effective WSNs. Therefore, one of particularly promising areas for study to lessen the intricate nature of a network’s operation is the problem of power restrictions. The study wants enhanced optimizing techniques that can handle this sort of work due to the intricacy of that assignment. In the article, the study strives to create a better chimp’s optimization for problems with limited power. The Integrated Chimp Optimizing Algorithms incorporates the chimp optimization with the dimensions learning oriented hunting search methodology. The DLH search approach here enhances the harmony among mining and exploring while retaining variety. IChoA was recently subjected to the examination with the testing suites and power limitation problems in order to determine its resilience in addressing optimizing problems. Empirical results acquired using the suggested approaches are validated using more contemporary techniques. The IChoA approach can be of greatest assistance in resolving the common complicated sequences and power limitation problems, according to the various simulation outcomes.
Millions of tiny sensors are connected to create a WSN. They have the ability to compute variables, communicate easily, and sense33. The wireless sensing node’s power determines how long it will last. As a result, conserving networking power is a major technological problem for WSN. Each wireless monitoring network’s main requirements are resource effectiveness and safety, both of which can be impacted by the existence of numerous unwanted nodes. The main limiting factor for nodes with sensors is the restricted supply of energy they have available to send every packet of information. The many WSN deterministic routing approaches used to conserve energy during transmission of information. Energies conservation and maintaining variability are the key objectives of the protocol’s execution. A homogenous effective DEC dependent innovative electoral probabilistic oriented multitier randomness strategy or agrarian wireless monitoring network is provided. The objective of the research is to define the foundations of every stated procedure and the basic architecture of WSN. It is discovered that adjustments are able to choose cluster heads uniformly. The procedure is ecologically friendly because of its improved distribution capacity. The aforementioned protocol’s effectiveness evaluations have undergone a comparison investigation.
To realize manufacturing with the help of UAVs, Lin et al.21 in the present paper suggest a hierarchical gathering of information scheme. Agriculture monitoring is the specific implementation. A hybrid condensed collection for that using precise and greedy methods. In order to simulate the energy-optimal manufacturing process, the simplest cost flow challenge was formulated more precisely using a more effective computational strategy. The recommended complement factor parameters, which includes data availability and cluster head separated from typical nodes, forms the foundation of the greedy methods. A centralized method for gathering data is used, allowing the UAV to be planned to carry out data gathering with minimal energy consumption, improving the effectiveness of node clustering. Results from simulations demonstrate that the approach can efficiently gather data and organize the UAV’s a pattern of at an affordable cost of energy.
Lu et al.22 explore smart farming, that may enhance the quality and efficiency of crops by optimizing the data supplies of farming. WSNs offer efficient methods for gathering data, transmission, and analysis for smart farming. Nevertheless, the abundance of networked sensors breaches the idea of green interaction by consuming an excessive amount of energy. Radio-frequency communication are used by SWIPT technologies to carry data as well as supply energy to WSNs, thereby significantly extending the lifespan of WSNs. In the present piece, a smart farming design was initially suggested using the SWIPT. The matching of the components and power distribution are then collectively optimized in an energy-saving optimization method for achieving green interactions. There are two stages to the interaction process. To be more precise, during the initial phase, the origin sensor communicates with the relay detector and the target detector. Relay sensors use a portion of the components to gather power and use the rest of the components to receive data. All of the components are used by the intended sensor to receive data. Relay sensors uses the energy gathered in its initial phase in the later phase to transmit data to final destination detector. To accomplish the suggested optimization issue using Lagrangian dual functioning, an efficient continually evolving optimization algorithm commonly is put forth. The efficient operation of the approach is capable of improving the technique’s electric power effectiveness according to results from simulations.
Alghazzawi et al.3 investigated WSN, which is frequently employed in farming operations to boost efficiency and cut damage in different manners. The protected environment makes growing easier, and offers many advantages for farming. Gas detectors and soil pH detectors are frequently employed in farming modelling. These kinds of sensors can be used for a variety of IoT-integrated farming operations. The functionality and hardware structure of the suggested models are covered in the article. Additionally, different farming evaporation frameworks are elaborated. The Penman-Monteith equation is utilized for evaluating important factors, which include congestion management. This study concentrates on using various variables, such as evaporated water and moisture, in a variety of settings to help divide the connection equally among the various sources. The article also demonstrates the MATLAB deployment, and the parameters are changed employing the code. The effectiveness and equality of the suggested model are said to be validated by the paper’s achievement of comparable deviations using the identical source value. These models also show greater performance and reduced delay rates in a most effective area. By applying visualization tools, the enhancement in packet dissemination via the network of IoT devices is shown, and the input from users can be estimated in order to calculate the total accessibility the quantity (A1 + A2) gathered. According to the findings of the experiment, the transmitted rate is 1.24 and is therefore more important instead of the connection’s the ability value. The assertions are supported by evidence demonstrating enhanced congestion management that surpasses multiple variables by 0.3% and 1.2% when exponential reduce is taken into account.
Energy saving is always a major issue in designing sensor networks, and the clustering according to the pyramidal structure is a main mechanism to handling this33. However, for the mobile sensor networks (MSNs), there are some more issues such as packet loss because of mobility of nodes. This thesis introduces a modified low energy adaptive clustering hierarchy protocol that sustains overall lifetime of the network and at the same time, minimizes packet loss by incorporating a fuzzy inference system. Simulation results prove that the proposed method is superior to the conventional modes in aspects of network lifetime, energy consumption, packet delivery ratio and cluster stability. Therefore, this technique provides an ideal and plausible solution to the improvement of highly dynamic sensor networks.
Clustering hierarchy algorithm is used in wireless sensor networks (WSNs) to save more energy and enhance the lifetime through using the nodes with more energy to collect and transmit the whole data34. However, previous approaches do not consider data redundancy from overlapping and neighboring nodes and do not test the manipulation of different parameters. Another issue is the high redundancy of nodes when constructing clusters in this manner, shortening network lifetime This is solved by the presented in this paper enhanced clustering hierarchy (ECH) approach, which uses the sleeping-waking redunction for these nodes. In contrast to the conventional methods that make all the nodes awake, ECH just wakes nodes for the data tasks only, which results in energy saving. These simulations show that the performance of the ECH is efficient in both homo and heterogenous network.
This paper focuses on the use of WSNs in agriculture with emphasis to irrigation where sensor nodes are used to collect information on the environmental conditions surrounding the plants35. Although WSNs improve the yield, quality, and productivity of crops they are also responsible for excessive production of data, which calls for proper data management. To overcome this, the study advances an Energy-Efficient Cluster-Based Data Aggregation (E2CDA) technique that employs probabilistic clustering to determine the efficient number of CHs to be used in each round. In MATLAB when E2CDA is deployed, it is seen better than LEACH and LEACH-C in various parameters like energy, network life time, packet delivery ratio, end-end delay and packet drop ratio. This academic approach bonds the speculation of improved energy efficiency and effectiveness in management of irrigation networks in agriculture with better WSN performance.
This research aims at enhancing the energy efficiency and lifetime of WSNs that are embedded in today’s wireless communications and IoT systems using the software Defined Networking (SDN) concept36. Energy efficient routing protocols are used in WSNs for improving network performance and among various methods, cluster routing is the most efficient one. In the present work, the authors presented a new approach to decrease the energy consumption in the cluster routing protocol called as the firefly algorithm with high efficient entropy. Simulation analysis reveals that the present approach offers considerably superior performance to the existing algorithms such as DEEC-FA and IFCEER with respect to network life time. In particular, the proposed algorithm adds 42 more alive node to the scale of current size. 06% improved when compared with that in DEEC-FA, 13. 95 compared to IFCEER may be 0.5% better than other reference algorithms; therefore, it is a potential method for improving WSN performance.
This paper aims at unraveling the energy efficiency issues in IoT-based heterogeneous wireless sensor networks (HWSNs) which are crucial for different human-oriented applications37. This is in stark contrast to conventional WSNs, IoT-based HWSNs must therefore be much more judicious in their employment of resources, specifically energy. Most of the existing solutions are designed for homogenous networks or single parameter solutions, which reduces their versatility for real-life applications. Based on the results of this study, we introduce a multiple parameter multiple level heterogeneity model with a cluster head rotation strategy to make efficient use of the energy resources and at the same time to optimize the network lifetime. The method enhances the intra-cluster data exchange and thereby it increases the throughput to base station up to 57%. In this context, an energy model is presented to decide whether it is better to use single-hop or multi-hop communications between clusters, and after that a relay-role rotation technique is defined among the next hop nodes. It can be concluded from this analysis that the proposed methods yield a considerable improvement in the network throughput that ranges from 57. 44%, 51. 75%, and 17. 63% better in distance compared to RLEACH, CRPFCM, and EERPMS to prove its benefit on IoT based HWSNs.
In order to maximize energy efficiency and prolong the lifespan of WSNs, the first research presents a fuzzy logic-based cluster election approach. This leads to an improvement in active node count, network resource utilization, and energy efficiency. The second research shows how the Hydra data fusion architecture may improve IoT applications for farming by improving sensor accuracy and decision-making in smart agriculture, especially for water management. In the third study, the ACM is presented. It combines data aggregation and energy modelling approaches to increase the effectiveness of data collecting in WSNs, leading to better routing and energy savings. The Fourth Study investigates the Integrated Chimp Optimizing Algorithm and demonstrates its robustness in resolving challenging optimization problems. It does this by addressing power limitations in WSNs through optimization techniques. In the fifth and final study, a hierarchical data gathering scheme for UAV-based agricultural monitoring is examined. Data collection and clustering are optimized, with an emphasis on energy efficiency. The majority of the literature reviews concentrate on how IoT and WSNs can be integrated into agriculture, with the shared goal of improving data gathering, analysis, and decision-making. These studies demonstrate the potential advantages of IoT for knowledge acquisition and data generation. But they also point out a number of drawbacks and issues that need to be resolved, like energy shortages, unreliable sensors, and problems with data transfer. Thus, the dynamic data fusion algorithm based on hierarchical clustering is presented.
Problem statement
Precision farming and data-driven decision-making have gained new opportunities thanks to the use of WSNs in smart agriculture. However, this development also raises important issues with regard to the WSNs’ event detection precision and energy efficiency. The fact that sensor nodes, which are frequently battery-operated and remote-located, have limited energy resources, is one of the main issues. Energy conservation is crucial for ensuring a prolonged network lifetime and lowering operational costs because it is impractical to frequently replace or recharge batteries in large agricultural fields. Furthermore, timely responses to crucial elements like temperature changes, soil moisture levels, pest infestations, and livestock anomalies depend on accurate event detection. Detecting important events among noise and irrelevant data becomes a significant challenge as a result of the enormous amount of data that sensor nodes are producing. The challenge is to develop a reliable and scalable solution that increases the energy efficiency of WSNs in smart agriculture while also increasing the precision of event detection. The research suggests a novel strategy based on dynamic data fusion algorithms with hierarchical clustering to address this. The goal is to effectively group sensor nodes into clusters, which lowers communication costs and saves energy. Dynamic data fusion algorithms are then used to shrewdly process data from sensor nodes within each cluster, enabling more accurate event detection and better decision-making in smart agriculture applications. The research’s goal is to overcome these obstacles in order to maximize resource use, boost crop productivity, and advance sustainable agricultural methods37.
Proposed hierarchical clustering-based dynamic data fusion
In order to evaluate the use of dynamic data fusion approaches for WSNs in smart agriculture, this study takes an experimental approach. To gather environmental data, a sample of WSN nodes is placed in a typical agricultural area. Initially, sensor nodes are grouped into clusters using hierarchical clustering based on their proximity and similarity. A dynamic data fusion mechanism is used within each cluster to collect and combine data, giving indications of the cluster’s general health. For the purpose of identifying events in real-time, ELM technology is used. Through a comparison with conventional techniques, energy efficiency and event detection accuracy are assessed. The purpose of the study is to show how this strategy may effectively increase agricultural yields and resource use in sustainable agriculture. The proposed methodology is depicted in Fig. 1.
Fig. 1.

Proposed Methodology
Data collection
The smart agriculture system uses sensor nodes that are strategically placed throughout the agricultural field to continuously monitor and record important environmental parameters. These sensor nodes can measure and gather information on important variables like temperature, humidity, soil moisture, light intensity, pH level, rainfall, crop growth, irrigation, and nutrient levels. Table 1 contains the information gathered. The sensors run effectively and autonomously, giving periodic accurate readings in real time. The gathered information creates a sizable dataset that provides insightful information about the shifting conditions of the farming environment. Farmers and agricultural experts can allocate resources wisely, plan irrigation schedules, and manage crop health by collecting and analyzing this data. This data-driven strategy improves crop productivity, optimizes agricultural practices, and adds to the overall effectiveness and sustainability of the smart agriculture system.
Table 1.
Data Collection.
| Temperature | Humidity | Soil Moisture | Light Intensity | pH Level | Rainfall | Crop Growth Stage | Irrigation Status | Nutrient Levels |
|---|---|---|---|---|---|---|---|---|
| 21 | 42 | 30 | 443 | 6 | 1 | 2 | 0 | 0.094157 |
| 36 | 65 | 75 | 299 | 8 | 5 | 1 | 0 | 0.139489 |
| 35 | 65 | 22 | 670 | 6 | 10 | 1 | 0 | 0.537482 |
| 28 | 35 | 51 | 691 | 5 | 1 | 4 | 0 | 0.000623 |
| 32 | 42 | 62 | 833 | 5 | 2 | 1 | 1 | 0.430374 |
| 27 | 65 | 26 | 770 | 5 | 10 | 4 | 0 | 0.057067 |
When deploying a WSN in a real-world setting, it’s important to take into account the unique demands and features of that environment. In order to deploy the WSN, sensor nodes would be strategically placed throughout the field while taking into account variables like crop types, soil quality, temperature fluctuations, and moisture levels. The information on soil moisture, temperature, humidity, and other pertinent factors would be gathered by these sensor nodes. Wireless communication protocols would then be used to transfer the gathered data to a central data collection point, such as a base station. In order to maximize node lifespan, the WSN would need to be built to withstand weather exposure, be scalable to cover the entire agricultural area, and run on low power. Farmers would be able to monitor crop health, manage pests, and water crops more effectively with the real-time information this deployment would give them.
The target wireless standards must be taken into account when deploying a WSN in an actual setting. The network’s power efficiency, data transmission range, and communication capabilities are all directly impacted by the wireless standards selected. IEEE 802.15.4, which is appropriate for low-power, short-range applications, and IEEE 802.11, which offers a higher data rate and a longer range, are common wireless standards for WSNs. Additional considerations like frequency bands, network topology, and data security protocols may be necessary depending on the particular environment and application.
Subsection hierarchical clustering for clustering sensor nodes
The wireless sensor node data points are first organized into initial clusters by the hierarchical clustering-based dynamic data fusion algorithms. The two clusters with the highest similarity score are then iteratively combined by the algorithm. This process keeps going until all of the data points are grouped together into a single cluster or until it reaches a predetermined stopping point. The system uses hierarchical clustering to find patterns and similarities in the environmental data it has gathered, including information on temperature, humidity, soil moisture, light intensity, and other pertinent variables. By grouping together related data points, the system can efficiently aggregate and fuse data, reducing redundant data and saving energy.
By streamlining communication and organization among sensor nodes, the hierarchical clustering method for clustering sensor nodes is a useful way to lower power consumption in WSNs. Sensor nodes are grouped into clusters using this hierarchical clustering technique according to proximity or other predetermined criteria. The efficient data aggregation made possible by the hierarchical structure drastically lowers the volume of data transferred over the network. Given that one of the most energy-intensive tasks for sensor nodes is data transmission, this results in significant power savings.
The network can have a hierarchy of coordinators or cluster heads due to hierarchical clustering. These cluster heads are in charge of gathering information from each of their clusters and sending compiled information to a sink node or central base station. Most sensor nodes can operate in low-power sleep mode by using this hierarchy, waking up only when it’s required to sense or communicate data. Due to the duty cycling, there are fewer active periods, which lowers power consumption because the nodes use less energy for data transmission and reception. A more energy-efficient wireless sensor network is the end result of hierarchical clustering, which also improves data aggregation and network structure. This is important for increasing the network’s longevity and sustainability, especially in applications such as smart agriculture.
A number of traits apply to WSNs: The network infrastructure is composed of three distinct kinds of nodes, which are a central server, several kinds of sink nodes, and numerous sensor nodes. The starting point is equipped with adequate electricity and storing as well as strong processing power. It primarily gathers regional choices made by every sink node and analyses them thoroughly. Within the end, it generates a sound prediction about the likelihood that current incidents will occur across the entire observing area and transmits its ultimate forecast produces to the terminals. It is presume that the starting stations is stationary and that the position of the Sink nodes remains constant for the purpose to clarify the method. Additionally, it has enough power, storage spaces and computational power. The surveillance area encompassing all collapse points may encompass the entire tracking region, and every sensing node has a separate cluster head. Sensor node devices are restricted in energy and storage capabilities, and can only carry out basic calculations. Sink nodes serves as cluster heads in the network’s structure and frequently acquire data collected by their neighbor sensor nodes.
This network’s model includes a central station, an assortment of sink nodes, and a significant amount of nodes for sensors, as depicted in Fig. 2. The sections that follow describe the features of sensor nodes. In the observation area, go under the nodes are placed evenly as well as arbitrarily while sensor nodes are isotropic and spread as evenly as feasible. The sensor nodes’ initial electrical power E0 is constant and finite, and the computerized experiment’s different sensor nodes’ usage of energy is also constant. Every sensor node in the system has a distinct ID and is capable of identifying only a single characteristic signal. Once established, the sensing node’s location remains fixed and immovable. Every one of the nodes have adaptable interaction radii and can interact immediately with the primary sink node. Because of to the high number of nodes equipped with sensors, there’s a loT of backup in the data gathered by nodes, requiring data integration manufacturing. The node that collects data can sense distances from its neighbors.
Fig. 2.

Network Model
It is presuppose that the energy levels of the starting location and sink nodes are adequate. Sink nodes are used to run intricate tasks like data fusion. These sensor nodes use energy in three different ways: when they are idle, when they are transmitting, and when they are getting it. For nodes with sensors, the energy utilized for processing information is not taken into account given that unnecessary data is merely deleted. The communicating energy (ETY) in addition to the receiving energy (ERY) of sending an n-bit communication over a d-distance has been determined by the following method. The energy utilization in the state of inertia is not significant.
 |
1 |
 |
2 |
Where l is the transmission distortion indices and E elec is the energy used by every receiver and transmitter, and the amp is the power used by the ε amp to multiply by a single square meter per bit. According to the circumstances, the selection of l typically falls among 2 and 5. If greater disruption is anticipated, a greater l value ought to be set.
The structure of this communication structure using the Chinese Remainder Theorem (CRT) technique, and communicate data using fault-tolerant, low-power communication. The three-tier CRT programming structure is constructed from the ground up. This means that after estimating the size of the nodes that store data and assuming that the overall amount of sensor nodes has been determined, next identify the starting station’s search term N. A top-down method for identifying every keyword used for nodes that store data once determined M’s range, and each one then picks out the key phrases of its entrusted node for sensors. The CRT predicts that M will be split into k identical integers, n1, n2, n3,…, nl, where l is the quantity of nodes that store data in the system. In accordance to the CRT, every single place of storage node’s nk is divided into identical numbers nli, in which i represents the secondary-index given to every sensor node. The sink node’s offspring are those nodes that sense. The CRT states that every sink node has a distinct two-dimensional shape collaborate and that every node in the sensor network has a distinct three-dimensional in nature data transfer.
The CH in the present research are sink nodes, and the remaining CH are made up of smaller nodes with interaction ranges. Clustering ends while the system’s topology does. CH nodes have enough ability to function as sink nodes to make it easier to investigate data fusion, meaning it is not required to elect cluster node locations frequently. The cluster’s child nodes for sensors will frequently combine the information that they have gathered and deliver it to their respective parent sink nodes. To ensure that every cluster member can be addressed, every cluster requires every pair of sensor nodes that are capable of detecting potential incident the characteristics as well as the combined value of the connection ranges of identical sensor nodes within that cluster.
The base station is typically portable due to the vast territory it has to handle and the need for a different protocol to control its movement. To make it easier to conduct further investigation and emphasize the investigation’s focus, it is appropriate to presume that the starting point is still for the purposes of the present article, which is devoted to data fusion. The base station in the preceding structure has direct access to every sink nodes and nodes that transmit sensors. Sink nodes have the option of communicating using the base station either individually or via a series of hops. A single cluster’s sink nodes, which are nodes that collect data, and sensor nodes may interact with one another either directly or via a number of hops. Sensor nodes throughout the same group may additionally interact with one another. Nodes are able to interact with one another either individually or via a series of hops.
CH selection using genetic algorithm
Genetic algorithms (GAs) are an optimisation system derived from the natural selection or what we can call genetic processes. When applied in the field of selecting the optimal Cluster Head (CH) in Wireless Sensor Networks (WSNs), GAs can be used to map candidate CHs as chromosomes of a given population. It assesses these chromosomes using fitness functions that take into account a range of parameters, energy level, distance between nodes and coverage area. This concludes that GAs improve the population over generations of selection, crossover and mutation to obtain the highest fitness, which best determines the CHs. This method achieves good approximations in the trade-off between energy and load for the communication, scales well through wide ranges, does not present considerable delays that could be related to frequent recalibrations, and can adapt to the network conditions, so it is ideal for expansive and dynamic environments in WSNs.
Dynamic data fusion for data aggregation
In WSN smart agriculture, dynamic data fusion is clever and adaptive process of combining and analyzing real-time data gathered from various wireless sensor nodes deployed throughout agricultural fields. The goal is to gain insightful information, improve event detection precision, manage resources more effectively, and advance agricultural practices as a whole. WSNs are made up of a large number of sensor nodes that monitor and gather information on a variety of environmental variables, including temperature, humidity, soil moisture, light intensity, pH level, and others. The raw data from individual sensor nodes, however, might be redundant, noisy, or lacking. In order to overcome these difficulties, dynamic data fusion algorithms combine data from various sensors and dynamically modify the fusion process in response to shifting environmental conditions.
In this type of network framework, sink nodes send the most recent information fusion communication to the base stations on a regular basis. The requirement for sensors to frequently communicate the gathered data to sink nodes reduces the regularity of interactions among sensor nodes and sink nodes. The amount of periods sensor nodes express can be significantly decreased while still maintaining the immediate efficiency of a network as a whole throughout the period as the average cycle size is under control. T = nt in the present study because it follows that T is the time needed for the sensor node to deliver communications to the sink node and that t is the time needed for the collapse nodes to communicate conversations to the central station. Furthermore, it may be split into both of the subsequent scenarios rather than all of the sensor nodes in the cluster sending signals to the sink node once per t time frame: In the initial case, the sensors node is awakened by an event that takes place within the region it is monitoring, and it then sends the data it has gathered to the collapse node. In the subsequent scenario, as the incident is happening, the information the sensors node has gathered modifications and is separate from the information that was transmitted in the preceding time frame t, so the information will be moved again, thereby it won’t. This method can drastically cut the amount of time the sensors on the nodes spend communicating, increasing their lifespans and that of the entire system.
The monitored value from sensor nodes could remain the identical during this time t or will keep fluctuating so it can take a shape of Di d1, d2, • • •, dn, where n1 and di symbolizes the various values gathered by each sensor node during time t. It therefore becomes necessary to consider how to derive suitable surveillance variables from these connected data. The following are the precise data integration stages:
Information gathered over a period of time T is integrated and standardized at the sink nodes. The sink nodes creates the hesitant fuzzy set ij (i = 1, 2, • • •, m; j = 1, 2, • • •, n) by listing all potential values for data Gj of all the attributes ADi. At this point, the data’s hesitant fuzzy entropy matrices, or Eaij, is computed. The matrices of hesitant fuzzy entropy Eij is used to build a correct probability weighting model, which then yields the weighted average wi of each pair of sensing nodes:
 |
3 |
Where  =
= , j = 1,2,…, n. The data value of
  is given as
 |
4 |

 |
5 |
D0 Fj denotes the minimum value of characteristic Fj when the aforementioned occurrence happens, and the wj is established by the framework prior to the weighted value of multiple variables resulting in the final occurrence occurring. The boundary value of the characteristic Fj when that event is improbable is represented by D0 Fj when the amount of characteristic Fj, which is indirectly related to the likelihood of an event occurring, is pFj = 1 DFj D0 Fj.
It’s essential to comprehend how the sink nodes combine the information that has been gathered. The sink nodes will transmit the processed information from the file system to the information processing component at the conclusion of the cycles. During the subsequent period, the sensor nodes continued to receive information whilst the information processing component combines the gathered data. For the purpose to finish the integrating and standardization procedure, the information obtained will be given the appropriate interval value proportional to the magnitude of its value. Algorithm 1 shows the hierarchical clustering-based dynamic data fusion algorithms.
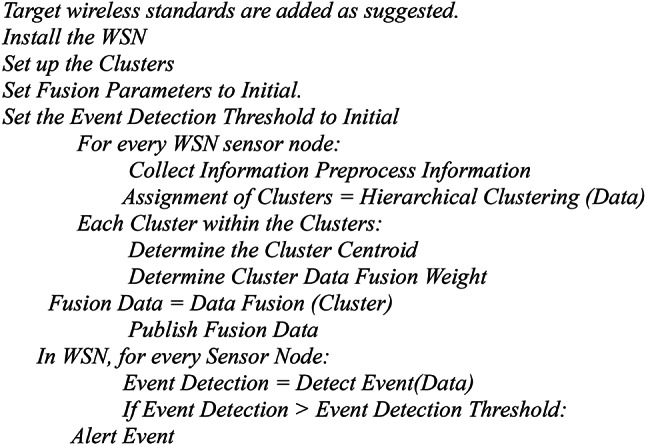
Algorithm 1
In feedback neural network structures with just one or several hidden nodes, the relative weights between the inputs as well as the hidden nodes are randomly distributed and hardly ever current during the training and forecasting phases. Extreme learning machines are a type of teaching strategy. Utilizing the Moore Penrose generalized inverse, it determines its weights. ELMs are capable of producing respectable forecasting accuracy, in addition to learning many times faster than other algorithms and having a significantly lower computational burden than systems trained using the back propagating strategy.
As a superior technique for data analysis, event classification provides accurate and efficient means of identifying, classifying, and interpreting intricate patterns and occurrences within large datasets. Event classification can perform much better than rule-based or conventional methods by utilizing sophisticated machine learning algorithms and artificial intelligence techniques. This makes it flexible enough to be used in a variety of contexts outside of its original field. It excels in scenarios where the complexity and variety of events demand a more intelligent and data-driven approach because of its capacity to adjust to changing data, learn from past patterns, and make decisions in real time. Event classification is a cutting-edge tool for industries like finance, healthcare, security, and smart agriculture. It can help with decision-making, operational efficiency, and situational awareness because of its ability to identify anomalies, predict trends, and provide actionable insights.
 |
6 |
 |
7 |
If A and B are matrices, then they can be stated as,
 |
8 |
 |
9 |
The ELM then arbitrarily determines the weights that are distributed among the input and hidden layers as well as between the hidden layer and output layers, where uji denotes the weight shared by the ith input layer as well as the jth hidden layer neurons and gil denotes the ith hidden layer as well as the mth output layer neuronal cell.
The hidden layer neurons bias is set at arbitrarily by the ELM.
 |
10 |
The system activated function h(y) is selected by the ELM. Using the output matrix S as an example,
 |
11 |
The output matrices R’s column vectors are each,
 |
12 |
The output matrix the formula can be obtained from the matrix that is output and every column of the vector.
 |
13 |
G is the outcome of the hidden layer, and S’ is R’s transformed form. The least squares method is used to compute the matrix of weight values for g in an effort to obtain a distinct result with a minimal margin of error.
 |
14 |
A regularization of the context to improve the network’s capacity for generalization and boost the consistency of the results. In Fig. 3, the ELM architecture is shown. If the hidden layer has fewer neurons than the training samples, then beta could be written as,
 |
15 |
Fig. 3.

Extreme Learning Machine
When there are more hidden layer neurons compared to training samples, beta may be stated as,
 |
16 |
Results and discussion
It is crucial to assess the suggested algorithm’s performance using a range of metrics and instruments, including ROC curves, sensor nodes, hierarchical clustering dendrograms, time series analysis, correlation matrices, temperature data and events, frequency, and growth stage analysis of crops. Sensor nodes serve as the cornerstone for data gathering and serve as the input for the algorithm. Understanding the data grouping and hierarchy through the hierarchical clustering dendrogram provides insights into how the algorithm arranges and processes data. Time series analysis and crop growth stage analysis provide important insights into how well the algorithm monitors and adapts to the changing agricultural environment over time. The correlation matrix aids in evaluating how various variables are interdependent and how that affects the algorithm’s performance. Events and temperature data are important markers of the state of the environment and the algorithm’s capacity to identify and react to abnormalities. Frequency analysis evaluates how well the algorithm processes data and how responsive it is to events. The ROC curve provides a numerical representation of the algorithm’s capacity to distinguish between genuine and spurious positive events, which is crucial for assessing its precision and dependability when assessing smart agriculture applications.
Sensor nodes
Small electronic devices known as sensor nodes are outfitted with a variety of sensors to measure particular environmental or agricultural parameters. These sensor nodes, which are a key part of WSNs, are placed in agricultural fields or smart farms to gather information about the weather, crop health, soil conditions, water levels, and other important agricultural parameters.
Smart agriculture practices are made possible by the sensor node graph in Fig. 4 that shows soil moisture, temperature, humidity, and other environmental parameters. The real-time data gathered by sensor nodes placed throughout agricultural fields is represented visually in this graph. Farmers and agricultural experts can make wise decisions to optimize crop growth, conserve water resources, and boost overall agricultural productivity by keeping an eye on important variables like soil moisture, temperature, and humidity.
Fig. 4.

Sensor Nodes
Hierarchical clustering dendrogram
The process of hierarchical clustering for sensor data collected from various agricultural parameters, such as soil moisture, temperature, humidity, and other environmental factors, is known as the hierarchical clustering dendrogram.
Initially, each data point or sensor node represents a distinct cluster. Clusters are combined or divided as the clustering algorithm moves forward according to their proximity or data-related similarity.A crucial visual aid for comprehending the hierarchical clustering procedure and the underlying data relationships in smart agriculture applications is the hierarchical clustering dendrogram in Fig. 5, which plots sensor nodes versus distance. Each sensor node in this graph represents a data point, and the spacing between nodes indicates how similar or dissimilar the data being collected are. The success of the smart agriculture system in terms of resource utilization, crop management, and agricultural productivity ultimately depends on the ability of agricultural experts to make well-informed decisions about data fusion and event detection strategies.
Fig. 5.

Hierarchical Clustering Dendrogram
Crop growth stage analysis
Crop growth stage analysis is the process of tracking and evaluating a crop’s developmental stages over the course of its growth cycle using information gathered from WSNs. This analysis is essential for increasing event detection precision, increasing energy efficiency, and enabling precision farming techniques. In order to track and identify the crop growth stages, wireless sensor networks and dynamic data fusion algorithms based on hierarchical clustering are used in smart agriculture.
The crop’s various growth stages are represented by the horizontal axis in Fig. 6, while the mean temperature for each stage is shown on the vertical axis. The graph’s data points show how the mean temperature varies from the crop’s germination to maturity over the course of its life cycle. The crop growth stage analysis graph makes it easier to spot anomalies or irregularities in temperature patterns that occur throughout the life cycle of the crop. An environmental disturbance or a climatic anomaly that could have an impact on crop health may be indicated by abrupt temperature changes or unusual temperature spikes.
Fig. 6.

Crop Growth Stage Analysis
Time series analysis
When data points are recorded at regular intervals of time and studied and interpreted in a systematic manner over a given period from wireless sensor nodes, this is referred to as time series analysis. This analysis is a crucial part of the smart agriculture system that aims to increase event detection precision and optimize energy efficiency.
The horizontal axis in Fig. 7 represents time, which is typically measured in intervals based on how frequently data is collected. The recorded temperature values for each time point are shown on the vertical axis. The graph’s continuous line, which connects the data points, shows how temperature has changed over time and gives a clear picture of how it has varied over the course of the monitoring period.
Fig. 7.

Time Series Analysis
Correlation matrix
A correlation matrix is a mathematical representation that measures how linearly related various variables or environmental parameters are that are gathered from wireless sensor nodes installed in a smart agriculture system. Each element of the correlation matrix, which is a square matrix, stands for the correlation coefficient between any two variables. A statistical measure called the correlation coefficient, which ranges from − 1 to + 1, shows the strength and direction of the linear relationship between two variables. While a negative correlation coefficient suggests that one variable rises as the other falls, a positive correlation coefficient suggests that the variables rise or fall together. A weak or nonexistent linear relationship between the variables is indicated by a correlation coefficient close to zero.
An essential tool for improving energy efficiency and event detection precision in smart agriculture is the correlation matrix shown in Fig. 8, which displays temperature, humidity, soil moisture, light intensity, pH level, rainfall, crop growth stage, irrigation status, and nutrient levels. The hierarchical clustering-based dynamic data fusion algorithms can prioritize pertinent data for fusion by comprehending the relationships between these variables, resulting in improved decision-making, proactive agricultural management, and ultimately sustainable and effective smart agriculture practices.
Fig. 8.

Correlation Matrix
Temperature data and events
The collection and analysis of temperature-related information from wireless sensor nodes used in smart agriculture applications are referred to as temperature data and events. This information is essential for raising event detection precision and energy efficiency in the agricultural environment. Temperature readings are continuously monitored and recorded by the sensor nodes at predetermined intervals. Real-time information about temperature variations in the farming area is provided by the temperature data that have been collected.
In Fig. 9, the horizontal axis represents time, and the wireless sensor nodes installed in the agricultural fields continuously record temperature data. The temperature readings taken at each time point are shown on the vertical axis. The graph displays a continuous line that depicts temperature trends over time and gives a clear picture of temperature fluctuations and patterns over the course of the monitoring period.
Fig. 9.

Temperature Data and Events
Frequency
The rate at which data is gathered from the wireless sensor nodes installed in the smart agriculture system is referred to as frequency. It represents the quantity of data points that were gathered in a given amount of time, which is typically measured in seconds, minutes, hours, or any other time period that was specified.
The horizontal axis in Fig. 10 shows the various data collection frequencies, from high frequencies to low frequencies. The corresponding temperature, humidity, soil moisture, light intensity, pH level, and rainfall measurements made at each frequency are shown on the vertical axis. The graph displays the variations in data points and sheds light on how frequently data is collected affects the precision and effectiveness of the smart agriculture system.
Fig. 10.

Frequency
ROC curve
The performance and accuracy of a binary classification model used for event detection in the smart agriculture system are assessed using the ROC Curve, a graphical representation. For analyzing the trade-off between the true positive rate and the false positive rate at different classification thresholds, the ROC curve is a potent tool.
The true positive rate, also referred to as sensitivity or recall, is shown on the vertical axis in Fig. 11 while the false positive rate is represented on the horizontal axis. The proportion of actual positive events that the classification model correctly identified is measured by the true positive rate, while the percentage of non-event data that is incorrectly classified as an event is shown by the false positive rate. These rates for various classification thresholds, which specify the point at which the model classifies a data point as an event or a non-event, are plotted to create the ROC curve.
Fig. 11.

ROC Curve
Performance mtrics
Performance metrics including True Positive (Tpos), True Negative (Tneg), False Positive (Fpos), and False Negative (Fneg) are frequently employed in the assessment of classification models, especially when dealing with binary classification tasks. These figures come from a confusion matrix that contrasts the actual ground truth with the model’s predictions. Tpos stands for the total number of correctly identified positive instances that is, the number of correct positive predictions made by the model. Tneg, or instances correctly identified as negative, are the number of correct negative predictions. Fneg are instances that the model incorrectly labels as negative, and Fpos are instances that the model incorrectly classifies as positive. These values are essential for evaluating the model’s accuracy, precision, recall, and F1 score, among other performance metrics, because their computation depends on comparing the model’s predictions with known or observed outcomes from a dataset.
ccuracy
The performance of the system model as a whole is assessed using accuracy. The fundamental tenet of it is that every encounter can be accurately predicted. The precision is provided by Eq. (17).
 |
17 |
Precision
In addition to being correct, precision also refers to how closely two or more calculations resemble one another. How frequently a conclusion can be drawn is demonstrated by the relationship between precision and accuracy. Equation (18) can be used to calculate precision.
 |
18 |
Recall
Recall is the proportion of all relevant results that were successfully sorted by the methods. The ratio between the true positive and false negative values is used to determine the appropriate positive for those numbers. In Eq. (19), it is mentioned.
 |
19 |
F1-Score
The F1-Score formula combines recall and accuracy. Precision and recall are used to calculate the F1-Score in Eq. (20).
 |
20 |
A vital component of WSNs with clustered nodes is the CH Selection algorithm. It focuses on designating the best nodes within each cluster to serve as cluster heads, in charge of coordinating, aggregating data, and facilitating communication with a central base station. To maximize network efficiency and energy consumption, the selection process frequently takes into account elements like residual energy, closeness to other nodes, and data transmission capabilities. In contrast, K-Prediction is an algorithm for forecasting and predictive modelling. It is used to project future values or occurrences by using historical data. K-Prediction is used to forecast and make decisions in a variety of fields, such as supply chain management, weather forecasting, and finance. To evaluate and extrapolate trends and patterns, statistical and machine learning methods are frequently used. In WSNs, data aggregation is a technique used to lower processing and data transmission overhead. Prior to transmission, data from several sensors is aggregated and combined into a single packet. Data aggregation is a crucial algorithm in resource-constrained environments such as sensor networks and the IoT because it minimizes communication and reduces redundant data, which improves network efficiency and saves energy.
A comparison of performance measures for the various research methodologies is shown in Table 2. The approaches under consideration include Clustering-based Data Fusion, Data Aggregation, K-Prediction, and CH Selection. The Clustering based Data Fusion technique performed better than average across all parameters, demonstrating its potency for producing precise and accurate predictions. It performed noticeably better than the alternatives, giving it a potential strategy for the task at hand. It is represented in Fig. 12.
Table 2.
Comparison of Performance Metrics.
| Methods | Accuracy (%) | Precision (%) | Recall (%) | F1-Score (%) |
|---|---|---|---|---|
| CH Selection | 97.56 | 98.99 | 96.87 | 98.34 |
| K-Prediction | 96.77 | 98.12 | 96.77 | 98.56 |
| Data Aggregation | 98.99 | 97.35 | 98.12 | 98.76 |
| Clustering based Data Fusion | 99.54 | 99.12 | 98.99 | 99.78 |
Fig. 12.

Comparison of Performance Metrics
Table 3 shows the comparison results of Precision, Recall, and F1-score ; These are differences between the proposed method utilizing the hierarchical clustering technique and other classifiers previously applied to agricultural data for event detection. The results shown crystallize the idea that established classifiers, namely LR, DT, and GNB38, have a rather low to moderate efficiency, and F1 scores fluctuate between 28 and 69 which points at shortcomings of the model in terms of detecting adequate events, On the other hand, the proposed hierarchical clustering method proves to have remarkably higher performance measures including; Precision = 97.89, Recall = 96.78 and f1-score = 96.45. This considerable improvement augments the efficiency of the proposed solution for the classification system of complex agricultural environments by offering higher dependability, thereby supporting its applicability for real-time event identification.
Table 3.
Performance metrics comparison of existing classifiers with proposed hierarchical clustering method.
| Methods | Precision | Recall | F1-score |
|---|---|---|---|
| LR [38] | 64 | 67 | 63 |
| DT [38] | 69 | 71 | 69 |
| GNB [38] | 66 | 33 | 28 |
| Proposed Method | 97.89 | 96.78 | 96.45 |
Evaluating the power consumption of a traditional network that relies only on routing nodes versus a network configuration that integrates edge processing within individual sensor nodes and routing nodes together provides important information about the energy efficiency of wireless sensor networks. By letting sensor nodes handle preliminary data processing and aggregation at the network’s edge and then forwarding summarized data to routing nodes, the mixed approach minimizes data transmission overhead while optimizing power consumption. Conventional routing-centric networks, on the other hand, might use more energy because of the continuous raw data relay. By utilizing edge processing capabilities, the hybrid approach exhibits the potential to increase network longevity and reduce energy consumption. In order to determine the most energy-efficient approach for particular applications, like smart agriculture or industrial monitoring, where sensor node operation and data reliability extended are critical, it is necessary to assess and compare the power usage of these two configurations.
As it has been earlier discussed, time complexity of the proposed hybrid algorithm involving hierarchical clustering along-with dynamism of data fusion techniques depends upon various factors. The hierarchical clustering process takes time proportional to the number of the sensor nodes and the complexity of forming the clusters depending on the structure and size of the network. After this, the dynamic data fusion performed for each cluster whereby the sensor data is preprocessed to eliminate redundancy and enhance accuracy adding more computational load. Further, the incorporation of Extreme Learning Machine (ELM) technology for real-time event classification makes it even more challenging especially given that the algorithm’s adjustment comes in real-time based on the received data feed. Altogether, the time complexity of the current algorithm is higher to other easy set of algorithms because it is able to construct in more steps, but the algorithm has been designed to perform less time complexity while making sure that efficient and fast and precise data processing in WSNs is achieved.
This duty cycling scheme demands the use of a higher number of control packets thereby incurring higher overhead in WSNs. Synchronous mechanism as compared to asynchronous mode require more control packets so that the node’s clock can be properly adjusted or synchronized, which is important to do coordinated transmissions and optimizing the power consumption. Still, this synchronizing process is quite resource-consuming, and at the same time, it might cause a network load growth. On the other hand in asynchronous where the nodes work independently and do not share a common clock, there is packet/ data retransmission to be successful in communication especially when there is collision or packet loss. This retransmission further enhances the communication overhead, thus may impact on the energy efficiency and the network performance.
Conclusion and future work
In order to improve energy efficiency and event detection precision in smart agriculture, hierarchical clustering-based dynamic data fusion algorithms have shown significant promise when implemented in WSNs. The difficulties posed by widespread sensor deployments in agricultural fields, where energy restrictions and data processing overheads are crucial concerns, have been addressed by the integration of these cutting-edge algorithms. The WSNs effectively group sensor nodes into clusters by using the hierarchical clustering approach, which minimizes pointless communication and increases the network’s overall lifespan. By intelligently combining sensor readings, the dynamic data fusion technique reduces data processing and communication costs, enabling more precise event detection and quicker decision-making in agricultural applications. Hierarchical clustering and dynamic data fusion combined with WSNs for smart agriculture have the potential to completely change how farming is done. This novel method paves the way for sustainable, resource-efficient, and technologically advanced agricultural systems, ultimately promoting global food security and economic prosperity in the agricultural sector. It does this by utilizing energy-efficient data processing and precise event detection. However, ongoing research and development are required to maximize these algorithms’ performance, scalability, and compatibility with a variety of agricultural settings in order to fully realize the benefits they offer. However, the developments in this field show a promising future for integrating smart agriculture with cutting-edge WSN and data fusion methods. Nonetheless, the employ of the hierarchical clustering based dynamic data fusion algorithms reduces energy consumption and enhances event detection in smart agriculture with the following drawbacks. However, the use of hierarchical clustering may lead to additional complications in the network configuration and could increase the need to fine tune the parameters of the clusters involved and maybe an additional overhead involved in the formation of the clusters. Moreover, as a result of the use of such dynamic data fusion approach redundancy is minimized but the amount of required computations may increase and thus slowdowns in data processing might be observed, specifically in case of numerous sensors available. Such factors could affect the real-time operation and future capacity of the system, and especially in large scale agriculture.
Hierarchical organization for data fusion is rather effective in improving response times. It means that, by letting nodes of lower levels preliminary process their information before sending them to the CH, the volume of data to be aggregated at each CH would be substantially diminished. This distributed approach not only enhances the rate of data fusion, but also reduces the burden processed on CHs. With the utilization of the genetic algorithms to select the best CHs, the proposed method exhibits an efficient way to improve network performance. Through the use of a genetic algorithm approach, it is easy to produce the best set of CHs in terms of energy levels, proximity and node density in the shortest time possible. It is common to calibrate the CHs more often when they are selected randomly, thus the reduction of calibrating the CHs will minimize the response time, and in turn improve the overall network performance. While proximity can be used as the basic criterion for clustering it does not provide for variations in density of nodes, topography, or other physical conditions that have an impact on the functionality of the sensors or on the reliability of the data collected. In the sparse scenarios where nodes are placed or concentrated in some regions, the criterion of proximity may result in the formation of unsuitable clusters and slow data aggregation. However, when there is high variation of the environment, for example in the agricultural situation, the variability of the soil or types of crops and climatic conditions within micro zones must also be used together with distance to increase clustering efficiency. Exclusion of these additional parameters might weaken the stability of the clustering approach which, in turn, complicates the enhancement of the network’s performance and reliability in practical scenarios. It is thus important to overcome this limitation using a more encompassing clustering strategy that considers other factors to enhance the prospects of sensor networks across different agricultural environments.
Author contributions
Dhamodharan Srinivasan and Ajmeera Kiran wrote the main manuscript text. S. Parameswari and Jeevanatham Vellaichamy prepared Figs. 1, 2, 3, 4, 5, 6, 7, 8, 9, 10, 11 and 12. All authors reviewed the manuscript.
Funding
Not applicable.
Data availability
The datasets used and/or analysed during the current study available from the corresponding author on reasonable request.
Declarations
Competing interests
The authors declare no competing interests.
Conflict of interest
The authors declare no conflict of interest.
Consent to publish
All the authors gave permission to Consent to publish.
Footnotes
Publisher’s note
Springer Nature remains neutral with regard to jurisdictional claims in published maps and institutional affiliations.
References
- 1.Balraj, L., Prasanth, A., Sowndarya, K. D. & Kuntavai, T. ‘A Lightweight Blockchain Scheme for Secure Data Communication in Internet of Things-enabled Wireless Sensor Network’, in International Conference on Smart Systems for applications in Electrical Sciences (ICSSES), IEEE, 2024, pp. 1–6. (2024).
- 2.Ahmed, S. ‘Energy Aware Software Defined Network Model for Communication of Sensors Deployed in Precision Agriculture’, Sensors, vol. 23, no. 11, p. 5177, (2023). [DOI] [PMC free article] [PubMed]
- 3.Alghazzawi, D. et al. Congestion control in cognitive IoT-based WSN network for smart agriculture. IEEE Access.9, 151401–151420 (2021). [Google Scholar]
- 4.Aruchamy, P., Gnanaselvi, S., Sowndarya, D. & Naveenkumar, P. ‘An artificial intelligence approach for energy-aware intrusion detection and secure routing in internet of things-enabled wireless sensor networks’, Concurrency and Computation: Practice and Experience, vol. 35, no. 23, p. e7818, (2023).
- 5.Balraj, L. & Prasanth, A. An energy-aware software fault detection system based on hierarchical rule approach for enhancing quality of service in internet of things-enabled wireless sensor network. Trans. Emerg. Telecommunications Technol.35 (4), e4971 (2024). [Google Scholar]
- 6.Ayaz, M., Ammad-Uddin, M., Sharif, Z., Mansour, A. & Aggoune, E. H. M. Internet-of-things (IoT)-based smart agriculture: toward making the fields talk. IEEE Access.7, 129551–129583 (2019). [Google Scholar]
- 7.Bhasker, B. & Murali, S. An energy-efficient cluster-based data aggregation for agriculture irrigation management system using wireless sensor networks. Sustain. Energy Technol. Assess.65, 103771 (2024). [Google Scholar]
- 8.Haque, M. E. ‘Dynamic energy efficient routing protocol for wireless ad-hoc and sensor networks’, Master’s Thesis, King Fahd University of Petroleum and Minerals (Saudi Arabia), (2015).
- 9.Suganyadevi, K., Nandhalal, V., Palanisamy, S. & Dhanasekaran, S. ‘Data security and safety services using modified timed efficient stream loss-tolerant authentication in diverse models of VANET’, in International Conference on Edge Computing and Applications (ICECAA), IEEE, 2022, pp. 417–422. (2022).
- 10.Lakhwani, K., Gianey, H., Agarwal, N. & Gupta, S. ‘Development of IoT for smart agriculture a review’, in Emerging Trends in Expert Applications and Security: Proceedings of ICETEAS 2018, Springer, pp. 425–432. (2019).
- 11.Preeti, R., Kaur & Singh, D. Dimension learning based chimp optimizer for energy efficient wireless sensor networks. Sci. Rep.12 (1), 14968 (2022). [DOI] [PMC free article] [PubMed] [Google Scholar]
- 12.Indrapandi, A. & Rizwana, S. ‘Smart agriculture monitoring system based data aggregation process in IoT and WSN using multiple sensor nodes’. Turkish Online J. Qualitative Inq., 12, 12842–12859 (2021).
- 13.Alami, H. E. & Najid, A. ECH: an enhanced clustering hierarchy approach to maximize lifetime of wireless sensor networks. Ieee Access.7, 107142–107153 (2019). [Google Scholar]
- 14.Dhanasekaran, S., Ramalingam, S., Baskaran, K. & Vivek Karthick, P. Efficient distance and connectivity based traffic density stable routing protocol for vehicular ad Hoc networks. IETE J. Res.70 (2), 1150–1166 (2024). [Google Scholar]
- 15.Ghorpade, S. N. et al. Enhanced differential crossover and quantum particle swarm optimization for IoT applications. IEEE Access.9, 93831–93846 (2021). [Google Scholar]
- 16.Gheisari, M. et al. An efficient cluster head selection for wireless sensor network-based smart agriculture systems. Comput. Electron. Agric.198, 107105 (2022). [Google Scholar]
- 17.Han, B. et al. ‘A novel adaptive cluster based routing protocol for energy-harvesting wireless sensor networks’, Sensors, vol. 22, no. 4, p. 1564, (2022). [DOI] [PMC free article] [PubMed]
- 18.Kaur, P., Kaur, K., Singh, K. & Kim, S. Early forest fire detection using a protocol for energy-efficient clustering with weighted-based optimization in wireless sensor networks. Appl. Sci.13, 3048 (2023).
- 19.Khan, M. N. et al. Energy-efficient dynamic and adaptive state-based scheduling (EDASS) scheme for wireless sensor networks. IEEE Sens. J.22 (12), 12386–12403 (2022). [Google Scholar]
- 20.Lee, J. S. & Teng, C. L. An enhanced hierarchical clustering approach for mobile sensor networks using fuzzy inference systems. IEEE Internet Things J.4 (4), 1095–1103 (2017). [Google Scholar]
- 21.Lin, C. et al. Energy-optimal data collection for unmanned aerial vehicle-aided industrial wireless sensor network-based agricultural monitoring system: a clustering compressed sampling approach. IEEE Trans. Industr. Inf.17 (6), 4411–4420 (2020). [Google Scholar]
- 22.Lu, W. et al. Energy efficiency optimization in SWIPT enabled WSNs for smart agriculture. IEEE Trans. Industr. Inf.17 (6), 4335–4344 (2020). [Google Scholar]
- 23.Nagaraja, G., Soppimath, A. B., Soumya, T. & Abhinith, A. ‘IoT based smart agriculture management system’, in 4th International Conference on Computational Systems and Information Technology for Sustainable Solution (CSITSS), IEEE, 2019, pp. 1–5. (2019).
- 24.Gökhan Nalbant, K., Alsuhibany, S. A., Hassan Alshehri, A., Hatira, M. & Choi, B. J. An intelligent algorithm for energy efficiency optimization in software-defined wireless sensor networks for 5G communications. PLOS ONE. 19 (6), e0301078 (2024). [DOI] [PMC free article] [PubMed] [Google Scholar]
- 25.Qureshi, K. N., Ahmad, A., Piccialli, F., Casolla, G. & Jeon, G. Nature-inspired algorithm-based secure data dissemination framework for smart city networks. Neural Comput. Appl.33, 10637–10656 (2021). [Google Scholar]
- 26.Zhang, S. et al. Aug., ‘UAV based defect detection and fault diagnosis for static and rotating wind turbine blade: a review’, Nondestructive Testing and Evaluation, pp. 1–39, (2024). 10.1080/10589759.2024.2395363
- 27.Xiong, P. et al. ‘Fault diagnosis of UAV based on adaptive siamese network with limited data’. IEEE Trans. Instrum. Meas.72 (2023).
- 28.Bao, W., Du, X., Wang, N., Yuan, M. & Yang, X. ‘A defect detection method based on BC-YOLO for transmission line components in UAV remote sensing images’. Remote Sens.14, 5176 (2022).
- 29.Yang, P., Wen, C., Geng, H. & Liu, P. ‘Intelligent fault diagnosis method for blade damage of quad-rotor UAV based on stacked pruning sparse denoising autoencoder and convolutional neural network’, Machines, vol. 9, no. 12, p. 360, (2021).
- 30.Wang, B., Peng, X., Jiang, M. & Liu, D. Real-time fault detection for UAV based on model acceleration engine. IEEE Trans. Instrum. Meas.69 (12), 9505–9516 (2020). [Google Scholar]
- 31.Pandiyaraju, V., Logambigai, R., Ganapathy, S. & Kannan, A. An energy efficient routing algorithm for WSNs using intelligent fuzzy rules in precision agriculture. Wireless Pers. Commun.112 (1), 243–259 (2020). [Google Scholar]
- 32.Ramalingam, S., Dhanasekaran, S., Sinnasamy, S. S., Salau, A. O. & Alagarsamy, M. ‘Performance enhancement of efficient clustering and routing protocol for wireless sensor networks using improved elephant herd optimization algorithm’, Wireless Networks, vol. 30, no. 3, pp. 1773–1789, (2024).
- 33.Hu, L. & Evans, D. ‘Localization for mobile sensor networks’, in Proceedings of the 10th annual international conference on Mobile computing and networking, pp. 45–57. (2004).
- 34.Qureshi, K. N., Bashir, M. U., Lloret, J. & Leon, A. ‘Optimized cluster-based dynamic energy-aware routing protocol for wireless sensor networks in agriculture precision’, Journal of sensors, vol. no. 1, p. 9040395, 2020. (2020).
- 35.Bhindu, K. M. & Yogesh, P. ‘An Energy Efficient Cluster Based Data Aggregation in Wireless Sensor Network’, in 11th International Conference on Advanced Computing (ICoAC), IEEE, 2019, pp. 103–110. (2019).
- 36.Kreutz, D. et al. ‘Software-defined networking: A comprehensive survey’, Proceedings of the IEEE, vol. 103, no. 1, pp. 14–76, (2014).
- 37.Katiyar, V., Chand, N. & Soni, S. Clustering algorithms for heterogeneous wireless sensor network: a survey. Int. J. Appl. Eng. Res.1 (2), 273 (2010). [Google Scholar]
- 38.Sahu, A. et al. Multi-source Multi-domain Data Fusion for Cyberattack Detection in Power systems. IEEE Access.9, 119118–119138. 10.1109/ACCESS.2021.3106873 (2021). [Google Scholar]
Associated Data
This section collects any data citations, data availability statements, or supplementary materials included in this article.
Data Availability Statement
The datasets used and/or analysed during the current study available from the corresponding author on reasonable request.