

Abstract
Proteins encoded by exons are critical for cellular functions, and mutations in these genes often result in significant phenotypic effects. The cerebellum is linked to various heritable human disease phenotypes, yet genome-wide association studies have struggled to capture the effects of rare variants on cerebellar traits. This study conducts a large-scale exome association analysis using data from approximately 35,000 UK Biobank participants, examining seven cerebellar traits, including total cerebellar volume and white matter microstructure. We identify 90 genes associated with cerebellar traits, 60 of which were previously unreported in genome-wide association studies. Notable findings include the discovery of genes like PRKRA and TTK, as well as RASGRP3, linked to cerebellar volume and white matter microstructure. Gene enrichment analysis reveals associations with non-coding RNA processing, cognitive function, neurodegenerative diseases, and mental disorders, suggesting shared biological mechanisms between cerebellar phenotypes and neuropsychiatric diseases.
Subject terms: Genomics, Neurological disorders
Large-scale exome association analysis of UKBB data examining seven cerebellar traits, identifies 90 genes, 60 of which are novel, and suggests links between cerebellar volume and microstructure, and neuropsychiatric diseases.
Introduction
Proteins encoded by exons are crucial for cellular functions, and mutations can lead to significant phenotypic effects. The cerebellum, involved in motor and non-motor tasks, is linked to various disease phenotypes and exhibits notable heritability1–4. Alterations in cerebellar volume are associated with neurodegenerative disorders, with its white matter microstructure playing a key role in both motor coordination and non-motor functions. These white matter tracts, containing afferent and efferent nerve fibers, facilitate communication with other brain regions and are closely related to neurodegenerative and psychiatric diseases.
Despite previous genome-wide association studies (GWAS) that have identified numerous genetic markers associated with diseases and phenotypes, these studies have primarily focused on common variants (minor allele frequencies (MAF) greater than 1%), which typically exert small effects. Moreover, GWAS often pinpoint disease- or phenotype-associated loci within non-coding regions of the genome, complicating efforts to elucidate molecular disease mechanisms. In contrast, whole-exome sequencing (WES) technology, which concentrates on the protein-coding regions of the genome, provides an opportunity to explore rare variants that may have been overlooked or inaccurately estimated in traditional GWAS5. However, despite WES’s potential advantages in understanding disease and phenotype, there remains a paucity of studies utilising large-scale WES data to investigate the cerebellum. Consequently, research employing WES can furnish a more comprehensive understanding of the cerebellum’s genetic architecture and provide a scientific foundation for developing strategies to address cerebellum-related diseases.
To our knowledge, the WES analysis conducted in this study represents one of the most extensive investigations of cerebellar genetics to date. Utilising data from the UK Biobank, we performed univariate association tests and gene-based analyses on approximately 35,000 participants. We examined the relationship between genetic variation and both the total volume of the cerebellum and its white matter microstructure, including fractional anisotropy (FA) and mean diffusivity (MD), in the superior, middle and inferior cerebellar peduncles.
Results
Description of the study population and data
In this study, we utilised phenotypic and genetic data from the UK Biobank, including exome sequencing data and traits associated with the cerebellum (Supplementary Fig. 1). To ensure data quality, we implemented a series of quality control steps on the exome sequencing data to exclude low-quality variants and samples. Our main association analysis included approximately 35,000 White British individuals aged 45–83 years, with 52.91% of the participants being women. The primary cerebellum-related trait of interest was the total volume of the cerebellum. We identified 18,745,074 genetic variants encompassing 160,369 common variants (MAF > 1%) and 18,584,705 rare variants (MAF < 1%). The overall study design is illustrated in Fig. 1.
Fig. 1. Design of the study.
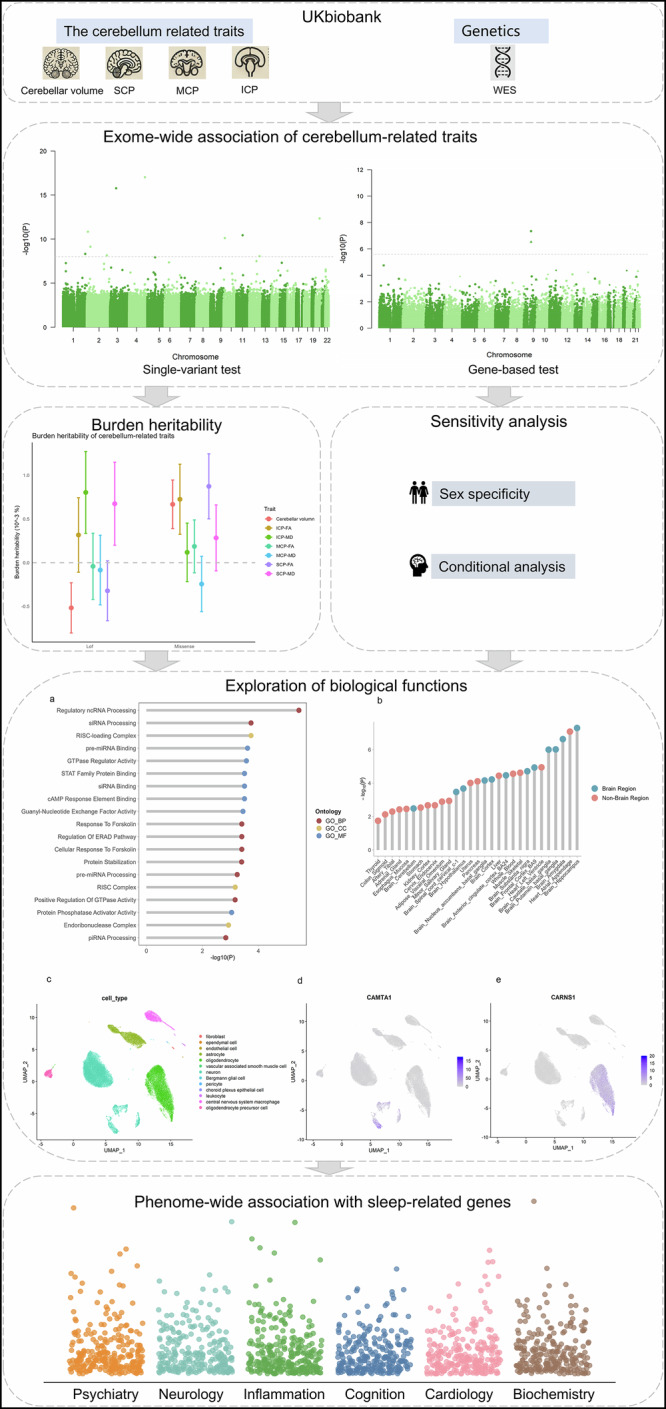
The analysis utilised cerebellum-related traits and whole exome sequencing data. A whole exome genome-wide association analysis was conducted, including single-variant association tests and gene-based aggregation tests. The workflow incorporated BHR, sex-specific and conditional analyses to explore genetic contributions to cerebellar traits. Biological functions of the identified genes were analysed through GO enrichment, tissue expression profiling and single-cell data analysis. Finally, a PHEWAS was performed to investigate the phenotypic associations of the identified genes.
Exome-wide association analysis of cerebellum-related traits
To determine the extent to which different types of mutations affect the cerebellum, we assessed the effects of missense mutations and loss-of-function (LOF) variant burdens on cerebellar traits. To further explore the relationship between cerebellar traits and genetic variation, we used SAIGE-GENE+ to calculate associations at the single-variant and gene-based levels (Figs. 2 and 3). Notably, 60 of these genes have not been reported in previous GWAS, highlighting novel genetic insights into cerebellar function. Notably, PRKRA and TTK emerged from both single-variant and gene-set analyses.
Fig. 2. Whole exome genome-wide single-variant tests for cerebellum-related traits.

The Manhattan plot displays the results of single-variant tests associated with cerebellum-related traits, including total cerebellar volume, SCP-FA, SCP-MD, MCP-FA, MCP-MD, ICP-FA and ICP-MD. The x-axis represents the position of single variants across the 22 chromosomes, while the y-axis indicates the −log10 P-values for each association. The grey dashed line denotes the significance threshold (P < 1 × 10⁻⁸). Variants significantly associated with cerebellum-related traits are labelled with their corresponding genes, with red indicating newly identified genes.
Fig. 3. Whole exome genome-wide gene-level tests for cerebellum-related traits.

The Manhattan plot displays the results of gene-level tests associated with cerebellum-related traits, including total cerebellar volume, SCP-FA, SCP-MD, MCP-FA, MCP-MD, ICP-FA and ICP-MD. The gene-level aggregation tests utilised rare variants with two different annotation sets (LOF and LOF + missense) and two maximum MAF thresholds (1% and 0.1%, respectively). The x-axis represents the position of genes across the 22 chromosomes, while the y-axis indicates the −log10 P-values for each association. The grey dashed line denotes the significance threshold with Bonferroni correction (P < 2.5 × 10⁻⁶). Newly identified genes are highlighted in red.
First, we conducted single-variant WES analyses to identify the genetic loci associated with cerebellar traits (Supplementary Data 1, Fig. 2). Using a significance threshold of P < 1 × 10⁻⁸, we identified 192 genetic associations with cerebellum-related traits, mapping these loci to 81 genes. Among these, 52 genes were newly identified through single-variant analysis, including 14 genes linked to total cerebellar volume and 37 genes associated with white matter microstructure. Notably, RASGRP3 was associated with cerebellar volume and cerebellar white matter microstructure.
The PAPPA gene exhibited the strongest association with total cerebellar volume (chr9:116302764:C:T, β = 0.1444, P = 1.09 × 10⁻²⁹), consistent with prior cerebellar GWAS findings. Among the newly discovered genes, IP6K2 (chr3:48689679:G:A, β = −0.0442, P = 9.99 × 10⁻¹¹) showed the strongest association, followed by ATF7 (chr12:53543094:GA:G, β = 0.0560, P = 1.76 × 10⁻¹⁰). The weakest association after screening was observed for the QSOX2 gene (chr9:136218808:C:T, β = 0.0412, P = 4.60 × 10⁻⁹). Regarding cerebellar white matter microstructure, 52 genes were identified as significant loci, of which 47 were novel discoveries. Among these, PPARGC1A (chr4:2381:T:C, β = −0.0937, P = 1.40 × 10⁻²⁵) was most strongly associated with fractional anisotropy of the superior cerebellar peduncle (SCP-FA). ALDH1A2 was the only gene newly associated with fractional anisotropy of the middle cerebellar peduncle (MCP-FA) (chr15:57960864:C:T, β = −0.0418, P = 7.83 × 10⁻⁹).
Interestingly, the PPWD1 gene was associated only with SCP-FA in earlier GWAS studies. However, in our analysis, PPWD1 was also newly associated with fractional anisotropy of the inferior cerebellar peduncle (ICP-FA) (chr5:65569831:T:C, β = 0.0660, P = 9.07 × 10⁻¹⁵) and mean diffusivity of the superior cerebellar peduncle (SCP-MD) (chr5:65569578:A:G, β = 0.0752, P = 4.98 × 10⁻²¹). Additionally, TLL1 showed significant associations with both SCP-MD (chr4:166031055:G:A, β = −0.0859, P = 5.53 × 10⁻¹⁹) and mean diffusivity of the middle cerebellar peduncle (MCP-MD) (chr4:166031055:G:A, β = −0.0839, P = 9.47 × 10⁻¹⁸) at the same site. For mean diffusivity of the inferior cerebellar peduncle (ICP-MD), the main association was with PNLDC1 (chr6:159804518:G:C, β = −0.0631, P = 5.61 × 10⁻¹¹).
Second, we performed a gene-based analysis considering LOF and missense variants for each gene, with two MAF thresholds (<1% and <0.1%). After Bonferroni correction (P < 2.5 × 10⁻⁶), we identified eight novel genes significantly associated with cerebellum-related traits, which are presented in the Supplementary Data 2 (Fig. 3). For cerebellar volume, genes such as SCUBE2 (β = −0.0077, P = 3.25 × 10⁻⁷), DISP1 (β = −0.0032, P = 1.88 × 10⁻⁶) and EP300 (β = 0.0088, P = 1.93 × 10⁻⁶) were significantly associated with total cerebellar volume, marking novel discoveries.
Five novel genes were identified for cerebellar white matter microstructure. PRUNE2 was associated with SCP-FA (β = −0.0030, P = 4.52 × 10⁻⁸) and ICP-FA (β = −0.0026, P = 1.15 × 10⁻⁶). Genes associated with MCP-FA included TTK (β = 0.0047, P = 1.05 × 10⁻⁷), DPYSL2 (β = −0.1298, P = 1.86 × 10⁻⁶) and C12orf80 (β = −0.0126, P = 1.15 × 10⁻⁶). Additionally, TTK (β = 0.0048, P = 2.46 × 10⁻⁹) and PRKRA (β = 0.0146, P = 2.83 × 10⁻¹⁰) were associated with SCP-MD, while PRKRA (β = 0.0132, P = 1.35 × 10⁻⁸) was mainly linked to MCP-MD. No significant genes were found for ICP-MD.
Most single variants in the genes identified by the gene-based test showed consistent directional effects, forming a long allele series (Supplementary Data 3). Additionally, the burden of rare variants followed the same direction as the accumulation of each variant. Similar to the GWAS results, we discovered new common genetic loci across the cerebellar white matter tracts, indicating shared genetic factors influencing the white matter tract microstructure.
Sex analysis
For all identified significant correlations, we conducted a sex sensitivity analysis to assess potential sex-specific effects on cerebellar traits (Supplementary Data 10, 11). Univariate and gene-based analyses were performed separately for male and female participants. The results indicated that the β values of the associations were largely similar to the original values, suggesting consistency across sexs. However, certain genes, such as AMPD3 and PAX3, exhibited stronger associations in females, indicating that sex may influence cerebellar development.
Conditional analysis
We then conducted conditional analyses to evaluate whether the identified genes were independent of nearby common variants. Initially, we performed a common variant association analysis (MAF > 0.5%) within a ± 500 kb region surrounding each gene. We then repeated the gene-based folding analysis for the identified genes, incorporating clustered common variants as covariates. Notably, based on the comparison of the conditional analysis results with the original p-values, the p-values for DISP1 and SCUBE2 remain below 0.05 after conditional analysis, indicating statistical significance. However, the significance and effect size of DISP1 were diminished, while the p-value for SCUBE2 showed no significant change and its effect size remained similar. This suggests that the associations of SCUBE2 and DISP1 with rare variants may not be driven by common variants in their vicinity. In contrast, after conditional analysis, the p-value for EP300 became non-significant and its effect size decreased, indicating that its association with rare variants might be attributed to more common variants nearby (Supplementary Data 12).
Burden heritability of cerebellum-related traits
Bayesian Heritability Regression (BHR) is a method for quantifying the heritability explained by the burden of rare coding variants. Weiner et al. demonstrated that rare coding variants account for an average of 1.3% of phenotypic variation6. Variants were stratified into bins according to allele frequency and functional class, as suggested by the BHR methodology.
For rare LOF variants, significant non-zero burden heritability was observed in ICP-FA (H2 = 0.32%, S.E. = 0.43%), SCP-MD (H2 = 0.68%, S.E. = 0.48%) and ICP-MD (H2 = 0.80%, S.E. = 0.47%) (Supplementary Data 4, Fig. 4). Compared to the LOF variants, the missense variants showed higher heritability, ranging from 0.12% to 0.87% for the burden of rare variants. The highest heritability was observed for SCP-FA (H2 = 0.87%, S.E. = 0.37%), followed by ICP-FA (H2 = 0.73%, S.E. = 0.40%) and cerebellar volume (H2 = 0.67%, S.E. = 0.28%), with the lowest heritability observed in ICP-MD (H2 = 0.12%, S.E. = 0.33%).
Fig. 4. Burden heritability of cerebellum-related traits.

a Burden heritability estimates and 95% confidence intervals for rare variants (1 × 10⁻⁵ ≤ MAF < 1 × 10⁻³) in the LOF and missense variant groups. b Burden genetic correlation estimates and 95% confidence intervals between LOF and missense variants within rare variant groups. The dashed line indicates a correlation of zero, while the solid line represents the average correlation across all cerebellum-related traits.
We then used BHR to calculate the genetic correlations between LOF and missense variants across cerebellum-related traits (Supplementary Data 5, Fig. 4). In ICP-MD (H2 = 14.04%, S.E. = 93.29%) and SCP-MD (H2 = 11.18%, S.E. = 78.24%), the LOF and missense variants were genetically correlated, suggesting that these variants may have similar phenotypic effects within the same gene in ICP-MD and SCP-MD.
We also estimated rare-variant-burden genetic correlations for different cerebellar traits under the rare variant LOF and missense categories (Supplementary Data 6). The results indicated a substantial genetic correlation between ICP-FA and SCP-MD (Rg = 76.89%, S.E. = 61.69%) for rare LOF variants, suggesting a possible shared genetic architecture among these traits. This finding is consistent with the univariate analysis results.
Biological function of cerebellum-related genes
To characterise the biological properties of the identified genes, we first conducted a pathway enrichment analysis. The Gene Ontology (GO) enrichment analysis revealed that the 54 significant single-variant-associated genes and eight novel genes identified in the gene-based test showed significant enrichment in various biological pathways (Supplementary Data 7, Fig. 5, Supplementary Fig. 2), particularly in non-coding RNA (ncRNA) processing and regulation. Notably, these pathways included regulatory ncRNA processing (P = 3.57 × 10⁻¹⁰) and siRNA processing (P = 1.84 × 10⁻¹⁰). In terms of cell response and signal transduction, the cellular response to forskolin and response to forskolin pathways both exhibited significant enrichment (P = 3.92 × 10⁻¹⁰). For protein degradation and quality control, the regulation of the ERAD pathway was significantly enriched (P = 3.92 × 10⁻¹⁰). Additionally, biological function analysis showed that these genes were significantly enriched in pre-miRNA binding (P = 2.45 × 10⁻¹⁰) and GTPase regulator activity (P = 2.69 × 10⁻¹⁰). Regarding cellular components, the analysis indicated a significant association with the RISC-loading complex (P = 1.84 × 10⁻¹⁰).
Fig. 5. Biological functions of genes associated with cerebellum-related traits.

a Enrichment analysis of 60 significant genes identified in single-variant and gene-level tests using the GO database. GO_BP refers to GO terms from the biological process domain, GO_CC refers to GO terms from the cellular component domain, and GO_MF refers to GO terms from the molecular function domain. b Enrichment analysis of 68 genes across 54 tissues using FUMA in GTEx. The top 29 tissues are shown in the figure. c Relative expression of cerebellum-associated genes in adult cerebellum single-cell data. Uniform manifold approximation and projection was used to visualise the scRNA-seq data. The colour of each point represents the cell type. d Feature plot showing the expression levels of CAMTA1 across different cell types. e Feature plot showing the expression levels of CARNS1 across different cell types.
We further investigated the expression of the identified genes across different tissues and cell types (Fig. 5). An enrichment analysis of 60 significant genes across 54 tissues from the GTEx project revealed that the top five significantly enriched tissues were Brain – Hippocampus (P = 5.01 × 10⁻¹⁰), Heart – Atrial Appendage (P = 8.25 × 10⁻¹⁰), Brain – Amygdala (P = 2.32 × 10⁻¹⁰), Brain – Substantia nigra (P = 9.57 × 10⁻¹⁰) and Brain – Caudate (basal ganglia) (P = 9.92 × 10⁻¹⁰) (Fig. 5, Supplementary Data 8). Next, we used single-cell RNA sequencing (scRNA-seq) data from the adult cerebellum to explore gene expression in different cell types (Fig. 5, Supplementary Fig. 3). The results showed that CAMTA1, NEBL, ADCY8, PCNX2, DPYSL2, PPARGC1A and KIAA1109 had significantly higher expression in neuronal cells (Supplementary Fig. 3).
Phenotypic association with cerebellum-related genes
To explore the association between cerebellum-associated genes and a wide range of phenotypes, we conducted phenotypic association analysis of 60 cerebellum-associated genes identified in single-variant tests (Supplementary Data 9). The phenotypes were categorised into six groups that included 11 behavioural disorders, 10 neurological disorders and six cardiovascular disorders. In our continuous phenotypic analysis, we examined 10 cognitive tasks, 29 blood biochemical characteristics and seven inflammatory indicators.
After correcting for false discovery rate, the phenome-wide association study (PHEWAS) revealed significant associations among the identified genes and phenotypes related to inflammation, biochemistry, cognition, neurodegenerative diseases and behavioural and mental disorders. RABGAP1L (P = 6.87 × 10⁻⁶) was associated with cognitive function. IHO1 (P = 3.00 × 10⁻⁴) was linked to essential hypertension. CENPK (P = 7.78 × 10⁻⁴) was associated with persistent delusional disorders. PRKRA (P = 1.54 × 10⁻³) showed a significant association with Parkinson’s disease.
Discussion
In this comprehensive whole-exome analysis, we identified 90 genes significantly associated with seven cerebellar traits, including cerebellar volume and white matter microstructure (P < 1 × 10⁻⁸ for single-variant and P < 2.5 × 10⁻¹⁰ for gene-based tests). Of these, 60 genes were previously unreported, with shared genetic factors among cerebellar white matter tracts, such as TTK and TLL1. We replicated 27 genes from previous GWAS, including PAPPA and PPWD1, and found significant pathway enrichment in neuron-related processes, including non-coding RNA processing. PHEWAS identified associations with neurodegenerative diseases, cognitive function, and mental disorders. Rare LOF variants in ICP-FA explained 76.89% of phenotypic variation, and SCUBE2 rare variants were linked to cerebellar volume. These findings suggest that rare exon variations contribute to cerebellar development and share genetic mechanisms with neuropsychiatric diseases, providing insights for potential therapies.
In our single-variant analyses, we extended our understanding of the role of rare variants in cerebellum-related traits beyond previous GWAS that primarily focused on common variants. The genes identified in our study not only play key roles in regulating cerebellar structure and development but are also closely associated with various neuropsychiatric diseases and cognitive dysfunctions.
Specifically, mutations in the QARS1 gene can lead to protein synthesis disorders that impair the function of cerebellar neurons, resulting in cerebellar atrophy, epilepsy, malformations and early-onset ataxia7,8. Similarly, mutations in the EIF2B4 gene have been clinically linked to cerebellar atrophy and neurodegenerative changes, leading to leukoencephalopathy9,10. These findings underscore the cerebellum’s critical role in maintaining motor coordination and highlight its high sensitivity to genetic mutations.
The AMPD3 gene, involved in the adenylate metabolic pathway, is essential for providing sufficient energy supply to the brain, which is crucial for maintaining normal cerebellar function and structure11,12. Likewise, the IGFBP3 gene regulates the biological activity of insulin-like growth factors, potentially influencing cerebellar development and function via the insulin-like growth factor (IGF) pathway and its independent effects13. Another gene of interest, SP1, is implicated in Alzheimer’s disease, whereby functional defects may lead to the accumulation of β-amyloid (Aβ) and tau proteins, adversely affecting the development and survival of cerebellar neurons and ultimately causing cerebellar dysfunction14,15. Additionally, the ATF7 gene is associated with the regulation of multiple target genes in the stress response pathway and is linked to schizophrenia and depression16,17. In the cerebellum, ATF7 may play a role in maintaining cerebellar health by regulating neuronal stress responses and structural integrity18. The IP6K2 gene is involved in the phosphoinositide signalling pathway, and its functional defects may result in decreased neuronal survival and reduced cerebellar volume and have a potential impact on cognitive abilities in Alzheimer’s disease patients19–21 c. Although there is no direct evidence linking genes such as ABCG2, AMHR2, ARIH2, USP19, RASGRP3, IHO1, QSOX2 and TARBP2 to cerebellar volume, these genes may indirectly influence cerebellar volume by affecting neural development and function. Future studies are necessary to further explore the potential roles of these genes.
Among the genes associated with SCP-FA, the CAMTA1 gene was initially implicated in patients with intragenic deletions and duplications presenting with nonprogressive congecardation, ataxia, behavioural abnormalities and cerebellar anomalies22. Furthermore, the PPARGC1A gene, which encodes the PGC-1α protein, is crucial for mitochondrial production and energy metabolism, and its role in cerebellar function and neuroprotection is well documented23. Sequence variations in PPARGC1A may influence the manifestation of Huntington’s disease and contribute to its pathogenesis24. While CARNS1, RBM14, SHLD3 and TBC1D9B do not have direct evidence linking them to cerebellar or other neuropsychiatric diseases, the ALDH1A2 gene, which encodes aldehyde dehydrogenase, plays a pivotal role in retinoic acid metabolism in MCP-FA, a process closely associated with neural development25. Animal studies have indicated that dysregulation of ALDH1A2 increases motor neuron vulnerability26, and its association with schizophrenia has been observed in Chinese populations27, suggesting that ALDH1A2 and its metabolites may play diverse roles in different neurological diseases. In the context of ICP-FA, the TRAPPC13 gene has shown significance due to its role in regulating autophagy, which affects cerebellar health28. Dysregulation of TRAPPC13 may contribute to cerebellar autophagy disorders, thereby increasing the risk of neurodegenerative diseases such as Alzheimer’s and Parkinson’s15,29. The PPWD1 gene, which encodes a protein involved in RNA splicing and pre-mRNA processing, has been associated with SCP-FA in GWAS studies30, and our exome analysis suggests that PPWD1 is also linked to ICP-FA, indicating potential genetic overlap in cerebellar white matter microstructures.
In SCP-MD, mutations in the ATXN3 gene are known to cause Machado–Joseph disease, or spinocerebellar ataxia type 3, a prevalent inherited ataxia characterised by progressive cerebellar degeneration and motor coordination disorders31–33. The ARHGEF7 and PREX1 genes are involved in neuronal development and synaptic plasticity, where ARHGEF7 haploinsufficiency has been linked to epilepsy34 and PREX1 may impact cognitive function, particularly in CD4+ T cells of the elderly35. The CREB1 and ADCY8 genes are pivotal in memory and learning processes36–38, suggesting that disruptions in cerebellar white matter microarchitecture may adversely affect these cognitive functions. Studies on PRDM2 have proposed that its expression and function in T-cell activation could influence neuroinflammation39, with neuroinflammation caused by immune irregularities impacting cerebellar function and neuropsychiatric health. Furthermore, KIAA1109 and RASGRF2 are associated with severe brain development disorders and joint contracture40. Recent studies have indicated that disruptions in the RASGRF2 gene may be a candidate for developmental delay41. In the context of MCP-MD and ICP-MD, the PDIA6 and PPP2R5B genes play crucial roles in intracellular protein folding and homeostasis maintenance. PDIA6 may also contribute to neuroprotection in Alzheimer’s disease by regulating the unfolded protein response and protein homeostasis42,43. PRDM4 is mainly involved in transcriptional regulation, and while its specific role in neural development requires further investigation, its importance has been preliminarily acknowledged44,45.
To assess the impact of rare genetic variants with a MAF of less than 1% on cerebellum-associated traits, we performed a gene-based analysis and identified eight previously unreported cerebellum-associated genes. Our study confirmed a significant association between SCUBE2, DISP1 and EP300 with cerebellar volume. However, the conditional analysis suggests that the association of rare variants in EP300 may be driven by more common variants in its vicinity. Both SCUBE2 and DISP1 are involved in regulating the hedgehog signalling pathway. SCUBE2, as an extracellular secretory protein, facilitates the diffusion and signal transduction of hedgehog proteins46, while DISP1 is primarily responsible for the extracellular release of hedgehog proteins47. Notably, DISP1 has also been found to potentially influence the response of bipolar disorder to medication, as identified in a GWAS48. Mutations in the EP300 gene have been linked to Rubinstein–Taybi syndrome (RTS), a rare autosomal dominant disorder characterised by intellectual disability, distinct facial features and cerebellar atrophy49,50. Certain mutation types in EP300, such as large deletions, are associated with more severe intellectual disabilities and autistic traits51,52. Understanding the mechanism of action of EP300 not only aids in the diagnosis and treatment of RTS but also provides new insights into other neurodevelopmental disorders involving cerebellar function.
In this study, we also found that PRUNE2, DPYSL2, C12orf80, PRKRA and TTK were significantly associated with cerebellar white matter microstructure. Recent studies have shown that certain variants of DPYSL2 are associated with an increased risk of schizophrenia, with the gene playing a role in neurodevelopmental disorders through the mTOR signalling pathway53. However, the role of PRUNE2 in schizophrenia has not yet been well defined. TTK is known for its role in chromosome segregation and the mitotic checkpoint regulation of cells54, with its significance in cell cycle and DNA repair potentially affecting the health and function of cerebellar neurons, thereby influencing global cerebellar function. Currently, functional studies on the C12orf80 gene are limited, and its potential role in the nervous system needs further exploration. Our analyses, both univariate and gene set–based, revealed significant associations between PRKRA and TTK with SCP-MD, providing strong evidence for their involvement in cerebellar function. PRKRA has been associated with early-onset primary dystonia (DYT-PRKRA)55. Recent studies have also discovered that frameshift mutations in the mouse PRKRA gene not only result in dystonia but also lead to abnormal cerebellar development and reduced phosphorylation of eIF2alpha56, suggesting a role for the cerebellum in coordinated movement disorders. These findings offer a new perspective on the role of the cerebellum in psychiatric disorders, indicating that therapies targeting these genes may simultaneously enhance cerebellar function and alleviate psychiatric symptoms, thereby achieving dual therapeutic benefits.
Our study delves deeper into the biomedical mechanisms underlying cerebellar-associated genes. GO pathway enrichment analysis reveals significant associations between these genes and the processing of regulatory non-coding RNAs and small interfering RNAs (siRNAs). Previous research has documented notable alterations in the expression of certain microRNAs (miRNAs), such as miR-223 and miR-124, in neurodegenerative diseases57–59. These miRNAs may exert indirect effects on the pathophysiology of cerebellar disorders by modulating key genes involved in neuroinflammation, apoptosis, and neuronal survival. Notably, through the TargetScanHuman 8.0 database, we identified five genes as targets of both miRNAs above (ARHGEF7, PRDM4, RABGAP1L, SP1, TLL1). The identification of these miRNA-target interactions opens new avenues for further research into how the regulation of these miRNAs could impact cerebellar function, particularly within the context of neurodegenerative diseases. Furthermore, in neurodegenerative disease models, including cerebellar atrophy and Alzheimer’s disease, aberrant siRNA processing disrupts the expression of disease-associated genes. This dysregulation may exacerbate neuronal damage and death, thereby impairing cerebellar function. Thus, abnormal siRNA processing may represent a crucial mechanism by which the cerebellum influences the progression of neurodegenerative diseases. Regarding cellular components, the analysis indicated a significant association with the RISC-loading complex. The RISC-loading complex is a multiprotein complex responsible for loading double-stranded small RNA precursors, such as siRNA or miRNA precursors, onto Argonaute proteins to form mature RNA-induced silencing complex (RISC). Dysfunction in this complex may be linked to neurodegenerative diseases and viral infections.
Our tissue and single-cell expression analysis of the 60 newly identified cerebellum-related genes revealed that these genes are highly expressed in neurons within the nervous system, a finding corroborated by our significant single-cell gene analysis. Beyond their associations with the hippocampus, amygdala and putamen, we also identified a significant relationship between these genes and the heart. In recent years, the physiological connection between the heart and the brain, known as the heart–brain axis, has gained increasing attention. The cardio-cerebral axis operates through a complex network of autonomic, hormonal and cytokine pathways and plays a vital role in various common diseases60. Understanding this mechanism is essential for enhancing prevention and treatment strategies for cardio-cerebral diseases61. For instance, Friedreich’s ataxia is an autosomal recessive disorder that affects both the cerebellum, leading to ataxia, and the heart, leading to cardiomyopathy62,63. These findings indicate a close relationship between the heart and cerebellum in both health and disease, suggesting that further investigation of these genes may uncover novel therapeutic approaches.
Our study’s strength lies in the large-scale exome analysis of cerebellar volume, combining univariate and gene-based approaches to uncover the genetics underlying cerebellar traits, with further insights from pathway enrichment and PHEWAS analyses into cerebellum-associated neuropsychiatric disorders. However, limitations include reliance on data from White British participants, limiting generalizability to other ethnicities, and the UK Biobank cohort’s bias toward healthy cerebellar features. Additionally, the snRNA-seq analysis, based on postmortem tissue from a small sample (n = 3), may be influenced by undiagnosed conditions and lacks detailed clinical data. Larger cohorts and validation in diverse populations, alongside exploration of gene-environment interactions, are needed to confirm the robustness of these findings and enhance their generalizability.
In summary, our study identified 60 novel genes associated with the cerebellum, playing crucial roles in its development and function. Mutations in these genes may link to neuropsychiatric disorders, suggesting a potential cerebellar involvement. The findings also validated associations with cognitive function, neuropsychiatric conditions, inflammation, and biochemical processes. This reveals common biological mechanisms between cerebellar phenotypes and neuropsychiatric diseases, offering insights for future diagnosis and treatment.
Materials and methods
Study populations and phenotypes
The UK Biobank is a large prospective cohort study that has collected phenotypic and genetic data from approximately 500,000 participants aged 38–72 years at the time of recruitment. This study received approval from the Northwest Multi-centre Research Ethics Committee, which ensured ethical oversight (https://www.ukbiobank.ac.uk/learn-more-about-uk-biobank/about-us/ethics). All ethical regulations relevant to human research participants were followed. Written informed consent was obtained from all participants. The dataset utilised in this analysis included demographic characteristics, cerebellar volume, biochemistry and information on circulatory, cognitive and neuropsychiatric disorders. This study was conducted under application number 104811, 221671. To mitigate the genetic influence of pathological states, we excluded individuals diagnosed with common dementia, stroke and other central nervous system disorders from the analysis (Supplementary Table 1). Cerebellar grey matter and white matter volumes provided by the UK Biobank team were used to calculate total cerebellar volume by summation (Supplementary Table 2). Additionally, we utilised the FA and MD of cerebellar white matter tracts from image-derived phenotypes provided by the UK Biobank. Due to the high genetic correlation of diffusion tensor imaging (DTI) measures between the two hemispheres (all Rg > 0.95, P < 1 × 10−100), we averaged the left and right DTI measures for each cerebellar peduncle. Outliers greater than five times the median absolute deviation were removed from all data.
Exome sequencing and quality control
Exome data were obtained from 454,756 participants in the UK Biobank64. The IDT XGEN Exome Research Panel v1.0 was used to capture the exome, and the sequencing scheme is detailed in the relevant literature5. In addition to centrally conducted quality control, we implemented comprehensive genotype-, variant- and sample-level quality control procedures, similar to those used in previous studies, to ensure a high-quality dataset65.
For genotype quality control, we require at least one heterozygous variant genotype with an allele balance ratio greater than or equal to 15% (AB ≥ 0.15), and at least one homozygous variant genotype. The same filtering is applied to INDEL variants, but with an INDEL depth filter of DP < 10 and an INDEL allele balance cutoff of AB ≥ 0.20. Multi-allelic variant sites in the PVCF file are normalized by left-alignment and represented as bi-allelic.
We then perform variant-level quality control and remove variants that fail the following filters: call rate <90%, failed a liberal Hardy–Weinberg Equilibrium (HWE) at P < 1 × 10⁻¹⁵ among unrelated samples, and monomorphic variants in the final dataset.
For sample quality control, we remove samples with withdrawn consent, duplicate samples, discrepancies between self-reported and genetically inferred sex, as well as unreasonable call rates or additional indicators of poor quality. We compute several quality metrics to identify poor-quality or duplicated samples, using high-quality autosomal variants present in both WES and array datasets to compute per-sample heterozygote concordance rates between WES calls and genotyping array calls. Genetic sex is inferred for each participant using the --check-sex option in PLINK, applying high-quality independent X-chromosomal markers. These markers are selected by excluding pseudo-autosomal regions (bp 2781479 – 155701383), filtering a list of variants in approximate linkage equilibrium using –indep-pairwise with a 200 kilobase window size, 100 step size, and an unphased-hardcall-r2 threshold of 0.05, and excluding call rates of <90%. We also exclude samples that fail a liberal HWE at P < 1 × 10⁻⁶ among unrelated samples.
We also applied the KING-robust algorithm for relatedness filtering (kinship coefficient threshold: 0.0442). Finally, we included approximately 35,000 individuals of White British descent in an all-exome association analysis of cerebellum-related traits.
Exome-wide association analysis
To identify genetic variants associated with cerebellum-related traits, univariate association tests and gene-based collapse tests were performed using SAIGE-GENE+ software. SAIGE-GENE+ is capable of simultaneously detecting rare and ultra-rare variants, where ultra-rare variants collapse into a single pseudo-marker to reduce data sparsity. For the single-variant association test, we included all variants with a minor allele count (MAC) ≥ 20. In the gene-based collapsing test, we applied two different maximum MAF cutoffs (1% and 0.1%) and two different variant annotation sets LOF and LOF plus missense variants—to perform the SKAT-O test. The correlation coefficient cutoff for the sparse genetic relationship matrix used for variance ratio estimation was set at 0.05.
For cerebellar volume and white matter microstructure analysis, normalisation was employed to adjust for continuous variables. In both the univariate and gene-based collapse tests, models were adjusted for age, sex, body mass index, scanner position parameters (lateral X, transverse Y, longitudinal Z and table position), age squared and the interaction between age squared and sex and the top 10 genetic principal components.
Sensitivity analysis for sex
For all identified significant correlations, we conducted a sensitivity analysis to examine the influence of sex. We performed univariate association tests and gene-based analyses separately for male and female participants to assess whether the outcomes were affected by sex differences.
Conditional analysis adjusting for nearby common variation
To determine whether the rare signals identified in the gene-based results were independent of nearby common variants, we performed a secondary gene-based analysis after adjusting for these variants. Initially, we conducted a common variant association analysis (MAF > 0.5%) within a genomic region 500 kb upstream and downstream of each significant gene. For this analysis, we utilised Plink v2.0 (https://www.coggenomics.org/plink/2.0/) to conduct genome-wide association analysis using genotype data from UK Biobank v3 imputation.We clustered the results with a cutoff of p < 1 × 10⁻⁵ and R2 < 0.01. Subsequently, we reran the gene-based analysis on the identified genes, adjusting for the aggregation of common variants.
Genotype data (version 3) of all 487,409 participants were from the UKB cohort. All blood samples were genotyped using the UK BiLEVE array and the UK Biobank axiom array. Details of the array design, genotyping, quality control, and imputation are available in a previous publication2. We performed quality control with PLINK 2.0 3 software. Single-nucleotide polymorphisms (SNPs) with call rates <95%, minor allele frequency <0.1%, and deviation from the Hardy–Weinberg equilibrium with P < 1 × 10−50 were excluded from the analysis. In addition, samples that were estimated to have no more than ten putative third-degree relatives were included in the analysis.
Burden heritability and burden genetic correlation
GWAS have identified hundreds of independent loci associated with cerebellar traits and estimated the heritability explained by common variations in the cerebellum to be approximately 0.4–0.5. However, the contribution of rare coding variants to heritability remains unclear. We employed the BHR6 tool (https://github.com/ajaynadig/bhr) to estimate the heritability explained by the gene burden of rare coding variants in cerebellar volume. Variants were stratified into bins based on allele frequency and functional category, as recommended by BHR. Specifically, variants with MAF < 1 × 10⁻⁵ were classified as ultra-rare, while those with 1 × 10⁻⁵ ≤ MAF < 1 × 10⁻³ were categorised as rare.
The functionality of each variant was defined according to the ‘Variable Comments’ section of the BHR documentation. All BHR analyses were conducted using the baseline documentation provided by BHR. Univariate BHR analyses were performed to estimate the heritability contribution for cerebellum-related traits, utilising variable-level summary statistics from SAIGE-GENE+ outputs. These statistics were used to obtain effect sizes for quantitative traits directly from the SAIGE-GENE+ results.
Functional enrichment analysis and tissue expression
We performed an enrichment analysis of 60 genes newly identified in the single-variant association test and the gene-based test. The GO database was selected as the reference for enrichment analysis, dividing GO terms into three categories: biological processes, cellular components and molecular functions. To gain further insight into how these genes influence cerebellar traits, we utilised the Functional Mapping and Annotation (FUMA) tool to examine the enrichment of the 60 genes across 54 different tissues from the Genotype-Tissue Expression (GTEx) project.
Single-cell expression
For single-cell expression analysis, we utilized publicly available single-cell data from the Human Brain Cell Atlas v1.0, which includes data from the cerebellum of three postmortem donors. Using single-nucleus RNA sequencing (snRNA-seq), we analysed data from cells isolated from the cerebellum comprising 59,236 features and 52,045 cells66. We obtained aggregate expression data from the cerebellum and processed it using the R package Seurat. The data were normalised and scaled before clustering and annotation of the scRNA-seq data. Data for this analysis can be accessed via the Human Cell Atlas repository (10.1126/science.add7046).
Phenome-wide association analysis
We performed a PHEWAS analysis to explore the relationships among genes and various phenotypes (Supplementary Table 3). In the disease analysis, we examined 11 mental and behavioural disorders, 10 neurological disorders and six cardiovascular diseases. For the continuous phenotypic analysis, we investigated 10 cognitive tasks, 29 blood biochemical characteristics and seven inflammatory indicators. The genotype corresponding to the loci identified in the single-variant analysis was used as the exposure variable. We conducted a PHEWAS on the selected phenotypes using the phesant package in R. For newly discovered loci in the single-variant tests, we employed linear or logistic regression models to identify associations between significant variants and phenotypes. All analyses were adjusted for age, sex and the first 10 ancestral principal components.
Statistics and reproducibility
Statistical analyses were conducted using the R package SAIGE-GENE+ v1.1.6.2 (https://github.com/saigegit/SAIGE/), which is capable of detecting rare and ultra-rare variants. Univariate association tests and gene-based collapse tests were performed to identify genetic variants associated with cerebellum-related traits. These tests were adjusted for potential confounding factors, including age, sex, body mass index, scanner position parameters, age squared, and the interaction between age squared and sex, as well as the top 10 genetic principal components.
The sample size for the main association analysis included approximately 35,000 White British individuals from the UK Biobank, aged 45–83 years, with 52.91% women. In total, 18,745,074 genetic variants were analysed, consisting of 160,369 common variants (minor allele frequency >1%) and 18,584,705 rare variants (minor allele frequency <1%).
For single-cell expression analysis, publicly available single-cell RNA sequencing data from the Human Brain Cell Atlas v1.0 were utilized. The dataset included data from three postmortem donors’ cerebellum (10.1126/science.add7046), consisting of 52,045 cells and 59,236 features. The data were processed using Seurat v4.3.0 (https://github.com/satijalab/seurat/), and normalized, scaled, and clustered before annotation.
Data quality control (QC) was performed using Hail (https://hail.is) and PLINK v2.0 (https://www.cog-genomics.org/plink/2.0/). Genotype QC involved removal of variants with call rates <90%, variants failing the Hardy–Weinberg equilibrium test (P < 1 × 10⁻¹⁵), and monomorphic variants. We also applied the KING-robust algorithm for relatedness filtering (kinship coefficient threshold: 0.0442). Outliers were removed if they exceeded five times the median absolute deviation (MAD). Sensitivity analysis was performed to examine the impact of genotype-derived sex by conducting separate univariate association tests and gene-based analyses for male and female participants.
Replicates were defined as independent samples from individuals with similar demographic characteristics, analyzed separately to ensure consistency in the results. All analyses were conducted with the assumption that the data would be reproducible using the same methods and datasets.
Reporting summary
Further information on research design is available in the Nature Portfolio Reporting Summary linked to this article.
Supplementary information
Description of Additional Supplementary Files
Acknowledgements
We thank all the participants and researchers who contributed to and collected data for this study. This work was supported by the National Natural Science Foundation of China to Dr. Chang-he Shi [grant number 82371433, 82171247], the Scientific Research and Innovation Team of The First Affiliated Hospital of Zhengzhou University to Dr. Chang-he Shi [grant number ZYCXTD2023011].
Author contributions
C.S., O.A.A., Y.X. and designed the study. Y.L. and D.M. conducted the main analysis. Y.L., D.M., and M.L. drafted the manuscript. Z.W., C.H., Y.S., X.H., C.Z., S.L., Y.F., S.Q., Y.W., and S.S. contributed to data collection and analysis. Y.X., O.A.A., and C.S. critically revised the manuscript. All authors reviewed and approved the final version of the manuscript.
Peer review
Peer review information
Communications Biology thanks Paul J. Dunn and the other, anonymous, reviewer for their contribution to the peer review of this work. Primary Handling Editors: Hélène Choquet & Rosie Bunton-Stasyshyn.
Data availability
The primary data used in this study, including individual-level phenotypic and genetic data, were obtained from the UK Biobank under application numbers 104811 and 221671. These data are accessible through the UK Biobank portal (https://www.ukbiobank.ac.uk/). Additionally, single-cell sequencing data for the adult cerebellum were sourced from the Human Brain Cell Atlas v1.0, which includes data from three postmortem donors (10.1126/science.add7046, https://data.humancellatlas.org/hca-bio-networks/nervous-system/atlases/brain-v1-0.) Source data for all figures can be found in Supplementary Data 1, 2, 4, 5, 6, 7, and 8.
Code availability
The code used for single-variant and gene-based analyses was from the R package SAIGE-GENE+ v1.1.6.2 (https://github.com/saigegit/SAIGE/). Quality control (QC) of individual-level data was conducted using Hail (https://hail.is) and PLINK v2.0 (https://www.cog-genomics.org/plink/2.0/). Variant annotation was performed using SnpEff v5.1 (https://pcingola.github.io/SnpEff/). Load heritability estimation was performed using BHR v0.1.0 (https://github.com/ajaynadig/bhr/). Analysis and visualization of scRNA-seq data were conducted using Seurat v4.3.0 (https://github.com/satijalab/seurat/). GO enrichment analysis was performed using ClusterProfiler v4.2.2 (https://maayanlab.cloud/Enrichr/). Tissue expression enrichment analysis was conducted using FUMA v1.5.6 (https://fuma.ctglab.nl/).
Competing interests
The authors declare no competing interests.
Footnotes
Publisher’s note Springer Nature remains neutral with regard to jurisdictional claims in published maps and institutional affiliations.
These authors contributed equally: Yuanyuan Liang, Dongrui Ma.
Contributor Information
Yu-Ming Xu, Email: xuyuming@zzu.edu.cn.
Ole A. Andreassen, Email: ole.andreassen@medisin.uio.no
Changhe Shi, Email: shichanghe@gmail.com.
Supplementary information
The online version contains supplementary material available at 10.1038/s42003-025-07797-3.
References
- 1.Koziol, L. F. et al. Consensus paper: the cerebellum’s role in movement and cognition. Cerebellum13, 151–177 (2014). [DOI] [PMC free article] [PubMed] [Google Scholar]
- 2.Koziol, L. F., Budding, D. E. & Chidekel, D. From movement to thought: executive function, embodied cognition, and the cerebellum. Cerebellum11, 505–525 (2012). [DOI] [PubMed] [Google Scholar]
- 3.Baumann, O. & Mattingley, J. B. Cerebellum and Emotion Processing. Adv. Exp. Med. Biol.1378, 25–39 (2022). [DOI] [PubMed] [Google Scholar]
- 4.Schmahmann, J. D., Guell, X., Stoodley, C. J. & Halko, M. A. The Theory and Neuroscience of Cerebellar Cognition. Annu Rev. Neurosci.42, 337–364 (2019). [DOI] [PubMed] [Google Scholar]
- 5.Van Hout, C. V. et al. Exome sequencing and characterization of 49,960 individuals in the UK Biobank. Nature586, 749–756 (2020). [DOI] [PMC free article] [PubMed] [Google Scholar]
- 6.Weiner, D. J. et al. Polygenic architecture of rare coding variation across 394,783 exomes. Nature614, 492–499 (2023). [DOI] [PMC free article] [PubMed] [Google Scholar]
- 7.Zhang, X. et al. Mutations in QARS, encoding glutaminyl-tRNA synthetase, cause progressive microcephaly, cerebral-cerebellar atrophy, and intractable seizures. Am. J. Hum. Genet.94, 547–558 (2014). [DOI] [PMC free article] [PubMed] [Google Scholar]
- 8.Kodera, H. et al. Mutations in the glutaminyl-tRNA synthetase gene cause early-onset epileptic encephalopathy. J. Hum. Genet.60, 97–101 (2015). [DOI] [PubMed] [Google Scholar]
- 9.Wei, C. et al. Adult-onset vanishing white matter disease with the EIF2B2 gene mutation presenting as menometrorrhagia. BMC Neurol.19, 203 (2019). [DOI] [PMC free article] [PubMed] [Google Scholar]
- 10.Tian, Y. et al. Identification of a Novel Heterozygous Mutation in the EIF2B4 Gene Associated With Vanishing White Matter Disease. Front. Bioeng. Biotechnol.10, 901452 (2022). [DOI] [PMC free article] [PubMed] [Google Scholar]
- 11.Chang, C.-P., Wu, K.-C., Lin, C.-Y. & Chern, Y. Emerging roles of dysregulated adenosine homeostasis in brain disorders with a specific focus on neurodegenerative diseases. J. Biomed. Sci.28, 70 (2021). [DOI] [PMC free article] [PubMed] [Google Scholar]
- 12.Watts, M. E., Pocock, R. & Claudianos, C. Brain energy and oxygen metabolism: emerging role in normal function and disease. Front. Mol. Neurosci.11, 216 (2018). [DOI] [PMC free article] [PubMed] [Google Scholar]
- 13.Varma Shrivastav, S., Bhardwaj, A., Pathak, K. A. & Shrivastav, A. Insulin-Like Growth Factor Binding Protein-3 (IGFBP-3): Unraveling the Role in Mediating IGF-Independent Effects Within the Cell. Front. Cell Dev. Biol.8, 286 (2020). [DOI] [PMC free article] [PubMed] [Google Scholar]
- 14.d’Errico, P. & Meyer-Luehmann, M. Mechanisms of Pathogenic Tau and Aβ Protein Spreading in Alzheimer’s Disease. Front. Aging Neurosci.12, 10.3389/fnagi.2020.00265 (2020). [DOI] [PMC free article] [PubMed]
- 15.Jacobs, H. I. L. et al. The cerebellum in Alzheimer’s disease: evaluating its role in cognitive decline. Brain141, 37–47 (2017). [DOI] [PubMed] [Google Scholar]
- 16.Welcome, M. O. Cellular mechanisms and molecular signaling pathways in stress-induced anxiety, depression, and blood–brain barrier inflammation and leakage. Inflammopharmacology28, 643–665 (2020). [DOI] [PubMed] [Google Scholar]
- 17.Jiang, S., Postovit, L., Cattaneo, A., Binder, E. B. & Aitchison, K. J. Epigenetic Modifications in Stress Response Genes Associated With Childhood Trauma. Front. Psychiatry10, 10.3389/fpsyt.2019.00808 (2019). [DOI] [PMC free article] [PubMed]
- 18.Fletcher, M., Tillman, E. J., Butty, V. L., Levine, S. S. & Kim, D. H. Global transcriptional regulation of innate immunity by ATF-7 in C. elegans. PLoS Genet15, e1007830 (2019). [DOI] [PMC free article] [PubMed] [Google Scholar]
- 19.Razani, E. et al. The PI3K/Akt signaling axis in Alzheimer’s disease: a valuable target to stimulate or suppress? Cell Stress Chaperones26, 871–887 (2021). [DOI] [PMC free article] [PubMed] [Google Scholar]
- 20.Kumar, M. & Bansal, N. Implications of Phosphoinositide 3-Kinase-Akt (PI3K-Akt) Pathway in the Pathogenesis of Alzheimer’s Disease. Mol. Neurobiol.59, 354–385 (2022). [DOI] [PubMed] [Google Scholar]
- 21.Limantoro, J., de Liyis, B. G. & Sutedja, J. C. Akt signaling pathway: a potential therapy for Alzheimer’s disease through glycogen synthase kinase 3 beta inhibition. Egypt. J. Neurol. Psychiatry Neurosurg.59, 147 (2023). [Google Scholar]
- 22.Shinawi, M., Coorg, R., Shimony, J. S., Grange, D. K. & Al-Kateb, H. Intragenic CAMTA1 deletions are associated with a spectrum of neurobehavioral phenotypes. Clin. Genet87, 478–482 (2015). [DOI] [PubMed] [Google Scholar]
- 23.Chen, M. et al. The Role of PGC-1α-Mediated Mitochondrial Biogenesis in Neurons. Neurochem. Res.48, 2595–2606 (2023). [DOI] [PubMed] [Google Scholar]
- 24.Taherzadeh-Fard, E. et al. PGC-1alpha downstream transcription factors NRF-1 and TFAM are genetic modifiers of Huntington disease. Mol. Neurodegeneration6, 32 (2011). [DOI] [PMC free article] [PubMed] [Google Scholar]
- 25.Leon, E., Nde, C., Ray, R. S., Preciado, D. & Zohn, I. E. ALDH1A2-related disorder: A new genetic syndrome due to alteration of the retinoic acid pathway. Am. J. Med Genet A191, 90–99 (2023). [DOI] [PMC free article] [PubMed] [Google Scholar]
- 26.Kataoka, M. et al. Dysregulation of Aldh1a2 underlies motor neuron degeneration in spinal muscular atrophy. Neurosci. Res.194, 58–65 (2023). [DOI] [PubMed] [Google Scholar]
- 27.Wan, C. et al. Positive association between ALDH1A2 and schizophrenia in the Chinese population. Prog. Neuropsychopharmacol. Biol. Psychiatry33, 1491–1495 (2009). [DOI] [PubMed] [Google Scholar]
- 28.Ramírez-Peinado, S. et al. TRAPPC13 modulates autophagy and the response to Golgi stress. J. Cell Sci.130, 2251–2265 (2017). [DOI] [PMC free article] [PubMed] [Google Scholar]
- 29.Krajcovicova, L., Klobusiakova, P. & Rektorova, I. Gray Matter Changes in Parkinson’s and Alzheimer’s Disease and Relation to Cognition. Curr. Neurol. Neurosci. Rep.19, 85 (2019). [DOI] [PMC free article] [PubMed] [Google Scholar]
- 30.Wu, B. S. et al. Genome-wide association study of cerebellar white matter microstructure and genetic overlap with common brain disorders. Neuroimage269, 119928 (2023). [DOI] [PubMed] [Google Scholar]
- 31.Paulson, H. Machado-Joseph disease/spinocerebellar ataxia type 3. Handb. Clin. Neurol.103, 437–449 (2012). [DOI] [PMC free article] [PubMed] [Google Scholar]
- 32.Dulski, J. et al. Spinocerebellar ataxia type 3 (Machado-Joseph disease). Pol. Arch. Intern. Med.132, 10.20452/pamw.16322 (2022). [DOI] [PubMed]
- 33.Colomer Gould, V. F. Mouse models of spinocerebellar ataxia type 3 (Machado-Joseph disease). Neurotherapeutics9, 285–296 (2012). [DOI] [PMC free article] [PubMed] [Google Scholar]
- 34.Orsini, A. et al. Generalized epilepsy and mild intellectual disability associated with 13q34 deletion: A potential role for SOX1 and ARHGEF7. Seizure59, 38–40 (2018). [DOI] [PubMed] [Google Scholar]
- 35.Zhang, H. et al. PREX1 improves homeostatic proliferation to maintain a naive CD4+ T cell compartment in older age. JCI Insight9, 10.1172/jci.insight.172848 (2024). [DOI] [PMC free article] [PubMed]
- 36.Kandel, E. R. The molecular biology of memory: cAMP, PKA, CRE, CREB-1, CREB-2, and CPEB. Mol. Brain5, 14 (2012). [DOI] [PMC free article] [PubMed] [Google Scholar]
- 37.Pramio, D. T. et al. DNA methylation of the promoter region at the CREB1 binding site is a mechanism for the epigenetic regulation of brain-specific PKMζ. Biochim. Biophys. Acta Gene Regul. Mech.1866, 194909 (2023). [DOI] [PMC free article] [PubMed] [Google Scholar]
- 38.Zhang, M. & Wang, H. Ca(2+)-stimulated ADCY1 and ADCY8 regulate distinct aspects of synaptic and cognitive flexibility. Front. Cell Neurosci.17, 1215255 (2023). [DOI] [PMC free article] [PubMed] [Google Scholar]
- 39.Di Zazzo, E. et al. Exploring the putative role of PRDM1 and PRDM2 transcripts as mediators of T lymphocyte activation. J. Transl. Med.21, 217 (2023). [DOI] [PMC free article] [PubMed] [Google Scholar]
- 40.Gueneau, L. et al. KIAA1109 Variants Are Associated with a Severe Disorder of Brain Development and Arthrogryposis. Am. J. Hum. Genet102, 116–132 (2018). [DOI] [PMC free article] [PubMed] [Google Scholar]
- 41.Lederbogen, R. C. et al. Optical Genome Mapping Reveals Disruption of the RASGRF2 Gene in a Patient with Developmental Delay Carrying a De Novo Balanced Reciprocal Translocation. Genes15, 10.3390/genes15060809 (2024). [DOI] [PMC free article] [PubMed]
- 42.Hetz, C. & Mollereau, B. Disturbance of endoplasmic reticulum proteostasis in neurodegenerative diseases. Nat. Rev. Neurosci.15, 233–249 (2014). [DOI] [PubMed] [Google Scholar]
- 43.Xu, J. et al. Human striatal glia differentially contribute to AD- and PD-specific neurodegeneration. Nat. Aging3, 346–365 (2023). [DOI] [PMC free article] [PubMed] [Google Scholar]
- 44.Hohenauer, T. & Moore, A. W. The Prdm family: expanding roles in stem cells and development. Development139, 2267–2282 (2012). [DOI] [PubMed] [Google Scholar]
- 45.Bogani, D. et al. The PR/SET domain zinc finger protein Prdm4 regulates gene expression in embryonic stem cells but plays a nonessential role in the developing mouse embryo. Mol. Cell Biol.33, 3936–3950 (2013). [DOI] [PMC free article] [PubMed] [Google Scholar]
- 46.Lin, Y.-C., Sahoo, B. K., Gau, S.-S. & Yang, R.-B. The biology of SCUBE. J. Biomed. Sci.30, 33 (2023). [DOI] [PMC free article] [PubMed] [Google Scholar]
- 47.Zhang, Y. & Beachy, P. A. Cellular and molecular mechanisms of Hedgehog signalling. Nat. Rev. Mol. Cell Biol.24, 668–687 (2023). [DOI] [PMC free article] [PubMed] [Google Scholar]
- 48.Ho, A. M. et al. Mood-Stabilizing Antiepileptic Treatment Response in Bipolar Disorder: A Genome-Wide Association Study. Clin. Pharm. Ther.108, 1233–1242 (2020). [DOI] [PMC free article] [PubMed] [Google Scholar]
- 49.Lacombe, D. et al. Diagnosis and management in Rubinstein-Taybi syndrome: first international consensus statement. J. Med Genet61, 503–519 (2024). [DOI] [PMC free article] [PubMed] [Google Scholar]
- 50.Sima, A. et al. Menke-Hennekam Syndrome: A Literature Review and a New Case Report. Children9, 10.3390/children9050759 (2022). [DOI] [PMC free article] [PubMed]
- 51.López, M. et al. Rubinstein-Taybi 2 associated to novel EP300 mutations: deepening the clinical and genetic spectrum. BMC Med. Genet.19, 36 (2018). [DOI] [PMC free article] [PubMed] [Google Scholar]
- 52.Van Gils, J., Magdinier, F., Fergelot, P. & Lacombe, D. Rubinstein-Taybi Syndrome: A Model of Epigenetic Disorder. Genes12, 10.3390/genes12070968 (2021). [DOI] [PMC free article] [PubMed]
- 53.Feuer, K. L., Peng, X., Yovo, C. K. & Avramopoulos, D. DPYSL2/CRMP2 isoform B knockout in human iPSC-derived glutamatergic neurons confirms its role in mTOR signaling and neurodevelopmental disorders. Mol. Psychiatry28, 4353–4362 (2023). [DOI] [PMC free article] [PubMed] [Google Scholar]
- 54.Pachis, S. T. & Kops, G. Leader of the SAC: molecular mechanisms of Mps1/TTK regulation in mitosis. Open Biol.8, 10.1098/rsob.180109 (2018). [DOI] [PMC free article] [PubMed]
- 55.Thomsen, M., Lange, L. M., Zech, M. & Lohmann, K. Genetics and Pathogenesis of Dystonia. Annu Rev. Pathol.19, 99–131 (2024). [DOI] [PubMed] [Google Scholar]
- 56.Burnett, S. B. et al. A frameshift mutation in the murine Prkra gene causes dystonia and exhibits abnormal cerebellar development and reduced eIF2α phosphorylation. bioRxiv, 10.1101/2024.06.04.597421 (2024).
- 57.Harraz, M. M., Eacker, S. M., Wang, X., Dawson, T. M. & Dawson, V. L. MicroRNA-223 is neuroprotective by targeting glutamate receptors. Proc. Natl. Acad. Sci. USA109, 18962–18967 (2012). [DOI] [PMC free article] [PubMed] [Google Scholar]
- 58.Nelson, P. T. & Wang, W. X. MiR-107 is reduced in Alzheimer’s disease brain neocortex: validation study. J. Alzheimers Dis.21, 75–79 (2010). [DOI] [PMC free article] [PubMed] [Google Scholar]
- 59.Ambasudhan, R. et al. Direct reprogramming of adult human fibroblasts to functional neurons under defined conditions. Cell Stem Cell9, 113–118 (2011). [DOI] [PMC free article] [PubMed] [Google Scholar]
- 60.Hu, J.-R., Abdullah, A., Nanna, M. G. & Soufer, R. The Brain–Heart Axis: Neuroinflammatory Interactions in Cardiovascular Disease. Curr. Cardiol. Rep.25, 1745–1758 (2023). [DOI] [PMC free article] [PubMed] [Google Scholar]
- 61.Villringer, A. & Laufs, U. Heart failure, cognition, and brain damage. Eur. Heart J.42, 1579–1581 (2021). [DOI] [PubMed] [Google Scholar]
- 62.Zesiewicz, T. A. et al. Emerging therapies in Friedreich’s Ataxia. Expert Rev. Neurother.20, 1215–1228 (2020). [DOI] [PMC free article] [PubMed] [Google Scholar]
- 63.Krasilnikova, M. M., Humphries, C. L. & Shinsky, E. M. Friedreich’s ataxia: new insights. Emerg. Top. Life Sci.7, 313–323 (2023). [DOI] [PubMed] [Google Scholar]
- 64.Backman, J. D. et al. Exome sequencing and analysis of 454,787 UK Biobank participants. Nature599, 628–634 (2021). [DOI] [PMC free article] [PubMed] [Google Scholar]
- 65.Jurgens, S. J. et al. Analysis of rare genetic variation underlying cardiometabolic diseases and traits among 200,000 individuals in the UK Biobank. Nat. Genet54, 240–250 (2022). [DOI] [PMC free article] [PubMed] [Google Scholar]
- 66.Siletti, K. et al. Transcriptomic diversity of cell types across the adult human brain. Science382, eadd7046 (2023). [DOI] [PubMed] [Google Scholar]
Associated Data
This section collects any data citations, data availability statements, or supplementary materials included in this article.
Supplementary Materials
Description of Additional Supplementary Files
Data Availability Statement
The primary data used in this study, including individual-level phenotypic and genetic data, were obtained from the UK Biobank under application numbers 104811 and 221671. These data are accessible through the UK Biobank portal (https://www.ukbiobank.ac.uk/). Additionally, single-cell sequencing data for the adult cerebellum were sourced from the Human Brain Cell Atlas v1.0, which includes data from three postmortem donors (10.1126/science.add7046, https://data.humancellatlas.org/hca-bio-networks/nervous-system/atlases/brain-v1-0.) Source data for all figures can be found in Supplementary Data 1, 2, 4, 5, 6, 7, and 8.
The code used for single-variant and gene-based analyses was from the R package SAIGE-GENE+ v1.1.6.2 (https://github.com/saigegit/SAIGE/). Quality control (QC) of individual-level data was conducted using Hail (https://hail.is) and PLINK v2.0 (https://www.cog-genomics.org/plink/2.0/). Variant annotation was performed using SnpEff v5.1 (https://pcingola.github.io/SnpEff/). Load heritability estimation was performed using BHR v0.1.0 (https://github.com/ajaynadig/bhr/). Analysis and visualization of scRNA-seq data were conducted using Seurat v4.3.0 (https://github.com/satijalab/seurat/). GO enrichment analysis was performed using ClusterProfiler v4.2.2 (https://maayanlab.cloud/Enrichr/). Tissue expression enrichment analysis was conducted using FUMA v1.5.6 (https://fuma.ctglab.nl/).