

Abstract
Rationale and Objectives:
Detection and diagnosis of architectural distortion (AD) on digital breast tomosynthesis (DBT) is challenging. This study applied artificial intelligence (AI) using deep learning (DL) algorithms to detect AD, followed by radiomics for classification.
Materials and Methods:
500 cases with AD on DBT reports were identified; the earlier 292 cases for training, and the later 208 cases for testing. The DL Gradient-weighted Class Activation Mapping (Grad-CAM) was applied to automatically localize abnormalities and generate a region of interest (ROI), which was put into the radiomics model to estimate the malignancy probability for constructing ROC curves. Radiologists delineated ROI manually for comparison. Cases were categorized into pure AD and AD associated with other features, including mass, regional high-density, and calcifications. The ROC curves were compared using the DeLong test.
Results:
The overall malignancy rate was 57% (285/500). Of them, 267 cases were classified as pure AD, and the malignancy rate (106/267 = 39.7%) was significantly lower compared to AD cases associated with other features (179/233 = 76.8%, p < 0.01). In the testing set, the diagnostic AUC was 0.82 when using the manual ROI and 0.84 when using the DL-generated ROI. In the more challenging pure AD cases, DL-generated ROI yielded an AUC of 0.77, significantly lower than 0.86 for AD associated with other features.
Conclusion:
DL could detect AD on DBT, and the diagnostic performance was comparable to manual ROI. The strategy worked for pure AD, but the performance was worse than that for AD with other features.
Keywords: Architectural distortion, Breast cancer, Deep learning, Digital breast tomosynthesis, Radiomics
INTRODUCTION
Despite remarkable progress that has been achieved in the early detection and treatment of breast cancer, it was the most common cancer in women in 157 countries and caused 670,000 deaths globally in 2022 (1). The death rate peaked in 1989 and has since declined by 43% as of 2020, mainly because of increased breast cancer awareness and earlier detection through widely implemented screening programs, e.g., by using mammography (2). Early diagnosis increases treatment options and improves the rate of cure.
In screening mammography, masses and microcalcifications are two major abnormalities associated with malignancy. Architectural distortion (AD) is the third most suspicious appearance, representing 6% of abnormalities detected on mammography (3). However, the detection and interpretation of AD on 2-dimensional (2D) mammograms is challenging due to the overlapping tissues. Digital breast tomosynthesis (DBT) has been shown to improve the detection and characterization of mammographic AD; however, it is still challenging and highly subjective for radiologists (4).
Artificial intelligence (AI)-based imaging analysis has been extensively applied for the detection and diagnosis of breast lesions on mammography and DBT, and several commercial computer-aided diagnosis (CAD) systems have been approved by the FDA (5). However, since AD is not the major finding, the accuracy of detection and interpretation by these commercial systems is unknown. Furthermore, AD is often presented as an associated finding accompanying the primary mass, regional density, or calcifications, and the accuracy for the detection of AD by AI models or the characterization to predict malignant vs. benign diagnosis is rarely reported (6).
We have previously developed a radiomics model to classify AD identified on DBT as benign or malignant, using manually outlined region of interest (ROI) (7). The radiomics features were extracted using PyRadiomics, and then a machine learning method using the Support Vector Machine (SVM) was applied to select features and build the diagnostic model. To use this model, the ROI needs to be determined by radiologists. Furthermore, we have trained a deep-learning (DL) model by using the entire DBT image as input. Although the diagnostic accuracy of deep learning was much lower compared to that achieved by the radiomics model using tumor ROI, it was shown that the Gradient-weighted Class Activation Mapping (Grad-CAM) method could localize the areas of interest, including architectural distortions and, thus, potentially offered a means for automatic ROI delineation. Therefore, the results suggest that integrating suspicious areas detected by deep learning and the classification by the radiomics model could provide an automated diagnostic tool for AD on DBT.
In the present study, we assembled an independent late temporal dataset to test the diagnostic performance of this combined strategy. The accuracy achieved by using manual ROI and DL-detected ROI was compared. Furthermore, to gain more knowledge about the diagnostic performance in different types of AD presentations, we separated cases into pure AD without any accompanying feature and AD associated with other features, including mass, regional high-density, and calcifications, and compared the diagnostic performance in these different groups.
MATERIALS AND METHODS
Datasets
This retrospective study was approved by the institutional ethics committee. Due to the nature of the retrospective review, the requirement of written informed consent was waived. The dataset was identified by reviewing all patients receiving DBT in our hospital. The cases included in the previous study were from October 2016 to December 2019 and were used for training (7). The new cases from Jan 2020 to September 2022 were used for independent testing in the present study. The inclusion criteria were: [1] patients presenting with clearly discernible architectural distortion on DBT, based on the original reports; [2] patients receiving biopsy or surgery to obtain tissues for pathological examination. The exclusion criteria were: [1] patients receiving any prior procedure or treatment in the breast; [2] no confirmed pathological diagnosis; [3] poor image quality, such as serious artifacts, noise, and poor positioning. Finally, a total of 500 patients were included in this study, 292 for training and 208 for testing. The age range was from 18 to 74 years old, with an average of 47.2 years old. The BI-RADS scores of DBT were obtained from the radiology reports, classified into 2, 3, 4A, 4B, 4 C, and 5.
DBT Protocol
The images were acquired by using the standard small-angle mode of Amulet Innovality Digital Breast Tomosynthesis System (Fuji Film, Japan). DBT images were taken first, and then the Full-field Digital Mammography (FFDM) images were acquired. The X-ray tube angular range for DBT acquisition was ± 7.5°, with one exposure per degree, for a total of 15 exposures, by using the W-Al anode filter. For FFDM, the W-Rh anode filter was used. The images were acquired with the standard 2-view, craniocaudal (CC) and mediolateral oblique (MLO), projections under breast compression. The full set of DICOM DBT images was downloaded for offline analysis using computer algorithms.
Radiomics Model and Deep-Learning Localization Method
The overall AI-based processing flowchart using radiomics and deep learning algorithms is illustrated in Figure 1. Two radiologists with 5 and 10 years of experience delineated the region exhibiting architectural distortion on both craniocaudal (CC) and mediolateral oblique (MLO) views. The outlined ROIs were cross-checked, and, if needed, the radiologists discussed to reach a consensus. Detailed training processes to build the radiomics model for differential diagnosis and the deep learning model for localizing the abnormal regions were reported previously (7). Each ROI was resampled to a resolution of 0.4 × 0.4 mm2 and quantized into 25 gray levels. Feature extraction was conducted using PyRadiomics v3.0.1, which extracted 107 features from each ROI. These features included 14 shape descriptors, 18 first-order statistics, 24 gray-level co-occurrence matrix (GLCM) features, 14 gray-level dependence matrix (GLDM) features, 16 gray-level run length matrix (GLRLM) features, 16 gray-level size zone matrix (GLSZM) features, and 5 neighboring gray tone difference matrix (NGTDM) features. In total, 214 parameters were derived for each case from both the CC and MLO images. Although the shape features were irrelevant (since the ROI did not trace the abnormal region not as typically done for a mass), they were included in the PyRadiomics and were used as inputs.
Figure 1.

The overall processing flowchart using the radiomics algorithm to train the classification model for the differentiation of benign and malignant lesions, and using deep learning Grad-CAM heat maps for the detection of abnormal areas.
Feature selection was performed using a sequential approach by constructing multiple Support Vector Machine (SVM) classifiers with a Gaussian kernel. The process started with an empty candidate set, and features were added iteratively. Each iteration included 5000 training repetitions to evaluate the robustness of individual features, and the feature demonstrating the best performance was added to the candidate set. The algorithm also examined all possible subsets of “shadow” attributes and identified the final key features by comparing their relative importance. To address the class imbalance, different weights were applied to the benign and malignant groups during feature selection. Finally, a total of 8 radiomics features were selected to build the model, and as expected, none of the shape features was included. In the order of importance, they were: [1] GLCM Cluster Prominence from MLO, [2] NGTDM Coarseness from CC, [3] GLCM Difference Entropy from CC, [4] Skewness from MLO, [5] GLCM Maximum Probability from CC, [6] GLRLM Long Run Emphasis from CC, [7] Interquartile Range from CC, [8] GLDM Dependence Entropy from CC. Although there were only two features from MLO, their importance levels were high, ranking #1 and #4 among the 8 features. After the final features were determined, an SVM was used to construct the diagnostic model, which was then evaluated using 10-fold cross-validation. The radiomics score, indicating the probability of malignancy, was calculated.
Deep learning was carried out using the ResNet50 algorithm, with a binary output for classifying malignant versus benign cases. The input to the network consisted of the selected slice along with its two adjacent neighboring slices from both the CC and MLO views, resulting in six input channels. Images were resampled to a 256 × 256 matrix using linear interpolation, and pixel intensities were normalized to have a mean of 0 and a standard deviation of 1. Model performance was assessed via 5-fold cross-validation. The DL model was not meant for classification. Instead, it was used to localize the attention areas by Gradient-weighted Class Activation Mapping (Grad-CAM), which leverages gradient information from the final convolutional layer of Convolutional Neural Networks (CNNs) to assign importance values to individual neurons for specific decisions. Grad-CAM-generated heat maps were normalized to a scale of 0 to 1, with a threshold of 0.6 to 1 used to generate the Region of Interest (ROI), followed by morphological filling operations.
Each case in the testing set was processed to determine the ROI using manual drawing and DL-Grad-CAM attention maps. The ROIs on CC and MLO views were then put into the radiomics process pipeline to extract features and estimate the malignancy probability using the trained SVM model.
Classification According to Different AD Presentations
For each case, the two radiologists who outlined the ROI also classified each case according to the presentation AD, as pure AD without any accompanying feature or AD associated with other features, including mass or regional high-density, calcifications, or both mass/density and calcifications. If there was doubt or disagreement, a senior radiologist with 25 years of experience gave the final determination.
Statistical Analysis
The age and the proportions of BI-RADS between benign and malignant groups were compared using the U-tests and chi-square tests, by using SPSS software (version 20.0). The ROC curves generated by using the manual ROI and the DL-generated ROI were compared using the DeLong test. For each case, the radiomics score, that is, the malignancy probability, was used to make the binary diagnosis of malignant (≥ 0.5) or benign (< 0.5). The sensitivity, specificity, and overall accuracy were calculated and compared. ROC curves were generated for cases presenting pure AD or AD with accompanying features, and the difference was compared using the DeLong test.
RESULTS
Pathological Types and BI-RADS Scores
Of the total of 500 identified cases, 285 (57%) were malignant and 215 (43%) were benign. The pathological types are listed in Table 1. The age and distribution of BI-RADS scores in the training and testing datasets are listed in Table 2. The mean age was 49.4 ± 8.8 in the malignant group and 44.4 ± 8.7 in the benign group. Most malignant lesions had BI-RADS scores of 4B, 4 C, and 5 (229/285 = 80.4%). In the benign group, a substantial number of patients also had high BI-RADS ≥ 4B (81/215 = 37.7%), but significantly lower than in the malignant groups (p < 0.001). In the present study, all benign lesions had histological confirmation, and the biopsies in BI-RADS 2, 3 and 4A cases were mainly from patients’ choice. In each case, mixed pathological features might be noted in the pathological report, and the dominating type is listed in Table 1.
TABLE 1.
Pathological Types in the Malignant and Benign Groups
| Pathology | Case Number (%) |
|---|---|
| Malignant | Total N = 285 |
| Invasive Ductal Cancera | 211 (74.0%) |
| Ductal Carcinoma In Situb | 54 (18.9%) |
| Invasive Lobular Carcinoma | 11 (3.9%) |
| Tubular Carcinoma | 4 (1.4%) |
| Lobular Carcinoma In Situc | 5 (1.8%) |
| Benign | Total N = 215 |
| Adenosis, Sclerosing Adenosisd | 150 (69.8%) |
| Fibroadenoma | 38 (17.7%) |
| Papilloma | 20 (9.3%) |
| Other Benign Tumor | 7 (3.2%) |
Main pathology is IDC, may have presence of DCIS or invasive lobular cancer.
Main pathology is DCIS, may contain micro invasion of IDC.
Lobular Carcinoma In Situ (LCIS) is a high-risk tumor, classified as malignant.
Adenosis and Sclerosing Adenosis are not precisely separated, thus combined here.
TABLE 2.
Age and BI-RADS Score Distribution of Lesions Determined on DBT
| Malignant (N = 285) | Benign (N = 215) | P-Value | |
|---|---|---|---|
| Age [Range] | 49.4 ± 8.8 (25, 74) | 44.4 ± 8.7 (18, 69) | < 0.01 |
| BI-RADS Score | |||
| Training set N = 292 | N = 168 | N = 124 | < 0.001 |
| BI-RADS 2 | 1 | 9 | |
| BI-RADS 3 | 5 | 12 | |
| BI-RADS 4A | 23 | 47 | |
| BI-RADS 4B | 55 | 45 | |
| BI-RADS 4 C | 55 | 11 | |
| BI-RADS 5 | 29 | 0 | |
| Testing set N = 208 | N = 117 | N = 91 | < 0.001 |
| BI-RADS 2 | 3 | 18 | |
| BI-RADS 3 | 5 | 20 | |
| BI-RADS 4A | 19 | 28 | |
| BI-RADS 4B | 34 | 21 | |
| BI-RADS 4 C | 38 | 4 | |
| BI-RADS 5 | 18 | 0 |
Diagnostic Performance Using Manual ROI vs. DL-generated ROI
For each case, there were two ROIs, one manually delineated by radiologists and the other Ngenerated by ResNet50 deep learning from Grad-CAM. Figure 2 and Figure 3 illustrate two benign cases with pure AD. Figure 4 illustrates another pure AD case confirmed to be malignant. The radiomics features from the ROI were extracted to calculate the malignancy probability. The Area Under Curve (AUC) and the classification results in the training and testing datasets are summarized in Table 3. The ROC curves of the manual ROI and the DL-generated ROI were compared using the DeLong test, and there was no significant difference. In the testing set, the AUC was 0.82 when using the manual ROI and 0.84 when using the DL-generated ROI.
Figure 2.

A benign case of pure architectural distortion, a true negative diagnosis from a 46-year-old patient confirmed with adenosis. The DBT BI-RADS score is 2. The radiomics score from the manual ROI is 0.22, and the radiomics score from DL-generated ROI is 0.31. (a) CC view DBT image with manual ROI, (b) CC view DBT image overlaid with heat map from Grad-CAM and the DL-generated ROI, (c) MLO view DBT image with manual ROI, (d) MLO view DBT image overlaid with heat map from Grad-CAM and the DL-generated ROI.
Figure 3.

A benign case of pure architectural distortion, a true negative diagnosis from a 36-year-old patient confirmed with intraductal papilloma. The DBT BI-RADS score is 3. The radiomics score from the manual ROI is 0.47, and the radiomics score from DL-generated ROI is 0.39. (a) CC view DBT image with manual ROI, (b) CC view DBT image overlaid with heat map from Grad-CAM and the DL-generated ROI, (c) MLO view DBT image with manual ROI, (d) MLO view DBT image overlaid with heat map from Grad-CAM and the DL-generated ROI.
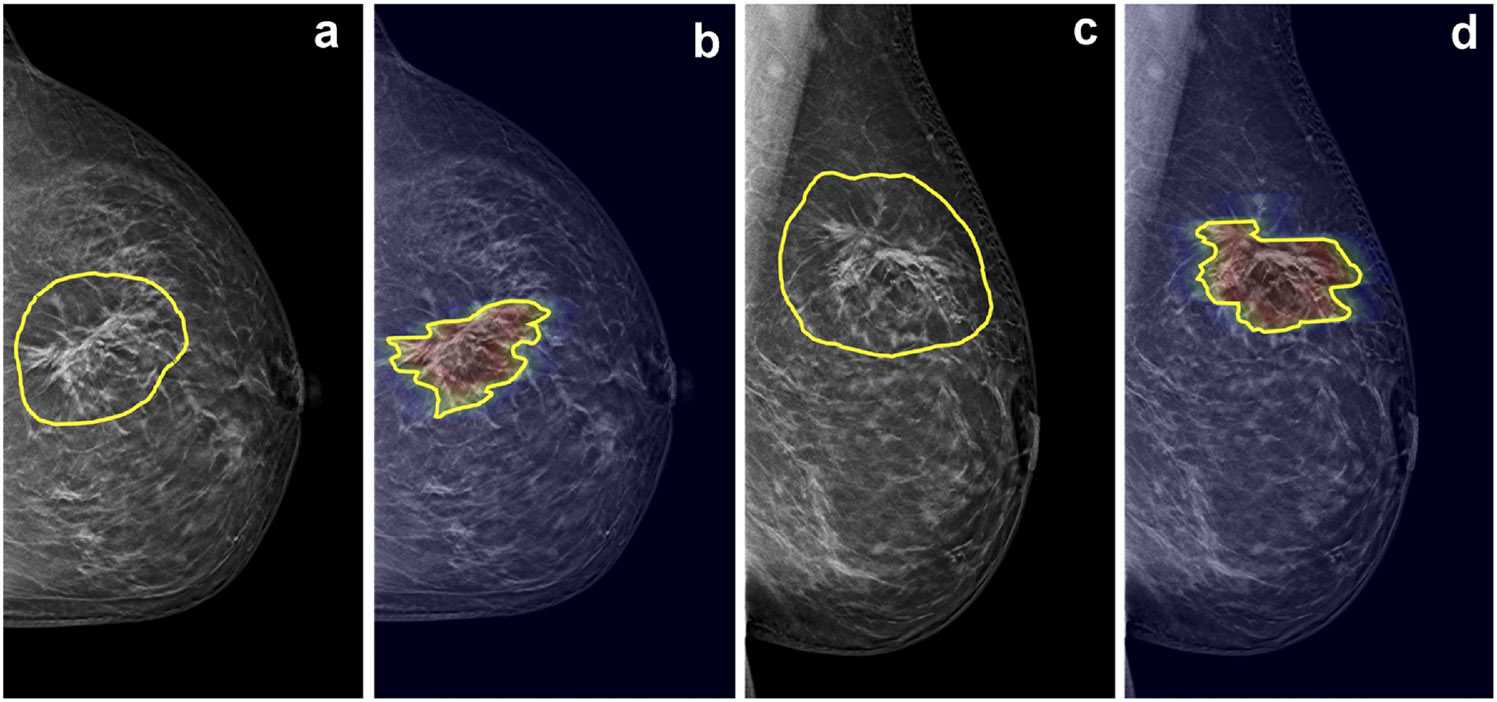
Figure 4.

A malignant case of pure architectural distortion from a 47-year-old patient confirmed with invasive ductal cancer. The DBT BI-RADS score is 4B. The radiomics score from manual ROI is 0.47, false negative. The radiomics score from DL-generated ROI is 0.64, true positive. (a) CC view DBT image with manual ROI, (b) CC view DBT image overlaid with heat map from Grad-CAM and the DL-generated ROI, (c) MLO view DBT image with manual ROI, (d) MLO view DBT image overlaid with heat map from Grad-CAM and the DL-generated ROI.
TABLE 3.
The Diagnostic Performance of the Radiomics Model in the Training and Testing Datasets using the Manually Outlined ROI and the ROI Generated by Grad-CAM from ResNet50 Deep Learning (DL)
| Model | Sensitivity | Specificity | Accuracy | AUC |
|---|---|---|---|---|
| Training (manual ROI) | 0.82 (137/168) | 0.78 (97/124) | 0.80 (234/292) | 0.84 |
| Training (DL ROI) | 0.82 (137/168) | 0.84 (104/124) | 0.83 (241/292) | 0.85 |
| Testing (manual ROI) | 0.79 (93/117) | 0.81 (74/91) | 0.80 (167/208) | 0.82 |
| Testing (DL ROI) | 0.83 (97/117) | 0.87 (79/91) | 0.85 (176/208) | 0.84 |
Diagnostic Performance in Four AD Presentation Groups
The presentation of AD was determined based on whether there were accompanying features, including mass or regional high-density, suspicious calcifications, or both. The 500 cases were separated into pure AD (n = 267) and AD with other features (n = 233). The malignancy rate in the pure AD group was 106/267 = 39.7%, which was significantly lower than in the AD group with other features (179/233 = 76.8%, p < 0.01). The cases with other features were further separated into AD with mass or density (n = 80), AD with calcifications (n = 109), and AD with both density and calcifications (n = 44). The diagnostic results are summarized in Table 4. Figure 5 illustrates one malignant case presenting AD accompanied by mass/regional density, and Figure 6 shows another malignant case presenting AD with microcalcifications. The ROC curves in the pure AD and AD with other features are shown in Figure 7. The AUC was in the range of 0.85–0.88 in AD cases with other features, which was significantly higher than the AUC of 0.73–0.77 in the pure AD group. The results in the training and testing datasets were consistent and comparable using manual ROI and DL-ROI. In the pure AD group, DL-generated ROI yielded an AUC of 0.77, significantly lower than 0.86 for AD associated with other features.
TABLE 4.
The AUC of the Radiomics Model in the Pure AD Group and AD with Accompanied Features using the Manually Outlined ROI and the ROI Generated by Grad-CAM from ResNet50 Deep Learning (DL)
| Model | Pure AD, No Other Feature (N = 267) |
AD with Other Features (N = 233) |
AD with Mass/ Density (N = 80) |
AD with Calcifications (N = 109) |
AD with Mass/Density + Calcifications (N = 44) |
|---|---|---|---|---|---|
| Training (manual ROI) | 0.76 | 0.86 * | 0.85 * | 0.92 * | 0.86 |
| Training (DL ROI) | 0.77 | 0.88 * | 0.87 * | 0.90 | 0.88 |
| Testing (manual ROI) | 0.73 | 0.85 * | 0.81 | 0.91 * | 0.82 |
| Testing (DL ROI) | 0.77 | 0.86 * | 0.86 | 0.86 | 0.88 |
Significantly higher compared to AUC in the pure AD group using the DeLong test, p < 0.05.
Figure 5.

A malignant case example of mass/density, with associated architectural distortion at the boundary of the mass, from a 64-year-old patient diagnosed with invasive ductal cancer. The DBT BI-RADS score is 4B. The radiomics score from manual ROI is 0.73, true positive; and the radiomics score from DL-generated ROI is 0.89, true positive. (a) CC view DBT image with manual ROI, (b) CC view DBT image overlaid with heat map from Grad-CAM and the DL-generated ROI, (c) MLO view DBT image with manual ROI, (d) MLO view DBT image overlaid with heat map from Grad-CAM and the DL-generated ROI.
Figure 6.
A malignant case example of architectural distortion with suspicious microcalcifications from a 58-year-old patient diagnosed with invasive ductal cancer. The DBT BI-RADS score is 5. The radiomics score from manual ROI is 0.96, and the radiomics score from DL-generated ROI is 0.99, both very high and yield true positive diagnoses. (a) CC view DBT image with manual ROI, (b) CC view DBT image overlaid with heat map from Grad-CAM and the DL-generated ROI, (c) MLO view DBT image with manual ROI, (d) MLO view DBT image overlaid with heat map from Grad-CAM and the DL-generated ROI.
Figure 7.

ROC curves. (a) 4 curves in the Training set for the group of pure AD and AD with other features, constructed by using manual ROI and DL-generated ROI. (b) 4 curves in the Testing set for the group of pure AD and AD with other features, constructed by manual ROI and DL-ROI. The AUC for the cases with other features is significantly higher, and the AUC generated by manual ROI and DL-ROI is comparable.
DISCUSSION
Detection and diagnosis of AD on mammography or DBT is challenging. In the Breast Imaging Reporting and Data System (BI-RADS) lexicon (8), architectural distortion is defined as “the normal architecture of the breast is distorted with no definite mass visible”. AD is much less common compared to masses and calcifications, only comprising 6% of detected abnormalities, and it is also more challenging to diagnose because it can be subtle and variable in presentations. Although AD is not highly prevalent, it has been reported as a common finding in retrospective assessments of false-negative mammography, and it may represent the earliest manifestation of breast cancer (3). Several automated approaches have been developed to increase the detection rate of AD; however, it was shown that fewer than half of cases were detected by the two most widely available CAD systems used for interpretations of screening mammograms (5). More research is needed to detect and characterize AD and improve diagnostic accuracy (6,9).
Architectural distortion is a particularly challenging pattern for radiologists, and it is also highly subjective. The distortion may be challenging to discern from the normal overlapping of the various soft tissue, parenchyma, vessels, and ligamentous structures (10). Due to its subtle nature, AD has been shown to have poor interobserver agreement among radiologists compared with masses and calcifications (11). DBT could help resolve the overlapping of normal tissues, but it did not improve AD's characterization or diagnostic accuracy compared to mammography (12). Due to the low prevalence and the subtle presentation of AD, assembling a large dataset for developing artificial intelligence (AI)-based imaging analysis or computer-aided diagnostic algorithms was challenging.
We had previously applied radiomics analysis and deep learning algorithms to develop AI-diagnostic models for AD, and the results showed that the radiomics model could achieve the AUC of 0.82; however, the deep learning (DL) using the whole DBT image as input only achieved AUC of 0.61 (7). It is known that the diagnostic accuracy of deep learning is highly dependent on the size of the input image that contains the abnormalities (13). However, our study and others have further shown that DL with Grad-CAM may localize the AD (7,14,15). Given that manually drawn ROI was not clinically feasible for developing an automatic diagnostic tool, we suggested a combined strategy to use DL for localizing AD based on the Grad-CAM heat maps and then use the generated ROI to extract radiomics features for diagnosis. In the present study, we assembled an independent dataset to test this combined strategy. The results showed that the DL-generated ROI could yield comparable diagnostic performance as manual ROI, reaching the overall AUC of 0.84–0.85 in the training dataset and 0.82–0.84 in the testing dataset.
AD can also be an associated feature accompanying other clinically significant findings such as mass, regional high-density, and calcifications. The second objective of our study was to investigate the presentation of different ADs, by separating cases into pure AD and AD accompanied by mass, regional high-density, and calcifications. The results showed that the malignancy rate and the diagnostic AUC in the group with other features were significantly higher than in the pure AD group. As the mass, regional high-density, and calcifications were prominent features, the DL could detect them more easily, which resulted in higher diagnostic accuracy. The DL-generated ROI yielded an AUC of 0.86 in the AD group associated with other features, significantly higher than 0.77 in the pure AD group. Nonetheless, the results also support the feasibility of the combined strategy to detect and classify pure AD.
Several studies have applied AI to detect AD, primarily for two-dimensional mammography. Liu et al. (6) developed four deep learning architectures utilizing the Mask R-CNN framework to identify AD, where the EfficientNetV2 model demonstrated good diagnostic efficacy. Wan et al. (16) demonstrated an integrated approach combining AI algorithms with the Reader First-1 protocol, which resulted in an AUC of 0.88. Baccouche et al. (17) assessed a YOLO-based fusion model for detecting and classifying breast lesions on mammograms. Rehman et al. (18) introduced an automated, computer-aided diagnostic system that leverages computer vision and deep learning to diagnose AD.
DBT can resolve overlapping tissues, and large datasets have slowly become available. Li et al. (19) engineered a deep learning framework based on deformable convolutions, focusing on the atypical architectural distortions. This model achieved a mean true positive fraction (MTPF) of 0.7148 ± 0.032, which could assist radiologists in identifying more ADs. Li et al. (20) devised a deep learning model that incorporated the distribution of mammary glands as a priori knowledge to detect architectural distortions in DBT. They employed a Faster R-CNN network, a common algorithm used for lesion detection in medical images. Nevertheless, training such DL networks is challenging due to difficulties in acquiring accurate ground truth for distortions in DBT and is further complicated by the rarity of AD for training DL models.
In our research, instead of training a specialized detection network, we applied Gradient-weighted Class Activation Mapping (Grad-CAM) to visualize suspicious areas. Similarly, Ricciardi et al. (14) produced activation maps using various confidence thresholds. DBT-guided biopsy is a mature technique that has been demonstrated to be safe and effective for the pathologic diagnosis of lesions presenting with AD (21,22). However, there was a high rate of benign lesions, especially in pure AD without other features. Considering the risks of procedures and the psychological burden on the patients, the low-risk lesions may be managed by short-term imaging surveillance rather than immediate biopsy/surgery. Villa-Camacho et al. investigated the upgrade rates of AD on DBT, and reported an overall upgrade rate of 10.2% from nonmalignant pathology at biopsy to malignancy at the surgery, but AD without atypia has a very low upgrade rate of 2.2% (23). The results further suggest that more research is needed for cases with pure AD.
The study has several limitations. First, although an independent dataset was assembled, these were later temporal cases acquired at the same institution, not an external dataset. Second, as the AD did not have a clear boundary, the ROI drawing was known to have high variations, so we used consensus by two radiologists. Our results demonstrated that the DL-generated ROI may provide a standardized tool. Third, we attempted to separate cases into different AD presentations according to the presence of accompanying features. This was rarely reported before, and the assignment of cases with masses or regional high-density and suspicious calcifications was also performed based on consensus reading. Although the BI-RADS definition of AD is with no definite mass visible, mass or regional high density may appear nearby, and the presence of AD is included in the DBT report. Therefore, we chose to include all eligible cases and separately analyze them. Another limitation for the cases with AD and other imaging features was the difficulty of knowing the corresponding pathological types for the AD and other features, respectively. Therefore, we reported the dominating findings for each case.
In conclusion, we tested a combined AI strategy for diagnosing AD on DBT using deep learning with Grad-CAM to localize the distortion areas and then using a radiomics model to estimate the malignancy probability. The diagnostic performance achieved by the DL-generated ROI was comparable with manually delineated ROI. The results support the potential of using the combined DL and radiomics algorithms to develop a fully automatic diagnostic tool for AD on DBT images.
FUNDING
This work was supported in part by the Key Laboratory of Intelligent Medical Imaging of Wenzhou (No. 2021HZSY0057, Wenzhou, Zhejiang, China), Wenzhou Municipal Science and Technology Bureau, China (No. Y20190564, No. Y20240349), and NIH National Cancer Institute grant P30 CA062203.
Abbreviations:
- AD
Architectural Distortion
- AI
Artificial Intelligence
- AUC
Area Under Curve
- CAD
Computer-Aided Diagnosis
- DBT
Digital Breast Tomosynthesis
- DL
Deep Learning
- Grad-CAM
Gradient-weighted Class Activation Mapping
- ROC
Receiver Operating Curve
- ROI
Region Of Interest
- SVM
Support Vector Machine
Footnotes
DECLARATION OF COMPETING INTEREST
The authors declare that they have no known competing financial interests or personal relationships that could have appeared to influence the work reported in this paper.
Contributor Information
Xiao Chen, Department of Radiology, First Affiliated Hospital of Wenzhou Medical University, Wenzhou, China.
Yang Zhang, Department of Radiological Sciences, University of California, Irvine, CA; Department of Radiation Oncology, University of California, Irvine, CA.
Jiejie Zhou, Department of Radiology, First Affiliated Hospital of Wenzhou Medical University, Wenzhou, China; Department of Radiological Sciences, University of California, Irvine, CA.
Yong Pan, Department of Radiology, First Affiliated Hospital of Wenzhou Medical University, Wenzhou, China.
Hanghui Xu, Zhuji People’s Hospital of Zhejiang Province, China.
Ying Shen, Department of Radiology, First Affiliated Hospital of Wenzhou Medical University, Wenzhou, China.
Guoquan Cao, Department of Radiology, First Affiliated Hospital of Wenzhou Medical University, Wenzhou, China.
Min-Ying Su, Department of Radiological Sciences, University of California, Irvine, CA; Department of Medical Imaging and Radiological Sciences, Kaohsiung Medical University, Kaohsiung, Taiwan.
Meihao Wang, Department of Radiology, First Affiliated Hospital of Wenzhou Medical University, Wenzhou, China; Key Laboratory of Intelligent Medical Imaging of Wenzhou, Key Laboratory of Alzheimer’s Disease of Zhejiang Province, Institute of Aging, Wenzhou Medical University, Wenzhou, China.
REFERENCES
- 1.World Health Organization Fact Sheet. 〈https://www.who.int/newsroom/fact-sheets/detail/breast-cancer〉.
- 2.Siegel RL, Miller KD, Wagle NS, Jemal A. Cancer statistics, 2023. CA Cancer J Clin 2023; 73:17–48. [DOI] [PubMed] [Google Scholar]
- 3.Gaur S, Dialani V, Slanetz PJ, Eisenberg RL. Architectural distortion of the breast. AJR Am J Roentgenol 2013; 201:W662–W670. [DOI] [PubMed] [Google Scholar]
- 4.Chong A, Weinstein SP, McDonald ES, Conant EF. Digital breast tomosynthesis: concepts and clinical practice. Radiology 2019; 292:1–14. [DOI] [PMC free article] [PubMed] [Google Scholar]
- 5.Baker JA, Rosen EL, Lo JY, Gimenez EI, Walsh R, Soo MS. Computer-aided detection (CAD) in screening mammography: sensitivity of commercial CAD systems for detecting architectural distortion. AJR Am J Roentgenol 2003; 181:1083–1088. [DOI] [PubMed] [Google Scholar]
- 6.Liu Y, Tong Y, Wan Y, et al. Identification and diagnosis of mammographic malignant architectural distortion using a deep learning based mask regional convolutional neural network. Front Oncol 2023; 13:1119743. [DOI] [PMC free article] [PubMed] [Google Scholar]
- 7.Chen X, Zhang Y, Zhou J, et al. Diagnosis of architectural distortion on digital breast tomosynthesis using radiomics and deep learning. Front Oncol 2022; 12:991892. [DOI] [PMC free article] [PubMed] [Google Scholar]
- 8.American College of Radiology ACR BI-RADS atlas: breast imaging reporting and data system (5th ed.), Reston, Virginia: (2013). [Google Scholar]
- 9.Vijapura C, Yang L, Xiong J, Fajardo LL. Imaging features of nonmalignant and malignant architectural distortion detected by tomosynthesis. AJR Am J Roentgenol 2018; 211:1397–1404. [DOI] [PubMed] [Google Scholar]
- 10.Bachert SE, Jen A, Denison C, et al. Breast lesions associated with mammographic architectural distortion: a study of 588 core needle biopsies. Mod Pathol 2022; 35:728–738. [DOI] [PubMed] [Google Scholar]
- 11.Onega T, Smith M, Miglioretti DL, et al. Radiologist agreement for mammographic recall by case difficulty and finding type. J Am Coll Radiol 2016; 13(11S):e72–e79. [DOI] [PubMed] [Google Scholar]
- 12.Ahmed SA, Samy M, Ali AM, Hassan RA. Architectural distortion outcome: digital breast tomosynthesis-detected versus digital mammography-detected. Radiol Med 2022; 127:30–38. [DOI] [PubMed] [Google Scholar]
- 13.Zhou J, Zhang Y, Chang KT, et al. Diagnosis of benign and malignant breast lesions on DCE-MRI by using radiomics and deep learning with consideration of peritumor tissue. J Magn Reson Imaging 2020; 51:798–809. [DOI] [PMC free article] [PubMed] [Google Scholar]
- 14.Ricciardi R, Mettivier G, Staffa M, et al. A deep learning classifier for digital breast tomosynthesis. Phys Med 2021; 83:184–193. [DOI] [PubMed] [Google Scholar]
- 15.Ueda D, Yamamoto A, Takashima T, et al. Visualizing "featureless" regions on mammograms classified as invasive ductal carcinomas by a deep learning algorithm: the promise of AI support in radiology. Jpn J Radiol 2021; 39:333–340. [DOI] [PubMed] [Google Scholar]
- 16.Wan Y, Tong Y, Liu Y, et al. Evaluation of the combination of artificial intelligence and radiologist assessments to interpret malignant architectural distortion on mammography. Front Oncol 2022; 12:880150. [DOI] [PMC free article] [PubMed] [Google Scholar]
- 17.Baccouche A, Garcia-Zapirain B, Zheng Y, Elmaghraby AS. Early detection and classification of abnormality in prior mammograms using image-to-image translation and YOLO techniques. Comput Methods Programs Biomed 2022; 221:106884. [DOI] [PubMed] [Google Scholar]
- 18.Rehman KU, Li J, Pei Y, Yasin A, Ali S, Saeed Y. Architectural distortion-based digital mammograms classification using depth wise convolutional neural network. Biology (Basel) 2021; 11:15. [DOI] [PMC free article] [PubMed] [Google Scholar]
- 19.Li Y, He Z, Pan J, et al. Atypical architectural distortion detection in digital breast tomosynthesis: a computer-aided detection model with adaptive receptive field. Phys Med Biol 2023; 68(4). [DOI] [PubMed] [Google Scholar]
- 20.Li Y, He Z, Lu Y, et al. Deep learning of mammary gland distribution for architectural distortion detection in digital breast tomosynthesis. Phys Med Biol 2021; 66:035028. [DOI] [PubMed] [Google Scholar]
- 21.Choudhery S, Johnson MP, Larson NB, Anderson T. Malignant outcomes of architectural distortion on tomosynthesis: a systematic review and meta-analysis. AJR Am J Roentgenol 2021; 217:295–303. [DOI] [PubMed] [Google Scholar]
- 22.Walcott-Sapp S, Garreau J, Johnson N, Thomas KA. Pathology results of architectural distortion on detected with digital breast tomosynthesis without definite sonographic correlate. Am J Surg 2019; 217:857–861. [DOI] [PubMed] [Google Scholar]
- 23.Villa-Camacho JC, Bahl M. Management of architectural distortion on digital breast tomosynthesis with nonmalignant pathology at biopsy. AJR Am J Roentgenol 2022; 219:46–54. [DOI] [PubMed] [Google Scholar]