

Abstract
Background
Calorie restriction (CR) ameliorates preclinical models of multiple sclerosis (MS) via multiple mechanisms. These include decreased leptin, a proinflammatory adipokine, but mechanistic studies in humans are lacking. Tests of daily and intermittent CR (iCR) in people with MS (pwMS) showed improvements in fatigue and well-being measures. This trial studied the effects of 12-week iCR on metabolic, immunological, and clinical outcomes in pwMS.
Method
Relapsing-remitting MS participants were randomised to iCR or a control group. Study visits were conducted at baseline, 6 and 12 weeks. The primary outcome was reduction in serum leptin levels at 12 weeks. Feasibility and safety were assessed by diet adherence and adverse events (AEs). Secondary outcomes included changes in anthropometric and body composition measures, metabolic and immunologic profiling, and clinical measures. Mixed effects linear regression models were used to evaluate outcome differences between and within groups over time.
Results
Forty-two pwMS were randomised, 34 completed the study (17/group). Leptin serum levels at 12 weeks were significantly lower in the iCR versus the control group (mean decrease −6.98 µg/dL, 95% CI: −28.02 to 14.06; p=0.03). Adherence to iCR was 99.5% and 97.2% at 6 and 12 weeks, respectively, and no serious AEs were reported. An increase in blood CD45RO+ regulatory T-cell numbers was seen after 6 weeks of iCR. Exploratory cognitive testing demonstrated a significant improvement in the Symbol Digit Modality Test Score in the iCR group at 12 weeks.
Conclusions
iCR has the potential to benefit metabolic and immunologic profiles and is safe and feasible in pwMS.
Trial registration number
Keywords: MULTIPLE SCLEROSIS, NEUROIMMUNOLOGY
WHAT IS ALREADY KNOWN ON THIS TOPIC
Among different diets, calorie restriction (CR) was shown to ameliorate multiple sclerosis (MS) preclinical models, while in people with MS (pwMS) it was beneficial on subjective well-being measures and fatigue.
Yet, more mechanistic studies and rigorous scientific evidence are lacking.
WHAT THIS STUDY ADDS
This randomised clinical trial in pwMS demonstrates that 12 weeks of intermittent CR (iCR) decreases serum leptin, a proinflammatory adipokine with a potential pathogenic role in MS, and iCR is feasible and safe. Concomitantly, iCR changes peripheral immune cell and lipid profiles and may improve cognition.
HOW THIS STUDY MIGHT AFFECT RESEARCH, PRACTICE OR POLICY
This study provides mechanistic insights on CR beneficial effects in MS and supports the potential role of diet as an add-on lifestyle intervention to synergize with current disease-modifying therapies in controlling disease activity.
Introduction
Multiple sclerosis (MS) is an inflammatory, demyelinating and neurodegenerative disease of the central nervous system (CNS). Despite treatments that control disease inflammatory activity, many still develop chronic progression, physical and cognitive disabilities and significant personal and socioeconomic burdens. The aetiology of MS is unknown but involves genetic and environmental factors. Obesity early in life is associated with increased risk of developing MS,1,3 while obesity in people with MS (pwMS) correlates with worse progression and disability.4 Multiple mechanisms could underlie this association, including a role of adipose tissue in secreting proinflammatory adipokines, hormonal changes and gut dysbiosis.5 Dietary interventions aimed at reducing calorie intake have gained increasing interest among pwMS and clinicians for symptom management and to possibly interfere with disease mechanisms.6 7 Calorie restriction (CR), which is a reduction of food intake without malnutrition, was effective in ameliorating clinical course and dampening inflammation in MS preclinical models.8 9 The mechanisms of CR are likely related to its anti-inflammatory and neuroprotective effects.10 Several prior clinical studies in pwMS indicate that daily or intermittent CR (iCR) is feasible and improves subjective clinical measures.7 8 11 However, rigorous clinical trials providing scientific evidence on CR mechanisms of action are limited. In a randomised pilot study in relapsing pwMS, 15 days of iCR led to a significant reduction in levels of leptin,8 an adipose tissue derived proinflammatory adipokine linked to MS pathogenesis and that is required for development of the experimental autoimmune encephalomyelitis (EAE) model of MS.12 Thus, we designed and conducted a larger, randomised, rater-blinded clinical study comparing the effects of iCR versus an unrestricted standard Western diet in people with relapsing-remitting MS (RRMS) to test the hypothesis that iCR can modulate leptin levels, as well as serum levels of other adipokines/cytokines, with an overall reduction of metabolic and immunologic inflammatory profiles and improvement in patient reported outcomes (PROs). Our hypothesis was tested in a cohort of pwMS randomly assigned to follow either iCR or the control diet for 12 weeks. The primary outcome of the study was the difference in serum levels of leptin at 12 weeks between groups; secondary outcomes included feasibility and safety of iCR in pwMS, changes in anthropometric and total body fat measures, peripheral blood metabolic and immunologic profiling. Effects on clinical measures were evaluated as exploratory outcomes.
Research design and methods
Registration
The study was registered at ClinicalTrials.gov (NCT03539094).
Study design
A parallel, randomised, controlled clinical trial was conducted to examine the effect of iCR on serum leptin (figure 1). MS participants were randomly allocated (1:1) to one of two groups: iCR or control. Study visits occurred at baseline, 6 and 12 weeks for all study outcome measurements, except oral glucose tolerance test (OGTT) and dual-energy X-ray absorptiometry (DEXA) which were only collected at baseline and 12 weeks. The 6-week visit was used as an intermediary timepoint to better characterise temporal changes of the different outcomes. Adverse events (AEs) were monitored throughout the study. During the study, the following protocol changes were applied: body mass index (BMI) range was changed to 22–35 kg/m2 on May 2018, to 22–36 kg/m2 on November 2018 and to 22–38 kg/m2 on October 2020. Dimethyl fumarate and teriflunomide were added as allowed disease-modifying therapies (DMTs) on November 2018, while natalizumab was added on March 2020.
Figure 1. Overview of the study design. DEXA, dual-energy X-ray absorptiometry; MS, multiple sclerosis; OGTT, oral glucose tolerance test; PRO, patient reported outcome; CPC, complete blood count.

Study subjects
PwMS were recruited at the John L. Trotter MS Center at Washington University School of Medicine (WUSM) beginning in January 2018 until November 2021. Enrolment criteria were age≥18 years old, with confirmed RRMS based on 2010 McDonald criteria,13 Expanded Disability Status Scale (EDSS)<6.014 and neurologically stable for 3 months preceding the baseline visit. Patients were untreated or on a DMT for at least 3 months. Initially, the DMTs allowed included only interferon-ß or glatiramer acetate; subsequently, dimethyl fumarate, teriflunomide or natalizumab were also allowed. Participants were required to have a BMI between 23 and 35 kg/m2 (eligibility widened to 22–38 kg/m2 during the study), stop any weight loss/special diet 1 month prior to their baseline visit, non-smokers (tobacco or e-cigarettes) and have stable weight (<2 kg change) in the previous 6 months. Exclusion criteria included: history of other autoimmune diseases, chronic metabolic diseases (eg, diabetes) or other physiological or pathological conditions (eg, pregnancy or cancer) interfering with study assessments. Use of antibiotics was not allowed in the 3 months prior to the baseline visit and during the study. Use of systemic corticosteroids or omega-3/fish oil supplements were not allowed for 1 month before enrolment and for all the duration of the study. Anticoagulant therapies (eg, warfarin) or other drugs requiring monitoring of vitamin K intake were not allowed at any time. Use of other medications with no changes in dosage during the study was allowed.
Intervention
Participants in the iCR group were instructed to restrict their calorie intake for 2 non-consecutive days per week. During these fasting days, iCR participants were requested to consume only non-starchy vegetables (raw or cooked), eaten plain or with oil (maximum 2 tablespoons/day), vinegar, lemon juice and/or seasonings, non-caloric drinks, not to exceed 500 calories/day. On non-fasting days, iCR participants were instructed to consume their usual food intake but to monitor portion sizes and food choices so as not to overeat. Participants randomised to the control group continued with their regular diet, with unrestricted access to food, but were asked to consume 1–1.5 cups of vegetables each day for the 12 weeks of the study to achieve similar consumption of vegetables in both groups. All study participants were asked to maintain their usual activity levels, which was monitored at baseline, 6-week and 12-week visits using the Physical Activity Recall (PAR) Questionnaire administered by a trained team member using a standardised interview form15 (online supplemental eMethods). The study dietitian contacted participants (by phone or email) in both groups weekly to collect morning weights, changes in medications, AEs and to provide motivational support for participants to follow their interventions. The weekly contact also served as a check on dietary adherence.
Sample size
Based on data from our pilot study,8 we expected a mean difference in serum leptin levels at week 12 between the 2 groups of 3 µg/dL and a common SD of 4.5 µg/dL. After accounting for 20% attrition, an analysis of covariance with 30 subjects per group achieved 82.1% power to detect the assumed differences in the mean leptin at 12 weeks controlling for covariates with an R2 of 0.2 using a two-sided F test assuming a significance level of 0.05. Power calculations were conducted in PASS V.11.
Randomisation and blinding
The 1:1 randomisation used a computerised random number generator created using SAS V.9.4 statistical software. Randomisation parameters consisted of a block design with block sizes of 4. The study statistician (AS), who had no contact with participants, prepared the schedule and investigators were blinded to the randomisation scheme. The study coordinator randomised participants using REDCap. Clinical assessors and the study coordinator administering cognitive testing were blinded to the randomization assignment. Laboratory technicians were blinded to treatment assignment when processing the samples. The dietician was not blinded.
Study outcomes
Adipokines and other analytes
A venous blood sample was obtained after an overnight fast at baseline, 6, and 12 weeks, and aliquots of plasma and serum were frozen at −80°C. Samples were analysed by the WUSM Core Laboratory for Clinical Studies in a single batch by technicians blinded to sample identity. The following analytes were measured in serum: leptin, high molecular weight (HMW) adiponectin, cortisol, insulin, insulin-like growth factor 1 (IGF-1), β-hydroybutyrate, high sensitivity C reactive protein (hsCRP), interleukin 6 (IL-6), neurofilament light chains (pNfL) (online supplemental eMethods for details on the assays). Serum lipids, complete metabolic panel (CMP), complete blood count (CBC) and urinalysis were performed by the Core Laboratory on blood and urine collected at baseline, weeks 6 and 12.
Feasibility and diet adherence
Feasibility was assessed by the number of participants that withdrew from the study in each group, and adherence to the diet was evaluated with the collection of 4-day food diaries (2 weekdays and 2 weekend days) on week 6 and 12 in both groups. One fasting day was included in the 4-day period for the iCR group to monitor their adherence to the fasting protocol. In the iCR group, adherence to the intervention was calculated as a percentage of the number of fasting days completed divided by the total number of expected fasting days during the study. The degree of CR was calculated by subtracting the calorie intake at week 6 and 12 from the calorie intake at baseline, divided by the calorie intake at baseline. Adherence to consumption of 1–1.5 cups of vegetables per day in the control group was monitored by having the participants record their food intake for the first 14 days of the study, in the 4-day food diaries collected at week 6 and 12, and on the weekly phone call or email. If the participants were not meeting their daily vegetable intake goal, they were encouraged to add vegetables to their grocery list and menus. A formal daily percentage adherence to 1–1.5 cups of vegetables for the control group was not calculated.
Dietary intake
Food diaries were analysed to determine nutrient intakes using the NDSR programme (Nutrition Data System for Research, University of Minnesota, version 2017 to version 2022 depending on the time when the food diary was collected). The Healthy Eating Index (HEI) total score was calculated at each timepoint by NDSR as a measure of diet quality using 13 components to assess how well the diet aligns with recommendations of the 2015–2020 Dietary Guidelines for Americans16 (online supplemental eTable 1). A higher HEI total score indicates a diet that aligns better with the recommendations.
Safety and AEs
Participants performed routine CBC, CMP testing, comprehensive of glucose, calcium, sodium, potassium, bicarbonate and chlorine, blood urea nitrogen, alkaline phosphatase, alanine transaminase, aspartate transaminase, albumin, total protein and bilirubin and urinalysis at baseline, 6 and 12 weeks for safety. AEs were assessed weekly over the phone and during each study visit, and they were defined following the Common Terminology Criteria for Adverse Events (V.5.0; online supplemental eMethods).
Anthropometrics and body composition measures
Height, weight (measured using a Scale-Tronix Portable Scale, Welch Allyn) and waist circumference were obtained with participants wearing only underwear and hospital gown, in the morning after 12-hour fast. A commercial scale (Tanita HD-662 digital scale) was provided for measuring body weight at home weekly. Body composition was evaluated by DEXA (Lunar iDXA, software version Encore V.16 manufactured, GE Healthcare).
Oral glucose tolerance test (OGTT)
After an overnight fast and an adequate carbohydrate intake (at least 150 g/day) during the previous 3 days, subjects underwent a 2-hour OGTT with 75 g oral glucose load (online supplemental eMethods).
Blood immune cell subsets
Flow cytometric analysis was performed on fresh heparinized whole blood as previously described.8 Samples were run on a Gallios Flow Cytometer (Beckman Coulter); analysis was done with Kaluza Software (V.2.0, Beckman Coulter). Antibodies and gating strategy are shown in online supplemental eTable 2a and online supplemental eFigure 1, respectively.
Western blot analysis
Total cell lysates of regulatory T cells (Tregs) and effector T cells (Teffs) were obtained after 20 min incubation at 4°C in RIPA buffer (Sigma-Aldrich), plus SIGMAFAST Protease Inhibitor and Sigma Phosphatase Inhibitor (Sigma-Aldrich). Western blot analysis was performed as described.17 18 Membranes were quantified by densitometric analysis using ImageJ V.1.47 (online supplemental eTable2b). Densitometric results are reported as fold over baseline.
Lipidomics
Lipids were extracted from 20 µL plasma samples collected at baseline and week 12 using the two-phase methyl-tert-butyl ether method, with inclusion of an internal standard for each lipid class.19 Lipids were quantified by liquid chromatography-tandem mass spectrometry (LC-MS/MS), using selected reaction monitoring on a TSQ Altis mass spectrometer with Vanquish HPLC. HPLC conditions were as described.20 Precursor and product ion pairs are listed in online supplemental eTable 2c. Peaks were integrated using TraceFinder V.5.1 software, and lipids were quantified by normalisation to class-specific internal standards.
Neurological assessments and PROs
The EDSS14 was performed at baseline, 6-week and 12-week visit by a neurologist blinded to the intervention assignment of the participant. Standardised tests of manual dexterity (9-hole peg test (9HPT), each hand), timed 25-foot walk (T25-FW) and cognitive functions (Symbol Digit Modality Test (SDMT))21 were performed along with PROs including the MS Impact Scale-29 (MSIS) physical and mental subscales22 and the Modified Fatigue Impact Scale (MFIS) psychosocial, cognitive and physical subscales.23
Statistical analyses
Descriptive statistics were used to summarise demographic and clinical characteristics and differences between groups evaluated using a t-test, Mann-Whitney U test or χ2 test, as appropriate. The intention-to-treat principle was used for all analyses. We evaluated differences in the outcomes of interest using mixed effects linear regression models. The model included three timepoints (baseline, 6 and 12 weeks) evaluating between group differences (iCR vs control) and changes within group over time. An interaction term was used to evaluate overall changes between groups and each timepoint. Additionally, the models were adjusted for age, sex and DMT use. Model assumptions were verified, and violations were addressed using transformations. Missing data were not imputed; the mixed model allows for all available data to be included in the analysis. Laboratory data were log transformed for analysis due to the data violating the normality assumption. Raw means and differences are reported (mean differences were calculated as baseline—the follow-up timepoint); the p values are based on the multivariable model adjusting for age, sex and DMT use. The significance level for the primary outcome was 0.05. A 5% false discovery rate (FDR) correction was implemented to control for multiple comparison among secondary and exploratory outcomes. The significance level associated with the FDR correction was p<0.0013. Data analyses were conducted in SAS V.9.4. Lipidomic studies were conducted as post hoc analysis only on plasma samples obtained at baseline and week 12 and were corrected for multiple comparisons using an FDR separately.
Results
Characteristics of study subjects
61 pwMS were consented (n=8 men; n=53 women) and 42 participants were randomised. Of those randomised, 22 were assigned to the iCR and 20 to the control group (figure 2). Baseline demographic, anthropometric, clinical characteristics and dietary intake of the two groups were similar (table 1; online supplemental eTable 3). No enrolled subjects changed DMT during the study. Participants generally maintained their physical activity assessed using the PAR throughout the study (online supplemental eTable 4). 34 of the 42 randomised subjects (80.9%; 17 participants/group) completed the study.
Figure 2. Consolidated Standards of Reporting Trials (CONSORT) flow diagram. iCR, intermittent calorie restriction.

Table 1. Baseline characteristics of MS participants.
| Total (n=42) | iCR (n=22) | Control (n=20) | P value | |
| Race, n (%) | 0.35F | |||
| Caucasian | 36 (85.7) | 19 (86.4) | 17 (85.0) | |
| African American | 4 (9.5) | 1 (4.5) | 3 (15.0) | |
| Other | 2 (4.8) | 2 (9.1) | 0 (0.0) | |
| Ethnicity, n (%) | 0.48F | |||
| Not Hispanic | 41 (97.6) | 22 (100.0) | 19 (95.0) | |
| Hispanic or Latino | 1 (2.4) | 0 (0.0) | 1 (5.0) | |
| Gender/sex, n (%) | 0.40F | |||
| Male | 6 (14.3) | 2 (9.1) | 4 (20.0) | |
| Female | 36 (85.7) | 20 (90.9) | 16 (80.0) | |
| Age at consent (years), mean±SD | 48.2±9.8 | 50.0±9.5 | 46.4±10.1 | 0.24 |
| Disease duration (years), median (Q1, Q3) | 11.0 (5.0, 19.0) | 15.0 (8.0, 21.0) | 7.5 (4.5, 14.0) | 0.17 |
| Number of relapses*, median (Q1, Q3) | 1.00 (0.00, 2.0) | 2.0 (0.00, 5.0) | 1.00 (0.00, 2.0) | 0.10 |
| EDSS, median (Q1, Q3) | 2.0 (1.5, 2.5) | 2.0 (1.5, 2.5) | 2.0 (1.3, 2.5) | 0.62 |
| Body mass index, mean±SD | 28.7±4.3 | 27.9±3.6 | 29.6±4.9 | 0.20 |
| Weight in kg, mean±SD | 80.7±15.2 | 78.3±13.1 | 83.4±17.1 | 0.28 |
| Waist circumference in centimetres, mean±SD | 99.3±11.4 | 97.5±10.7 | 101.4±12.0 | 0.27 |
| Total body fat (g), mean±SD | 92.8±18.8 | 90.4±19.7 | 95.5±17.9 | 0.39 |
| DMT, n (%) | 0.15F | |||
| None | 3 (7.1) | 3 (13.6) | 0 (0.0) | |
| Avonex | 5 (11.9) | 2 (9.1) | 3 (15.0) | |
| Copaxone | 15 (35.7) | 10 (45.5) | 5 (25.0) | |
| Rebif | 6 (14.3) | 1 (4.5) | 5 (25.0) | |
| Tecfidera | 6 (14.3) | 4 (18.2) | 2 (10.0) | |
| Plegridy | 2 (4.8) | 0 (0.0) | 2 (10.0) | |
| Tysabri | 3 (7.1) | 1 (4.5) | 2 (10.0) | |
| Aubagio | 2 (4.8) | 1 (4.5) | 1 (5.0) |
Number of relapses is from disease onset.
Values presented as mean±SD with Analysis of Variance (ANOVA), Mmedian [(P25, P75]) with Kruskal-Wallis test, or Nn (column %) with Fisher’s Exact test (F) or Pearson’s chi-squareχ2 test.
Data not available for all subjects. Missing values: Nnumber of relapses=4. .
DMTdisease-modifying therapyEDSSExpanded Disability Status ScaleiCRintermittent calorie restrictionMSmultiple sclerosis
Leptin levels were lower in the iCR compared with the control group at 12 weeks
Leptin levels were significantly lower in the iCR compared with the control group at 12 weeks (mean leptin decrease was −6.98 µg/dL, 95% CI: −28.02 to 14.07; p=0.03; table 2; figure 3A). Leptin levels were nominally lower at the 6-week mid-timepoint in the iCR group compared with controls (mean decrease −11.49 µg/dL, 95% CI: −32.54 to 9.55), although this did not reach significance at the FDR level. HMW adiponectin levels did not differ at 12 weeks between groups, but they were nominally increased (−537 ng/mL; 95% CI: −1043 to –31) at 6 weeks and 12 weeks (−610 ng/mL; 95% CI: −1116 to –104) compared with baseline in the iCR group after FDR correction (table 2). The iCR group had nominally higher levels of β-hydroxybutyrate compared with control at 6 weeks, while IGF-1 levels were lower at 6 weeks in the iCR group, although these differences were not statistically significant after FDR correction. No changes in cortisol, IL-6, CRP and plasma NfL were observed between the two groups and within group over time (table 2).
Table 2. Changes in adipokines, metabolic, inflammatory, neuronal injury biomarkers and body composition measures between the iCR and control groups at the 6 and 12 weeks and within group during the study.
| iCR versus Control | iCR | Control | ||||||
| Mean difference (95% CI) | P value* | Mean change (95% CI) | P value* | Mean change (95% CI) | P value* | |||
| Metabolic and inflammatory biomarkers | ||||||||
| Leptin (µg/dL) | Week 6 | −11.49 (−32.54 to 9.55) | 0.007 | 0–6 weeks | 2.85 (−4.19 to 9.89) | 0.04 | 2.91 (−4.3 to 10.13) | 0.6 |
| Week 12 | −6.98 (−28.02 to 14.07) | 0.03 | 0–12 weeks | 2.21 (−4.83 to 9.25) | 0.06 | 6.79 (−0.43 to 14) | 0.09 | |
| Adiponectin (ng/mL) | Week 6 | 679 (−1892 to 3250) | 0.44 | 0–6 weeks | −537 (−1043 to −31) | 0.02 | −566 (−1085 to −48) | 0.06 |
| Week 12 | 1202 (−1369 to 3772) | 0.27 | 0–12 weeks | −610 (−1116 to –104) | 0.005 | −117 (−635 to 401) | 0.73 | |
| β-Hydroxybutyrate (mol/L) | Week 6 | 0.06 (−0.034 to 0.16) | 0.03 | 0–6 weeks | 0.09 (0 to 0.17) | 0.14 | 0.05 (−0.042 to 0.14) | 0.03 |
| Week 12 | 0.01 (−0.09 to 0.11) | 0.63 | 0–12 weeks | 0.07 (−0.02 to 0.15) | 0.61 | −0.02 (−0.11 to 0.07) | 0.37 | |
| Cortisol (µg/dL) | Week 6 | −4.21 (−8.54 to 0.12) | 0.12 | 0–6 weeks | 0.37 (−2.91 to 3.66) | 0.76 | −2.73 (−6.13 to 0.67) | 0.14 |
| Week 12 | 0.05 (−4.29 to 4.38) | 0.76 | 0–12 weeks | −0.52 (−3.8 to 2.77) | 0.5 | 0.64 (−2.76 to 4.04) | 0.75 | |
| IGF-1 (ng/mL) | Week 6 | −42.41 (−69.22 to 15.61) | 0.01 | 0–6 weeks | 2.84 (−7.85 to 13.53) | 0.26 | −7.57 (−18.53 to 3.39) | 0.25 |
| Week 12 | −23.63 (−50.43 to 3.18) | 0.36 | 0–12 weeks | −2.8 (−13.48 to 7.89) | 0.71 | 5.58 (−5.38 to 16.54) | 0.21 | |
| C reactive protein (mg/L)) | Week 6 | 0.66 (−2.02 to 3.34) | 0.9 | 0–6 weeks | 0.53 (−0.9 to 1.96) | 0.31 | −0.94 (−2.41 to 0.53) | 0.24 |
| Week 12 | 1.04 (−1.63 to 3.72) | 0.98 | 0–12 weeks | 0.67 (−0.76 to 2.1) | 0.18 | −0.42 (−1.89 to 1.05) | 0.5 | |
| IL-6 (pg/mL) | Week 6 | −8.96 (−22.79 to 4.87) | 0.85 | 0–6 weeks | −0.58 (−4.46 to 3.3) | 0.62 | −4.04 (−8.11 to 0.03) | 0.64 |
| Week 12 | −6.6 (−20.43 to 7.22) | 0.34 | 0–12 weeks | −0.18 (−4.06 to 3.7) | 0.69 | −1.28 (−5.35 to 2.79) | 0.62 | |
| Marker of neuronal injury | ||||||||
| NfL (pg/mL) | Week 12 | 5.78 (−1.27 to 12.82) | 0.1 | 0–12 weeks | −2.69 (−7.59 to 2.21) | 0.24 | −0.25 (−5.17 to 4.67) | 0.85 |
| Body composition | ||||||||
| Body weight (kg) | Week 6 | −7.34 (−16.57 to 1.88) | 0.61 | 0–6 weeks | 2.17 (1.46 to 2.88) | <0.0001 | −0.02 (−0.73 to 0.69) | 0.97 |
| Week 12 | −7.88 (−17.11 to 1.34) | 0.57 | 0–12 weeks | 2.66 (1.95 to 3.37) | <0.0001 | −0.06 (−0.77 to 0.65) | 0.87 | |
| Body mass index (kg/m2) | Week 6 | −2.51 (−5.08; 0.07) | 0.24 | 0–6 weeks | 0.76 (0.52 to 0.99) | <0.0001 | −0.04 (−0.29 to 0.2) | 0.73 |
| Week 12 | −2.58 (−5.15 to 0.0) | 0.23 | 0–12 weeks | 0.98 (0.74 to 1.21) | <0.0001 | 0.1 (−0.13 to 0.34) | 0.38 | |
| Waist circumference (cm) | Week 6 | −5.32 (−12.34 to 1.69) | 0.24 | 0–6 weeks | 1.58 (0.74 to 2.42) | <0.001 | 0.23 (−0.61 to 1.07) | 0.58 |
| Week 12 | −6.79 (−13.8 to 0.2) | 0.17 | 0–12 weeks | 2.6 (1.76 to 3.44) | <0.0001 | −0.22 (−1.08 to 0.64) | 0.63 | |
| Total fat mass (g) | Week 12 | -5.61(-11.47, 0.25) | 0.06 | 0–12 weeks | 2.21(1.57, 2.85) | <0.0001 | -0.41(-1.09, 0.25) | 0.21 |
| Trunk fat mass (g) | Week 12 | -3.41(-6.97, 0.15) | 0.05 | 0–12 weeks | 1.4(0.92, 1.88) | <0.0001 | -0.27(-0.77, 0.23) | 0.28 |
| Total lean mass (g) | Week 12 | -2.10(-5.54, 1.33) | 0.22 | 0–12 weeks | -0.51(-2.85, 1.83) | 0.65 | -1.72(-4.21, 0.76) | 0.16 |
| Body temperature (°C) | Week 6 | −0.14 (−0.37 to 0.1) | 0.21 | 0–6 weeks | −0.01 (−0.21 to 0.19) | 0.9 | −0.05 (−0.25 to 0.16) | 0.44 |
| Week 12 | −0.32 (−0.56 to −0.08) | 0.02 | 0–12 weeks | 0.2 (0 to 0.4) | 0.03 | −0.02 (−0.22 to 0.19) | 0.73 | |
Mean differences between groups and within group are calculated based on the raw means. Mean differences between groups were calculated as follows: iCR mean at 6 (or 12) weeks minus control mean at 6 (or 12) weeks. Changes over time within group were calculated as the values at baseline minus the values at week 6 or 12. Therefore, negative values correspond to an increase.
P values are adjusted for age, sex and MS disease -modifying therapy use. Mean reductions or increases reported in the table are not adjusted. The difference in leptin between groups at 12 weeks weeks was considered statistically significant at Pp<0.05. All other comparisons were considered significant at the FDR significance level of Pp<0.0013 (significant p values are marked in bold).
iCRintermittent calorie restrictionIGF-1insulin-like growth factor 1IL-6interleukin 6NfLneurofilament light chain
Figure 3. Changes in adipokine and anthropometric measures in the iCR and control groups over the course of the study. (A) Leptin and high molecular weight (HMW) adiponectin serum levels at 6 and 12 weeks. (B) BMI, waist circumference and total fat measured by dual-energy X-ray absorptiometry at 6 and 12 weeks. In the graphs, for each variable, raw values (not adjusted) are reported for each participant at all timepoints. p values are adjusted for age, sex and multiple sclerosis disease-modifying therapy. The box extends from 25th to 75th percentiles. Horizontal bars are median and error bars are minimum and maximum values. BMI, body mass index; iCR, intermittent calorie restriction; ns, not significant.

Feasibility
Five participants withdrew from the iCR group, while three withdrew from the control group during the intervention, corresponding to a dropout rate of 22.7% and 15%, respectively, which were not statistically different (p=0.7 by Fisher’s exact test; figure 2). Adherence to the 2 fasting days per week was 99.5% for the first 6 weeks and 97.2% for the second 6 weeks of the study. In the iCR group, calorie intake at week 6 and 12 resulted in an overall CR of 21.5% and 23.1%, compared with baseline (online supplemental eTable 3), confirming adherence to expected CR.
Safety
No adverse events grade 3 or higher were seen in either group. 3 of the 22 iCR group participants (13.6%) reported mild symptoms determined to be probably related to the intervention, including headache, lightheadedness, tiredness, bloating and loose stool on fasting days. One control group participant developed optic neuritis, treated with corticosteroids. CBC, CMP and urinalysis performed at all visits did not reveal any clinically significant abnormalities that could be related to the intervention (online supplemental eTable 5).
Reduction of anthropometric and body adiposity measures after 12 weeks of iCR
No significant differences between the iCR and control groups at week 6 or 12 were detected for weight, BMI and waist circumference. Participants in the iCR group showed a continual and significant decrease in weight, BMI and waist circumference throughout the study, after adjusting for age, sex and DMT (table 2). The iCR group lost a mean of 2.17 kg (95% CI: 1.46 to 2.88; p<0.0001) at week 6 and 2.66 kg (95% CI: 1.95 to 3.37; p<0.0001) at week 12 compared with baseline, with a mean decrease in BMI of 0.76 kg/m2 (95% CI: 0.52 to 0.99; p<0.0001) and 0.98 kg/m2 (95% CI: 0.74 to 1.21; p<0.0001) at week 6 and 12, respectively. No significant changes in weight, BMI or waist circumference were observed in the control group over time (table 2; figure 3B).
Body composition studies were performed by DEXA at baseline and week 12, and no significant differences were observed at 12 weeks between the two groups. However, total and trunk fat were significantly reduced at week 12 compared with baseline in the iCR group with a mean decrease of 2.2 kg in total body fat (95% CI: 1.57 to 2.85; p<0.0001) and 1.4 kg in trunk fat (95% CI: 0.92 to 1.88; p<0.0001). No changes in body composition measures were observed over time in the control group. Total lean mass and bone mass did not change over time within each group or between groups at 12 weeks (table 2).
Increased HDL levels after 6 and 12 weeks of iCR
HDL, triglycerides, total cholesterol and LDL levels did not significantly differ between the iCR and control groups at 6 and 12 weeks. HDL levels increased significantly in the iCR group at 6 weeks (mean increase of −5.91 mg/dL, 95% CI: −8.52 to –3.32; p<0.0001) and 12 weeks (mean increase of −2.32 mg/dL, 95% CI: −4.93 to 0.28) compared with baseline, although the latter did not reach FDR significance. The control group exhibited no change over time (online supplemental eTable 5). The other lipids did not differ between groups nor change over time within either group, apart from a nominal reduction in triglycerides levels in the iCR group at week 6 (mean reduction of 23.9 mg/dL, 95% CI: 6.4 to 41.4) which did not reach FDR significance. No clinically significant differences in glucose metabolism were observed between the two groups or within each group over time.
12 weeks of iCR altered circulating T-cell subsets
Flow cytometric phenotyping of peripheral blood immune cells was performed at baseline and weeks 6 and 12 (online supplemental eTable 6; figure 4 and online supplemental eFigure 2). Several T-cell subsets displayed nominal changes between and within group differences, which did not reach the FDR significance level, but could still be biologically relevant to report. At 12 weeks, nominally higher numbers and percentages of naïve CD4+ T cells were observed in the iCR compared with the control group (iCR mean 242 cell/µL, 95% CI: 176 to 307; control mean 112 cell/µL, 95% CI: 44 to 180). Effector memory CD4+ T-cell percentages nominally decreased at the 6-week and 12-week timepoints in the iCR compared with the control group (iCR mean at 12 weeks 32%, 95% CI: 25 to 39%; control mean 45%, 95% CI: 38 to 53%). Th1 cell numbers were nominally lower in the iCR compared with the control group at week 6 (iCR mean: 67 cell/µL, 95% CI: 24 to 111; control mean: 81 cell/µL, 95% CI: 36 to 125) and decreased in the iCR group over the study course (mean decrease at 6 weeks: 67 cell/µL, 95% CI: 15 to 118; mean decrease from baseline to 12 weeks: 53 cell/µL, 95% CI: 2 to 105). For CD45RO+ T regs, absolute values and percentages were nominally increased in the iCR group at 6 weeks compared with baseline (mean increase: −4.9 cells/µL, 95% CI: −9.7 to –0.2; −14.1 %, 95% CI: –25.7 to –2.5), while no differences were noted between the iCR and control groups at 6 and 12 weeks (online supplemental eTable 6).
Figure 4. Changes in T-cell subsets in the iCR and control groups over the course of the study. Absolute numbers and frequencies of (A) naïve CD4+ T cells, (B) effector memory CD4+ T cells and (C) CD45RO+ regulatory T cells at 6 and 12 weeks in the iCR and control groups. In the graphs, for each variable, raw values (not adjusted) are reported for each participant at all timepoints. The box extends from 25th to 75th percentiles. Horizontal bars are median and error bars are minimum and maximum values. iCR, intermittent calorie restriction.

Since Teffs and Tregs engage different metabolic pathways, including glycolysis, lipid synthesis and fatty acid oxidation (FAO), to sustain their own proliferation and function,24,26 we evaluated levels of several enzymes that regulate these metabolic pathways. Tregs isolated from iCR group showed a significant increase of the glycolytic enzyme, Enolase-1, compared with control group; a similar trend was observed for Hexokinase II and Aldolase at 6 and 12 weeks (online supplemental eFigure 3). Moreover, for FAO and lipid synthesis, we observed a significant increase of ACAD9 and FAS levels in Tregs from iCR compared with the control group, at 6 and 12 weeks, respectively; CPT1a and Apo-A4 showed a similar trend, in particular at 6 weeks (online supplemental eFigure 3). On the contrary, we did not observe a clear change in specific metabolic pathways engaged by Teff cells (online supplemental eFigure 4). However, Teff cells from the iCR group appeared less metabolically active compared with the control group.
No significant effects of iCR were detected on the other lymphoid and myeloid cell subsets analysed at the FDR significance level (online supplemental eTable 6).
12 weeks of iCR altered circulating lipids
A total of 159 phospholipid, sphingolipid, acylcarnitine and diacylglycerol (DG) species were quantified in baseline and 12-week samples using LC-MS/MS (online supplemental eTable 7). After FDR correction, 10 lipids were significantly different between iCR and control groups at 12 weeks, whereas no lipids differed at baseline (q<0.05) (figure 5A,B; online supplemental eTable 8). Specifically, four phosphatidylinositols (PI(16:0/18:1), PI(16:0/20:4), PI(16:1/18:1) and PI(18:1/20:4)), two lysophosphatidylethanolamines (LPE(16:0) and LPE(18:0)), one lysophosphatidylcholine (LPC(22:4)) and DG(18:0/18:1) were significantly increased in iCR compared with control, while two sphingolipids, hexosylceramide (HexCer(d18:1/22:1)) and lactosylceramide (LacCer(d18:1/22:1)), were decreased. Three of these, (LPC(22:4), LPE(16:0) and PI(18:1/20:4)), were also significantly higher in the iCR group at 12 weeks compared with baseline (figure 5C and E–G), as well as LPC(16:0), LPC(18:1), LPC(18:2), LPC(20:4), LPE(18:1) and PI(18:1/18:2). No lipids differed significantly within the control group at 12 weeks compared with baseline (figure 5D). Correlation analyses between the 16 lipids altered by iCR and other outcomes significantly affected by the diet at 12 weeks (figure 5H; online supplemental eTable 9) revealed MFIS to be associated with LPE(18:1) after correcting for FDR (psychosocial subscale; r=0.6, q=0.03).
Figure 5. LPC, LPE and PI species are affected by iCR. (A,B) Comparison of lipid levels between iCR and control groups at (A) 12 weeks and (B) baseline. Volcano plots showing effect of (C) iCR or (D) control diet on lipid levels at 12 weeks compared with baseline. p values are corrected for FDR (q<0.05). (E–G) Significant change in levels of (E) LPE(16:0), (F) LPC(22:4) and (G) PI(18:1/20:4) between baseline (closed circle) and 12 weeks (triangle) and within diet groups (q<0.05). (H) Correlation heatmap illustrating significant correlations between the 16 lipids that were significantly altered after iCR and laboratory/clinical variables that were significantly altered after iCR (*p<0.05, # indicates q<0.05). The colour scale shows the correlation coefficient (r). DG, diacylglycerol; FDR, false discovery rate; HexCer, hexosylceramide; iCR, intermittent calorie restriction; LacCer, lactosylceramide; LPC, lysophosphatidylcholine; LPE, lysophosphatidylethanolamine; PI, phosphatidylinositol; CHDLr, cholesterol to high-density lipoprotein ratio; eff: effector.

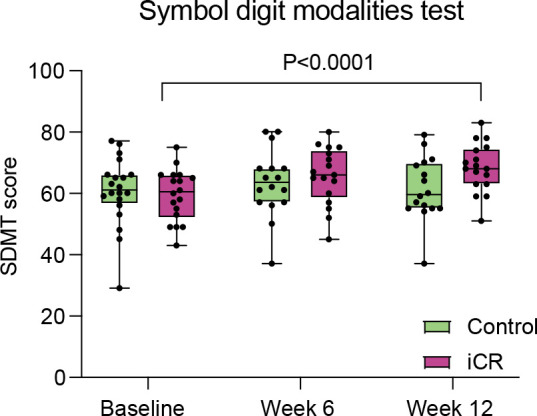
Measures of cognitive function and fatigue improved after 12 weeks of iCR
Standardised clinical testing assessed neurological disability, cognitive performance and PROs at baseline, 6 and 12 weeks (online supplemental eTable 10). These outcomes were exploratory given the short study duration, subjective nature of some of the measures and the fact that patients were unblinded to the intervention. The SDMT score was higher in the iCR versus control group at 12 weeks although not statistically significant after FDR correction (iCR mean 66, 95% CI: 62 to 71; control mean 62, 95% CI: 57 to 66). The SDMT score was significantly increased in the iCR group at the 12-week timepoint (mean increase of −6.2, 95% CI: −3.4 to –9.5; p<0.0001) compared with baseline (figure 6; online supplemental eTable 10). No significant differences in SDMT scores were observed in the control group over time. No significant differences in the MFIS and MSIS scores were observed between the 2 groups at 6 and 12 weeks. MFIS scores were nominally decreased over the 12-week intervention in the iCR group for both the cognitive and psychosocial subscales (respective reductions of mean 2.5, 95% CI: 0.3 to 4.7; and 2.8, 95% CI: 0.8 to 4.8), while no differences were observed in the control group. The iCR group MSIS Score significantly improved from baseline to week 12 in the mental subscale (mean change 7.36, 95% CI: 3.61 to 11.1, p=0.0002) and nominally decreased from baseline to week 6 in the physical scale (mean change: 2.7, 95% CI: 0.41 to 5.12), with no changes over time observed in the control group. We did not find any clinically meaningful changes in the EDSS, 9HPT, PASAT or T25W scores at 12 weeks between groups (online supplemental eTable 10).
Figure 6. Changes in cognitive outcomes in the iCR and control groups over the course of the study. Participants randomised to the iCR group showed a significant increase in the SDMT Score between baseline and week 12. In the graphs, for each variable, raw values (not adjusted) are reported for each participant at all timepoints. P values are adjusted for age, sex and multiple sclerosis disease-modifying therapy. The box extends from the 25th to 75th percentiles. Horizontal bars are median and error bars are minimum and maximum values. iCR, intermittent calorie restriction; SDMT, Symbol Digit Modality Test.
Discussion
This study met its prespecified primary outcome of a reduction of leptin levels after 12 weeks of iCR compared with a control group. Leptin is an adipokine released by the adipose tissue proportionally to body fat, and which has proinflammatory effects.27 Here, reduction of leptin in the iCR compared with the control group at 12 weeks occurred concomitantly to significant decreases in body weight, BMI and body fat measures after 6 and 12 weeks from baseline in the iCR group. Furthermore, iCR was associated with changes in peripheral blood immune and lipidomic profiles.
In contrast to our trial, an 8-week study in pwMS comparing daily CR and iCR (2 fasting days/week) with ad libitum feeding (n=12/group) did not report significant changes in circulating leptin and adiponectin, despite weight loss.7 The differences in the study results might relate to differences in duration and size of the two studies. Leptin and adiponectin are adipokines with known and opposing effects on adaptive and innate immune cells.28 Leptin promotes T-cell proliferation and proinflammatory cytokine secretion and inhibits Treg cell induction.29 30 Leptin levels are associated with MS risk,31 are higher in CSF and serum of pwMS and inversely correlated with circulating Treg numbers.32 Conversely, adiponectin promotes Treg induction and function33 and may be reduced in pwMS.34 We found serum adiponectin levels to be increased from baseline with iCR and this could contribute to iCR anti-inflammatory effects. Changes in adipokine levels towards an overall reduction of systemic inflammation is likely one of the key CR mechanisms of action and reflects diet induced modification in adiposity.
This study demonstrated that 12 weeks of iCR was feasible in pwMS and acceptable based on high diet adherence, reflected by significant changes in BMI and body composition measures in this group. However, analyses of three pilot CR studies in pwMS, reported an overall poor diet adherence regardless of the intensity of clinical support provided to participants. A regimen of time-restricted feeding (TRF; eating in an 8-hour window during the day) was better received than daily or iCR,35 but it was not associated with reduction of total calorie intake and weight loss. This highlights how diet compliance is one of the major barriers to conduct large, randomised diet trials and for long-term sustainability in everyday life. Thus, methods to increase diet adherence (eg, telecoaching, educational and behavioural support through text messages or mobile apps) as well as more practical CR alternatives (eg, TRF, iCR) should be encouraged. Furthermore, our study demonstrated that iCR is a safe way to lose weight (with changes in adiposity) in pwMS, confirming prior studies of iCR and chronic CR in pwMS.7 35
With increasing interest in diet recommendations in pMS,36 there is a pressing demand for conclusive evidence establishing clear links between particular diets and clinical outcomes. Apart from CR, other diets were tested in pMS, including low-fat, Mediterranean, ketogenic and plant-based diets.37 Beneficial effects of the diets on measures of fatigue, physical and mental health are among the most commonly reported,38 while disability was also impacted in some studies.39 Our trial took a more mechanistic approach to investigate underlying pathways supporting CR clinical benefits. Head-to-head comparisons of different diets are lacking and would require large sample sizes. More high quality, randomised controlled trials are also needed. Based on our current knowledge, dietary alterations should be viewed as an add-on therapy to current effective DMT. Moreover, iCR role as a disease-modifying intervention is unproven and still under investigation.
Epidemiological studies have linked poor diet and obesity with increased disability and disease progression in pwMS.6 40 Healthier dietary habits are associated with lower disability.39 41 Yet, association studies do not establish causation, which could be better evaluated in randomised clinical studies or well-designed observational studies. Preclinical evidence, including data from our group, showed that CR ameliorates EAE clinical course and neuropathology through multiple mechanisms including effects on adiposity and the gut microbiome.8 This trial in pwMS demonstrated that iCR can modify the immune inflammatory and metabolic profile, countering some pathogenic mechanisms thought to underlie MS. iCR led to an increase in Tregs and reduction of Teffs. Notably, no changes in total leucocyte counts were observed with iCR, contrary to what is seen with long-term daily CR,42 43 and no significant effect was observed on myeloid cell subsets. These results align with a previous study in pwMS44 and with immunomodulatory effects attributed to CR in humans.42 Tregs can modulate immune tolerance by detecting nutritional changes and energy intake.45 In this study, Tregs from iCR group were more metabolically active than Tregs from the control group while no metabolic changes were observed in the Teff cell compartment. These results suggest that iCR promotes tolerogenic Treg cell metabolism. Beneficial effects of CR include improved vascular and metabolic risk factors, which are associated with worse MS outcomes.46 Our 12-week study showed no major improvement of the clinical lipid profile or glucose tolerance. However, deeper lipidomic profiling revealed increases in LPC, LPE and PI species after iCR. Lysophospholipids are metabolic intermediates generated via the hydrolysis of membrane or lipoprotein-associated phospholipids by phospholipases. The profile of increase LPC and LPE species in response to iCR reflects the most abundant fatty acids in phospholipids (16:0, 18:0 18:1, 18:2, 20:4) and may result from fasting-dependent lipolysis of adipocyte phospholipids, in line with the reduced fat mass. It is unlikely to result from lipoprotein-associated phospholipase A2, since its activity is positively correlated with caloric intake.47 Recent work has shown that circulating LPCs are inversely associated with BMI,48 49 inflammatory markers including CRP49 50 and cardiovascular disease risk.49 Importantly, transport of polyunsaturated LPCs across the blood brain barrier is essential for brain development and myelin synthesis.51 52 iCR decreased levels of HexCer and LacCer compared with control groups, possibly associated to an overall reduction in sphingolipid synthesis leading to improved metabolic health, since these sphingolipids have been associated with increased cardiovascular risk in some,53 but not all studies.54 LacCer synthesis in astrocytes may promote neuroinflammation in EAE.55 Future studies should be performed to determine if iCR affects LacCer synthesis in the CNS.
This study revealed several beneficial effects of iCR in people with RRMS. Limitations of this study include its small patient numbers and short duration of 12 weeks. Even so, we observed significant effects on some objective laboratory variables within the 12 weeks. The low subject numbers could limit the power to detect small-moderate effects. The enrolled subjects were not blinded to the intervention, which could have influenced participant behaviour differently in the two study arms and thus impact the study outcomes. This intrinsic limitation was somewhat mitigated by blinded assessments of laboratory and clinical outcomes, including the primary outcome of leptin levels. Furthermore, diet adherence and behavioural changes (eg, overeating during non-fasting days in the iCR group and suggested increase in vegetable intake in the control group) could possibly influence the results. However, to mitigate these factors, weekly check-ups (by phone or email) with the dietician served to support the participant’s compliance with the intervention. The study enrolled only people with RRMS, and results will need validation in people with progressive disease.
In summary, CR has the potential to positively impact MS disease outcomes, but the rigorous study of diet interventions is difficult. This randomised study used quantitative and objective measures of changes in adipokines and other blood factors, along with subjective clinical measures, to assess effects of iCR in patients with MS. The objective beneficial results from the present study along with strong preclinical data supporting CR anti-inflammatory and neuroprotective effects provide strong rationale for continued study of iCR in MS. Larger and longer studies of CR and iCR in pwMS, including blinded imaging outcomes for all subjects, are warranted.
supplementary material
Acknowledgements
This work is dedicated to the memory of Dr. Jennifer Stark, who made significant contributions to the preclinical studies that were fundamental to the basis of this clinical trial. She was a dear friend and colleague, and she will continue to live in our hearts.
The authors thank the neurologists, MS fellows, and study coordinators at the John L. Trotter MS Center at Washington University School of Medicine for their assistance with patient enrolment, study assessments and other aspects of this study. Most importantly, the authors thank the people living with MS who participated and made this work possible.
Footnotes
Funding: This study was funded by the National MS Society (grant # RG-1607-25158 to LP and YZ). During this study, LP was also supported by Fondazione Italiana Sclerosi Multipla (FISM) (#2017/R/20). LG was supported during this study by a FISM fellowship (2018/B/1) and by the National Multiple Sclerosis (NMSS) Postdoctoral fellowship (FG1907-34474). CC was supported by the National Multiple Sclerosis Society (TA-1805-31003) and the Department of Defense (MS200066). LF was supported by the Bakewell Foundation during this study. Some of the assessments were supported by EU funding from FISM (no. 2018/S/5) to GM; the MUR PNRR Extended Partnership (INF-ACT no. PE00000007 and MNESYS no. PE00000006) to GM and PNRR-Salute (no. PNRR-MAD-2022-12375634) to GM; the National Recovery and Resilience Plan (NRRP), Mission 4, Component 2 (M4C2), Investment 1.1, Call for tender No. 104 published on 02/02/2022 by the Italian Ministry of University and Research (MUR), funded by the European Union –NextGenerationEU– Project Title: Role of Overweight and EBV Infection in the Pathogenesis of Multiple Sclerosis: Metabolic Overwork as Key Mechanism Leading to Loss of Immune-Tolerance (grant n. 2022LNHZAP) – CUP E53D23013240006 - Grant Assignment Decree No. 0001111 adopted on 20/07/2023 to GM; the NRRP, M4C2, Investment 1.1, Call for tender No. 104 published on 02/02/2022 by the Italian Ministry of University and Research (MUR), funded by the European Union –NextGenerationEU– Project Title: Regulatory T cell-mediated immunological nursing for direct cardiac reprogramming (IMMUNOCARD) (grant n. 20225KH7BZ) – CUP B53D23012500006 - Grant Assignment Decree No. 971 adopted on 30/06/23 to CLR. AHC was supported by the Manny & Rosalyn Rosenthal-Dr. John L. Trotter MS Center Chair in Neuroimmunology of Barnes-Jewish Hospital Foundation. CAR was supported by NIH/NIA RF1AG072637 (to CAR), R01AG070883, R01AG079241, 5P01AG003991, 5P01AG026276, W81XWH2210924.
Provenance and peer review: Not commissioned; externally peer reviewed.
Patient consent for publication: Consent obtained directly from patient(s).
Ethics approval: This study involves human participants. The study was approved by the Washington University Institutional Review Board (#201707010). Participants gave informed consent to participate in the study before taking part.
Correction notice: Since this paper first published, the author surname Rahmahi has been updated to read Rahmani.
Data availability statement
Data are available on reasonable request. All data relevant to the study are included in the article or uploaded as online supplemental information.
References
- 1.Hedström AK, Olsson T, Alfredsson L. High body mass index before age 20 is associated with increased risk for multiple sclerosis in both men and women. Mult Scler. 2012;18:1334–6. doi: 10.1177/1352458512436596. [DOI] [PubMed] [Google Scholar]
- 2.Langer-Gould A, Brara SM, Beaber BE, et al. Childhood obesity and risk of pediatric multiple sclerosis and clinically isolated syndrome. Neurology (ECronicon) 2013;80:548–52. doi: 10.1212/WNL.0b013e31828154f3. [DOI] [PMC free article] [PubMed] [Google Scholar]
- 3.Munger KL, Chitnis T, Ascherio A. Body size and risk of MS in two cohorts of US women. Neurology (ECronicon) 2009;73:1543–50. doi: 10.1212/WNL.0b013e3181c0d6e0. [DOI] [PMC free article] [PubMed] [Google Scholar]
- 4.Marrie RA, Cohen J, Stuve O, et al. A systematic review of the incidence and prevalence of comorbidity in multiple sclerosis: overview. Mult Scler. 2015;21:263–81. doi: 10.1177/1352458514564491. [DOI] [PMC free article] [PubMed] [Google Scholar]
- 5.Kawai T, Autieri MV, Scalia R. Adipose tissue inflammation and metabolic dysfunction in obesity. Am J Physiol Cell Physiol . 2021;320:C375–91. doi: 10.1152/ajpcell.00379.2020. [DOI] [PMC free article] [PubMed] [Google Scholar]
- 6.Fitzgerald KC, Tyry T, Salter A, et al. Diet quality is associated with disability and symptom severity in multiple sclerosis. Neurology (ECronicon) 2018;90:e1–11. doi: 10.1212/WNL.0000000000004768. [DOI] [PubMed] [Google Scholar]
- 7.Fitzgerald KC, Vizthum D, Henry-Barron B, et al. Effect of intermittent vs. daily calorie restriction on changes in weight and patient-reported outcomes in people with multiple sclerosis. Mult Scler Relat Disord. 2018;23:33–9. doi: 10.1016/j.msard.2018.05.002. [DOI] [PMC free article] [PubMed] [Google Scholar]
- 8.Cignarella F, Cantoni C, Ghezzi L, et al. Intermittent fasting confers protection in CNS autoimmunity by altering the gut microbiota. Cell Metab. 2018;27:1222–35. doi: 10.1016/j.cmet.2018.05.006. [DOI] [PMC free article] [PubMed] [Google Scholar]
- 9.Piccio L, Stark JL, Cross AH. Chronic calorie restriction attenuates experimental autoimmune encephalomyelitis. J Leukoc Biol. 2008;84:940–8. doi: 10.1189/jlb.0208133. [DOI] [PMC free article] [PubMed] [Google Scholar]
- 10.Fontana L, Ghezzi L, Cross AH, et al. Effects of dietary restriction on neuroinflammation in neurodegenerative diseases. J Exp Med. 2021;218:e20190086. doi: 10.1084/jem.20190086. [DOI] [PMC free article] [PubMed] [Google Scholar]
- 11.Choi IY, Piccio L, Childress P, et al. A diet mimicking fasting promotes regeneration and reduces autoimmunity and multiple sclerosis symptoms. Cell Rep. 2016;15:2136–46. doi: 10.1016/j.celrep.2016.05.009. [DOI] [PMC free article] [PubMed] [Google Scholar]
- 12.Matarese G, Carrieri PB, Montella S, et al. Leptin as a metabolic link to multiple sclerosis. Nat Rev Neurol. 2010;6:455–61. doi: 10.1038/nrneurol.2010.89. [DOI] [PubMed] [Google Scholar]
- 13.Polman CH, Reingold SC, Banwell B, et al. Diagnostic criteria for multiple sclerosis: 2010 revisions to the McDonald criteria. Ann Neurol. 2011;69:292–302. doi: 10.1002/ana.22366. [DOI] [PMC free article] [PubMed] [Google Scholar]
- 14.Kurtzke JF. Rating neurologic impairment in multiple sclerosis: an expanded disability status scale (EDSS) Neurology (ECronicon) 1983;33:1444–52. doi: 10.1212/wnl.33.11.1444. [DOI] [PubMed] [Google Scholar]
- 15.Sallis JF, Haskell WL, Wood PD, et al. Physical activity assessment methodology in the five-city project. Am J Epidemiol. 1985;121:91–106. doi: 10.1093/oxfordjournals.aje.a113987. [DOI] [PubMed] [Google Scholar]
- 16.Krebs-Smith SM, Pannucci TE, Subar AF, et al. Update of the healthy eating index: HEI-2015. J Acad Nutr Diet. 2018;118:1591–602. doi: 10.1016/j.jand.2018.05.021. [DOI] [PMC free article] [PubMed] [Google Scholar]
- 17.De Rosa V, Procaccini C, Calì G, et al. A key role of leptin in the control of regulatory T cell proliferation. Immunity. 2007;26:241–55. doi: 10.1016/j.immuni.2007.01.011. [DOI] [PubMed] [Google Scholar]
- 18.Palma C, La Rocca C, Gigantino V, et al. Caloric restriction promotes immunometabolic reprogramming leading to protection from tuberculosis. Cell Metab. 2021;33:300–18. doi: 10.1016/j.cmet.2020.12.016. [DOI] [PubMed] [Google Scholar]
- 19.Marian OC, Teo JD, Lee JY, et al. Disrupted myelin lipid metabolism differentiates frontotemporal dementia caused by GRN and C9Orf72 gene mutations. Acta Neuropathol Commun. 2023;11:52. doi: 10.1186/s40478-023-01544-7. [DOI] [PMC free article] [PubMed] [Google Scholar]
- 20.Lee JY, Harney D, Kwok J, et al. The major TMEM106B dementia risk allele affects TMEM106B protein levels and myelin lipid homeostasis in the ageing human hippocampus. Res Sq . 2023:rs.3.rs-2392941. doi: 10.21203/rs.3.rs-2392941/v1. [DOI] [PMC free article] [PubMed] [Google Scholar]
- 21.Goldman MD, Motl RW, Rudick RA. Possible clinical outcome measures for clinical trials in patients with multiple sclerosis. Ther Adv Neurol Disord. 2010;3:229–39. doi: 10.1177/1756285610374117. [DOI] [PMC free article] [PubMed] [Google Scholar]
- 22.Hobart J, Lamping D, Fitzpatrick R, et al. The multiple sclerosis impact scale (MSIS-29): a new patient-based outcome measure. Brain (Bacau) 2001;124:962–73. doi: 10.1093/brain/124.5.962. [DOI] [PubMed] [Google Scholar]
- 23.Fischer JS, LaRocca NG, Miller DM, et al. Recent developments in the assessment of quality of life in multiple sclerosis (MS) Mult Scler. 1999;5:251–9. doi: 10.1177/135245859900500410. [DOI] [PubMed] [Google Scholar]
- 24.Cluxton D, Petrasca A, Moran B, et al. Differential regulation of human Treg and Th17 cells by fatty acid synthesis and glycolysis. Front Immunol. 2019;10:115. doi: 10.3389/fimmu.2019.00115. [DOI] [PMC free article] [PubMed] [Google Scholar]
- 25.De Rosa V, Galgani M, Porcellini A, et al. Glycolysis controls the induction of human regulatory T cells by modulating the expression of FOXP3 Exon 2 splicing variants. Nat Immunol. 2015;16:1174–84. doi: 10.1038/ni.3269. [DOI] [PMC free article] [PubMed] [Google Scholar]
- 26.Pinzon Grimaldos A, Bini S, Pacella I, et al. The role of lipid metabolism in shaping the expansion and the function of regulatory T cells. Clin Exp Immunol. 2022;208:181–92. doi: 10.1093/cei/uxab033. [DOI] [PMC free article] [PubMed] [Google Scholar]
- 27.de Candia P, Prattichizzo F, Garavelli S, et al. The pleiotropic roles of leptin in metabolism, immunity, and cancer. J Exp Med. 2021;218:e20191593. doi: 10.1084/jem.20191593. [DOI] [PMC free article] [PubMed] [Google Scholar]
- 28.Carbone F, La Rocca C, Matarese G. Immunological functions of leptin and adiponectin. Biochimie. 2012;94:2082–8. doi: 10.1016/j.biochi.2012.05.018. [DOI] [PubMed] [Google Scholar]
- 29.Sanna V, Di Giacomo A, La Cava A, et al. Leptin surge precedes onset of autoimmune encephalomyelitis and correlates with development of pathogenic T cell responses. J Clin Invest. 2003;111:241–50. doi: 10.1172/JCI16721. [DOI] [PMC free article] [PubMed] [Google Scholar]
- 30.Matarese G, Di Giacomo A, Sanna V, et al. Requirement for leptin in the induction and progression of autoimmune encephalomyelitis. J Immunol. 2001;166:5909–16. doi: 10.4049/jimmunol.166.10.5909. [DOI] [PubMed] [Google Scholar]
- 31.Biström M, Hultdin J, Andersen O, et al. Leptin levels are associated with multiple sclerosis risk. Mult Scler. 2021;27:19–27. doi: 10.1177/1352458520905033. [DOI] [PubMed] [Google Scholar]
- 32.Matarese G, Carrieri PB, La Cava A, et al. Leptin increase in multiple sclerosis associates with reduced number of CD4(+)CD25+ regulatory T cells. Proc Natl Acad Sci U S A. 2005;102:5150–5. doi: 10.1073/pnas.0408995102. [DOI] [PMC free article] [PubMed] [Google Scholar]
- 33.Piccio L, Cantoni C, Henderson JG, et al. Lack of adiponectin leads to increased lymphocyte activation and increased disease severity in a mouse model of multiple sclerosis. Eur J Immunol. 2013;43:2089–100. doi: 10.1002/eji.201242836. [DOI] [PMC free article] [PubMed] [Google Scholar]
- 34.Correale J, Marrodan M. Multiple sclerosis and obesity: the role of adipokines. Front Immunol. 2022;13:1038393. doi: 10.3389/fimmu.2022.1038393. [DOI] [PMC free article] [PubMed] [Google Scholar]
- 35.Roman SN, Fitzgerald KC, Beier M, et al. Safety and feasibility of various fasting-mimicking diets among people with multiple sclerosis. Mult Scler Relat Disord. 2020;42:102149. doi: 10.1016/j.msard.2020.102149. [DOI] [PubMed] [Google Scholar]
- 36.Russell RD, Black LJ, Sherriff JL, et al. Dietary responses to a multiple sclerosis diagnosis: a qualitative study. Eur J Clin Nutr. 2019;73:601–8. doi: 10.1038/s41430-018-0252-5. [DOI] [PubMed] [Google Scholar]
- 37.Evans E, Levasseur V, Cross AH, et al. An overview of the current state of evidence for the role of specific diets in multiple sclerosis. Mult Scler Relat Disord. 2019;36:101393. doi: 10.1016/j.msard.2019.101393. [DOI] [PubMed] [Google Scholar]
- 38.Snetselaar LG, Cheek JJ, Fox SS, et al. Efficacy of diet on fatigue and quality of life in multiple sclerosis: a systematic review and network meta-analysis of randomized trials. Neurology (ECronicon) 2023;100:e357–66. doi: 10.1212/WNL.0000000000201371. [DOI] [PMC free article] [PubMed] [Google Scholar]
- 39.Katz Sand I, Levy S, Fitzgerald K, et al. Mediterranean diet is linked to less objective disability in multiple sclerosis. Mult Scler. 2023;29:248–60. doi: 10.1177/13524585221127414. [DOI] [PMC free article] [PubMed] [Google Scholar]
- 40.Lutfullin I, Eveslage M, Bittner S, et al. Association of obesity with disease outcome in multiple sclerosis. J Neurol Neurosurg Psychiatry . 2023;94:57–61. doi: 10.1136/jnnp-2022-329685. [DOI] [PMC free article] [PubMed] [Google Scholar]
- 41.Yadav V, Marracci G, Kim E, et al. Low-fat, plant-based diet in multiple sclerosis: a randomized controlled trial. Mult Scler Relat Disord. 2016;9:80–90. doi: 10.1016/j.msard.2016.07.001. [DOI] [PubMed] [Google Scholar]
- 42.Contreras NA, Fontana L, Tosti V, et al. Calorie restriction induces reversible lymphopenia and lymphoid organ atrophy due to cell redistribution. Geroscience. 2018;40:279–91. doi: 10.1007/s11357-018-0022-2. [DOI] [PMC free article] [PubMed] [Google Scholar]
- 43.Meydani SN, Das SK, Pieper CF, et al. Long-term moderate calorie restriction inhibits inflammation without impairing cell-mediated immunity: a randomized controlled trial in non-obese humans. Aging (Milano) 2016;8:1416–31. doi: 10.18632/aging.100994. [DOI] [PMC free article] [PubMed] [Google Scholar]
- 44.Fitzgerald KC, Bhargava P, Smith MD, et al. Intermittent calorie restriction alters T cell subsets and metabolic markers in people with multiple sclerosis. EBioMedicine. 2022;82:104124. doi: 10.1016/j.ebiom.2022.104124. [DOI] [PMC free article] [PubMed] [Google Scholar]
- 45.de Candia P, Procaccini C, Russo C, et al. Regulatory T cells as metabolic sensors. Immunity. 2022;55:1981–92. doi: 10.1016/j.immuni.2022.10.006. [DOI] [PubMed] [Google Scholar]
- 46.Marrie RA, Fisk JD, Fitzgerald K, et al. Etiology, effects and management of comorbidities in multiple sclerosis: recent advances. Front Immunol. 2023;14:1197195. doi: 10.3389/fimmu.2023.1197195. [DOI] [PMC free article] [PubMed] [Google Scholar]
- 47.Ntzouvani A, Giannopoulou E, Fragopoulou E, et al. Energy intake and plasma adiponectin as potential determinants of lipoprotein-associated phospholipase A(2) activity: a cross-sectional study. Lipids. 2019;54:629–40. doi: 10.1002/lipd.12191. [DOI] [PubMed] [Google Scholar]
- 48.Knuplez E, Marsche G. An updated review of pro- and anti-inflammatory properties of plasma lysophosphatidylcholines in the vascular system. Int J Mol Sci. 2020;21:4501. doi: 10.3390/ijms21124501. [DOI] [PMC free article] [PubMed] [Google Scholar]
- 49.Ganna A, Salihovic S, Sundström J, et al. Large-scale metabolomic profiling identifies novel biomarkers for incident coronary heart disease. PLoS Genet. 2014;10:e1004801. doi: 10.1371/journal.pgen.1004801. [DOI] [PMC free article] [PubMed] [Google Scholar]
- 50.Taylor LA, Arends J, Hodina AK, et al. Plasma Lyso-Phosphatidylcholine concentration is decreased in cancer patients with weight loss and activated inflammatory status. Lipids Health Dis. 2007;6:17. doi: 10.1186/1476-511X-6-17. [DOI] [PMC free article] [PubMed] [Google Scholar]
- 51.Nguyen LN, Ma D, Shui G, et al. Mfsd2A is a transporter for the essential Omega-3 fatty acid Docosahexaenoic acid. Nature New Biol. 2014;509:503–6. doi: 10.1038/nature13241. [DOI] [PubMed] [Google Scholar]
- 52.Sengottuvel V, Hota M, Oh J, et al. Deficiency in the omega-3 lysolipid transporter Mfsd2A leads to aberrant oligodendrocyte lineage development and hypomyelination. J Clin Invest. 2023;133:e164118. doi: 10.1172/JCI164118. [DOI] [PMC free article] [PubMed] [Google Scholar]
- 53.Alshehry ZH, Mundra PA, Barlow CK, et al. Plasma lipidomic profiles improve on traditional risk factors for the prediction of cardiovascular events in type 2 diabetes mellitus. Circulation. 2016;134:1637–50. doi: 10.1161/CIRCULATIONAHA.116.023233. [DOI] [PubMed] [Google Scholar]
- 54.Chew WS, Torta F, Ji S, et al. Large-scale lipidomics identifies associations between plasma sphingolipids and T2Dm incidence. JCI Insight. 2019;5:e126925. doi: 10.1172/jci.insight.126925. [DOI] [PMC free article] [PubMed] [Google Scholar]
- 55.Mayo L, Trauger SA, Blain M, et al. Regulation of astrocyte activation by glycolipids drives chronic CNS inflammation. Nat Med. 2014;20:1147–56. doi: 10.1038/nm.3681. [DOI] [PMC free article] [PubMed] [Google Scholar]
Associated Data
This section collects any data citations, data availability statements, or supplementary materials included in this article.
Supplementary Materials
Data Availability Statement
Data are available on reasonable request. All data relevant to the study are included in the article or uploaded as online supplemental information.