

Abstract
Background.
Prenatal alcohol exposure (PAE) impairs offspring growth and cognition, and this is worsened by concurrent iron deficiency. Alcohol disrupts fetal iron metabolism and produces functional iron deficiency, even when maternal iron status is adequate. We used a mouse model of moderate PAE to investigate the mechanisms underlying this dysregulated iron status.
Methods.
C57BL/6J female mice received 3g/kg alcohol daily from embryonic day (E)8.5–17.5 and were assessed at E17.5.
Results.
Alcohol reduced fetal hemoglobin, hematocrit, and red blood cell counts, despite elevated erythropoietin production. Alcohol suppressed maternal hepcidin expression and the upstream iron-sensing BMP/SMAD pathway, consistent with its effects in the non-pregnant state. In contrast, alcohol elevated fetal hepcidin, although this was not accompanied by an upregulation of the BMP/SMAD or proinflammatory IL6/STAT3 pathways. Fetal expression of hepatic genes contributing to hemoglobin synthesis and iron metabolism were unaffected by alcohol, whereas those affecting ribosome biogenesis were suppressed, suggesting a novel candidate effector for this fetal anemia.
Conclusion.
These data confirm and extend prior observations that PAE disrupts maternal and fetal iron metabolism and impairs the fetus’s ability to regulate iron status. We propose this dysregulation increases gestational iron needs and represents a conserved response to PAE.
INTRODUCTION
Prenatal alcohol exposure (PAE) can cause persistent cognitive and behavioral deficits in the offspring, often accompanied by physical impairments, and collectively known as Fetal Alcohol Spectrum Disorders (FASD).1 Alcohol disrupts many processes needed for healthy fetal development including maternal nutrient metabolism and utilization, and this produces maternal and fetal nutrient insufficiencies including the essential mineral iron.2 Preclinical studies find that PAE disrupts prenatal iron status and produces a functional iron deficiency anemia in the fetus, even when the mothers consume sufficient iron.3,4 This was corroborated clinically, and PAE is associated with an iron-related blood profile that indicates a prioritization of iron storage over erythropoiesis in both mothers and neonates, and indicative of a functional iron deficiency.5 Iron itself is essential for numerous neurodevelopmental processes including energy generation, myelination, synaptogenesis, and neurotransmission.6 Functional iron deficiency during pregnancy impairs these processes to alter neonatal brain structure and function and worsen infant cognition, even when iron is replenished postnatally.6 Moreover, it limits the late-term transfer of maternal iron that that provides the offspring with its crucial iron endowment necessary for early postnatal life, and this further worsens neurodevelopment.6
Preclinical and clinical studies suggest PAE may cause a functional iron deficiency by dysregulating hepcidin. Hepcidin, a peptide hormone produced in the liver, is the main regulator of iron status.7 Free iron’s prooxidant nature necessitates tight control of its distribution, storage, and utilization.7 When iron levels rise, hepcidin routes iron to storage, limits its dietary absorption, and promotes its fecal excretion; when iron levels fall, diminished hepcidin facilitates iron absorption and its release from stores for tissue use. In nonpregnant adults, alcohol suppresses hepcidin production and can lead to iron overload.8–11 In contrast, despite the high iron demand of pregnancy, alcohol is associated with elevated hepcidin. In preclinical models of PAE, alcohol elevates maternal and fetal hepcidin expression by 200%,3 and this elevated hepcidin correlates with elevated fetal hepatic iron stores and decreased fetal brain iron.4 Clinical investigations show elevations in maternal hepcidin levels that positively correlate with the frequency of prenatal drinking and inversely correlate with infant hemoglobin at 6.5 months old.5 Together, these studies suggest that PAE’s influence on hepcidin may partly contribute to the offspring’s functional iron deficiency.
Hepcidin’s regulation of iron status is modulated by multiple factors and stressors including circulating iron levels, hepatic iron stores, inflammation, erythropoiesis, hypoxia, endoplasmic reticulum (ER) stress, and pregnancy itself.12 Iron status regulates hepcidin production by signaling through bone morphogenetic proteins-2 and -6 (BMP2, BMP6), hemojuvelin (HJV), matriptase, and mothers against decapentaplegic (SMAD) to stimulate hepcidin transcription and limit iron uptake and availability. Inflammation also promotes hepcidin production through interleukin-6 (IL-6), Janus kinase-2 (JAK2), and signal transducer and activator of transcription-3 (STAT3) to cause the anemia of inflammation; this is further modulated by suppressor of cytokine signaling-3 (SOCS3), which functions as a negative regulator of cytokine signaling.7,12–16 Interplay between these regulatory pathways enables stronger signals from one to override the other’s actions and further modulate hepcidin expression.17 An understanding of how alcohol dysregulates hepcidin is crucial in developing approaches to normalize fetal iron status in alcohol-exposed pregnancies. Alcohol is proinflammatory, and our prior work in a rat model of PAE implicated this pathway, specifically elevations in IL-6 and STAT3, as candidate effectors in PAE.18 However, this mechanism may not be solely responsible for this dysregulation. Here, we investigate the basis for this functional iron deficiency in an established mouse model of moderate PAE that shares similarities with the clinical diagnostic of Alcohol-Related Neurodevelopmental Disorders (ARND) under the FASD umbrella term.1 These features include mild cognitive deficits that affect associative learning, notably in cue-associated fear-conditioning, and modest yet consistent reductions in fetal body and brain weight.19–23 We report that this lower alcohol exposure dysregulates hepcidin and causes a modest fetal anemia that is not wholly consistent with a functional iron deficiency.
MATERIALS AND METHODS
Generation of animals
Studies used our established mouse model of PAE.19,20 Nulliparous, female C57BL/6J mice (Jackson Laboratories, Bar Harbor, ME) arrived at 5 weeks old and consumed the fixed-nutrient diet AIN-93G (TD.94045, Envigo-Teklad, Madison, WI), which contains 35ppm of iron and is considered iron-adequate.24 At 8–9 weeks old, females were mated overnight with C57BL/6J males. We designated the morning of plug detection as embryonic day (E) 0.5, after which mice were co-housed with those sharing the same plug date. After randomization to the alcohol (ALC; N=9) or control (CON; N=9) group, pregnant females received daily oral gavages from E8.5–17.5. The ALC group received 3g/kg ethanol (38% ethanol in drinking water; 200 proof, USP grade; Decon Labs, King of Prussia, PA), while the CON group received isocaloric maltodextrin (52.6% maltodextrin in drinking water; LoDex-10; #160175, Envigo-Teklad, Madison, WI). This model generates blood alcohol concentrations of 211 ± 14 mg/dl at 30 minutes post-gavage.19 On E17.5, 4 hours following the last dose, we euthanized the pregnant mice and collected maternal blood by cardiac puncture and fetal blood by decapitation and capillary collection; we pooled fetal blood across the litter. Maternal and fetal tissues were flash-frozen in liquid nitrogen. The Animal Care and Use Committee of the David H. Murdoch Research Institute approved all experiments, which were conducted in accordance with the Guide for the Care and Use of Laboratory Animals.
Hematology and iron analysis
Within 3 hours of collection, we used a pocH-100i hematology analyzer (Sysmex, Lincolnshire, IL) to measure the complete blood counts of maternal and fetal whole blood samples, according to the manufacturer’s instructions. To quantify zinc protoporphyrin (ZnPP), red blood cells (RBC) were washed several times in phosphate-buffered saline and were resuspended in ProtoFluor Reagent. We quantified ZnPP in triplicate using the ProtoFluor Z instrument (Helena Laboratories, Beaumont, TX) per manufacturer instructions.
Mineral content of the fetal brain, including total iron, was quantified using inductively coupled plasma atomic emission spectroscopy (Children’s Hospital Oakland Research Institute, Oakland, CA). Results are presented as μg element per g sample dry tissue weight. Two brains per litter were pooled for analysis.
Gene expression
We used quantitative PCR (qPCR) to measure gene expression in fetal liver, maternal liver, maternal kidney, and placenta, sampling maternal tissue as individual animals and fetal tissues as a pooled pair. We followed the Minimum Information for Publication of Quantitative Real-Time Experiments guidelines,25 and performed RNA isolation, cDNA synthesis, primer design, and qPCR using established protocols, sampling tissues in triplicate.18,26 Primer sequences are in Supplemental Table S1. We used the 2−ΔΔCT method to calculate relative gene expression.27
Whole transcriptome sequencing was performed as described28,29 on a separate group of mice generated as above, testing 9 maternal livers and 9 pooled fetal livers (n=4 per litter) per group. RNA was isolated using Trizol, according to the manufacturer’s instructions. We quantified RNA using the DS-11 Spectrophotometer (DeNovix, Wilmington, DE) and assessed RNA quality using the Agilent RNA 6000 Nano Kit (Agilent Technologies, Santa Clara, CA) and an Agilent 2100 Bioanalyzer (Agilent Technologies). All samples had RNA integrity numbers >8.0. Barcoded libraries were created for the fetal and maternal liver samples using a KAPA Stranded RNA Kit (Roche, Basel, Switzerland). Each library was sequenced as 50-bp paired-end reads using the HiSeq4000 (Illumina, San Diego, CA). cDNA synthesis and high-throughput sequencing were performed at the University of North Carolina- Chapel Hill High Throughput Sequencing Facility. For fetal liver, the total depth of sequence reads was >3.1 × 10⁷/library (average 4.2 × 10⁷/library) with mean quality scores >30 (average 38). For maternal liver, the sequence read depth was >3.5 × 10⁷/library (average 4.6 × 10⁷/library) with mean quality scores >30 (average 38). We assessed transcriptome read quality using FastQC and aligned reads to the mouse genome (mm10) using Bowtie2.30,31 We generated gene alignment counts using featureCounts, and performed differential gene expression analyses, including normalization and statistical analysis, using the DESeq2 package in R v3.6.0.32,33 P-values were adjusted for the false discovery rate using the Benjamini-Hochberg (BH) correction and are the values reported herein. P<0.05 was considered significant. Code used for data analysis is stored at https://github.com/kayleehelfrich/RNAseqData.
Western blot analysis
We used our established protocol18 except we normalized results to total protein per lane as quantified using REVERT™ Total Protein Stain (LiCor, Lincoln, NE). Primary antibodies were directed against SMAD5 (1:1000, D4G2), phospho-(p)SMAD1/5 (1:1000, 41D10; both from Cell Signaling Technology, Danvers, MA), STAT3 (1:2000, 60199–1, Proteintech, Rosemont, IL), and pSTAT3 (1:2000, ab76315, Abcam, Cambridge, UK), and were detected using horseradish peroxidase-conjugated secondary antibodies and chemiluminescence using the Radiance Q detection system (Azure Biosystems, Dublin, CA).
Statistical analysis
Because all litter sizes generated in this study were within 1 standard deviation (SD) from the mean litter size, none were excluded from analysis. We checked data for normality (Shapiro-Wilk Test) and equal variance (Bartlett’s test). If data were non-normal or had unequal variance, we used the Wilcoxon rank sum test with continuity correction. If the data were normal and had equal variance, we used Welch’s Two Sample t-test. We excluded outliers if they failed the 1.5xIQR test, such that data points were considered outliers if they were more than 1.5 times the interquartile range above the third data quartile or below the first data quartile, and these instances are indicated in the figure legends. To measure the association between two continuous variables, we used Pearson’s correlation coefficient. We analyzed data using R v.3.6.0. Data are mean ± standard error of the mean (SEM) unless noted otherwise. Groups were considered statistically different at P < 0.05 and trends at P < 0.1.
RESULTS
Gestational parameters and prenatal iron status
Gestational parameters for this study were reported elsewhere19–22 and are presented in Supplemental Table S2. Alcohol had no effect on maternal weight on E0.5 (P=0.71) or E8.5 (P=0.88), maternal weight gain during gestation (P=0.52), maternal food intake during dosing (P=0.15), litter size (P=0.85), fetal weight (P=0.31), or fetal survival (P=0.69).
In maternal blood (Table 1), alcohol reduced hemoglobin (−8%, P=0.035) and was associated with a non-significant decline in hematocrit (−6%, P=0.094). Alcohol did not alter other hematological measures in the mother. In contrast, the alcohol-exposed fetus exhibited multiple hematological deficits including reduced fetal red blood cell counts (RBCs; −12%, P=0.027) and hematocrit (−10%, P=0.030), and a non-significant reduction in hemoglobin (−10%, P=0.063); other fetal hematology measures were unaffected (Table 1). These data indicate that alcohol caused a mild fetal anemia that was accompanied by a mild decline in maternal hemoglobin.
Table 1:
Alcohol exposure alters maternal and fetal hematological indices. a
| Maternal | Fetal | |||||
|---|---|---|---|---|---|---|
|
| ||||||
| CON c | ALC | P value | CON | ALC | P value | |
|
| ||||||
| RBC (x106 cells/μL) | 9.24 ± 0.61 | 8.80 ± 0.51 | 0.106 | 3.08 ± 0.28 | 2.72 ± 0.34 | 0.027 b |
| Hemoglobin (g/dL) | 14.4 ± 1.1 | 13.3 ± 0.8 | 0.035 b | 10.4 ± 1.1 | 9.4 ± 1.1 | 0.063 |
| Hematocrit (%) | 47.1 ± 3.8 | 44.2 ± 2.6 | 0.094 | 39.3 ± 3.5 | 35.3 ± 3.6 | 0.030 b |
| MCV (fL/cell) | 50.9 ± 2.0 | 50.2 ± 1.0 | 0.595 | 127.7 ± 4.0 | 130.3 ± 3.7 | 0.175 |
| MCH (pg/cell) | 15.5 ± 0.7 | 15.2 ± 0.3 | 0.459 | 33.8 ± 1.2 | 34.5 ± 1.1 | 0.187 |
| MCHC (pg/dL) | 30.6 ± 0.4 | 30.2 ± 0.5 | 0.143 | 26.5 ± 0.6 | 26.5 ± 0.6 | 0.904 |
| Platelets (x103 cells/μL) | 437 ± 320 | 547 ± 601 | 0.875 | 85 ± 15.4 | 75.7 ± 23.1 | 0.330 |
| ZnPP (μmol ZnPP/mol heme) | 132 ± 11 | 125 ± 10 | 0.175 | 408.1 ± 46.0 | 407.5 ± 58.0 | 0.981 |
Values are mean ± SD. n = 9 (ALC) or 10 (CON) dams or litters per group. Fetal values are the pooled blood of all fetuses in the litter. Normally distributed data were analyzed using Welch’s Two Sample t-test; data not normally distributed (maternal hematocrit, MCV, MCH; fetal MCHC and platelets) were subjected to the Wilcoxon rank sum test. ALC, alcohol exposed; CON, control; MCH, mean corpuscular hemoglobin; MCHC, mean corpuscular hemoglobin concentration; MCV, mean corpuscular volume; RBC, red blood cell count; ZnPP, zinc protoporphyrin.
Bolded P-values are significant at P<0.05.
Erythropoietin (EPO) stimulates erythropoiesis in response to hypoxia.34 EPO is produced in the fetal liver until at or near birth, at which point production switches to the kidney.34 Alcohol increased Epo expression in the maternal kidney (+159%, P=0.002; Figure 1A) and in the fetal liver (+61%, P=0.032; Figure 1B), although to a lesser degree in the fetus. Maternal and fetal Epo expression were modestly and positively correlated, with a Pearson’s coefficient of 0.64 (P=0.004; Figure 1C). This relationship was driven primarily by ALC pregnancies, wherein alcohol-exposed mothers with elevated Epo also had fetuses with elevated Epo.
Figure 1: Alcohol exposure increased maternal and fetal erythropoietin (Epo) expression.
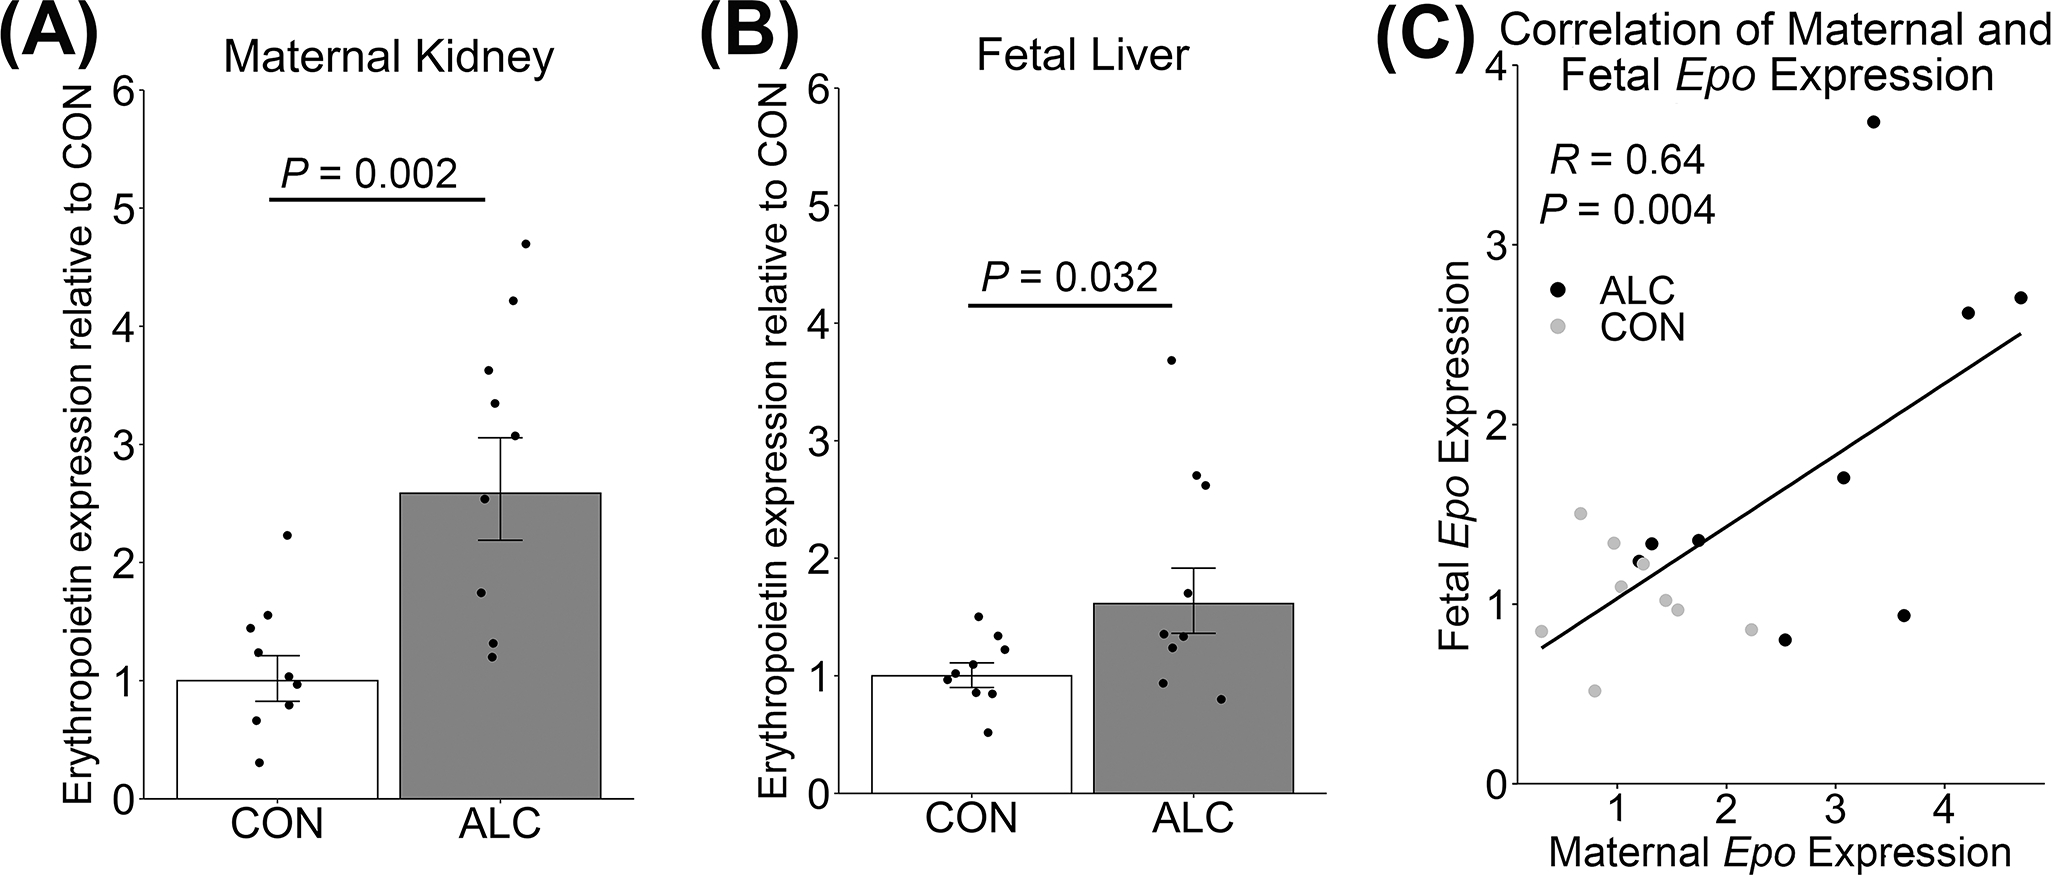
Epo expression in (A) maternal kidney and (B) pooled fetal liver, and (C) the correlation of the within-litter Epo content of the mother and her pooled fetuses. Values are mean ± SEM, points are individual values. n = 9 per group. Welch’s Two Sample t-test was used to test for significance. Pearson’s correlation was used to test for significance of the correlation. ALC, alcohol exposed; CON, control.
When fetal iron is limiting, it is prioritized to the erythron over other tissues including the brain.6 With respect to fetal brain, there was no difference in total brain iron content (CON: 109 ± 9 μg iron/g brain weight, ALC: 122 ± 24 μg iron/g brain weight, P=0.186; Supplemental Table S3), nor in the content of other minerals (calcium, copper, magnesium, nickel, phosphorus, silicon, and zinc).
Prenatal hepcidin
Gestational alcohol exposure increases maternal and fetal hepcidin in humans and a rat model of PAE,3,5 and has been posited to contribute to the alcohol-induced neonatal and fetal anemia observed in both. In this mouse PAE model, alcohol trended instead to reduce maternal hepcidin (−45%, P=0.055; Figure 2A), consistent with its actions under non-pregnancy conditions in both humans and rodent models,8,10 but different from findings in pregnant humans and rats, in which it induced by alcohol.3,5 To investigate the potential basis for this difference in these dams, we modulated the model’s characteristics to more closely mirror those of our rat PAE model; this included increasing the alcohol dose (4.5 vs 3.0 g/kg) and dietary iron content (100 vs 36 ppm), and delaying the tissue collection after the final alcohol dose (24 vs 4 hr). Across these variables maternal hepcidin expression was still decreased, suggesting this difference was intrinsic to mouse (Supplemental Figure S1A–C). With respect to the fetus, PAE induced hepatic hepcidin (+191%, P=0.010; Figure 2B) and consistent with its action in fetal rat.3 Fetal hepcidin remained similarly elevated across these mouse model variants (Supplemental Figure S1D–F). The placenta also produces hepcidin and this can be altered in some disease states;35,36 however, alcohol did not affect placental hepcidin expression in this model (P=0.241; Figure 2C).
Figure 2: Alcohol exposure trended to reduce hepcidin in the mother and increased hepcidin in the fetus.

Hepcidin expression in (A) maternal liver, (B) pooled fetal liver, and (C) placenta. Values are mean ± SEM, points are individual values. n = 9 per group. For fetal liver hepcidin, 1 CON sample was excluded as a statistical outlier. Welch’s Two Sample t-test was used to test for significance. ALC, alcohol-exposed; CON, control.
Regulation of hepcidin by inflammation
We previously identified the JAK/STAT3 pathway and, more broadly, inflammation as a candidate inducer of hepcidin in our rat PAE model.18 In maternal mouse liver, proinflammatory cytokine expression was either unchanged (Il1β: P=0.819, Il6: P=0.220) or reduced (Tnfα: P=0.034) by alcohol (Figure 3A). Alcohol did not affect the expression of the anti-inflammatory cytokine Il10 (P=0.142) or Socs3 (P=0.210; Figure 3E). Alcohol also did not significantly alter the hepatic protein content of the downstream effectors of this pathway, pSTAT3, STAT3, and their ratio (Figure 3B). With respect to fetal liver, Il1β expression trended to increase (P=0.051) whereas Il6 was unchanged, (P=0.553) and Tnfα was reduced (P=0.005) by PAE (Figure 3C). Fetal Il10 expression was below the limit of detection, and PAE did not affect Socs3 expression (Figure 3E) or the hepatic protein content of pSTAT3, STAT3, or their ratio (Figure 3D). Thus, in this mouse model, alcohol exposure caused modest hepatic cytokine changes and did not upregulate the IL6/JAK/STAT pathway that modulates hepcidin expression.
Figure 3: Alcohol exposure did not create a proinflammatory environment or alter indicators of the IL6/JAK/STAT3 pathway.

Expression of Il1β, Il6, and Tnfα in (A) maternal and (C) fetal liver. pSTAT3, STAT3, and their ratio in (B) maternal and (D) fetal liver. (E) Expression of other genes in the pathway from whole transcriptome sequencing. Values are mean ± SEM, points are individual values. n = 7–9 dams or litters per group, with 2 fetal livers/litter for pSTAT3 and STAT3. For maternal liver Il1β, Il6, and Tnfα, 1–2 CON samples were excluded as statistical outliers. Normally distributed data were analyzed using Welch’s Two Sample t-test (maternal Il1β, Il6, STAT3, pSTAT; fetal Il1β, Il6, and Tnfα) and the rest using the Wilcoxon rank sum test. ALC, alcohol-exposed; CON, control. NA, not available, below detection limit.
Regulation of hepcidin by iron status
Because alcohol caused fetal anemia and upregulated maternal and fetal Epo, we next investigated alcohol’s impact upon the iron-sensing BMP/SMAD hepcidin regulatory pathway. Alcohol reduced Bmp6 expression in maternal liver (−61%, P<0.001; Figure 4A), consistent with the Bmp6 response during iron deficiency.37 Alcohol also reduced Bmp2 expression in the maternal liver (−37%, P=0.004; Figure 4E). Alcohol also significantly reduced the downstream BMP6 and BMP2 effectors, pSMAD1/5 (P=0.002) and total SMAD5 (P=0.033; Figure 4B) but did not affect the pSMAD/SMAD ratio. Alcohol did not affect the expression of other components in this pathway including hemojuvelin (Hjv) and matriptase (Tmprss6) (Figure 4E). The downregulation of this pathway in the alcohol-treated dams was consistent with their downregulated maternal hepcidin.
Figure 4: Alcohol exposure reduced activity of the maternal BMP6/SMAD pathway and minimally affected the fetal BMP6/SMAD pathway.

Expression of Bmp6 in (A) maternal and (C) fetal liver. pSMAD1/5, SMAD5, and their ratio in (B) maternal and (D) fetal liver. (E) Expression of iron-related genes. Values are mean ± SEM, points are individual values. n = 7–9 dams or litters per group, with 2 fetal livers/litter for pSMAD1/5 and SMAD5 data. For fetal liver Bmp6, 2 CON samples were excluded as statistical outliers. Normally distributed data were analyzed using Welch’s Two Sample t-test (maternal SMAD5, pSMAD; fetal Bmp6, SMAD5) and the remainder using Wilcoxon rank sum test. ALC, alcohol exposed; CON, control.
In the fetus, PAE reduced hepatic Bmp6 expression, although to a lesser degree than in the mother (−24%, P=0.035; Figure 4C). PAE did not affect fetal hepatic Bmp2 expression or the expression of Hjv or Tmprss6 (Figure 4E). It also did not affect total pSMAD1/5 (P=0.872; Figure 4D) or SMAD5 (P=0.126) protein content, or the pSMAD/SMAD ratio (P=0.982). Because BMP/SMAD pathway activity would need to increase to explain the elevated fetal hepcidin, this pathway is unlikely to be responsible.
Fetal hepcidin regulation
To identify other candidate effectors that might contribute to the upregulated fetal hepcidin, we analyzed our transcriptomic data set to assess the relative abundance of fetal liver genes involved in hemoglobin synthesis, iron regulation, and hepcidin regulation. Consistent with the qPCR results, PAE increased both Hamp (P=0.007) and Epo (P=0.002) expression (Supplemental Table S3). However, few other iron-related genes had significantly altered expression in response to alcohol, and this approach did not uncover candidate explanations for the elevated hepcidin expression in the PAE fetal liver.
To gain additional insight into potential contributors to the fetal anemia, we analyzed this same transcriptome dataset using GO-Term analysis; the liver is the primary site of fetal erythrocyte production. Similar to our findings in early neuroprogenitors,28,29 this revealed a significantly reduced representation in multiple terms associated with ribosome biogenesis including rRNA transcription (q=0.04063), 90S preribosome (q=0.01106), preribosome small subunit (q=0.03226), and nucleolar part (q=0.01106; Table 2). The 52 genes represented included those crucial for rRNA and tRNA synthesis, processing, and assembly including Tcof1, Polr1b, Trp53, Bop1, Mettl1, Ears, Iars, and Tars.
Table 2:
Ribosome Biogenesis-Related GO-Term Pathways Downregulated in Fetal Liver by Alcohol a
| ID | Description | GeneRatio | p-value | q-value | geneID |
|---|---|---|---|---|---|
| GO:0050658 | RNA transport | 17/529 | 3.34E-05 | 0.00554 | Dhx9, Hnrnpu, Ahctf1, Ltv1, Ranbp2, Nup153, Nup155, Ncbp2, Ddx39b, Xpo5, Rftn1, Nup214, Hnrnpa3, Sfpq, Nup210, Abce1, Nup133 |
| GO:0030490 | Maturation of SSU-rRNA | 8/529 | 0.0001436 | 0.01827 | Utp25, Tsr1, Nol11, Heatr1, Wdr46, Bysl, Nat10, Lsm6 |
| GO:0009303 | rRNA transcription | 6/529 | 0.000506 | 0.04063 | Ncl, Trp53, Nol11, Tcof1, Polr1b, Smarca4 |
| GO:0006399 | tRNA metabolic process | 16/529 | 0.0007608 | 0.05380 | Iars2, Mettl1, Elac2, Iars, Tars, Pop1, Vars, Thada, Nat10, Cdk5rap1, Tars2, Trmt10a, Exosc10, Ears2, Lsm6, Adat1 |
| GO:0030686 | 90S preribosome | 7/530 | 0.000115 | 0.01106 | Utp20, Heatr1, Bop1, Wdr36, Wdr3, Noc2l, Noc4l |
| GO:0044452 | Nucleolar part | 18/530 | 0.0001379 | 0.01106 | Ncl, Txnrd1, Nol11, Heatr1, Ddx46, Pspc1, Pop1, Bop1, Taf4b, Wdr36, Tcof1, Polr1b, Nop56, Wdr3, Uso1, Prmt7, Leo1, Dkc1 |
| GO:0030688 | Preribosome, small subunit precursor | 4/530 | 0.0006707 | 0.03226 | Ltv1, Tsr1, Bysl, Noc4l |
| GO:0002039 | p53 binding | 10/523 | 0.0001316 | 0.00946 | Trp53, Hif1a, Prmt5, Usp7, Trp53bp1, Noc2l, Brd7, Usp10, Smarca4, Taf1 |
| GO:0002161 | Aminoacyl-tRNA editing activity | 4/523 | 0.0014161 | 0.03646 | Iars2, Iars, Vars, Tars2 |
Values are mean ± SD. n = 8 litters (pooled 2 fetal livers/litter) per group. Significance analyzed using Wilcoxon rank sum test followed by Benjamini-Hochberg (BH) correction.
DISCUSSION
Findings from this model largely concur with prior preclinical and clinical studies and affirm alcohol’s negative impact on iron regulation in the maternal-fetal dyad. Importantly, alcohol induces anemia in the murine fetus, as in rat PAE models and human neonates exposed prenatally to alcohol,3,5 and suggesting that this represents a conserved response to alcohol. This is accompanied by elevated fetal hepcidin production, as previously reported in a rat PAE model.3 Thus, this model further endorses prior studies3,5,18 that alcohol promotes fetal anemia, dysregulates hepcidin production, and impairs the fetus’s ability to regulate its iron status. These adverse fetal outcomes gain additional significance given that this murine model utilized a more moderate alcohol exposure (3 g/kg) relative to our prior studies in rat (5 g/kg). Offspring generated in this model lack obvious dysmorphologies, have a non-significant but consistent 5% reduction in birth weight, and exhibit mild cognitive deficits, a phenotype that models the clinical diagnostic of Alcohol-Related Neurodevelopmental Disorders (ARND) under the FASD umbrella.1,19–23 By age 6–7 months, these mice also exhibit metabolic deficits including elevated fasting glucose, central adiposity, and worsened glucose tolerance.21,23 That fetal anemia and elevated hepcidin occurred in a PAE model that generates the more modest cognitive and growth deficits which typify ARND extends the potential relevance of these changes to pregnancies that experience a more moderate alcohol exposure.
In these mothers, the alcohol-associated reduction in hemoglobin and modest decline in hematocrit was accompanied by an upregulated erythropoietin that suggested an attempt to reverse this state. The emergence of this phenotype was unexpected as it is not observed in our rat PAE model that experienced a higher alcohol dose (5 vs. 3 g/kg),3,4,38 although higher rates of maternal anemia are observed at late-term in heavy-drinking pregnancies.5 The mechanism underlying these hematological changes is unclear. Although in both pregnant people and rat alcohol is associated with a preference for iron storage over erythropoiesis,5,38 the lack of other hematological changes in these mouse dams is inconsistent with an iron deficient anemia; moreover, pregnancies with high alcohol exposure do not have higher rates of iron deficiency with anemia.5 An alternative explanation is this may represent the anemia of inflammation, given that alcohol is strongly proinflammatory. Higher rates of this are described for both pregnant drinkers and our rat PAE model.3–5,36 However, the dams here exhibit relatively modest changes in cytokines and the downstream STAT3 signals through which cytokines elevate hepcidin to drive anemia; moreover, their hepcidin is not elevated. It is instead possible that these dams’ condition may be driven partly by their physiology, a greater percentage of their mass consists of weight gained to support the pregnancy (43%; data from this study) compared to pregnant rats (32%), and this may impose a higher gestational iron demand relative to their size.38 However, we also note the positive association between drinking frequency and anemia – specifically, anemia of “indeterminate cause” – in a pregnant population that experiences low food security and reduced iron intake.5 The phenotype observed here might represent a parallel influence of alcohol, perhaps originating from a direct suppression of erythropoiesis by alcohol as suggested by these dams’ elevated erythropoietin, reduced hepcidin, and the lack of a reduced mean cell volume that otherwise signifies increased production. A clearer understanding of the potential mechanisms underlying this alcohol-associated, atypical anemia requires additional investigation.
With respect to the fetus, anemia is perhaps alcohol’s most serious consequence because it limits oxygen transport and thus the ability to generate energy for growth and brain development.6 The lack of effect on fetal mean corpuscular hemoglobin (MCH, MCHC) or hepatic genes regulating iron status again raises a question whether this decline in red cell counts, hemoglobin, and hematocrit represents solely a functional iron deficiency. Their normal levels of cytokines and hepatic pSTAT3 similarly question whether this represents the anemia of inflammation, despite the elevated fetal hepcidin. Instead, the elevated fetal erythropoietin suggests an impairment of erythropoiesis that remains unresolved by that hormone; although fetal Epo levels are lower than in their dams, this may reflect a need to limit its production under the fetuses’ normally hypoxic state and thus reduce the risk for polycythemia. The liver is the primary site of fetal erythropoiesis, and additional insight into a potential contributory mechanism emerges from their reduced hepatic abundance of gene sets involving ribosome and tRNA processing and assembly. We note that anemia is a diagnostic hallmark for disorders of ribosome biosynthesis known collectively as ribosomopathies,39 and alcohol suppresses the expression of multiple ribosome-encoding and related genes in proliferating fetal cell lineages including neural crest, neuroprogenitors, and fetal cortex (Flentke and Smith, in preparation; Rivera and Smith, in preparation).28,29,40 Such a fundamental deficit in ribosome production would not be countered by erythropoietin and could account for the elevated EPO previously reported in the cord blood from alcohol-exposed pregnancies, and its positive correlation with maternal alcohol intake.41 Thus, despite some differences, this model of PAE incorporates features of the fetal anemia observed across multiple models and clinical studies of gestational alcohol exposure, and could serve as a useful model for mechanistic investigation into this phenotype.5,18,41
PAE also elevated fetal hepcidin production, consistent with its impact upon the rat fetus.3,4 Elevated hepcidin is problematic for the fetus, as it reduces iron availability including that needed for the high demands of erythropoiesis.7 Thus, it is likely that this elevated fetal hepcidin may be at least partially responsible for the fetal anemia. However, the candidate upstream effectors that mediate its elevation appear to differ between these models, as we found no evidence for a contribution of IL6/STAT3 or BMP6/SMAD1/5, as previously described for rat.18 Additional contributors remain to be investigated; for example, miRNAs can regulate many factors involved in iron metabolism and are known targets of alcohol.42,43 In contrast, the reduced maternal hepcidin expression observed here is at odds with prior studies on pregnant rats and humans, wherein alcohol increases its maternal production.3,5 However, it is consistent with alcohol’s impact in nonpregnant humans, mice, and rats,8,10 and might be driven by these mothers’ greater hematopoietic demand due to their higher pregnancy mass, and as reflected in their elevated erythropoietin.
Major questions remain regarding alcohol’s effects on iron metabolism during pregnancy. We do not know what causes this fetal anemia, and although it responds to iron supplementation or fortification,4,38 it remains unclear how alcohol directly impacts fetal erythropoiesis. Data herein suggest that mouse, rather than rat, may be the better model to study this anemia. We did not observe changes in fetal brain iron content, and this suggests there may exist an alcohol threshold for these effects. Overall, these data further support the importance of maternal iron status in modulating outcomes in the PAE offspring. Maternal iron status is routinely monitored in pregnancy, but alcohol’s disruption of iron homeostasis may elevate those needs as compared with a healthy pregnancy.4,5,44,45 A high research priority is to identify optimal strategies that improve maternal-fetal iron status under alcohol exposure, and to test these in future intervention trials. Such strategies could include more aggressive screening for iron status in women with alcohol-use disorders, with an emphasis upon more sensitive indices such as serum iron or ferritin/transferrin ratios,5 rather than the less sensitive hematological assessments. Interventions such as prenatal supplements or dietary fortification approaches may need to be optimized to account for the homeostatic alterations driven by alcohol. At birth, delayed cord clamping increases neonatal iron and should be standard practice. We propose that improvement of maternal-fetal iron status can substantially improve offspring outcomes in alcohol-exposed pregnancies.
Supplementary Material
Impact Statements:
Prenatal alcohol exposure causes a functional iron deficiency in a model that also impairs cognition in later life.
Prenatal alcohol exposure causes fetal anemia.
This fetal anemia is accompanied by elevated hepcidin and erythropoietin.
Findings are consistent with prior observations that prenatal alcohol exposure increases maternal-fetal iron requirements during pregnancy.
Acknowledgements:
We thank Brandon Presswood and Dane Ricketts for technical support, and Pamela Kling for helpful suggestions during this study.
Funding:
Supported by R01 AA022999 and R01 AA011085 to SMS, T32 DK007686 to KKH, K99 AA028291 to NS, F32 AA028684 to OCR, and F32 AA027121 to STCK.
Footnotes
Competing interests: The authors do not have conflicts of interest for this study.
Patient Consent: Is not relevant to this study.
Data availability:
Materials and data from this study are available upon reasonable request for non-commercial purposes.
REFERENCES
- 1.Wozniak JR, Riley EP, Charness ME. Clinical presentation, diagnosis, and management of fetal alcohol spectrum disorder. Lancet Neurol 18 (2019) [DOI] [PMC free article] [PubMed] [Google Scholar]
- 2.Young JK, Giesbrecth HE, Eskin MN, Aliani M, Suh M. Nutrition implications for fetal alcohol spectrum disorder. Adv Nutr 5, 675–692 (2014) [DOI] [PMC free article] [PubMed] [Google Scholar]
- 3.Huebner SM, Blohowiak SE, Kling PJ, Smith SM. Prenatal alcohol exposure alters fetal iron distribution and elevates hepatic hepcidin in a rat model of fetal alcohol spectrum disorders. J Nutr 146, 1180–1188 (2016) [DOI] [PMC free article] [PubMed] [Google Scholar]
- 4.Huebner SM, et al. Dietary iron fortification normalizes fetal hematology, hepcidin, and iron distribution in a rat model of prenatal alcohol exposure. Alcohol Clin Exp Res 42, 1022–1033 (2018) [DOI] [PMC free article] [PubMed] [Google Scholar]
- 5.Carter RC, et al. Prenatal alcohol-related alterations in maternal, placental, neonatal, and infant iron homeostasis. Am J Clin Nutr 114, 1107–1122 (2021) [DOI] [PMC free article] [PubMed] [Google Scholar]
- 6.Georgieff MK. Iron deficiency in pregnancy. Am J Obstet Gynecol 223, 516–24 (2020). [DOI] [PMC free article] [PubMed] [Google Scholar]
- 7.Katsarou A, Pantopoulos K. Basics and principles of cellular and systemic iron homeostasis. Mol Aspects Med 75, 100866 (2020). [DOI] [PubMed] [Google Scholar]
- 8.Harrison-Findik DD, et al. Iron-mediated regulation of liver hepcidin expression in rats and mice is abolished by alcohol. Hepatology 46, 1979–1985 (2007) [DOI] [PubMed] [Google Scholar]
- 9.Ioannou GN, Dominitz JA, Weiss NS, Heagerty PJ, Kowdley KV. The effect of alcohol consumption on the prevalence of iron overload, iron deficiency, and iron deficiency anemia. Gastroenterology 126, 1293–1301 (2004) [DOI] [PubMed] [Google Scholar]
- 10.Costa-Matos L, et al. Liver hepcidin mRNA expression is inappropriately low in alcoholic patients compared with healthy controls. Eur J Gastroenterol Hepatol 24, 1158–1165 (2012) [DOI] [PubMed] [Google Scholar]
- 11.Harrison-Findik DD. Is the iron regulatory hormone hepcidin a risk factor for alcoholic liver disease? World J Gastroenterol 15, 1186–1193 (2009) [DOI] [PMC free article] [PubMed] [Google Scholar]
- 12.Sangkhae V, Nemeth E. Regulation of the iron homeostatic hormone hepcidin. Adv. Nutr. An. Int. Rev. J 8, 126–36 (2017). [DOI] [PMC free article] [PubMed] [Google Scholar]
- 13.Wang CY, Meynard D, Lin HY. The role of TMPRSS6/matriptase-2 in iron regulation and anemia. Front. Pharmacol. 5, 114 (2014) [DOI] [PMC free article] [PubMed] [Google Scholar]
- 14.Xiao X, Alfaro-Magallanes VM, Babitt JL. Bone morphogenic proteins in iron homeostasis. Bone 138, 115495 (2020) [DOI] [PMC free article] [PubMed] [Google Scholar]
- 15.Canali S, Wang C, Zumbrennen-Bullough KB, Bayer A, Babitt JL. Bone morphogenetic protein 2 controls iron homeostasis in mice independent of Bmp6. Blood 92, 1204–1213 (2017) [DOI] [PMC free article] [PubMed] [Google Scholar]
- 16.Carow B, Rottenberg ME. SOCS3, a major regulator of infection and inflammation. Front Immunol 5, 1–13 (2014) [DOI] [PMC free article] [PubMed] [Google Scholar]
- 17.Huang H, Constante M, Layoun A, Santos MM. Contribution of STAT3 and SMAD4 pathways to the regulation of hepcidin by opposing stimuli. Blood 113, 3593–3599 (2009) [DOI] [PMC free article] [PubMed] [Google Scholar]
- 18.Saini N, et al. Alcohol’s dysregulation of maternal–fetal IL-6 and p-STAT3 is a function of maternal iron status. Alcohol Clin Exp Res 43, 2332–2343 (2009) [DOI] [PMC free article] [PubMed] [Google Scholar]
- 19.Mooney SM, Pjetri E, Friday WB, Smith SM. Growth and behavioral differences in a C57BL/6J mouse model of prenatal alcohol exposure. Alcohol 97, 51–57 (2021) [DOI] [PMC free article] [PubMed] [Google Scholar]
- 20.Virdee MS, et al. An enriched biosignature of gut microbiota-derived metabolites characterizes maternal plasma in a mouse model of Fetal Alcohol Spectrum Disorder. Sci Rep 11, 1–16 (2021) [DOI] [PMC free article] [PubMed] [Google Scholar]
- 21.Smith SM, et al. Aging-related behavior, adiposity, and glucose impairments and their association following prenatal alcohol exposure in the C57BL/6J mouse. Nutrients 14, 1438 (2022) [DOI] [PMC free article] [PubMed] [Google Scholar]
- 22.Saini N, et al. Untargeted metabolome analysis reveals reductions in maternal hepatic glucose and amino acid content that correlate with fetal organ weights in a mouse model of Fetal Alcohol Spectrum Disorders. Nutrients. 14, 1096 (2022) [DOI] [PMC free article] [PubMed] [Google Scholar]
- 23.Walter KR, Ricketts DK, Presswood BH, Smith SM, Mooney SM. Prenatal alcohol exposure causes persistent microglial activation and age- and sex- specific effects on cognition and metabolic outcomes in an Alzheimer’s Disease mouse model. Am J Drug Alcohol Abuse. 4, 1–19 (2022) [DOI] [PMC free article] [PubMed] [Google Scholar]
- 24.Reeves PG, Neilson FH, Fahey GC Jr. AIN-93 purified diets for laboratory rodents: final report of the American Institute of Nutrition ad hoc writing committee on the reformulation of the AIN-76A rodent diet. J Nutr. 123, 1939–1951. [DOI] [PubMed] [Google Scholar]
- 25.Bustin SA, et al. The MIQE Guidelines: minimum information for publication of quantitative real-time PCR experiments. Clin Chem 55, 1–12 (2009) [DOI] [PubMed] [Google Scholar]
- 26.Kwan STC, et al. Maternal iron nutriture modulates placental development in a rat model of fetal alcohol spectrum disorder. Alcohol 84, 57–66 (2020) [DOI] [PMC free article] [PubMed] [Google Scholar]
- 27.Livak KJ, Schmittgen TD. Analysis of relative gene expression data using real- time quantitative PCR and the 2 ddCT method. Methods 25, 402–8 (2001) [DOI] [PubMed] [Google Scholar]
- 28.Berres ME, Garic A, Flentke GR, Smith SM. Transcriptome profiling identifies ribosome biogenesis as a target of alcohol teratogenicity and vulnerability during early embryogenesis. PLoS ONE 12, e0169351 (2017) [DOI] [PMC free article] [PubMed] [Google Scholar]
- 29.Garic A, Berres ME, Smith SM. High-throughput transcriptome sequencing identifies candidate genetic modifiers of vulnerability to Fetal Alcohol Spectrum Disorders. Alcohol Clin Exp Res. 38, 1874–1882 (2014) [DOI] [PMC free article] [PubMed] [Google Scholar]
- 30.Anders S, Huber W. Differential expression analysis for sequence count data. Genome Biol. 11, R106 (2010) [DOI] [PMC free article] [PubMed] [Google Scholar]
- 31.Langmead B, Salzberg SL. Fast gapped-read alignment with Bowtie 2. Nat Methods 9, 357–359 (2012) [DOI] [PMC free article] [PubMed] [Google Scholar]
- 32.Liao Y, Smyth GK, Shi W. FeatureCounts: An efficient general-purpose program for assigning sequence reads to genomic features. Bioinformatics 30, 923–930 (2014) [DOI] [PubMed] [Google Scholar]
- 33.Love MI, Huber W, Anders S. Moderated estimation of fold change and dispersion for RNA-seq data with DESeq2. Genome Biol 15, 1–21 (2014) [DOI] [PMC free article] [PubMed] [Google Scholar]
- 34.Lombardero M, Kovacs K, Scheithauer BW. Erythropoietin: a hormone with multiple functions. Pathobiology 78, 41–56 (2011) [DOI] [PubMed] [Google Scholar]
- 35.Yang A, et al. Expression of hepcidin and ferroportin in the placenta, and ferritin and transferrin receptor 1 levels in maternal and umbilical cord blood in pregnant women with and without gestational diabetes. Int J Environ Res Public Health 13, 766 (2016) [DOI] [PMC free article] [PubMed] [Google Scholar]
- 36.Cardaropoli S, Todros T, Nuzzo AM, Rolfo A. Maternal serum levels and placental expression of hepcidin in preeclampsia. Pregnancy Hypertens 11, 47–53 (2018) [DOI] [PubMed] [Google Scholar]
- 37.Meynard D, et al. Lack of the bone morphogenetic protein BMP6 induces massive iron overload. Nat Genet 41, 478–81 (2009) [DOI] [PubMed] [Google Scholar]
- 38.Helfrich KK, et al. Gestational iron supplementation improves fetal outcomes in a rat model of prenatal alcohol exposure. Nutrients 14, 1653 (2022) [DOI] [PMC free article] [PubMed] [Google Scholar]
- 39.Kampen KR, Sulima SO, Vereecke S, De Keersmaecker K. Hallmarks of ribosomopathies. Nucleic Acids Res. 48, 1013–1028 (2020) [DOI] [PMC free article] [PubMed] [Google Scholar]
- 40.Flentke GR, Baulch JW, Berres ME, Garic A, Smith SM. Alcohol-mediated calcium signals dysregulate pro-survival Snai2/PUMA/Bcl2 networks to promote p53-mediated apoptosis in avian neural crest progenitors. Birth Defects Res. 111, 686–699 (2019) [DOI] [PMC free article] [PubMed] [Google Scholar]
- 41.Halmesmaki E, Teramo KA, Widness JA, Clemsons GK, Ylikorkala O. Maternal alcohol abuse is associated with elevated fetal erythropoietin levels. Obs Gynecol 76, 219–222 (1990) [PubMed] [Google Scholar]
- 42.Davis M, Clarke S. Influence of microRNA on the maintenance of human iron metabolism. Nutrients 5, 2611–2628 (2013) [DOI] [PMC free article] [PubMed] [Google Scholar]
- 43.Mahnke AH, Salem NA, Tseng AM, Chung DD, Miranda RC. Nonprotein-coding RNAs in Fetal Alcohol Spectrum Disorders. Prog Mol Biol Transl Sci 157, 299–342 (2018) [DOI] [PubMed] [Google Scholar]
- 44.Huebner SM, Tran TD, Rufer ES, Crump PM, Smith SM. Maternal iron deficiency worsens the associative learning deficits and hippocampal and cerebellar losses in a rat model of fetal alcohol spectrum disorders. Alcohol Clin Exp Res 39, 2097–2107 (2015) [DOI] [PMC free article] [PubMed] [Google Scholar]
- 45.Rufer ES et al. Adequacy of maternal iron status protects against behavioral, neuroanatomical, and growth deficits in fetal alcohol spectrum disorders. PLoS One 7, e47199 (2012) [DOI] [PMC free article] [PubMed] [Google Scholar]
Associated Data
This section collects any data citations, data availability statements, or supplementary materials included in this article.
Supplementary Materials
Data Availability Statement
Materials and data from this study are available upon reasonable request for non-commercial purposes.