

Abstract
We have conducted a genomewide investigation into the enzymatic specificity, expression profiles, and binding locations of four histone deacetylases (HDACs), representing the three different phylogenetic classes in fission yeast (Schizosaccharomyces pombe). By directly comparing nucleosome density, histone acetylation patterns and HDAC binding in both intergenic and coding regions with gene expression profiles, we found that Sir2 (class III) and Hos2 (class I) have a role in preventing histone loss; Clr6 (class I) is the principal enzyme in promoter-localized repression. Hos2 has an unexpected role in promoting high expression of growth-related genes by deacetylating H4K16Ac in their open reading frames. Clr3 (class II) acts cooperatively with Sir2 throughout the genome, including the silent regions: rDNA, centromeres, mat2/3 and telomeres. The most significant acetylation sites are H3K14Ac for Clr3 and H3K9Ac for Sir2 at their genomic targets. Clr3 also affects subtelomeric regions which contain clustered stress- and meiosis-induced genes. Thus, this combined genomic approach has uncovered different roles for fission yeast HDACs at the silent regions in repression and activation of gene expression.
Keywords: chromatin, fission yeast, gene regulation, genomewide, HDAC
Introduction
The biochemical purification of human histone deacetylase (HDAC) enzymes, and the similarity in the amino-acid sequence of human HDAC to Rpd3 in budding yeast (Saccharomyces cerevisiae) linked HDAC activity to gene regulation (Rundlett et al, 1996; Taunton et al, 1996). Since then, a paradigmatic role of HDAC enzymes as coregulators in gene repression has been established. In addition to gene regulation, HDACs are important for many other chromatin-related cellular processes such as DNA replication and DNA repair (reviewed in Kurdistani and Grunstein, 2003). HDACs have homologs in many eukaryotes and can be phylogenetically divided into three main classes: the Rpd3 and Hos2-like (class I) enzymes, the Hda1-like (class II) enzymes and the Sir2-like (class III) HDAC enzymes, which are sometimes called ‘Sirtuins'. The class I and II enzymes are related, sharing a conserved central enzymatic domain. The class III enzymes are nicotinamide adenine dinucleotide (NAD) dependent.
There are four core histones, all of which can be modified by acetylation. Many of the acetylation sites are highly conserved lysines in the amino-termini of the histones, that is, histone H4 at K5, K8, K12 and K16, and histone H3 at K9, K14, K18, K23 and K27. The sites in H2A and H2B are less conserved. It has been suggested that the unique patterns of acetylation at a given gene or promoter specify protein-binding surfaces (Kurdistani and Grunstein, 2003). These patterns are determined by the balancing activities of histone acetyltransferases (HATs) and HDACs, each of which has a different substrate specificity. For example, in budding yeast Rpd3 deacetylates all four core histones except H4 at K16, whereas Hda1 deacetylates histones H3 and H2B. On the other hand, the HAT Gcn5 is required for acetylation of several sites in H3 and H2B, whereas the HAT Esa1 is required for acetylation of H4 and H2A (Suka et al, 2001). Thus, determining the specificities of these enzymes is crucial to understanding how HDAC and HAT enzymes affect gene expression. However, this task is challenging, since there are established discrepancies between the HAT and HDAC substrate specificity in vivo and in vitro. For example, the HAT Gcn5 is specific for histone H3 K14 in vitro (Lo et al, 2000), but seems to act primarily on H3 K9, K18 and K23 but not K14 in vivo (Suka et al, 2001). HDAC specificity may even be changed in vitro by addition of cofactors such as p33ING1 to the purified HDAC complex (Kuzmichev et al, 2002). Thus, to understand HDACs and their role in gene regulation, it is critical to determine their in vivo enzyme activity at target genes and promoters.
This was first addressed in budding yeast by determining genomewide HDAC enzyme activity maps, whereby DNA microarray chips were probed with DNA fragments recovered from Chromatin Immunoprecipitations (ChiP on CHIP) (Robyr et al, 2002). By combining the resulting acetylation maps with data from gene expression profiling experiments of the corresponding HDAC mutants, the ‘division of labor' for Rpd3, Hda1, Hos1, Hos2, Hos3 and Sir2 with respect to gene regulation could be determined. Promoter regions, or genes where both histone acetylation and gene expression are changed, were identified, and the patterns of histone acetylation at the regulated genes were studied. Subsequently, using a similar ChIP on CHIP approach, a genomewide Rpd3-binding map was established that allowed the binding sites for Rpd3 to be compared with the expression profiling data, thereby discerning the truly direct effects of Rpd3 on chromatin regulation and gene expression (Kurdistani et al, 2002).
The combined genomewide approaches have revealed new and unexpected functions for HDACs in budding yeast that challenge the prevailing view of HDACs acting merely as corepressors in gene expression. For example, the class I enzyme Hos2 was found to bind to open reading frames (ORFs) of active genes, where it has an important role in gene activation (Wang et al, 2002). The genomewide binding map of Rpd3 revealed that Rpd3 binds to promoters of highly expressed genes, and, in combination with mutant phenotypes, this indicated that the recruitment of Rpd3 to these promoters was insufficient for repression (Kurdistani et al, 2002). Furthermore, in the case of stress-induced genes, Rpd3 actually promotes gene expression (De Nadal et al, 2004). Hence, HDACs appear to activate and repress transcription, and the basic principles of HDAC function in gene regulation remain to be uncovered.
This raises the important question as to what extent the new principles of HDACs in gene expression are conserved in eukaryotes. With this in mind, we have carried out a systematic study of HDACs in Schizosaccharomyces pombe, using the combined approach of analyzing HDAC mutants by cDNA expression profiling, histone acetylation maps and HDAC-binding maps generated by ChIP using DNA microarrays (ChiP on CHIP). To enable this, we first developed an intergenic region (IGR) DNA microarray and a combined IGR and ORF microarray with full genomic coverage for S. pombe. Using these arrays, we analyzed four HDACs representing three different phylogenetic classes: Hos2 (previously called Hda1/Phd1) class I, Clr6 (class I), Clr3 (class II) and Sir2 (class III). Our analysis has focused on the roles of the different HDACs in the silent chromosomal regions, the subtelomeric regions and in gene repression and activation, and has uncovered several different genomewide functions for fission yeast HDACs.
Results
Construction of complete intergenic DNA microarrays for S. pombe
We wished to determine where the HDACs were active in the S. pombe genome. Therefore, we set out to construct enzyme activity maps that are defined as maps of acetylation patterns in mutant strains lacking a particular enzyme compared with wild-type (wt) strains. Such maps reveal increases in acetylation at sites where the HDAC enzyme is normally active in a wt strain. Furthermore, we wished to directly compare the effects of HDACs in IGRs and ORFs, so we created an IGR DNA microarray and a combined IGR+ORF DNA microarray for S. pombe. We used the ‘Genome Pride' software (Haas et al, 2003) to design PCR primers, which specifically amplify 500 bp fragments for each S. pombe IGR. This resulted in 4960 IGR fragments, representing RNA pol II promoter regions. In addition to these fragments, we included 20 tRNA gene promoter fragments, four fragments for different rDNA promoters (5S, 18S, 5.8S and 28S) and 11 fragments for noncoding centromere repeats (dg1, dh, imr, cnt1, cnt2, cnt3). The IGR microarray contains about 5.000 spots in duplicate and was produced at Eurogentec SA custom microarray services (Belgium). In addition, a second combined DNA microarray (ORF+IGR) was prepared with duplicate spots of the 4.976 ORF fragments and about 5.000 IGR fragments at a higher pin density, and contains about 20.000 spots per slide (Figure 1).
Figure 1.
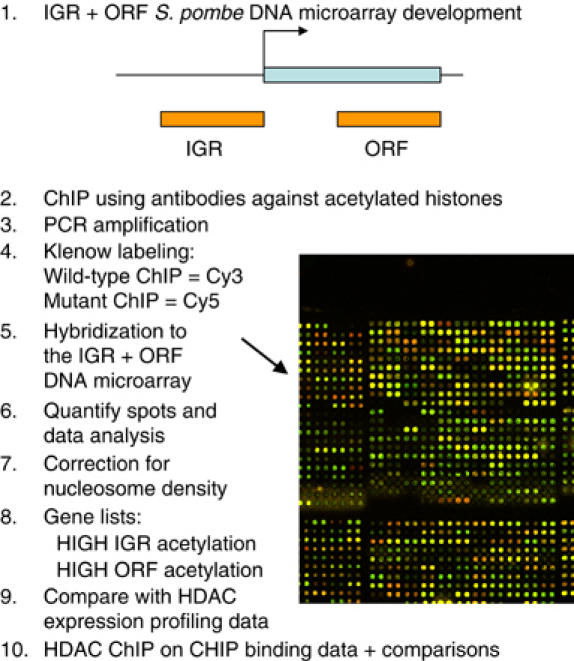
Development of an S. pombe IGR+ORF array and its use for ChIP on CHIP. A schematic representation of the experimental strategy used in this study.
ChiP on CHIP analysis of histone acetylation in HDAC mutants
To determine where in the genome the different HDACs act, and to investigate their enzyme specificity at genomic targets, we used the newly developed S. pombe DNA microarrays to establish enzyme activity maps for four different HDACs using the ChIP on CHIP method (Robyr and Grunstein, 2003). By analyzing several different acetylation sites, the binding maps revealed not only where in the genome the HDAC enzyme is normally active, but also provided evidence for the in vivo activity of each HDAC enzyme. A set of five highly specific antibodies for H3K9Ac, H3K14Ac, H4K5Ac, H4K12Ac and H4K16Ac developed and titrated for ChIP (Suka et al, 2001) were used for ChIP of chromatin extracts from wt, hos2Δ, clr6-1, clr3Δ and sir2Δ cells.
Several recent studies including genomewide approaches in budding yeast (Bernstein et al, 2004; Lee et al, 2004) indicate that nucleosomes are not uniform across the budding yeast genome. Therefore, nucleosome-rich regions may appear as more heavily modified and nucleosome-poor regions may appear as less modified than they really are. Therefore, we used an antibody against the histone H3 C-terminal region (H3 cter) to control for nucleosome occupancy.
The mutant alleles were first backcrossed with the standard laboratory strain (972 h-) to ensure isogenic strain backgrounds (see Materials and methods). Cell cultures were then grown to mid-logarithmic growth phase (5 × 10⁶ cells/ml) in rich medium before fixation and ChIP. The resulting ChIP DNA was labeled with Cy5. The wt control ChIP DNA was generally labeled with Cy3 and simultaneously hybridized with the Cy5-labeled DNA to the IGR+ORF microarrays to produce genomewide mutant versus wt histone acetylation maps. For three control experiments we carried out dye swap controls (ChIP DNA labeled with Cy3 instead of Cy5), and these DNA microarray slides yielded surprisingly similar results with a correlation coefficient of 0.8–0.9 (Supplementary data and Figure S1). Therefore, we concluded that the Klenow labeling (Robyr and Grunstein, 2003) yields little dye bias, and hence dye swaps were not routinely employed for the ChIP on CHIP experiments.
The microarrays were scanned, quantified, normalized and corrected for nucleosome density (see Materials and methods). First, to investigate the influence of each HDAC mutant on nucleosome density, we calculated the mutant/wt H3 cter ratios for each IGR and ORF fragment and represented these with histogram (Figure 2A). It was clear from this analysis that the ratio frequency distribution was biased to <1.0 in hos2Δ and sir2Δ mutants, and that the distribution was broader than in the other mutants, which indicated that these two mutants had generally lower nucleosome content than wt and altered nucleosome positions as compared to wt. In contrast, the histograms of clr3Δ and clr6-1 mutants all peaked at 1.0, revealing that the nucleosome density was relatively similar to wt. Next, for each acetylation site, ranking lists of high IGR and ORF mutant/wt acetylation ratios and high H3 cter corrected acetylation ratios were determined using a >2.0-fold cutoff (Figure 2B). From the analysis of the relative number of fragments with high IGR and ORF mutant/wt acetylation ratios, it was clear that the clr6-1 mutant showed the strongest and broadest increase in acetylation as compared to wt. However, upon correction for nucleosome loss, it was evident that the other three mutants also had a strong effect on IGR and ORF acetylation. Thus, all four HDAC mutants resulted in substantial genomewide effects on acetylation, and, importantly, two of the HDACs in study, Sir2 and Hos2, seem to play a major role in preventing nucleosome loss.
Figure 2.
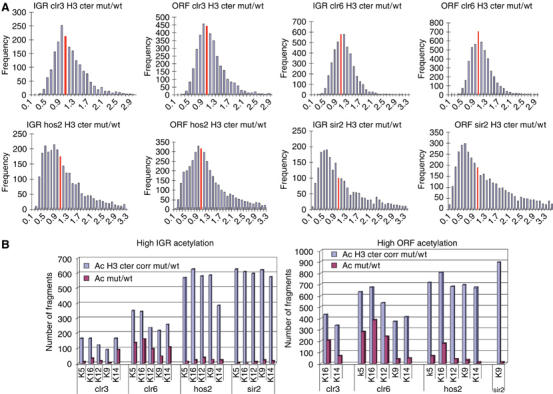
(A) Nucleosome occupancy and acetylation ratios in HDAC mutants as compared to wt. The histograms represent the frequencies of H3 cter ChIP ratios in mutant/wt. The red bar indicates the frequency at a mutant/wt nucleosome ratio of 1.0. (B) Bar diagrams showing the number of fragments for IGRs and ORFs, with >2.0-fold H3 cter corrected (blue) and >2.0-fold uncorrected (red) acetylation ratios in mutant/wt. The acetylation sites and mutants used are indicated below each bar (H4Ac: K5, K12, K16 and H3Ac: K9, K14).
Division of labor between HDACs in regulation of gene expression
A key goal of these studies was to define the division of labor between the different HDAC enzymes in regulation of gene expression. We carried out expression profiling experiments in which gene expression in logarithmically growing cultures of HDAC mutant cells was compared to that in wt controls. Wt, hos2Δ, clr6-1, clr3Δ and sir2Δ cells were grown to mid-logarithmic phase (5 × 10⁶ cells/ml) in rich medium, and RNA was extracted and subjected to cDNA expression profiling analysis using the established protocols (Xue et al, 2004). It was previously shown that the Clr6 enzyme is sensitive to the HDAC inhibitor Trichostatin A (TSA) in vitro (Nakayama et al, 2003); hence, for comparison, we also determined the expression profile of wt cells after a 15-min exposure to TSA. To investigate the roles of HDACs at heterochromatic genes we also analyzed Swi6, the fission yeast heterochromatin protein 1 (HP1) homolog, by expression profiling of swi6Δ and Swi6 overexpression (pSwi6) strains. For each expression profile, at least two independent cultures were analyzed with DNA microarray experiments. Owing to the dye bias (correlation coefficient 0.6–0.7) generally observed with our S. pombe cDNA expression profiling (Xue et al, 2004), we routinely employed dye swaps (mutants cDNA labeled with Cy3 instead of Cy5) for the duplicate experiments.
To dissect the division of labor in gene repression and activation of different S. pombe HDACs, we used hypergeometric distribution tests using the 1.5-fold cutoff value (see Materials and methods). We found that clr6-1 showed a high number of affected genes acting on 256 genes (about 5.1% of the genome). In a previous genomewide study of S. pombe HDACs, the expression profiles for clr3-735 and clr6-1 were reported (Hansen et al, 2005). Hansen et al identified 448 genes upregulated in clr6-1 and found 183 genes upregulated in clr3-735 as compared to wt. We find that there was good agreement between clr6-1 repressed genes in the Hansen et al study and our study (151 common Clr6 targets of 256; P=2.82E−108 in a hypergeometric distribution test of significance), despite the fact that different growth media were used (Hansen et al used minimal medium and we used YES medium). Comparison of clr6-1 upregulated genes with lists of genes upregulated in the other HDAC mutants revealed no significant overlaps (Figure 3A). Thus, Clr6 appeared to perform its gene-regulatory functions independently. In all, 44 of the 256 clr6-1 repressed genes (hypergeometric probability P=2.1E−4) were affected by a 15-min exposure to TSA and no overlaps were detected with the other HDAC mutants, indicating that Clr6 is the primary target for TSA in S. pombe cells.
Figure 3.
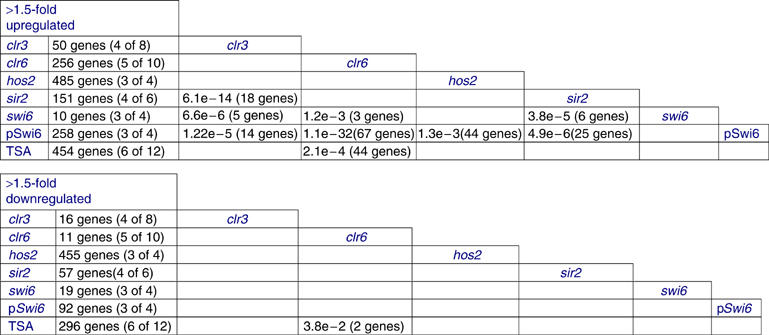
Expression profiling of HDAC mutants. The numbers of genes with >1.5-fold higher and lower expression in the different HDAC mutants are shown. The numbers within brackets indicate the number of measurements which fulfill the threshold limits; for example, in high expression data, for example, (3 of 4) means that three data points of four were >1.5-fold higher than wt. The similarity between the gene-ranking lists is indicated by the hypergeometric probabilities, and the numbers of genes common to the ranking lists are crosstabulated.
Hos2 seemed the most prominent HDAC in gene repression, acting on 485 genes (9.7% of the genome). Notably, there was a very significant overlap (18 genes; P=6.1E−14) between the relatively few genes being repressed by Sir2 (151 genes; 3.0% of the genome) and genes repressed by Clr3 (50 genes; 1.0% of the genome). Furthermore, the Clr3 and Sir2 repressed genes also overlapped significantly with swi6Δ (P=6.6E−6 for clr3Δ, P=3.8E−5 for sir2Δ), indicating that a large proportion of these genes are heterochromatic.
Next, we investigated the roles for the different HDACs in promoting gene expression by studying the downregulated (>1.5 fold) sets of genes. Hos2 was the strongest gene activator studied, promoting gene expression in 9.1% of the genome (Figure 3B). The other HDACs were found to have nonoverlapping roles in gene activation, and indeed seemed to be required for activation of relatively few genes. Nevertheless, a significant proportion of the few clr6-1 downregulated genes (P=3.8E−2) were affected by the 15-min exposure to TSA, indicating that some of these genes are likely direct targets of Clr6. In conclusion, as judged from the expression profiles of the corresponding HDAC mutants, all four HDACs have nonoverlapping roles in repression of gene expression, except for Sir2 and Clr3 that share several target genes. In addition, only Hos2 seems to have a major role in activation of gene expression. Altogether, these expression profiles reveal that the four HDACs have a substantial role in regulating gene expression, since at least 30% of all genes (1481/4976) are targets for their activity.
Histone acetylation patterns of highly expressed genes
An important question is whether there are any obvious relationships between gene expression in logarithmically growing cells and the genomewide histone acetylation patterns. Another question is to what extent the different HDACs contribute to the particular acetylation pattern and whether this is functionally important for rapid growth. To begin to address these questions, we determined the average wt gene expression profile from 11 independent measurements using RNA samples taken at mid-logarithmic growth phase.
Next, we carried out genomewide histone acetylation measurements in wt cells using PCR-amplified input material labeled with Cy3, and ChIP material labeled with Cy5 and hybridized to IGR+ORF microarrays. We used antibodies against five acetylation sites (described above) as well as the H3 cter antibody to control for nucleosome density. To illustrate the genomewide relationships between gene expression, histone acetylation and nucleosome density, we performed moving average (MA) plots (Figure 4). For all MA plots we separated multicopy genes and single-copy genes to avoid potential confusion of differentially active gene copies. As previously reported in budding yeast (Bernstein et al, 2004; Lee et al, 2004), we found a tendency in fission yeast for a reduced histone content in the IGRs and ORFs of highly expressed genes (Figure 4A and B). The H3 cter corrected histone acetylation versus gene expresson MA plots revealed a strong positive trend for H3K9Ac in IGRs (Figure 4C). A similar tendency for high H3K9Ac levels was observed in the ORFs of highly expressed genes (Figure 4D). In contrast to H3K9Ac, H4K16Ac levels had a genomewide tendency to be low in ORFs of highly expressed genes. Thus, it was clear that highly expressed genes have low amounts of histones and that the H3K9Ac modification is enriched in the few histones which remain associated with IGRs and ORFs of highly expressed genes. In sharp contrast to H3K9Ac, the H4K16Ac modification is low in ORFs of highly expressed genes. The H3K9Ac effect is possibly caused by transcriptional initiation and elongation-coupled H3-directed HAT activity (see Discussion).
Figure 4.
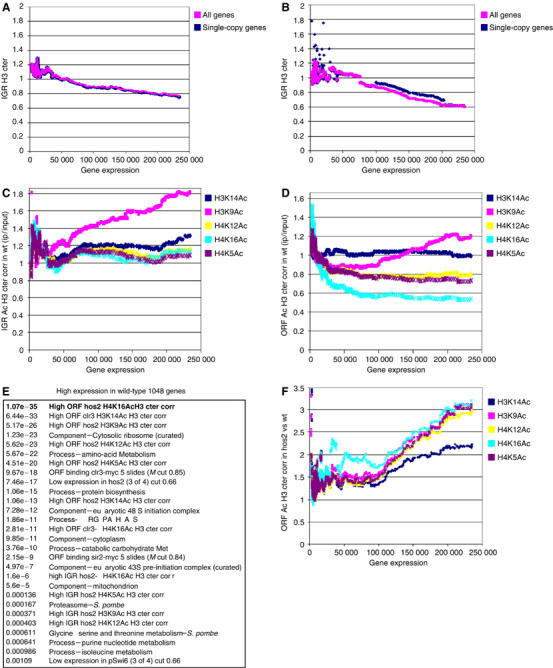
Nucleosome density, histone acetylation, high gene expression and the role of Hos2. (A–D, F) The MA plots (window size=150; step size=1) plotted as a function of average wt transcription in 11 measurements taken at mid-logarithmic growth. In all, 199 multicopy genes were removed from the data set in all the graphs except ‘all genes'. (A) MA plot of H3 cter ChIP in IGRs of wt cells. (B) MA plot of H3 cter ChIP in ORFs of wt cells. (C) MA plot H3 cter corrected IP/input IGR acetylation ratios for five histone acetylation sites in wt cells. (D) MA plot H3 cter corrected IP/input ORF acetylation ratios for five histone acetylation sites in wt cells. (E) The highly expressed genes list (1048 genes) was compared with H3 cter corrected histone acetylation ratios for HDAC mutants/wt. The hypergeometric probability P values are shown. See the text for details. (F) The MA plot of five H3 cter corrected acetylation ratios (as indicated) in hos2Δ/wt is plotted as a function of average wt transcription.
A role for Hos2 in promoting gene expression
The reduced wt H4K16Ac levels in ORFs of highly expressed genes was surprising to us, since acetylation levels in general positively correlated with high gene expression. A clue to how the different HDACs contribute to the acetylation patterns of highly expressed genes came from hypergeometric distribution tests. Ranking lists of 1048 genes, that on average were highly expressed, and 992 genes that showed low expression, were established from the wt expression profile. Hypergeometric distribution tests revealed that a large fraction of the highly expressed genes showed a high H3 cter corrected H4K16Ac ratio of the ORF regions in hos2Δ mutant compared to wt (Figure 4E; 287 highly expressed of 810 high ORF H4K16Ac in hos2Δ; P=1.07E−35). This indicated that the Hos2 enzyme is responsible for removing primarily H4K16Ac, but also acetylation at the other sites assayed from the ORFs of highly expressed genes. Notably, H3K14Ac was affected in ORFs of highly expressed genes by clr3Δ (P=6.44E−33). This is a direct effect since, by ChIP on CHIP (described below), Clr3-myc binds to ORFs of highly expressed genes (P=9.67E−18). Sir2-myc also binds to ORFs of highly expressed genes (P=2.15E−9). However, there was no significant overlap between genes downregulated in clr3Δ or sir2Δ and highly expressed genes in wt. This is possibly due to the redundant functions of Sir2 and Clr3 (See below). In contrast, when comparing the highly expressed genes with genes downregulated in hos2Δ, there was a very good overlap (159 highly expressed of 455 downregulated genes; P=7.46E−17). We found that a high proportion of highly expressed genes with low H4K16Ac are involved in cellular processes such as protein biosynthesis and major metabolic pathways (Figure 4E). This prompted us to investigate whether Hos2 is particularly important for rapid growth, so we carried out growth rate measurements for cultures of hos2Δ cells and wt control cells. It was clear that the logarithmic growth rate was 17% slower in hos2Δ cells (Supplementary data and Figure S3). Thus, some acetylation sites, in particular H4K16Ac, showed a negative correlation with high gene expression in logarithmically growing cells. Furthermore, Hos2 seems to be required to remove H4K16Ac mainly from ORFs of highly active genes, in order to boost their expression.
Sir2 and Clr3 act together throughout the genome, including the silent and subtelomeric chromosomal regions
Sir2 and Clr3 have been implicated in transcriptional repression at a discrete number of silenced loci, often through analysis of reporter genes. To address the genomewide roles, we analyzed the histone acetylation changes in genes, which become highly expressed in clr3Δ and sir2Δ mutants. The expression profile data suggested that there is a close link between Clr3 and Sir2 in repression, and that some of the regulated genes also depend on Swi6. The roles in euchromatic gene repression are novel functions for Clr3 and Sir2. Therefore, we wished to determine whether these were direct or indirect effects. Secondly, we wanted to examine the extent of physical overlap between Clr3 and Sir2 gene targets. To this end, we used ChIP on CHIP to create chromosomal binding maps for the epitope-tagged Sir2 and Clr3 proteins. The Sir2-myc-tagged allele was previously shown to be functional (Freeman-Cook et al, 2005). The Clr3-myc allele was tested for mating type silencing and shown to maintain wt function (Supplementary data Figure S3). Using a statistical cutoff for binding (median percentile ranking; Supplementary data Figure S2) Sir2-myc binding was detected at 292 IGR and 582 ORF fragments, and Clr3-myc binding was detected at 349 IGR and 451 ORF fragments throughout the genome. To compare the binding maps for the two enzymes, we used hypergeometric distribution tests (Supplementary data; Tables 1 and 2). Remarkably, 53% of the Sir2 IGR-binding sites were also Clr3 IGR-binding sites (2.95E−240), and 33% of the Sir2 ORF-binding sites were also Clr3 ORF-binding sites (1.81E−153). Thus, the two enzymes have significantly overlapping binding maps. Importantly, the hypergeometric distribution comparisons of Clr3-myc-bound fragments showed that the most significant H3 cter corrected acetylation change in clr3Δ mutant as compared to wt was increased H3K14Ac both in Clr3-bound IGR (1.5E−17) and ORF (2.52E−24) regions. For Sir2-myc-bound fragments, the most significant H3 cter corrected acetylation change in sir2Δ mutant as compared to wt was increased H3K9Ac both in Sir2-bound IGR (3.78E−36) and ORF (3.69E−30) regions.
To further analyze the Clr3- and Sir2-bound regions, we compared the lists of bound regions where we also saw changes in H3K14Ac and H3K9Ac, respectively, with acetylation and expression data (Figure 5). In all, 47 IGR fragments which bind Clr3 and show high H3K14Ac in clr3Δ overlapped significantly with other acetylation increases for the other four acetylation sites tested in clr3Δ, as well as with binding of Sir2 and acetylation increases in sir2Δ. Notably, the subtelomeric 0–25 kb regions and silent regions (cen, mat, tel, rDNA) overlapped significantly with Clr3 binding and high H3K14Ac in clr3Δ (Figure 5A). Similarly, the 113 IGR fragments which bind Sir2 and show high H3K9Ac in sir2Δ overlapped significantly with other acetylation increases for the other four sites tested in sir2Δ, as well as with binding of Clr3 and acetylation increases in clr3Δ. Again, the silent regions overlapped significantly with Sir2 binding and high H3K9Ac in sir2Δ (Figure 5C). Thus, analysis of IGR-binding and acetylation changes reinforced the notions that Sir2 and Clr3 are closely linked throughout the genome, including the silent regions, and that the most significant acetylation sites are H3K14Ac for Clr3 and H3K9Ac for Sir2.
Figure 5.
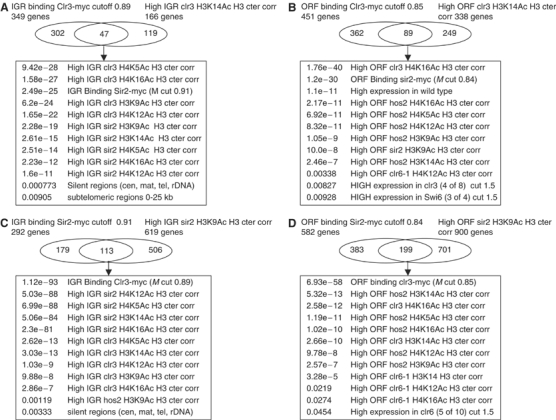
Analysis of Sir2 and Clr3 ‘ChIP on CHIP' binding and histone acetylation in sir2Δ and clr3Δ mutants. The hypergeometric probability comparisons of Clr3- and Sir2-bound genomic fragments which show high H3K14Ac and H3K9Ac changes in sir2Δ and clr3Δ mutants (Supplementary data Tables 1 and 2). (A) IGR binding of Clr3-myc/high H3K14Ac in clr3Δ; (B) ORF binding of Clr3-myc high H3K14Ac in clr3Δ; (C) IGR binding of Sir2-myc/H3K9Ac in sir2Δ; (D) ORF binding of Sir2-myc/high H3K9Ac in sir2Δ. (A–D) Similar lists and the corresponding hypergeometric probability are shown by the inserted textboxes. The list ‘silent regions (cen, mat, tel, rDNA)' includes 23 fragments on the microarray representing these regions.
We next analyzed the Clr3- or Sir2-bound ORF fragments with high H3K14Ac levels in clr3Δ and H3K9Ac in sir2Δ (Figure 5B and D). In addition to reciprocal overlaps with sir2Δ and clr3Δ, we noticed significant overlaps with high ORF acetylation in hos2Δ and clr6-1. For Clr3-bound ORF fragments with high H3K14Ac levels in clr3Δ, there was a significant fraction of ORFs being derepressed in clr3Δ (P=0.00827), indicating that these ORFs are direct targets for Clr3 in gene repression. Thus, the analysis of Sir2 and Clr3 ORF binding further strengthened the conclusion that the two enzymes act intimately together, but in comparison with IGR regions there was a more substantial involvement of other HDACs, that is, Hos2 and Clr6, at these ORFs.
Effect of a cold wash in the ChIP protocol on HDAC binding
It was recently reported that cold wash in the ChIP protocol (Kurdistani et al, 2002) may lead to binding of HDACs to highly expressed genes (including gene for ribosomal proteins) as part of a cold stress response (Robert et al, 2004). We tested the influence of this cold wash on HDAC binding by performing parallel ChIP experiments with and without the cold wash. By comparing the gene lists for highly expressed genes with the lists of Clr3-myc and Sir2-myc, we found that omitting the ice-cold wash actually led to slightly more significant binding to highly expressed genes in S. pombe (Supplementary data Table 3). For example, without the ice-cold wash 107 of 279 Clr3-myc-bound ORFs (P=9.99E−14) were highly expressed, and with the ice-cold wash 99 of 274 Clr3-myc-bound ORFs were highly expressed. Therefore, it seems as though, in contrast to Rpd3 in budding yeast, the fission yeast HDACs for which binding was investigated, Clr3 and Sir2, do not show such a stress response.
A role for Clr6 in promoter-mediated gene repression
Considering the prominent genomewide role of the Clr6 HDAC portrayed above, it was important to further define its role in regulating gene expression. Expression profiling showed that 256 genes were upregulated and 11 genes were downregulated in the clr6-1 mutant as compared to wt (Figure 3). By comparing the Clr6-regulated genes to the acetylation maps in our database, we found that IGR acetylation was significantly increased at 72 of 256 upregulated genes in clr6-1 (P=8.39E−13), whereas no significant acetylation changes were detected with the downregulated genes. This indicated that the principal role of Clr6 is in gene repression mediated through the IGR regions. We then compared the 256 clr6-1 derepressed genes with all of the different acetylation sites measured in clr6-1, and significant overlaps were detected with high H3 cter corrected IGR acetylation of all the five sites, that is, H3K9Ac (P=3.35E−6), H3K14Ac (P=4.72E−6), H4K5Ac (P=1.4E−9), H4K12Ac (P=1.6E−7) and H4K16Ac (P=1.48E−7). In contrast, no significant overlaps were found between Clr6 repressed genes and acetylation changes in the ORF regions, indicating that the primary effect of Clr6 in gene repression is mediated via the promoter regions present in the IGR fragments.
Next, the cellular processes and components affected by Clr6 were examined. To this end, we used the set of 72 genes repressed by Clr6 in which IGR acetylation of at least one of the sites was increased (Figure 6). In all, 35 of the 57 genes showed acetylation increases in the promoter (IGR) region at three or more of the five sites measured, and 14 genes showed high acetylation for all five sites, indicating that Clr6 is indeed a broad-specificity enzyme in vivo. We compared our data with data sets from previous studies of S. pombe expression profiling during meiosis (Mata et al, 2002) and under environmental stress (Chen et al, 2003). Remarkably, 71% of the 72 Clr6 repressed genes with high IGR acetylation in clr6-1 are induced during meiosis (P=8.83E−14), and 46% of the 72 genes are induced by environmental stress (P=4.44E−12). Therefore, it is clear that Clr6 has an important role in repressing the meiotic and stress-induced transcriptional programs in rapidly growing cells. Altogether, these observations point to a principal role for the Clr6 enzyme in promoter (IGR)-mediated repression of genes that are not needed in fast-growing cells.
Figure 6.
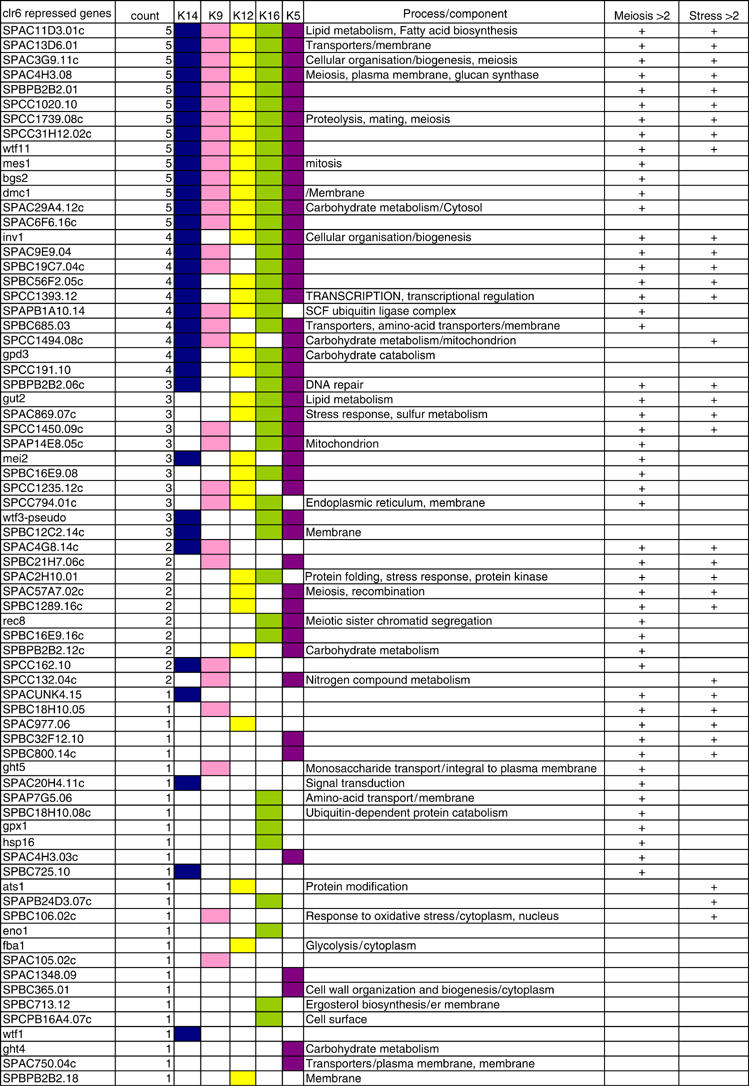
Comparison of Clr6 enzyme activity at IGRs of genes repressed by Clr6. A list of gene names for 72 Clr6 repressed genes (cut off 1.5) for which acetylation is increased in the IGR regions as compared to wt. The ‘count' indicates at how many of the five acetylation sites which IGR acetylation increased, and the colored boxes indicate each site affected by Clr6. The processes and components column indicates the GO associations found for each gene. In the meiosis column (>2.0-fold), a plus sign indicates if a given gene is upregulated during meiosis (Mata et al, 2002), and in the stress (>2.0-fold) column a plus sign indicates if the gene is upregulated at any of the published data sets for environmental stress (Cd, heat, H2O2 or sorbitol) (Chen et al, 2003).
Analysis of subtelomeric regions
In addition to the known silent regions, we wanted to test to what extent S. pombe has any other large chromosomal regions under HDAC control. By examining the chromosomal view of the wt high gene expression profile, it was obvious that quite large regions (up to 200 kb) at the telomeres contained a high proportion of repressed and relatively few highly expressed genes. To investigate if this effect is statistically significant, we employed χ2 tests, which indicated that only at tel1L (chromosome I left telomere) there was highly significant clustering of repressed genes (Figure 7, top panel). In this 200-kb region of tel1L, there are 61 genes of which 27 are repressed in wt cells (Figure 7, middle panel).
Figure 7.
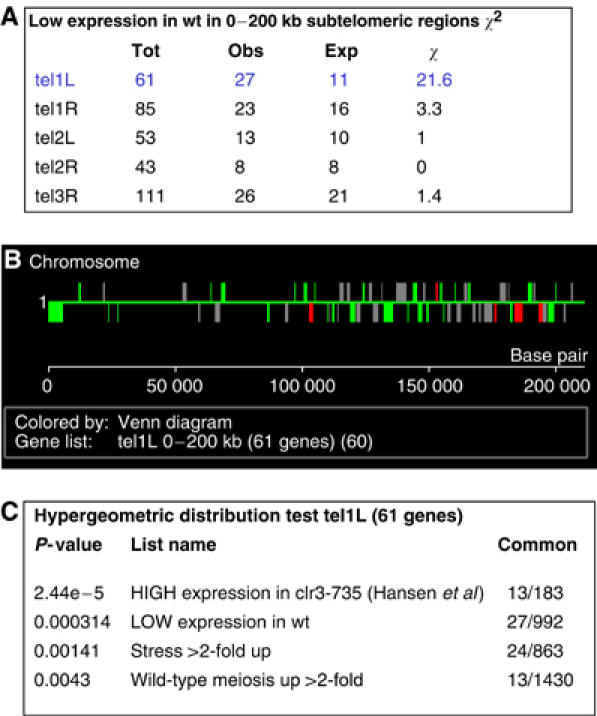
Analysis of subtelomeric regions. (A) χ2 analyses of gene expression in the 0–200 kb subtelomeric regions of S. pombe. The critical value for χ2 at P=0.001 is 10.8; thus, only the tel1L clustering of low gene expression is significant. (B) Chromosomal views of high and low wt gene expression in the subtelomeric region of tel1L. High expression (red), low gene expression (green) and intermediate gene expression (grey) are indicated. (C) Hypergeometric distribution test of the 61 genes located at tel1L and the corresponding P-values are shown in the inserted textbox.
To investigate the extent to which the different HDACs regulate histone acetylation in these regions, we compared the 61 genes in the tel1L 0–200 kb interval with our database. We also constructed lists of genes that reside in different subtelomeric intervals (25 kb, increments) away from the telomere. Hypergeometric distribution tests were used to determine whether these gene lists overlapped with any of the acetylation and binding maps. It was clear from this analysis that Clr3-binding and H3 cter corrected H3K14Ac in clr3Δ was increased in IGRs up to 25 kb away from the telomeres (Figure 5A). In total, 13 of the 61 genes at tel1L showed high expression in clr3-735 (Hansen et al, 2005), and a significant proportion of the 61 genes at tel1L are induced by environmental stress and in meiosis (Figure 7, bottom panel). Thus, Clr3 affects large subtelomeric regions, in particular cen1L, which contain a high proportion of mitotically repressed and stress- and meiosis-induced genes.
Discussion
We have carried out a systematic study of members of each of the three HDAC classes in S. pombe, using an integrated approach combining cDNA expression profiling, with newly built nucleosome density maps, histone acetylation maps of five different acetylation sites and HDAC binding. To accomplish this, we first developed an IGR and a full coverage combined (IGR+ORF) DNA microarray for S. pombe. By comparing histone acetylation patterns and HDAC binding in intergenic and coding regions with gene expression profiles, we were able to address several important questions: Where in the genome do HDACs act—ORF or IGR regions? Do HDACs affect nucleosome density? What are the in vivo specificities of the HDACs? Which HDACs act in the silent heterochromatin regions? Are there large chromosomal regions under HDAC control?
We observe that Clr6 is the principal enzyme that functions in promoter-localized repression. Sir2 and Hos2 prevent nucleosome loss. Sir2 and Clr3 act cooperatively upon histone H3 at K9/K14 throughout the genome, including all the silent regions (rDNA, centromeres, mat2/3 and telomeres). Clr3 affects the subtelomeric regions. Hos2 has an unexpected role in promoting high expression of growth-related genes by deacetylating H4K16Ac in their ORFs. Thus, this combined genomic approach has uncovered different roles for fission yeast HDACs at the silent regions in repression and activation of gene expression.
Sir2 and Hos2 prevent nucleosome loss
Several recent studies indicate that nucleosomes are not uniform across the budding yeast genome (Boeger et al, 2003, 2004; Reinke and Horz, 2003; Schwabish and Struhl, 2004). Genomewide approaches have shown that this tendency is of general significance (Bernstein et al, 2004; Lee et al, 2004). For this reason, it is necessary to correct measurements of histone modification for histone content. Otherwise, nucleosome-rich regions may appear as more heavily modified and nucleosome-poor regions may appear as less modified than they really are. Surprisingly, mutations in two of the HDACs in this study, Sir2 and Hos2, resulted in marked reduction of histone occupancy. This effect could be due to increased transcription in the sir2Δ and hos2Δ mutants, which would displace histones. However, this is unlikely since clr6-1 affected more genes than sir2Δ and still did not display nucleosome loss to the same extent as sir2Δ. Another possibility is that Sir2 and Hos2 have specific roles in preventing nucleosome loss. It was recently shown that the remodeling factor Chd1 and the H3K4 histone methyltransferase Set1 are responsible for modifying newly recruited nucleosomes to ORF regions upon shut-off of transcription (Zhang et al, 2005). Sir2 and Hos2 could facilitate recruitment of nucleosomes in such a process or they could act during elongation to recruit nucleosomes after passage of the RNA polymerase.
Hos2 stimulates transcription by affecting H4K16Ac in ORFs
Hos2 is required for high expression of growth-related genes and hos2Δ cells grow slowly compared to wt, indicating that it has a function in promoting rapid growth. Furthermore, H4K16 acetylation is generally low in ORF regions of highly active genes in rapidly growing wt cells. Our histone H3 cter control data show that there is a genomewide tendency for low nucleosome content in the chromatin of highly expressed fission yeast genes similar to that reported in budding yeast (Bernstein et al, 2004; Lee et al, 2004). However, the H3 cter corrected H4K16Ac in hos2Δ shows a positive correlation and the H3 cter corrected acetylation at four other sites show a less marked positive correlation with wt gene expression. Thus, it seems as if Hos2 has a role in removing these acetylation marks, in particular H4K16Ac, from ORFs of highly expressed genes. It is curious why an HDAC would affect the coding regions rather than the promoter. Previous studies indicated that H3 acetylation in the coding regions facilitates transcriptional elongation, and that the ‘elongator' complex contains the Elp3 HAT (Kristjuhan et al, 2002). Interestingly, we found that H3K9Ac and H3K14Ac are enriched in IGRs and ORFs of highly expressed genes. This effect is possibly caused by HATs such as Elp3 (fission yeast 77% identical homolog SPAC29A4.20) or Gcn5. The effect we observe with Hos2 and H4K16Ac seems to be contradictory to the effect of such putative elongator HATs. Therefore, it will be interesting to determine if elongation-coupled HAT activities are important at highly expressed genes in fission yeast cells, and if so how that relates to the Hos2 effect. The H3 acetylation bias towards ORF regions that we observed in wt cells may indicate that H3 HATs are indeed prominent at ORF regions in S. pombe.
Clr3 and Sir2 act jointly at silent regions
We found that Clr3 and Sir2 enzymes share many target genes, primarily in silent heterochromatin regions of S. pombe. This finding is novel and very consistent with previous observations of the silencing phenotypes of clr3Δ and sir2Δ. Both enzymes are required for efficient rDNA silencing, centromere silencing, telomere silencing and mating type silencing (Bjerling et al, 2002; Shankaranarayana et al, 2003; Freeman-Cook et al, 2005). We found that both Sir2 and Clr3 enzymes bind significantly to fragments from all four of the silent regions by ChiP on CHIP, and must therefore act directly at these regions. Our Sir2 ChIP data are consistent with that recently reported (Freeman-Cook et al, 2005). In budding yeast, Sir2 acts alone without help from other HDACs in the heterochromatin regions (Robyr et al, 2002). In fission yeast, we have demonstrated that Clr3 and Sir2 act jointly throughout the genome, including all of the silent regions. To our knowledge, the observed link between Sir2 and Clr3, that is, a link between a Sirtuin (Class III HDAC) and a class II HDAC, is unprecedented. Future studies will establish if this cooperativity is a general feature in eukaryotes.
Regarding the specificity of the two enzymes, fission yeast Sir2 has been shown to act on H3K9Ac and H4K16Ac in vitro (Shankaranarayana et al, 2003). The budding yeast and mouse enzymes both act on H3K9Ac H3K14Ac and H4K16Ac (Imai et al, 2000). Our ChIP on CHIP acetylation microarray analysis shows that H3K9Ac is the most relevant change for the genomewide list of Sir2 IGR- and ORF-binding targets (Supplementary data Table 1). For Clr3, it was shown to preferentially affect H3K14Ac by Western analysis of bulk histone preparations (Bjerling et al, 2002). Our in vivo data support the biochemical observation that Clr3 has a preference for deacetylating H3K14Ac, since this acetylation site is most significantly increased in clr3Δ at the IGRs and ORFs that bind Clr3 (Supplementary data Table 2). However, other significant high IGR acetylation sites detected here were not revealed by the previous analysis of the bulk histone preparations. Therefore, it is possible that the Clr3 enzyme is more promiscuous than we previously thought. Future in vitro measurements of Clr3 activity should resolve this and enable specificity comparisons with the orthologous enzyme Hda1 in budding yeast, which is specific for H3 and H2B in vivo (Wu et al, 2001; Robyr et al, 2002).
Similarities in genomewide HDAC functions between evolutionary distant yeasts
By comparing basic cellular processes such as cell cycle control in diverse organisms, such as the evolutionary distant yeast species S. pombe and S. cerevisiae, which diverged more than 800 million years ago, it has been possible to determine conserved regulatory factors that are shared in many eukaryotes (Nurse et al, 1998). Since class I and II HDACs diverged before the S. pombe and S. cerevisiae split in evolution (Bjerling et al, 2002), and since class III HDACs also are represented in both yeasts, comparative studies such as ours are important in defining to give general eukaryotic HDAC functions.
Perhaps the most striking similarity between the two evolutionary distant yeasts is the conservation of Hos2 function. In budding yeast, Hos2 binds ORFs of active genes and has an important role in gene activation (Wang et al, 2002). Budding yeast Hos2 deacetylates histone H3 and H4 sites, including H4K16. Recently, histone H4K16 hypoacetylation was linked to binding of the Bdf1 bromodomain-containing transcription factor to active genes and their promoter regions (Kurdistani et al, 2004). Therefore, it seems clear that Hos2 has a similar function in the two yeasts in promoting high gene expression through interaction with the ORFs. Interestingly, there is a conserved 39% identical Bdf1 homolog in S. pombe (SPCC1450.02), presenting the intriguing possibility that the effect on gene expression of Hos2 in S. pombe could be mediated by the transcription factor Bdf1.
Another similar function shared by HDAC orthologs is the role of S. pombe Clr6 and S. cerevisiae Rpd3 in promoter-mediated gene repression. By comparing genomewide enzyme activity maps with gene expression profiling, it was found in S. cerevisiae that Rpd3 represses 65 of 493 genes which show acetylation changes in rpd3Δ (P=1.2E−19), and there was little overlap between genes activated by Rpd3 and acetylation changes in rpd3Δ (Robyr et al, 2002). Similarly, in fission yeast we find significant overlap between Clr6 repression and acetylation changes in clr6-1 (see above), and there was no significant overlap between genomewide acetylation changes and genes activated by Clr6. Hence, Clr6 and Rpd3 are both mainly repressors of gene expression in rapidly growing cells.
A second similarity between the two orthologs is that of broad enzyme specificity uncovered by enzyme activity maps. Both enzymes act on several sites in histone H3 and H4. Clr6 has previously been shown to have a broad substrate specificity by Western analysis of bulk histone preparations (Bjerling et al, 2002), and to be active on both histone H3 and H4 peptides in vitro (Nakayama et al, 2003). We show here that gene expression changes in clr6-1 agree well with genes with low wt IGR acetylation at H4 K5, K12, K16 and H3 K9 and K14, and that these IGR fragments increased their IGR acetylation in clr6-1 mutant cells (Figure 6). In budding yeast, Rpd3 acts on many sites in H3 and H4, and of these sites H4K5 and H4K12 correlate best with Rpd3 repressed genes (Robyr et al, 2002). Both of these sites also correlate well with Clr6 targets in S. pombe (Figure 6).
A third similarity between the two enzymes is the good overlap between genes repressed by Clr6/Rpd3 and genes repressed by the HDAC inhibitor TSA (Bernstein et al, 2000). In both yeasts, a small but still significant proportion of the few genes found to be downregulated in the rpd3Δ and clr6-1 mutants were also downregulated by TSA, indicating that a few of these may represent direct enzyme targets (Figure 2B) (Bernstein et al, 2000).
It is interesting to note that the (class II) orthologs spClr3 and scHda1 both contribute to silencing in the subtelomeric regions, although the actual organization of the subtelomeric chromosomal regions is different between S. pombe and S. cerevisiae. In budding yeast, there are distinct Hda1 affected subtelomeric (HAST) domains 10–25 kb away from the telomere at 22 of 32 chromosome ends, which contain a high proportion of normally repressed genes that are induced in adverse conditions (Robyr et al, 2002). In fission yeast, Clr3 affects primarily H3K14Ac acetylation 0–25 kb away from the telomeres (Figure 5A) and gene expression primarily at tel1L, where it is involved in mitotic repression of stress- and meiosis-induced genes (Figure 7). It is plausible that the different extent of subtelomeric histone deacetylation spreading reflects differences in nuclear organization between the two yeasts.
An interesting difference between the two yeasts is seen from the phylogenetic grouping of the Class III HDACs (Frye, 2000). For class I and II, there are simple orthologous relationships between the yeasts, that is, RPD3/Clr6, HOS2/Hos2 and HDA1/Clr3; hence, comparative analysis of their conserved basic function is relatively straightforward. In the case for the Sirtuins (Class III HDACs), budding yeast clearly has additional gene duplications in the Hst4 and Sir2 branches of the phylogenetic tree as compared to fission yeast. In budding yeast, Hst1 has a genomewide role in gene regulation of euchromatic genes (Robert et al, 2004), whereas Sir2 seems to be specialized for heterochromatin functions (Robyr and Grunstein, 2003). In fission yeast, our study clearly shows that Sir2 has a role in both euchromatin and heterochromatin functions. Hence, it is possible that these gene duplications in budding yeast are associated with new specialized gene functions.
Finally, in both yeasts H3K9Ac and H4K16Ac are Sir2 substrates in vitro. However, a difference is that H4K16ac is a clearly important in vivo substrate in S. cerevisiae heterochromatin, but not in S. pombe, where we show that H3K9Ac is the most important in vivo substrate. This difference may reflect the important role for unacetylated H4K16 in providing a binding site for Sir3 at the heterochromatin of budding yeast (Kristjuhan et al, 2002). In contrast, the H4 amino-terminus is not important in S. pombe heterochromatin (Mellone et al, 2003). Instead, S. pombe heterochromatin requires deacetylated and methylated H3K9, which provides a binding site for the heterochromatin protein Swi6 (Bannister et al, 2001; Nakayama et al, 2001). Thus, interestingly, Sir2 has an analogous role in heterochromatin formation in both yeast species, but the crucial histone substrate is different.
Materials and methods
Microarray data analysis
Expression profiling was carried out according to Xue et al (2004). We used the IGR and the IGR+ORF microarrays (produced at Eurogentec ASG, Belgium custom DNA microarray services) for ChiP on CHIP. For acetylation maps, the ChiP on CHIP procedure described by Robyr and Grunstein (2003) was used, and corrections for nucleosome loss were carried out by ChIP with the H3 cter antibody (Ab1791, Abcam). For HDAC binding (Clr3-myc and Sir2-myc), ChIP was performed according to Kurdistani et al (2002), also with the modification to the protocol of leaving out the cold PBS wash. We used 1.5–3.0 μg 9E10 monoclonal antibody against Myc (Sigma) for each IP. The data were analyzed using Gene Spring v 7.2 (Silicon Genetics). To correct for nucleosome loss, we first filtered out flagged H3 cter IP data points and then calculated the median of minimum 3 data points for each mutant ChIP experiment (hos2Δ, clr3Δ, sir2Δ and clr6-1). Then, H3 cter mut IP data were divided by H3 cter IP data for wt. Finally, the IP data for each acetylated site (H3K4Ac, H3K9Ac, H4K5Ac, K12Ac or K16Ac) were divided by the correction ratio (C). For example, if we wanted to calculate the H3 cter corrected acetylation data for H4K5Ac in the clr6 mutant, then A=H3 cter clr6 (ratio), B=H3 cter wt (ratio), C=A/B. Corrected acetylation value=clr6 in H4K5Ac (ratio)/C.
The expression profiling and histone acetylation data were normalized using Lowess (per spot per chip) intensity-dependent normalization, which corrects for nonlinear rates for dye incorporation. Cutoff values of 1.5 and 2.0, respectively, were used to produce gene lists (ORF and IGR) with relatively high or low expression/H3 cter corrected acetylation as compared to wt. The HDAC-binding data were normalized per chip (using the 50th percentile). We then employed the median percentile ranking method (Buck and Lieb, 2004) to define statistical ChIP enrichment cutoff values. For this, a minimum of eight data points were used. This analysis provided statistical cutoff values for Sir2-myc IGR (0.91%), Sir2-myc ORF (0.84%), Clr3-myc IGR (0.89%) and Clr3-myc ORF (0.85%) (Supplementary Figure S2). For complete microarray data sets, see NCBI GEO submission GSE2879. For further details, see Supplementary data.
Supplementary Material
Supplementary data
Supplementary Figure Legends
Figure S1
Figure S2
Figure S3
Acknowledgments
KE is a Royal Swedish Academy of Sciences Research Fellow supported by grants from Knut and Alice Wallenberg Foundation, Swedish Cancer Society, Swedish Research Councils; VR-M, VR-NT, SSF and EU ‘The Epigenome' network. This work was initiated during a short sabbatical stay for KE in MG's laboratory at UCLA, supported by the Royal Swedish Academy of Sciences, Swedish Cancer Society and VR-NT. We thank Driss Talibi (Eurogentec SA), Stefan Haas (Berlin) and Anthony Wright (Huddinge) for their kind help with the DNA microarray design. Support in the laboratories of LP and MG is from the NIH.
References
- Bannister AJ, Zegerman P, Partridge JF, Miska EA, Thomas JO, Allshire RC, Kouzarides T (2001) Selective recognition of methylated lysine 9 on histone H3 by the HP1 chromo domain. Nature 410: 120–124 [DOI] [PubMed] [Google Scholar]
- Bernstein BE, Liu CL, Humphrey EL, Perlstein EO, Schreiber SL (2004) Global nucleosome occupancy in yeast. Genome Biol 5: R62. [DOI] [PMC free article] [PubMed] [Google Scholar]
- Bernstein BE, Tong JK, Schreiber SL (2000) Genomewide studies of histone deacetylase function in yeast. Proc Natl Acad Sci USA 97: 13708–13713 [DOI] [PMC free article] [PubMed] [Google Scholar]
- Bjerling P, Silverstein RA, Thon G, Caudy A, Grewal S, Ekwall K (2002) Functional divergence between histone deacetylases in fission yeast by distinct cellular localization and in vivo specificity. Mol Cell Biol 22: 2170–2181 [DOI] [PMC free article] [PubMed] [Google Scholar]
- Boeger H, Griesenbeck J, Strattan JS, Kornberg RD (2003) Nucleosomes unfold completely at a transcriptionally active promoter. Mol Cell 11: 1587–1598 [DOI] [PubMed] [Google Scholar]
- Boeger H, Griesenbeck J, Strattan JS, Kornberg RD (2004) Removal of promoter nucleosomes by disassembly rather than sliding in vivo. Mol Cell 14: 667–673 [DOI] [PubMed] [Google Scholar]
- Buck MJ, Lieb JD (2004) ChIP-chip: considerations for the design, analysis, and application of genome-wide chromatin immunoprecipitation experiments. Genomics 83: 349–360 [DOI] [PubMed] [Google Scholar]
- Chen D, Toone WM, Mata J, Lyne R, Burns G, Kivinen K, Brazma A, Jones N, Bahler J (2003) Global transcriptional responses of fission yeast to environmental stress. Mol Biol Cell 14: 214–229 [DOI] [PMC free article] [PubMed] [Google Scholar]
- De Nadal E, Zapater M, Alepuz PM, Sumoy L, Mas G, Posas F (2004) The MAPK Hog1 recruits Rpd3 histone deacetylase to activate osmoresponsive genes. Nature 427: 370–374 [DOI] [PubMed] [Google Scholar]
- Freeman-Cook L, Gomez E, Spedale E, Marlett J, Forsburg SL, Pillus L, Laurensson P (2005) Conserved locus-specific silencing functions of S. pombe sir2+. Genetics 169: 1243–1260 [DOI] [PMC free article] [PubMed] [Google Scholar]
- Frye RA (2000) Phylogenetic classification of prokaryotic and eukaryotic Sir2-like proteins. Biochem Biophys Res Commun 273: 793–798 [DOI] [PubMed] [Google Scholar]
- Haas SA, Hild M, Wright AP, Hain T, Talibi D, Vingron M (2003) Genome-scale design of PCR primers and long oligomers for DNA microarrays. Nucleic Acids Res 31: 5576–5581 [DOI] [PMC free article] [PubMed] [Google Scholar]
- Hansen KR, Burns G, Mata J, Volpe TA, Martienssen RA, Bahler J, Thon G (2005) Global effects on gene expression in fission yeast by silencing and RNA interference machineries. Mol Cell Biol 25: 590–601 [DOI] [PMC free article] [PubMed] [Google Scholar]
- Imai S, Armstrong CM, Kaeberlein M, Guarente L (2000) Transcriptional silencing and longevity protein Sir2 is an NAD-dependent histone deacetylase. Nature 403: 795–800 [DOI] [PubMed] [Google Scholar]
- Kristjuhan A, Walker J, Suka N, Grunstein M, Roberts D, Cairns BR, Svejstrup JQ (2002) Transcriptional inhibition of genes with severe histone h3 hypoacetylation in the coding region. Mol Cell 10: 925–933 [DOI] [PMC free article] [PubMed] [Google Scholar]
- Kurdistani SK, Grunstein M (2003) Histone acetylation and deacetylation in yeast. Nat Rev Mol Cell Biol 4: 276–284 [DOI] [PubMed] [Google Scholar]
- Kurdistani SK, Robyr D, Tavazoie S, Grunstein M (2002) Genome-wide binding map of the histone deacetylase Rpd3 in yeast. Nat Genet 31: 248–254 [DOI] [PubMed] [Google Scholar]
- Kurdistani SK, Tavazoie S, Grunstein M (2004) Mapping global histone acetylation patterns to gene expression. Cell 117: 721–733 [DOI] [PubMed] [Google Scholar]
- Kuzmichev A, Zhang Y, Erdjument-Bromage H, Tempst P, Reinberg D (2002) Role of the Sin3-histone deacetylase complex in growth regulation by the candidate tumor suppressor p33(ING1). Mol Cell Biol 22: 835–848 [DOI] [PMC free article] [PubMed] [Google Scholar]
- Lee CK, Shibata Y, Rao B, Strahl BD, Lieb JD (2004) Evidence for nucleosome depletion at active regulatory regions genome-wide. Nat Genet 36: 900–905 [DOI] [PubMed] [Google Scholar]
- Lo WS, Trievel RC, Rojas JR, Duggan L, Hsu JY, Allis CD, Marmorstein R, Berger SL (2000) Phosphorylation of serine 10 in histone H3 is functionally linked in vitro and in vivo to Gcn5-mediated acetylation at lysine 14. Mol Cell 5: 917–926 [DOI] [PubMed] [Google Scholar]
- Mata J, Lyne R, Burns G, Bahler J (2002) The transcriptional program of meiosis and sporulation in fission yeast. Nat Genet 32: 143–147 [DOI] [PubMed] [Google Scholar]
- Mellone B, Ball L, Suka N, Grunstein M, Partridge JF, Allshire R (2003) Centromere silencing and function in fission yeast is governed by the amino terminus of histone H3. Curr Biol 20: 1748–1757 [DOI] [PubMed] [Google Scholar]
- Nakayama J, Rice JC, Strahl BD, Allis CD, Grewal SI (2001) Role of histone H3 lysine 9 methylation in epigenetic control of heterochromatin assembly. Science 292: 110–113 [DOI] [PubMed] [Google Scholar]
- Nakayama J, Xiao G, Noma K, Malikzay A, Bjerling P, Ekwall K, Kobayashi R, Grewal SI (2003) Alp13, an MRG family protein, is a component of fission yeast Clr6 histone deacetylase required for genomic integrity. EMBO J 22: 2776–2787 [DOI] [PMC free article] [PubMed] [Google Scholar]
- Nurse P, Masui Y, Hartwell L (1998) Understanding the cell cycle. Nat Med 4: 1103–1106 [DOI] [PubMed] [Google Scholar]
- Reinke H, Horz W (2003) Histones are first hyperacetylated and then lose contact with the activated PHO5 promoter. Mol Cell 11: 1599–1607 [DOI] [PubMed] [Google Scholar]
- Robert F, Pokholok DK, Hannett NM, Rinaldi NJ, Chandy M, Rolfe A, Workman JL, Gifford DK, Young RA (2004) Global position and recruitment of HATs and HDACs in the yeast genome. Mol Cell 16: 199–209 [DOI] [PMC free article] [PubMed] [Google Scholar]
- Robyr D, Grunstein M (2003) Genomewide histone acetylation microarrays. Methods 31: 83–89 [DOI] [PubMed] [Google Scholar]
- Robyr D, Suka Y, Xenarios I, Kurdistani SK, Wang A, Suka N, Grunstein M (2002) Microarray deacetylation maps determine genome-wide functions for yeast histone deacetylases. Cell 109: 437–446 [DOI] [PubMed] [Google Scholar]
- Rundlett SE, Carmen AA, Kobayashi R, Bavykin S, Turner BM, Grunstein M (1996) HDA1 and RPD3 are members of distinct yeast histone deacetylase complexes that regulate silencing and transcription. Proc Natl Acad Sci USA 93: 14503–14508 [DOI] [PMC free article] [PubMed] [Google Scholar]
- Schwabish MA, Struhl K (2004) Evidence for eviction and rapid deposition of histones upon transcriptional elongation by RNA polymerase II. Mol Cell Biol 23: 10111–10117 [DOI] [PMC free article] [PubMed] [Google Scholar]
- Shankaranarayana GD, Motamedi MR, Moazed D, Grewal SI (2003) Sir2 regulates histone H3 lysine 9 methylation and heterochromatin assembly in fission yeast. Curr Biol 13: 1240–1246 [DOI] [PubMed] [Google Scholar]
- Suka N, Suka Y, Carmen AA, Wu J, Grunstein M (2001) Highly specific antibodies determine histone acetylation site usage in yeast heterochromatin and euchromatin. Mol Cell 8: 473–479 [DOI] [PubMed] [Google Scholar]
- Taunton J, Hassig CA, Schreiber SL (1996) A mammalian histone deacetylase related to the yeast transcriptional regulator Rpd3p. Science 272: 408–411 [DOI] [PubMed] [Google Scholar]
- Wang A, Kurdistani SK, Grunstein M (2002) Requirement of Hos2 histone deacetylase for gene activity in yeast. Science 298: 1412–1414 [DOI] [PubMed] [Google Scholar]
- Wu J, Suka N, Carlson M, Grunstein M (2001) TUP1 utilizes histone H3/H2B-specific HDA1 deacetylase to repress gene activity in yeast. Mol Cell 7: 117–126 [DOI] [PubMed] [Google Scholar]
- Xue Y, Haas SA, Brino L, Gusnanto A, Reimers M, Talibi D, Vingron M, Ekwall K, Wright AP (2004) A DNA microarray for fission yeast: minimal changes in global gene expression after temperature shift. Yeast 21: 25–39 [DOI] [PubMed] [Google Scholar]
- Zhang L, Schroeder S, Fong N, Bentley DL (2005) Altered nucleosome occupancy and H3K4 methylation in response to ‘transcriptional stress'. EMBO J (published online 9 June 2005) [DOI] [PMC free article] [PubMed] [Google Scholar]
Associated Data
This section collects any data citations, data availability statements, or supplementary materials included in this article.
Supplementary Materials
Supplementary data
Supplementary Figure Legends
Figure S1
Figure S2
Figure S3