


Abstract
Gene regulatory networks (GRNs) provide a global representation of how genetic/genomic information is transferred in living systems and are a key component in understanding genome regulation. Single-cell multiome data provide unprecedented opportunities to reconstruct GRNs at fine-grained resolution. However, the inference of GRNs is hindered by insufficient single omic profiles due to the characteristic high loss rate of single-cell sequencing data. In this study, we developed scMultiomeGRN, a deep learning framework to infer transcription factor (TF) regulatory networks via unique integration of single-cell genomic (single-cell RNA sequencing) and epigenomic (single-cell ATAC sequencing) data. We create scMultiomeGRN to elucidate these networks by conceptualizing TF network graph structures. Specifically, we build modality-specific neighbor aggregators and cross-modal attention modules to learn latent representations of TFs from single-cell multi-omics. We demonstrate that scMultiomeGRN outperforms state-of-the-art models on multiple benchmark datasets involved in diseases and health. Via scMultiomeGRN, we identified Alzheimer’s disease-relevant regulatory network of SPI1 and RUNX1 for microglia. In summary, scMultiomeGRN offers a deep learning framework to identify cell type-specific gene regulatory network from single-cell multiome data.
Graphical Abstract
Graphical Abstract.

Introduction
Defining transitions between cell identities and states is critical for understanding the mechanisms of biological development and human disease [1–3]. Consequently, exploring these transitions could shed light on the underlying processes of biological development and human disease [4–7]. Gene regulatory networks (GRNs) describe complex interactions between transcriptional regulators and multiple cis-regulatory DNA sequences, playing crucial roles in determining cell identities [8]. Identifying architecture and functionality of GRNs cell heterogeneity in human health and disease paves the way for novel approaches in cell reprogramming, discovers disease mechanisms, and advances therapeutic development [9].
Transcription factors (TFs) are proteins that specifically bind to DNA sequences, working alone or with other proteins/genes to regulate gene expression [10–12]. The complex regulatory interactions amongs TFs are commonly represented as TF-mediated GRNs [13]. GRNs provide a comprehensive view of how genetic and genomic information is transferred in living systems and are a critical component in understanding gene expression processes [14, 15]. Identifying the network modules and motifs within GRNs that underlie their topological structure and organizational patterns, can reveal transcriptional regulatory mechanisms in biological development and evolution [16]. Conventional methods for building GRNs have primarily relied on deciphering the interactions between TFs and their target genes. Due to the complexity of GRNs, systematic identification of GRNs across multiple human cell types using experimental approaches is extremely difficult. Genome-scale sequencing technologies, such as single-cell RNA sequencing (scRNA-seq) and single-cell ATAC sequencing (scATAC-seq) approaches, enable the collection of large-scale transcriptomic and epigenomic profiles, paving the way for systematic identification of GRNs [17].
With the rapid development of high-throughput sequencing technology, GRNs’ analysis at the single-cell level has become feasible [18]. Yet, common computational methods primarily measure gene co-expression patterns based on correlation coefficients or mutual information [19, 20], which cannot handle high-dimensional data and are sensitive to noise. In recent years, with the great success of deep learning in natural language processing, researchers have increasingly begun to explore the application of deep learning to the inference of GRNs for complex diseases [such as Alzheimer’s disease (AD)], thereby exploring the pathogenesis of the disease and predicting potential drugs [21, 22]. For example, Xie et al. developed a screening workflow that combines advanced artificial intelligence and classic wet laboratory methods to identify novel mitochondrial autophagy regulators as potential candidate drugs for AD treatment [23]. In order to gain a deeper understanding of the potential gene regulation of AD, Zhu et al. proposed a single-cell regulatory network method based on graph learning to identify potential regulatory mechanisms from single-cell data [22]. DeepSEM [24] introduced a structural equation model with a β-VAE framework to predict the regulatory relationship between genes in the GRN adjacency matrix. Yuan Y, Bar-Joseph Z. proposed a co-expression convolutional neural network (CNNC). CNNC carefully transforms the co-expression of gene pairs into image-like histograms to apply a convolutional neural networks (CNNs) for gene-gene relationship prediction [20]. However, most of these methods only focus on the regulatory relationship of gene pairs and fail to utilize the inherent global regulatory structure of GRNs with overall poor performance on rare cell types/subtypes with small number of cells [25–28]. Furthermore, integrating multi-omics datasets while avoiding the introduction of additional noise remains a substantial challenge [29, 30].
In this study, we present scMultiomeGRN, a deep learning framework that infers biologically relevant GRNs by unique integration of scRNA-seq and scATAC-seq data. Specifically, we posited GRNs as attribute graphs, wherein nodes represent TFs and incorporate features derived from both scRNA-seq and scATAC-seq profiling data. Edges denote genome regulatory relationships between TFs, characterized by gene expression (scRNA-seq) and chromatin accessibility (scATAC-seq). Subsequently, scMultiomeGRN learns TF representations by building modality-specific neighbor aggregators and cross-modal attention. By learning modality-specific neighborhood aggregators, we computed a set of representations for each TF, addressing the challenge of effectively integrating heterogeneous multi-omics data. We introduced a cross-modal attention module to calculate the final TF representation by accurately capturing modal heterogeneous representation of each TF, thereby learning the cross-omics nonlinear correlation. We demonstrated high performance of scMultiomeGRN in multiple single-cell multi-ome benchmark datasets (scRNA-seq and scATAC-seq) compared to state-of-the-art models. Via scMultiomeGRN, we identified pathobiology-specific GRNs for microglia using AD as a prototypical example.
Materials and methods
Datasets and preprocessing
Given that the choice of TFs for benchmarking may affect the final results, we used the following three standard ChIP-seq data for model testing.
We use the human fetal lung dataset [31] and the human adult hematopoietic differentiation dataset [32] for algorithm evaluation and comparison. The human fetal lung dataset collected 59 human fetal samples (estimated age between 89 and 125 days post-conception). For this data, we obtained scATAC-seq and scRNA-seq data from 72 622 cells containing nine cell types. The human adult hematopoietic differentiation dataset [32] analyzes the accessibility and transcriptomic state of immunophenotypic populations classified based on cell surface markers. We considered the cell populations analyzed with both the scATAC-seq and scRNA-seq datasets: hematopoietic stem cells (HSCs), common myeloid progenitors (CMPs), and granulocyte-macrophage progenitors (GMPs). In addition, For each scATAC-seq count matrix, we removed peaks detected in <10% of cells, and for each scRNA-seq count matrix, we removed genes detected in <10% of cells.
We use peripheral blood mononuclear cell (PBMC) data to explore cell-specific regulatory networks. This data contains 7189 (scATAC-seq) and 9129 (scRNA-seq) cells. Similar to reference [33], we preprocessed the scATAC-seq and scRNA-seq data. Specifically, we perform post-clustering on the cell count peaks of scATAC-seq data and the gene expression matrix of scRNA-seq data. Then, we used Seurat v.3 [33] for cell type annotation. We further analyzed five cell types with a higher number of cells in the scATAC-seq cluster, including CD14 + Monocytes (3447), CD4.Memory (874), CD4.Naive (589), CD8.effector (454), and CD8.Naive (361) cells.
We use the AD dataset [34] to explore GRNs changes in the development of AD, which includes matched whole genome sequencing data from 48 non-AD, 29 early AD, and 15 late AD individuals. This data includes transcriptional and epigenomic maps of 414 000 (snRNA-seq) and 437 000 individual nuclei (snATAC-seq). For this dataset, use the matrices of scATAC-seq and snATAC-seq data directly for analysis.
Construction of initial adjacency matrix
scMultiomeGRN is a graph based computational framework used to infer GRNs from single-cell multi-group data. Therefore, we first need to address a significant challenge, namely that the real network in GRNs inference studies is often unknown. In this study, we use scATAC-seq data combined with TF motif analysis to generate ground truth networks, an approach that has been successfully used in several studies. In the main text, the real network is represented by the initial adjacency matrix. The further details of its construction are as follows: (i) For each scATAC-seq count matrix, we remove peaks detected in <10% of cells. (ii) We used Fimo v5.1 to scan the remaining peaks for TF-binding sites using the “-thresh 1e-6” parameter. The interaction between two TFs is defined as the binding site of one TF located in the promoter of the other TF (TSS ± 2 kb). For TFs with redundant motifs, we merged their results, and one that satisfied our linkage criteria was accepted. (iii) Finally, the initial adjacency matrix of | N | × | N | is constructed, where N is the number of TFs. Binary values in the matrix indicate whether there is an regulatory relationship (1) or no regulatory relationship (0) between two TFs.
scMultiomeGRN
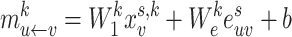
We build a graph convolutional network (GCN) model whose encoder first passes the initial network as input and will generate a latent representation for each TF node. Next, the TF interactions are re-established from the latent representation by the decoder. In addition, in order to better quantify the relationships in the regulatory network, we will construct two modules: a modality-specific neighbor aggregation module and a cross-modal attention layer module. Among them, modality-specific neighbor aggregation is used to aggregate neighbor information for different omics separately when aggregating neighbor information, and the cross-modal attention layer is used to add an attention mechanism when combining modal features.
Initial node features: In order to better integrate the features of different omics data, we used MAESTRO [35] to quantify the node ATAC features from the regulatory potential (RP) score of scATAC-seq data, which reflects the cumulative regulation of the scATAC-seq peak around a given gene in a given cell. For each scRNA-seq dataset, we used GRNBoost2 [36] to calculate TF gene relationships as RNA features from the scRNA-seq data.
Edge feature: The scRNA-seq gene expression profiles are represented as a two-dimensional matrix  , where
  represents the expression of TF in
  cell
cell  . We added a small pseudo-count to
  to avoid empty entries before applying log-normalization:
 |
(1) |
The joint histogram of TFs  and
and  (
( ) is generated by splitting
  and
and  (“−”: across all of the cells) into 16 bins, respectively. The value of each bin is derived from the number of cells that falls in the corresponding slot; this value is further log-normalized to avoid extreme values:
 |
(2) |
Finally, we define  as the edge feature
  between TF
  and
and  .
.
Modality-specific neighbor aggregation module: Since different omics contain different information, we treat each omics individually rather than combining all features via concatenation as the popular option. Therefore, we design a modality-specific neighbor aggregation module to compute each node  in
in  representations
  , ..,
, ..,  , where each
  is independently and uniquely represented by each omics obtained by the message passing function. It consists of two main operations: message propagation and message aggregation.
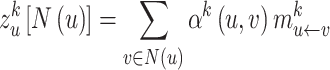
Message propagation: Define a message passing mechanism to aggregate the information of each node in the egocentric network  . Specifically, we introduce pairwise link communication features in egocentric networks to parameterize attention coefficients and messages aggregated from neighbors. Specifically, the feature
  transferred from node
  to
to  is:
is:
 |
(3) |
where  are the trainable weight matrices operating on node and edge features, respectively, and
  is the learnable bias vector. Then, the attention coefficient
  is defined as a function of node features
  and message embedding
  :
:
 |
(4) |
where  is a nonlinear term, such as LeakyRELU.
  is the weight moment,
  is the shared linear transformation applied to each node, and | | is the cascade operation. Then the softmax function is used to normalize the attention coefficients of all the neighbors of node
  :
:
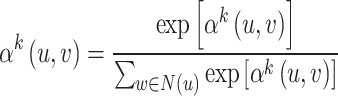 |
(5) |
Finally, we define the egocentric network representation  of node u on mode
  as:
as:
 |
(6) |
Message aggregation: We refine the representation of node  by aggregating neighbor features in
  . Furthermore, we consider self-joining
 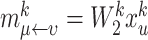 to preserve the knowledge of the original features. Specifically, we concatenate the egocentric network and the self-representation of node
  , and further transform the concatenated embeddings through the defined dense layer
  :
:
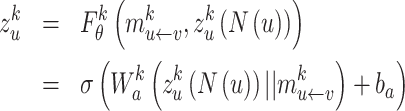 |
(7) |
where  are the trainable parameters of the aggregator, and
  is the Exponential Linear Units (ELU) activation function.
High-order propagation: We stack multiple neighbor aggregation layers to model high-order connection information, i.e. propagate features from  -hop neighbors [37]. The input to layer
  relies on the node representation output from layer
  , where the initial representation is set as the input node feature in mode
  . By stacking
  layers, we recursively construct the representation
  of node
  at the end of
  layer.
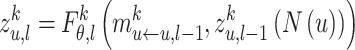 |
(8) |
Among them,  represents the representation of node
  in mode
  after the
  layer,
  represents the
  egocentric network representation of node
  . We use
  neighbor aggregation layers to generate the
  -layer representation
  of node
  in mode
  .
.
Cross modality attention: To learn complex nonlinear correlations between different feature modalities, we design a cross-modal attention mechanism. Specifically, we learn modal attention weights  to distinguish the influence of each modality
  , using a two-layer multilayer perceptron, defined as:
 |
(9) |
where  ,
, represents the weight matrix, and
  is the scalar deviation. The final representation
  of node
  is calculated by the weighted aggregation of layer
  mode-specific node representations
  , ..,
, ..,  . We define it as:
 |
(10) |
The inner product decoder uses  to reconstruct the connection structure of the network. When the decoder reconstructs the connections, it allows predictions to be made on unobserved parts of the graph. Finally, scMultiomeGRN outputs the reconstructed adjacency matrix
  , which is calculated as follows:
 |
(11) |
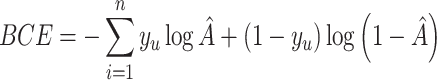
where  is the logistic sigmoid function. In the process of reconstructing GRNs, the goal of scMultiomeGRN is to optimize the pointwise binary cross entropy (BCE) loss:
 |
(12) |
where  represents the
  genes pair;
  is the label for the
  pair.
pair.
Dataset split
Because the number of negative samples (unknown regulatory relationship) in the initial network usually far exceeds that of positive samples (known regulatory relationship), resulting in a serious imbalance between positive and negative samples. To solve this problem, we adopted a tenfold crossover scheme based on the initial adjacency matrix to split the dataset. Specifically, we divide the elements with value “1” in the initial adjacency matrix into ten equally sized subsets. Then, we randomly select one of these ten subsets and form a test set with all positive links in this subset and an equal number of randomly sampled negative links (elements with a value of “0”). Then, all the remaining data is used as the training set.
Training details
We trained scMultiomeGRN using PyTorch v.2.4. Maximum iteration was set to 2000. Initial learning rate equaled to 1  . Adam optimizer and early stopping strategy were adopted.
Output organization
scMultiomeGRN belongs to a semi supervised generative model, and its output varies slightly between each run. In order to obtain robust results, for each prediction task, we aggregate the output results of ten runs as the final prediction. Firstly, we binarize the original output using the cutoff value of the median weight in the test set. We aggregate them into the final prediction by retaining at least six existing “1” values from only ten run results. Finally, the adjacency matrix was determined to represent the GRNs inferred by scMultiomeGRN.
Algorithm comparison
We used the published source code to run DeepTFni [25], DeepWalk [38], GENELink [39], scMTNI [40], SCRIP [41], and GENIE3 [42] on the human fetal lung dataset and human hematopoietic differentiation data to compare algorithm performance. Among them, DeepTFni and scMTNI require hyperparameter selection. In order to make a fair comparison, we followed the author’s tutorial to select hyperparameters for DeepTFni and scMTNI.
DeepTFni: We used the latest version of DeepTFni from https://github.com/sunyolo/DeepTFni. According to the author’s tutorial, we set the maximum number of iterations to 2000, the initial learning rate equal to  , and used the Adam optimizer with an early stopping strategy.
scMTNI: We obtained the scMTNI code to process the data, calculate various validation metrics, and perform dynamic network analysis from https://github.com/Roy-lab/scMTNI. scMTNI has five hyperparameters:  represents the probability of having an edge in the starting cell type;
  represents the probability of obtaining an edge in a daughter cell type d;
  represents the probability of keeping an edge in d with its immediate predecessor cell type; the sparsity penalty
  controls the penalty for adding edges; and
  controls the strength of merging previous networks. Following the author’s tutorial, different configurations of parameters were chosen:
  {0.1, 0.15, 0.2, 0.25, 0.3, 0.35, 0.4, 0.45, 0.5}, and
  {0.05, 0.1, 0.15, 0.2, 0.25, 0.3, 0.35, 0.4, 0.45}, and
  {0.55, 0.6, 0.65, 0.7, 0.75, 0.8, 0.85, 0.9},
  {−0.005, −0.01, −0.05, −0.1, −0.5},
  is set to 0.
Performance evaluation
To measure the accuracy of the predictive variables, we used the following metrics and reported the average record of multiple runs:
Accuracy. Accuracy refers to the proportion of correctly predicting the number of TF interactions to the total number of TF interactions.
Area under the receiver operating characteristic curve (AUROC). AUROC refers to the area under the receiver operating characteristic (ROC) curve. A higher AUROC value indicates that the algorithm has higher performance.
AUPR. Use the initial adjacency matrix as the basic fact and the weighted output matrix as the prediction to calculate the area under the precision-recall curve.
Results
Overview of scMultiomeGRN
We introduce scMultiomeGRN, a deep-learning model based on GCNs that is specifically designed for the precise inference of GRNs through unique integration of scRNA-seq and scATAC-seq data. The scMultiomeGRN model initiates by constructing an initial attribute graph of the GRNs, using both scATAC-seq data and TF motif analysis to generate putative TF–gene networks from open chromatin regions (Fig. 1A). We then obtained node (gene) features and known edge features using scRNA-seq and scATAC-seq data. Specifically, node ATAC features are quantified from RP scores from scATAC-seq data using MAESTRO [35], which reflect the cumulative regulation of scATAC-seq peaks around a given gene in a given cell. RNA-seq node features were represented by calculating TF–gene relationships from scRNA-seq data using GRNBoost2 [36] (Fig. 1B). Finally, we construct a deep-learning model based on GCNs, whose encoder first passes the initial network as input and will generate a latent representation for each TF node. Next, the TF interactions are re-established from the latent representation by the decoder (Fig. 1C).
Figure 1.

Overview of scMultiomeGRN workflow. scMultiomeGRN takes scATAC-seq and scRNA-seq data as input and consists of three steps. In the first step, (A) the GRNs skeleton is constructed, consisting of a set of maximum likelihood TF–TF interactions (links). The GRNs skeleton is represented by the initial adjacency matrix. (B) The second step is to calculate the characteristics of each TF node in each cell and the edge features between TF and TF. Finally, (C) the model construction and validation.
Within this model architecture, we design two specialized modules to enhance the quantification of relationships in the regulatory network (Fig. 1C): (i) a modality-specific neighbor aggregation module and (ii) a cross-modal attention layer module. The former is tailored to aggregate information from neighboring nodes (genes), separately for scRNA-seq and scATAC-seq data, thereby optimizing the use of diverse omics characteristics. The latter module employs an attention mechanism to integrate features from different omics, focusing on the most relevant features of each to enhance the combined representation of the GRNs. The detailed diagram of scMultiomeGRN was provided in Fig. 1.
Performance evaluation of scMultiomeGRN
To evaluate the performance of scMultiomeGRN, we first used scATAC-seq data combined with TF motif analysis to generate a biological context-specific GRNs. This approach has proven effective because open chromatin regions often contain active regulatory elements for TF binding and gene regulation [43, 44]. We applied scMultiomeGRN to scATAC-seq and scRNA-seq datasets of human lungs [31], as shown in Fig. 2A. This lung dataset covers a wide range of different cell types, ranging in number from hundreds to tens of thousands (Supplementary Table S1). We conducted cell type-specific analysis using scMultiomeGRN for each cell type. Specifically, a test accuracy exceeding 0.83 was achieved on different cell types (Supplementary Table S1). The new TF regulatory relationships are expected to increase 1.03–1.76-fold compared to original TF interactions (Supplementary Table S1). This high accuracy across different cell types reveals the reliability of scMultiomeGRN in predicting GRNs.
Figure 2.

Performance comparison of scMultiomeGRN with other methods based on lung dataset. (A) Visualization of the Uniform Manifold Approximation and Projection (UMAP) lung dataset using cell types. (B) scMultiomeGRN showed better accuracy, AUROC, and AUPR on nine cell types in lung data. (C) The difference between different models distinguishing positive TF interactions from negative TF interactions is measured by KL divergence on lymphoid cells. (D) scMultiomeGRN prediction accuracy in interference datasets with different masked positive ratios on lymphoid cells. (E) Recovery ratio of masked positives in scMultiomeGRN prediction results on lymphoid cells. Bubbles represent 10 perturbations of the dataset. (F) Comparison of model performance on different cell numbers on lymphoid cells.
We then compared scMultiomeGRN with several state-of-the-art methods, including DeepTFni [25], DeepWalk [38], GENELink [39], scMTNI [40], SCRIP [41], and GENIE3 [42]. Among them, DeepTFni [25], DeepWalk [38], and SCRIP [41] are models that have been successfully used to infer GRNs on scATAC-seq data. We apply them to the lung scATAC-seq dataset [31]. GENELink [39] and GENIE3 [42] are a method to predict GRNs based on transcriptomic data. We evaluated model performance using accuracy, the AUROC, and area under the accuracy-recall curve (AUPR). We found that scMultiomeGRN achieved the highest accuracy (avg: AUROC = 0.924 and AUPR = 0.790) on the test set of different cell types (Fig. 2B) compared to existing models GENIE3 (avg: AUROC = 0.540, P = 3.7e-04; AUPR = 0.242, P = 4.1e-04), DeepWalk (avg: AUROC = 0.614, P = 3.7e-04; AUPR = 0.292, P = 4.1e-05), scMTNI (avg: AUROC = 0.553, P = 3.7e-04; AUPR = 0.290, P = 4.1e-04), SCRIP (avg: AUROC = 0.638, P = 3.7e-04; AUPR = 0.644, P = 7.6e-04), DeepTFni (avg: AUROC = 0.871, P = 1.1e-03; AUPR = 0.721, P = 2.4e-02), GENELink (avg: AUROC = 0.900, P = 8.7e-03; AUPR = 0.758, P = 2.3e-02). As a semi-supervised learning method, scMultiomeGRN infers unknown GRNs based on the construction of initial GRNs. In order to prove the ability of the model to distinguish between known GRNs and unknown GRNs, we quantified the differences between two models by calculating the Kullback–Leibler (KL) divergence. Taking lymphoid cells [31] as an example, we found that the ability of scMultiomeGRN to distinguish between known GRNs and unknown GRNs (measured by KL value) is about 1.12 times that of GENELink, 3.98 times that of DeepTFni, and 34 times that of DeepWalk (Fig. 2C). These significant improvement of KL value indicates that scMultiomeGRN significantly enhanced its ability to identify novel (unknown) GRNs, highlighting its high prediction accuracy and discrimination in inferring GRNs.
To test the robustness of the model, we next turned to create multiple synthetic datasets by masking different proportions of positive samples against lymphoid cells in the lung data [31]. We found that scMultiomeGRN showed high consistency in these synthetic datasets masking different proportions of positive samples as well (Fig. 2D). Notably, the model recovered masked positive samples, demonstrating its ability to identify true regulatory relationships even in the presence of incomplete data (Fig. 2E), indicating high robustness of scMultiomeGRN.
In addition, to evaluate scMultiomeGRN’s ability to infer GRNs on rare cell types/subtypes. We focused on lymphoid cells in lung data for evaluation. Specifically, we divided the lymphoid cells data into nine groups and each group was randomly sampled 10 times, resulting in 90 different data sets for testing. As shown in Fig. 2F, scMultiomeGRN achieved higher AUROC and AUPR across different cell numbers. An interesting observation from this study is that the accuracy of all model predictions initially improved as the number of cells increased, eventually leveling off once the number of cells exceeded 50 (Fig. 2F). Together, these findings demonstrate that scMultiomeGRN can provide reliable predictions in inferring cell type-specific GRNs for rare cell types/subtypes as well.
Finally, to further test the effectiveness of scMultiomeGRN, we applied scMultiomeGRN to published human adult hematopoietic differentiation scATAC-seq and scRNA-seq datasets. This dataset analyzes the accessibility and transcriptomic status of immunophenotypic populations classified based on cell surface markers. Similar to scMTNI [40], we selected HSCs, CMPs, and GMPs for analysis. As shown in Supplementary Fig. S1, the performance of the supervised models (scMultiomeGRN, DeepTFni [38], and GENELink [39]) is significantly better than that of the unsupervised models (scMTNI [40], SCRIP [41], and GENIE3 [42]). In addition, scMultiomeGRN outperforms the second-ranked model (DeepTFni) by at least 2.5% and 4.6% in AUROC and AUPR metrics, respectively. Taken together, these results demonstrate that scMultiomeGRN can accurately infer unknown GRNs.
Ablation analysis of omics features on the scMultiomeGRN
We next turned to test whether scMultiomeGRN improves accuracy by integrating genomic (scRNA-seq) and epigenomic (scATAC-seq) features. We constructed two independent graph-based models: (i) one utilizing epigenomic features derived from scATAC-seq data, and (ii) the second only utilizing genomic features from scRNA-seq data. We found that a unique integration of scATAC-seq and scRNA-seq achieved higher accuracy compared to scATAC-seq or scRNA-seq alone (Fig. 3A and B and Supplementary Figs S2–S9). For scMultiomeGRN, the prediction scores between positive samples (known regulatory relationships) and negative samples (unknown regulatory relationships) form two independent distributions. The greater the difference between them, the more can scMultiomeGRN avoid introducing false positives and the better the prediction performance. We used the KL divergence to quantify the difference in distributions between positive samples and negative samples. The KL value increased significantly from 0.7410 and 0.8572 in the single-omics model to 1.7182 in the combination model of scRNA-seq and scATAC-seq features (Fig. 3C). This substantial improvement of KL highlights scMultiomeGRN’s ability to efficiently integrate scRNA-seq and scATAC-seq data in identifying novel GRNs beyond known GRNs. We also found that there was some discrepancy between GRNs predicted by scMultiomeGRN using only scRNA-seq or scATAC-seq features (Fig. 3D), suggesting that scRNA-seq and scATAC-seq features provide compelementary vectors for the scMultiomeGRN model (Supplementary Figs S2–S9). Taken together, these observations indicate that the unique integration of scRNA-seq and scATAC-seq under the scMultiomeGRN model can effectively reduce the high false positive problem caused by insufficient information of single-omics features compared to traditional scRNA-seq or scATAC-seq alone, thereby more accurately inferring GRNs.
Figure 3.

The impact of different omics features on model performance based on lymphoid cells. (A, B) Fusion of scRNA-seq and scATAC-seq features achieves the highest AUROC, AUPR and accuracy values. (C) Fusion of different node features to use scMultiomeGRN to distinguish the distribution of positive and negative links. (D) Venn diagram showing the overlap of TF interactions predicted by models with different node features.
scMultiomeGRN identifies biologically relevant GRNs
We next turned to apply scMultiomeGRN to a single-cell multiome dataset of human PBMC [38] (Fig. 4A). Firstly, we retained the first five cell types [CD14 + Monocytes (3447), CD4.Memory (874), CD4.Naive (589), CD8.effector (454), and CD8.Naive (361) cells] and performed scMultiomeGRN on each cell type separately (cf. ‘Materials and methods’ section). Via scMultiomeGRN, we successfully identified cell type-specific GRNs for all these five cell types (Fig. 4B). For instance, scMultiomeGRN identifies a regulatory network for SPI1 in CD14 + monocytes but not in lymphocytes (as shown in Fig. 4C and D). By examining scRNA-seq data, we found that SPI1 is expressed in up to 92% of CD14 + monocytes, while the expression rate in lymphocytes is <3% (4.06% in CD4.Memory; 2.55% in CD4.Naive; 0.54% in CD8.effector; 2.74% in CD8.Naive). This observation further confirmed the cell-type specificity of SPI1. Conversely, the regulatory network of KLF12 and GATA3 was inferred in lymphocytes but not in CD14 + monocytes (see Fig. 4E and F). This is also consistent with the expression patterns observed in scRNA-seq data, where KLF12 is expressed in a significant proportion of lymphocytes (∼20%, 24.62% in CD4.Memory; 15.56% in CD4.Naive; 24.54% in CD8.effector; 17.80% in CD8.Naive) but is present in <4% of CD14 + monocytes cells. Similarly, GATA3 showed ∼22.6% expression in lymphocytes (37.84% in CD4.Memory; 15.13% in CD4.Naive; 21.67% in CD8.effector; 17.80% in CD8.Naive), but only 0.4% in CD14 + monocytes cells (Fig. 5A and B). For lymphocytes, we found that scMultiomeGRN predicted the regulation of EGR4 only in CD4.Naive and CD4.Memory cells, and EGR4 was also transcriptionally activated only in CD4.Naive and CD4.Memory cells. (Fig. 5C and D). These results illustrate the ability of scMultiomeGRN to capture cell type-specific GRNs in a specific biological context.
Figure 4.

scMultiomeGRN is able to infer biologically meaningful GRNs. (A) Cell type UMAP visualization of human PBMC dataset. (B) Similarity between different cell types for each GRN. A TF degree vector was calculated for each cell type by assembling the number of predicted interactions for each TF. Similarities between different cell types were calculated on the TF degree vector using Pearson’s correlation coefficient. (C, D) Visualization of the SPI1 regulatory network predicted by scMultiomeGRN and the proportion of expression in different cell types. (E, F) Visualization of the KLF12 regulatory network predicted by scMultiomeGRN and the proportion of expression in different cell types.
Figure 5.

scMultiomeGRN is able to infer biologically meaningful GRNs. (A) Visualization of the GATA3 regulatory network predicted by scMultiomeGRN; (B) Visualization of cells expressing GATA3. The number indicates the proportion of cells with GATA3 expressed in each cell type. (C) Visualization of cells expressing EGR4. The number indicates the proportion of cells with EGR4 expressed in each cell type. (D) Visualization of the EGR4 regulatory network predicted by scMultiomeGRN. For lymphocytes, we found that scMultiomeGRN predicted the regulation of EGR4 only in CD4.Naive and CD4.Memory cells, and EGR4 was also transcriptionally activated only in CD4.Naive and CD4.Memory cells.
scMultiomeGRN identify disease-relevant GRNs in microglia
Identifying disease-relevant GRNs are critical for understanding disease pathogenesis and therapeutic development. We applied scMultiomeGRN to a comprehensive single-nuclei multiome dataset of human brains with AD, comprising scATAC-seq (414 000 individual nuclei) and scRNA-seq (437 000 individual nuclei) [34]. First, we compared the changes in regulatory networks in microglia (8600 nuclei) between normal and AD brains. We ultimately screened out the top 20 core TFs with dynamic GRNs (Supplementary Table S2). Interestingly, several of these core TFs have been implicated in crucial aspects of neuronal development and function. For example: TGIF1 [45], NFIA [46], NFIB [47], and CTCF [48], have been previously reported to be associated with AD. We further examined microglia-specific GRNs regulated by SPI1 [49] (also known as PU.1, a microglial TF) and RUNX1 [50] (a TF that regulates microglial maturation and proliferation). By comparing the extent of the regulatory network and changes in messenger RNA levels in normal and AD human brains, we observed a significant increase in regulatory interactions for SPI1 and RUNX1 in AD samples (Fig. 6A–D). Additionally, violin plots of SPI1 and RUNX1 motif variability within microglial clusters (scATAC-seq) revealed marked differences between normal and AD samples (Fig. 6E and F). A previous study have demonstrated that SPI1 and RUNX1 binding sites exhibit higher enrichment with known AD genetic loci from genome-wide association study [34]. In summary, we showed that scMultiomeGRN identified potential disease-releveant GRNs in microglia from AD brains and other cell types if broadly applied.
Figure 6.

Application of scMultiomeGRN on AD dataset. (A) Visualization of SPI1 regulatory networks in predicting normal and AD samples using scMultiomeGRN. (B) Visualization of RUNX1 regulatory networks in predicting normal and AD samples using scMultiomeGRN. (C, D) Visualization of RNA expression of SPI1 and RUNX1 in normal and AD samples. (E) Violin plot of SPI1 motif variability in snATAC-seq microglia clusters that had a significant difference between normal and AD samples, split by diagnosis. (F) Violin plot of RUNX1 motif variability in snATAC-seq microglia clusters that had a significant difference between normal and AD samples, split by diagnosis.
Discussion
Here, we propose scMultiomeGRN, a new deep learning model for inferring GRNs from scRNA-seq and scATAC-seq data. Different from previous models, scMultiomeGRN conceptualizes GRNs as an attribute graph, where nodes represent TFs and combines features from different omics data. In addition, we built two modules to aggregate feature information from scRNA-seq and scATAC-seq data: the modality-specific neighbor aggregation module and the cross-modal attention layer module. Among them, modality-specific neighbor aggregation is used to aggregate neighbor information of scRNA-seq and scATAC-seq data, respectively, when aggregating neighbor information, and the cross-modal attention layer is used to add an attention mechanism when combining omics features to learn non-Correlation between linear modes. We showed that scMultiomeGRN outperformed existing state-of-the-art methods in generating realistic regulatory networks, predictions under sample loss, and GRNs inference for rare cell types/subtypes. In addition, by analyzing the specificity of predicted GRNs, we can enhance the precision of various methods in inferring biologically significant GRNs. Such detailed assessments are crucial for elucidating the complex mechanisms of gene regulation and for understanding the etiology and progression of diseases. For example, scMultiomeGRN identified SPI1 and RUNX as core TF-regulatory roles in AD risk loci by comparing GRN alterations between normal and AD samples. In summary, scMultiomeGRN aims to integrate scRNA-seq and scATAC-seq data to infer the lack of interactions between TFs due to incomplete knowledge, and is more conducive to inferring the intrinsic information of GRNs structures.
We acknowledged several potential limitations in the current study. First, scMultiomeGRN uniquely integrates scRNA-seq and scATAC-seq data to facilitate inferring GRNs in multiple tissue-specific diseases. However, understanding spatially specific regulatory mechanisms among different tissues and organs remains a challenge. Future work should focus on incorporating spatial transcriptomics data to provide more comprehensive and detailed understanding, thereby facilitating more accurate inference of the topological structures and mechanisms of GRNs. Second, scMultiomeGRN relies heavily on the data quality of the ChIP-seq dataset. This significantly reduces the number of TFs after filtering out peaks detected in <10% of cells. Future work could extend scMultiomeGRN to make it less susceptible to dataset sparsity. Additionally, it is essential to extend the framework to include non-TF genes and to consider the causal regulatory relationship between TFs and their target genes. Finally, single-cell foundation models from both scRNA-seq and scATAC-seq will offer enriched multiome data to identify biologically relevant GRNs in the future.
Supplementary Material
Acknowledgements
Author contributions: X.Z. and F.C. conceived and designed the study; J.X., C.L., X.Z., and F.C. performed the research; J.X., C.L., S.J., and Y.M. collected and constructed the benchmark datasets; J.X., C.L., Y.M., and X.F. constructed the models; J.X., X.F., and R.N. completed downstream analysis work. J.X. and C.L. released the source code on Zenodo; J.X., C.L., and S.J. wrote the paper with input from all other authors. All authors read and approved the manuscript.
Contributor Information
Junlin Xu, School of Computer Science and Technology, Wuhan University of Science and Technology, Wuhan, Hubei 430065, China.
Changcheng Lu, College of Computer Science and Electronic Engineering, Hunan University, Changsha, Hunan 410082, China.
Shuting Jin, School of Computer Science and Technology, Wuhan University of Science and Technology, Wuhan, Hubei 430065, China.
Yajie Meng, School of Computer Science and Artificial Intelligence, Wuhan Textile University, Wuhan, Hubei 430200, China.
Xiangzheng Fu, School of Chinese Medicine, Hong Kong Baptist University, Hong Kong SAR 999077, China.
Xiangxiang Zeng, College of Computer Science and Electronic Engineering, Hunan University, Changsha, Hunan 410082, China.
Ruth Nussinov, Computational Structural Biology Section, Basic Science Program, Frederick National Laboratory for Cancer Research, National Cancer Institute at Frederick, Frederick, MD 21702, United States; Department of Human Molecular Genetics and Biochemistry, Sackler School of Medicine, Tel Aviv University, Tel Aviv 69978, Israel.
Feixiong Cheng, Cleveland Clinic Genome Center, Lerner Research Institute, Cleveland Clinic, Cleveland, OH 44195, United States; Genomic Medicine Institute, Lerner Research Institute, Cleveland Clinic, Cleveland, OH 44195, United States; Department of Molecular Medicine, Cleveland Clinic Lerner College of Medicine, Case Western Reserve University, Cleveland, OH 44195, United States; Case Comprehensive Cancer Center, Case Western Reserve University School of Medicine, Cleveland, OH 44106, United States.
Supplementary data
Supplementary data is available at NAR online.
Conflict of interest
None declared.
Funding
This project has been funded in whole or in part with federal funds from the National Cancer Institute, National Institutes of Health, under contract HHSN261201500003I to R.N. The content of this publication does not necessarily reflect the views or policies of the Department of Health and Human Services, nor does mention of trade names, commercial products, or organizations imply endorsement by the U.S. Government. This Research was supported [in part] by the Intramural Research Program of the NIH, National Cancer Institute, Center for Cancer Research to R.N.
Data availability
The human PBMC dataset includes 10 000 scATAC-seq data and scRNA-seq data downloaded from the 10x Genomics website (scATAC-seq: https://www.10xgenomics.com/resources/datasets/10-k-peripheral-blood-mononuclear-cells-pbm-cs-from-a-healthy-donor-1-standard-1-0-1; scRNA-seq data: https://support.10xgenomics.com/single-cell-gene-expression/datasets/3.0.0/pbmc_10k_v3.). The lung single-cell multiome dataset was downloaded from NCBI Gene Expression Omnibus (https://www.ncbi.nlm.nih.gov/geo/) under accession number GSM4508936. The scRNA-seq data for human hematopoietic differentiation from Buenrostro et al. were downloaded from Data S2 of Buenrostro et al. [51] (https://ars.els-cdn.com/content/image/1-s2.0-S009286741830446X-mmc4.zip) and the scATAC-seq data were downloaded from Chen et al. [52] (https://github.com/pinellolab/scATAC-benchmarking/tree/master/Real_Data/Buenrostro_2018). The Alzheimer’s disease single-nuclei multiome dataset was downloaded from https://www.synapse.org/#!Synapse:syn52293417.
All codes used in this study are freely available: https://doi.org/10.5281/zenodo.14848389
References
- 1. McKinley KL, Castillo-Azofeifa D, Klein OD Tools and concepts for interrogating and defining cellular identity. Cell Stem Cell. 2020; 26:632–56. 10.1016/j.stem.2020.03.015. [DOI] [PMC free article] [PubMed] [Google Scholar]
- 2. Mincarelli L, Lister A, Lipscombe J et al. Defining cell identity with single-cell omics. Proteomics. 2018; 18:e1700312. 10.1002/pmic.201700312. [DOI] [PMC free article] [PubMed] [Google Scholar]
- 3. Wagner A, Regev A, Yosef N Revealing the vectors of cellular identity with single-cell genomics. Nat Biotechnol. 2016; 34:1145–60. 10.1038/nbt.3711. [DOI] [PMC free article] [PubMed] [Google Scholar]
- 4. Faith JJ, Hayete B, Thaden JT et al. Large-scale mapping and validation of Escherichiacoli transcriptional regulation from a compendium of expression profiles. PLoS Biol. 2007; 5:e8. 10.1371/journal.pbio.0050008. [DOI] [PMC free article] [PubMed] [Google Scholar]
- 5. Fiers M, Minnoye L, Aibar S et al. Mapping gene regulatory networks from single-cell omics data. Brief Funct Genomics. 2018; 17:246–54. 10.1093/bfgp/elx046. [DOI] [PMC free article] [PubMed] [Google Scholar]
- 6. Goldman JA, Poss KD Gene regulatory programmes of tissue regeneration. Nat Rev Genet. 2020; 21:511–25. 10.1038/s41576-020-0239-7. [DOI] [PMC free article] [PubMed] [Google Scholar]
- 7. Hamey FK, Nestorowa S, Kinston SJ et al. Reconstructing blood stem cell regulatory network models from single-cell molecular profiles. Proc Natl Acad Sci USA. 2017; 114:5822–9. 10.1073/pnas.1610609114. [DOI] [PMC free article] [PubMed] [Google Scholar]
- 8. Pratapa A, Jalihal AP, Law JN et al. Benchmarking algorithms for gene regulatory network inference from single-cell transcriptomic data. Nat Methods. 2020; 17:147–54. 10.1038/s41592-019-0690-6. [DOI] [PMC free article] [PubMed] [Google Scholar]
- 9. Chan TE, Stumpf MPH, Babtie AC Gene regulatory network inference from single-cell data using multivariate information measures. Cell Syst. 2017; 5:251–67. 10.1016/j.cels.2017.08.014. [DOI] [PMC free article] [PubMed] [Google Scholar]
- 10. Akers K, Murali TM Gene regulatory network inference in single-cell biology. Curr Opin Syst Biol. 2021; 26:87–97. 10.1016/j.coisb.2021.04.007. [DOI] [Google Scholar]
- 11. Hu X, Hu Y, Wu F et al. Integration of single-cell multi-omics for gene regulatory network inference. Comput Struct Biotechnol J. 2020; 18:1925–38. 10.1016/j.csbj.2020.06.033. [DOI] [PMC free article] [PubMed] [Google Scholar]
- 12. Dibaeinia P, Sinha S SERGIO: a single-cell expression simulator guided by gene regulatory networks. Cell Syst. 2020; 11:252–71. 10.1016/j.cels.2020.08.003. [DOI] [PMC free article] [PubMed] [Google Scholar]
- 13. Van de Sande B, Flerin C, Davie K et al. A scalable SCENIC workflow for single-cell gene regulatory network analysis. Nat Protoc. 2020; 15:2247–76. 10.1038/s41596-020-0336-2. [DOI] [PubMed] [Google Scholar]
- 14. Bravo Gonzalez-Blas C, De Winter S, Hulselmans G et al. SCENIC+: single-cell multiomic inference of enhancers and gene regulatory networks. Nat Methods. 2023; 20:1355–67. 10.1038/s41592-023-01938-4. [DOI] [PMC free article] [PubMed] [Google Scholar]
- 15. Specht AT, Li J LEAP: constructing gene co-expression networks for single-cell RNA-sequencing data using pseudotime ordering. Bioinformatics. 2017; 33:764–6. 10.1093/bioinformatics/btw729. [DOI] [PMC free article] [PubMed] [Google Scholar]
- 16. Todeschini AL, Georges A, Veitia RA Transcription factors: specific DNA binding and specific gene regulation. Trends Genet. 2014; 30:211–9. 10.1016/j.tig.2014.04.002. [DOI] [PubMed] [Google Scholar]
- 17. Lambert SA, Jolma A, Campitelli LF et al. The human transcription factors. Cell. 2018; 172:650–65. 10.1016/j.cell.2018.01.029. [DOI] [PubMed] [Google Scholar]
- 18. Chen H, Pugh BF What do transcription factors interact with?. J Mol Biol. 2021; 433:166883. 10.1016/j.jmb.2021.166883. [DOI] [PMC free article] [PubMed] [Google Scholar]
- 19. Mitsis T, Efthimiadou A, Bacopoulou F et al. Transcription factors and evolution: an integral part of gene expression (Review). World Acad Sci J. 2020; 2:3–8. [Google Scholar]
- 20. Yuan Y, Bar-Joseph Z Deep learning for inferring gene relationships from single-cell expression data. Proc Natl Acad Sci USA. 2019; 116:27151–8. 10.1073/pnas.1911536116. [DOI] [PMC free article] [PubMed] [Google Scholar]
- 21. Aittokallio T, Fang EF Editorial overview-artificial intelligence methodologies in structural biology: bridging the gap to medical applications. Curr Opin Struct Biol. 2024; 87:102862. 10.1016/j.sbi.2024.102862. [DOI] [PubMed] [Google Scholar]
- 22. Zhu W, Du Z, Xu Z et al. SCRN: Single-Cell gene Regulatory Network Identification in Alzheimer’s Disease. IEEE/ACM Trans Comput Biol Bioinform. 2024; 21:1886–1896. 10.1109/TCBB.2024.3424400. [DOI] [PubMed] [Google Scholar]
- 23. Xie C, Zhuang XX, Niu Z et al. Amelioration of Alzheimer’s disease pathology by mitophagy inducers identified via machine learning and a cross-species workflow. Nat Biomed Eng. 2022; 6:76–93. 10.1038/s41551-021-00819-5. [DOI] [PMC free article] [PubMed] [Google Scholar]
- 24. Shu H, Zhou J, Lian Q et al. Modeling gene regulatory networks using neural network architectures. Nat Comput Sci. 2021; 1:491–501. 10.1038/s43588-021-00099-8. [DOI] [PubMed] [Google Scholar]
- 25. Li H, Sun Y, Hong H et al. Inferring transcription factor regulatory networks from single-cell ATAC-seq data based on graph neural networks. Nat Mach Intell. 2022; 4:389–400. 10.1038/s42256-022-00469-5. [DOI] [Google Scholar]
- 26. Chen S, Lake BB, Zhang K High-throughput sequencing of the transcriptome and chromatin accessibility in the same cell. Nat Biotechnol. 2019; 37:1452–7. 10.1038/s41587-019-0290-0. [DOI] [PMC free article] [PubMed] [Google Scholar]
- 27. Cao J, Cusanovich DA, Ramani V et al. Joint profiling of chromatin accessibility and gene expression in thousands of single cells. Science. 2018; 361:1380–5. 10.1126/science.aau0730. [DOI] [PMC free article] [PubMed] [Google Scholar]
- 28. Zhang M, Zou Y, Xu X et al. Highly parallel and efficient single cell mRNA sequencing with paired picoliter chambers. Nat Commun. 2020; 11:2118. 10.1038/s41467-020-15765-0. [DOI] [PMC free article] [PubMed] [Google Scholar]
- 29. Song L, Langfelder P, Horvath S Comparison of co-expression measures: mutual information, correlation, and model based indices. BMC Bioinformatics. 2012; 13:328. 10.1186/1471-2105-13-328. [DOI] [PMC free article] [PubMed] [Google Scholar]
- 30. Langfelder P, Horvath S WGCNA: an R package for weighted correlation network analysis. BMC Bioinformatics. 2008; 9:559. 10.1186/1471-2105-9-559. [DOI] [PMC free article] [PubMed] [Google Scholar]
- 31. Domcke S, Hill AJ, Daza RM et al. A human cell atlas of fetal chromatin accessibility. Science. 2020; 370:eaba7612. 10.1126/science.aba7612. [DOI] [PMC free article] [PubMed] [Google Scholar]
- 32. Ranzoni AM, Tangherloni A, Berest I et al. Integrative single-cell RNA-seq and ATAC-seq analysis of human developmental hematopoiesis. Cell Stem Cell. 2021; 28:472–87. 10.1016/j.stem.2020.11.015. [DOI] [PMC free article] [PubMed] [Google Scholar]
- 33. Stuart T, Butler A, Hoffman P et al. Comprehensive integration of single-cell data. Cell. 2019; 177:1888–902. 10.1016/j.cell.2019.05.031. [DOI] [PMC free article] [PubMed] [Google Scholar]
- 34. Xiong X, James BT, Boix CA et al. Epigenomic dissection of Alzheimer’s disease pinpoints causal variants and reveals epigenome erosion. Cell. 2023; 186:4422–37. 10.1016/j.cell.2023.08.040. [DOI] [PMC free article] [PubMed] [Google Scholar]
- 35. Wang C, Sun D, Huang X et al. Integrative analyses of single-cell transcriptome and regulome using MAESTRO. Genome Biol. 2020; 21:198. 10.1186/s13059-020-02116-x. [DOI] [PMC free article] [PubMed] [Google Scholar]
- 36. Moerman T, Aibar Santos S, Bravo Gonzalez-Blas C et al. GRNBoost2 and Arboreto: efficient and scalable inference of gene regulatory networks. Bioinformatics. 2019; 35:2159–61. 10.1093/bioinformatics/bty916. [DOI] [PubMed] [Google Scholar]
- 37. Sankar A, Liu Y, Yu J et al. Graph neural networks for friend ranking in large-scale social platforms. Proceedings of the Web Conference 2021. 2021; New York, NY, United States: Association for Computing Machinery; 2535–46. [Google Scholar]
- 38. Perozzi B, Al-Rfou R, Skiena S Deepwalk: online learning of social representations. Proceedings of the 20th ACM SIGKDD International Conference on Knowledge Discovery and Data Mining. 2014; New York: Association for Computing Machinery; 701–10. [Google Scholar]
- 39. Chen G, Liu ZP Graph attention network for link prediction of gene regulations from single-cell RNA-sequencing data. Bioinformatics. 2022; 38:4522–9. 10.1093/bioinformatics/btac559. [DOI] [PubMed] [Google Scholar]
- 40. Zhang S, Pyne S, Pietrzak S et al. Inference of cell type-specific gene regulatory networks on cell lineages from single cell omic datasets. Nat Commun. 2023; 14:3064. 10.1038/s41467-023-38637-9. [DOI] [PMC free article] [PubMed] [Google Scholar]
- 41. Dong X, Tang K, Xu Y et al. Single-cell gene regulation network inference by large-scale data integration. Nucleic Acids Res. 2022; 50:e126. 10.1093/nar/gkac819. [DOI] [PMC free article] [PubMed] [Google Scholar]
- 42. Huynh-Thu VA, Irrthum A, Wehenkel L et al. Inferring regulatory networks from expression data using tree-based methods. PLoS One. 2010; 5:e12776. 10.1371/journal.pone.0012776. [DOI] [PMC free article] [PubMed] [Google Scholar]
- 43. Neph S, Stergachis AB, Reynolds A et al. Circuitry and dynamics of human transcription factor regulatory networks. Cell. 2012; 150:1274–86. 10.1016/j.cell.2012.04.040. [DOI] [PMC free article] [PubMed] [Google Scholar]
- 44. Rendeiro AF, Schmidl C, Strefford JC et al. Chromatin accessibility maps of chronic lymphocytic leukaemia identify subtype-specific epigenome signatures and transcription regulatory networks. Nat Commun. 2016; 7:11938. 10.1038/ncomms11938. [DOI] [PMC free article] [PubMed] [Google Scholar]
- 45. Yang X, Wen J, Yang H et al. Functional characterization of Alzheimer’s disease genetic variants in microglia. Nat Genet. 2023; 55:1735–44. 10.1038/s41588-023-01506-8. [DOI] [PMC free article] [PubMed] [Google Scholar]
- 46. Kim BH, Nho K, Lee JM et al. Genome-wide association study identifies susceptibility loci of brain atrophy to NFIA and ST18 in Alzheimer’s disease. Neurobiol Aging. 2021; 102:200.e1–200.e11. 10.1016/j.neurobiolaging.2021.01.021. [DOI] [PubMed] [Google Scholar]
- 47. Dai DL, Li M, Lee EB Human Alzheimer’s disease reactive astrocytes exhibit a loss of homeostastic gene expression. Acta Neuropathol Commun. 2023; 11:127. 10.1186/s40478-023-01624-8. [DOI] [PMC free article] [PubMed] [Google Scholar]
- 48. Novikova G, Kapoor M, Tcw J et al. Integration of Alzheimer’s disease genetics and myeloid genomics identifies disease risk regulatory elements and genes. Nat Commun. 2021; 12:1610. 10.1038/s41467-021-21823-y. [DOI] [PMC free article] [PubMed] [Google Scholar]
- 49. Rustenhoven J, Smith AM, Smyth LC et al. PU.1 regulates Alzheimer’s disease-associated genes in primary human microglia. Mol Neurodegener. 2018; 13:44. 10.1186/s13024-018-0277-1. [DOI] [PMC free article] [PubMed] [Google Scholar]
- 50. Liang X, Wu H, Colt M et al. Microglia and its genetics in Alzheimer’s disease. Curr Alzheimer Res. 2021; 18:676–88. 10.2174/1567205018666211105140732. [DOI] [PMC free article] [PubMed] [Google Scholar]
- 51. Buenrostro JD, Corces MR, Lareau CA et al. Integrated single-cell analysis maps the continuous regulatory landscape of Human hematopoietic differentiation. Cell. 2018; 173:1535–48. 10.1016/j.cell.2018.03.074. [DOI] [PMC free article] [PubMed] [Google Scholar]
- 52. Chen H, Lareau C, Andreani T et al. Assessment of computational methods for the analysis of single-cell ATAC-seq data. Genome Biol. 2019; 20:241. 10.1186/s13059-019-1854-5. [DOI] [PMC free article] [PubMed] [Google Scholar]
Associated Data
This section collects any data citations, data availability statements, or supplementary materials included in this article.
Supplementary Materials
Data Availability Statement
The human PBMC dataset includes 10 000 scATAC-seq data and scRNA-seq data downloaded from the 10x Genomics website (scATAC-seq: https://www.10xgenomics.com/resources/datasets/10-k-peripheral-blood-mononuclear-cells-pbm-cs-from-a-healthy-donor-1-standard-1-0-1; scRNA-seq data: https://support.10xgenomics.com/single-cell-gene-expression/datasets/3.0.0/pbmc_10k_v3.). The lung single-cell multiome dataset was downloaded from NCBI Gene Expression Omnibus (https://www.ncbi.nlm.nih.gov/geo/) under accession number GSM4508936. The scRNA-seq data for human hematopoietic differentiation from Buenrostro et al. were downloaded from Data S2 of Buenrostro et al. [51] (https://ars.els-cdn.com/content/image/1-s2.0-S009286741830446X-mmc4.zip) and the scATAC-seq data were downloaded from Chen et al. [52] (https://github.com/pinellolab/scATAC-benchmarking/tree/master/Real_Data/Buenrostro_2018). The Alzheimer’s disease single-nuclei multiome dataset was downloaded from https://www.synapse.org/#!Synapse:syn52293417.
All codes used in this study are freely available: https://doi.org/10.5281/zenodo.14848389