

Abstract
Understanding the storage, flux, and turnover of nutrients in organisms is important for quantifying contributions of biota to biogeochemical cycles. Here we present a model that predicts the storage of phosphorus-rich RNA and whole-body phosphorus content in eukaryotes based on the mass- and temperature-dependence of ATP production in mitochondria. Data from a broad assortment of eukaryotes support the model's two main predictions. First, whole-body RNA concentration is proportional to mitochondrial density and consequently scales with body mass to the -1/4 power. Second, whole-body phosphorus content declines with increasing body mass in eukaryotic unicells but approaches a relatively constant value in large multicellular animals because the fraction of phosphorus in RNA decreases relative to the fraction in other pools. Extension of the model shows that differences in the flux of RNA-associated phosphorus are due to the size dependencies of metabolic rate and RNA concentration. Thus, the model explicitly links two biological currencies at the individual level: energy in the form of ATP and materials in the form of phosphorus, both of which are critical to the functioning of ecosystems. The model provides a framework for linking attributes of individuals to the storage and flux of phosphorus in ecosystems.
Keywords: growth rate hypothesis, metabolic theory of ecology, stoichiometry, allometry
Recent work in ecological stoichiometry has shown that understanding variation in the relative proportions of elements among organisms and between organisms and their environments provides useful insights into the functioning of ecological systems (1). The extent to which organisms sequester limiting nutrients may strongly influence biogeochemical cycles and thereby affect the structure and function of the plant, animal, and microbial communities that use these nutrients (1, 2). Since the pioneering work of Redfield in 1958 (3), we have learned that many plants and animals in natural conditions have an average molar ratio of carbon (C) to nitrogen (N) to phosphorus (P) of ≈106:16:1 (1, 3). Yet the mechanisms underlying this C:N:P ratio and the reasons for the observed deviations about this ratio remain unclear. C:P ratios of organisms in nature often deviate from the Redfield ratio by several-fold and may deviate by one to two orders of magnitude when nutrient availability is experimentally manipulated, particularly in plants (1, 4-6).
Special emphasis has been placed on understanding how and why P concentrations vary among organisms, partly because P is often a limiting nutrient in ecosystems and partly because P is a component of important biological molecules, including RNA, DNA, ATP, and phospholipids (1). Differences in whole-body P concentration have given rise to several hypotheses (e.g., refs. 7-9 in marine phytoplankton). Most frequently mentioned is the “growth rate hypothesis” of Elser et al. (10), which proposes that differences in whole-body P concentration among organisms are due to differences in concentrations of P-rich RNA (see also ref. 11). Indeed, Elser and colleagues (12) have shown that the P in RNA often constitutes a significant fraction of whole-body P in small organisms.
Here we build on this work by presenting a model that explicitly links whole-body P and RNA content to energy flux in organisms. The model relates concentrations of P and RNA to metabolic rate and predicts how they should vary with body size, the primary factor controlling metabolic rate. These predictions are supported by data from a broad assortment of organisms spanning nearly 14 orders of magnitude in size, including unicellular eukaryotes and multicellular vertebrate and invertebrate animals. The model shows how two fundamental biological currencies, energy and materials, are linked at the level of individual organisms. Such linkages have important implications for understanding the pools and fluxes of energy and materials at all levels of biological organization from molecules and organelles to organisms, communities, and ecosystems.
Model Development
The storage and flux of elements in an organism requires energy in the form of ATP. To quantify differences in RNA and whole-body P concentration among organisms, we therefore present a series of equations that link ATP production to whole-body RNA and P content. To do so, we first consider the primary factors controlling the rate of ATP production per unit of body mass (i.e., mass-specific metabolic rate), namely body size and temperature (Eqs. 1 and 2). Next, we express the rate of protein synthesis in terms of ATP production and RNA concentration (Eqs. 3 and 4). These equations then allow us to express RNA concentration as a function of body mass and temperature (Eq. 5) and then to relate it to whole-body P concentration (Eqs. 6 and 7). We conclude the derivation of our model by relating the P stored in RNA to its flux and turnover (Eq. 8). We note that this model is deliberately intended to be a simplified abstraction of a more complex reality. Although we recognize that many other factors may play some role in determining ATP production (e.g., ADP availability) and whole-body RNA and P content (e.g., nutrient availability), this model explicitly quantifies the effects of only the two primary factors: body size and temperature. Deviations from model predictions thus provide a baseline for assessing the effects of these other factors.
An organism's rate of energy production per unit of body mass, or mass-specific metabolic rate, B̄, may be expressed as the product of the rate of ATP production by an average-sized mitochondrion, νmito, and the average number of mitochondria per unit body mass, ρmito:
 |
[1] |
where EATP is the approximately invariant energy content of an ATP molecule [≈5.07 × 10⁻²⁰ J per ATP (13)]. Like other biochemical reaction rates, the rate of ATP production increases exponentially with temperature (14) over the usual operating range of temperatures for a species and is described by the Boltzmann or Arrhenius factor, e-Er/kT. Therefore, νmito = νoe-Er/kT, where νo is a normalization constant independent of temperature, Er is the average activation energy of the respiratory complex (≈0.65 eV = 62 kJ/mol), k is Boltzmann's constant (8.62 × 10⁻⁵ eV/K), and T is absolute temperature in K (15). Mitochondrial density, ρmito, has been shown to decrease with increasing body size as ρmito = ρoM-1/4 in endotherms (16-19), where ρo is a normalization constant independent of body size. We assume that ectotherms show this same size dependence for mitochondrial density. This assumption is supported by theory (20) and by empirical data showing that ectotherms and endotherms show the same size and temperature dependence for individual metabolic rate (15). Given the temperature dependence of νmito and the size-dependence of ρmito, Eq. 1 can therefore be expressed as
 |
[2] |
where bo = EATPνoρo is a normalization constant independent of body size and temperature that varies by an order of magnitude among taxa (3.90 × 10⁸ W/g3/4 for endotherms, 9.91 × 10⁷ W/g3/4 for multicellular ectotherms, and 2.77 × 10⁷ W/g3/4 for unicells) (ref. 15; see Methods). Note that the total rate of ATP production per unit of body mass has the same dependence on body size and temperature as B̄ in Eq. 2 because νmito ρmito = B̄/EATP and EATP is independent of body size and temperature.
Averaged over ontogeny, protein synthesis consumes a nearly constant fraction,  , of ATP production, independent of body mass (≈0.20) (21-23). Therefore, the amount of protein synthesized per unit of mass per unit of time, S, may be expressed as the product of the rate of ATP production for protein synthesis,
  , and the mass of protein produced per ATP, MAA/4:
 |
[3] |
where S is in units of grams of protein per gram of dry mass per second, MAA is the average mass of a single amino acid (≈1.8 × 10⁻²² g, calculated based on amino acid composition of proteins (24), and the factor 1/4 reflects the fact that four ATP are required to create a single peptide bond joining two amino acids (25, 26). Protein synthesis requires both energy in the form of ATP and ribosomal RNA to catalyze the formation of peptide bonds (1, 11). Thus, the rate of protein synthesis per unit mass may also be expressed as the product of the number of ribosomes per unit of mass, ([RNA]/MRNA), and the rate of protein synthesis per ribosome, (MAAsoe-Ep/kT):
 |
[4] |
Here [RNA] is the concentration of ribosomal RNA (mg of RNA per g of dry body mass), MRNA is the mass of RNA in a single ribosome (≈4.19 × 10⁻¹⁸ g for eukaryotes) (27), so is a rate constant independent of temperature (≈1 × 10¹¹ peptide bonds per ribosome per sec for eukaryotic ribosomes) (28, 29), and Ep is the effective activation energy for protein synthesis by a ribosome (≈0.65 eV) (30, 31). Ribosomal RNA comprises the vast majority of RNA in organisms (≈85%) (1) and is therefore a very good proxy for whole-body RNA concentration. Combining Eqs. 2, 3, 4 predicts the average whole-body RNA concentration of an organism:
 |
[5] |
Given that Ep ≈ Er as stated above (15, 30, 31) and, therefore, that e(Ep-Er)/kT ≈ 1, Ep and Er effectively cancel each other in the model. This cancellation occurs independent of any model assumptions. As such, Eq. 5 predicts that [RNA] should be approximately independent of temperature. This prediction is in agreement with experimental data (refs. 32-36; see Methods). We note, however, that this model is robust to small deviations in [RNA] with temperature because the exponential increase in the rate of protein synthesis by a ribosome over the temperature range 0-40°C (≈35-fold) is very large relative to observed changes in ribosome number with temperature [≈0-30% change in either direction, with a 7-15°C change in temperature (32-36)]. Eq. 5 quantifies the functional relationship between [RNA] and mass-specific metabolic rate, B̄ and, in doing so, shows that [RNA] is expected to scale as M-1/4.
We can quantify the contribution of P in RNA, [PRNA], to whole-body P content, [Pbody], by combining Eq. 5 with empirical data on the amount of P in other pools, [Pother] (e.g., phospholipids and skeletal structure) (1). Specifically, [Pbody] is equal to the sum of [PRNA] and [Pother]:
 |
[6] |
where ω is the fraction of RNA that is P (≈0.09 by mass) (1). The size-dependence of [PRNA] is governed by Eq. 5, and that of [Pother] is governed by CMβ, where C is a normalization constant independent of body size and temperature, and β is an exponent that characterizes the scaling of [Pother] with body mass. Among vertebrates, the majority of [Pother] is found in the skeleton, which scales with β ≈ 0 for most vertebrate groups. Actually, β is slightly >0 (i.e., 0.03-0.12) (37); still, this allometric exponent is so small that [Pother] increases only slightly over several orders of magnitude in body mass, i.e., from shrews to whales. Among invertebrates, [Pother] also scales with β ≈ 0 (12), although it is not well understood how this P is allocated. Thus, for both groups, [Pother] is approximately independent of body size (i.e., [Pother] ≈ C) however, as discussed below, the value of C does vary among taxa. The extent to which [Pbody] varies with body size thus depends largely on the relative magnitudes of [PRNA] and [Pother].
Model Predictions
Eqs. 1, 2, 3, 4, 5, 6 yield four explicit predictions about the mass dependence of RNA and P concentrations. First, Eq. 5 predicts that the relationships between log [RNA] and log body mass should be linear with slopes of -1/4 for all heterotrophic eukaryotes. Second, it predicts how the intercepts of these relationships should vary among taxonomic groups based on differences in bo, i.e.,  . Third, we control for differences in bo by expressing RNA concentrations for all groups as
  , where
  is taken to be the value of bo for multicellular ectotherms (see Methods). After controlling for these differences, Eq. 5 predicts that all heterotrophic eukaryotes will fall on a single line with this same slope of -1/4 and an intercept of
  of RNA per g of body mass. Thus, the model predicts the slope and intercept of this relationship between RNA and body mass.
Fourth, Eq. 6 predicts the slope and intercept of the relationship between whole-body P content and body size. It shows how changes in the relative magnitudes of [PRNA] and [Pother] combine to determine the body-size-dependence of [Pbody]. Specifically, Eq. 6 predicts that a log-log plot of [Pbody] against body size will yield a nonlinear relationship. We can characterize the tangent slope of this relationship, θ(M), as
 |
[7] |
In Eq. 7, if [PRNA] >> [Pother], then the log-log slope of [Pbody] against mass will show approximately quarter-power scaling, (i.e.,θ ≈ -1/4), but if [Pother] >> [PRNA], then the slope of this relationship will be approximately equal to 0 (i.e., θ ≈ β ≈ 0).
Methods
Calculation of Metabolic Normalization Constants. Values of metabolic normalization constants, bo, were calculated by using metabolic rate data compiled in ref. 15 for endotherms (birds and mammals), multicellular ectotherms (reptiles, fish, amphibians, and invertebrates), and unicells (prokaryotes and eukaryotes). Values were calculated by assuming an activation energy of 0.65 eV for the temperature dependence of metabolism and -1/4-power scaling for the mass dependence (15).
Calculation of RNA and Phosphorus Concentrations. All model predictions were tested with data compiled from the literature. Data for whole-body RNA content were compiled for a broad assortment of animals (invertebrates, vertebrates, ectotherms, and endotherms), and unicellular eukaryotes that span ≈14 orders of magnitude in size and occur in both terrestrial and aquatic ecosystems (Table 2, which is published as supporting information on the PNAS web site). For most of these data, whole-body RNA concentrations were measured. However, for some fishes and invertebrates and all but two endotherms, RNA concentrations were only reported for muscle tissues. We converted these data to whole-body RNA concentrations by multiplying the muscle RNA concentration by the fraction of body mass in protein by using published estimates (38). We assessed the validity of this method by performing an analysis of covariance with data for all of the multicellular ectotherms combined (fish, zooplankton, and other invertebrates). After fitting a common slope for the log([RNA]) versus log(mass) relationship, intercepts were found to be statistically indistinguishable between muscle-based estimates of RNA concentration (n = 18) and whole-body-based estimates (n = 35) (P = 0.24). These findings are consistent with data for a single mammal species showing that RNA concentrations vary, on average, only 1- to 3-fold among different tissue types (39). The estimate for [Pother] used in the model for invertebrates (x̄ = 0.6%) was taken from (12). For vertebrates, we assumed that [Pother] ≈ [Pbody] (x̄ = 2.4%) (40) because no independent estimate of [Pother] was available, and skeletal mass makes up the vast majority of P in vertebrates (1).
To the best of our knowledge, we used all available data (which were not already used to parameterize the model) to test the model in Figs. 1 and 2. A data set of whole-body P content in adults of 169 terrestrial insect species from the Sonoran desert (41) was used to test the predicted relationship with body size in Fig. 2a. Data for mammals and zooplankton listed in Table 2 were used to test the relationship predicted in Fig. 2b. These data provide independent tests of the model's predictions.
Fig. 1.
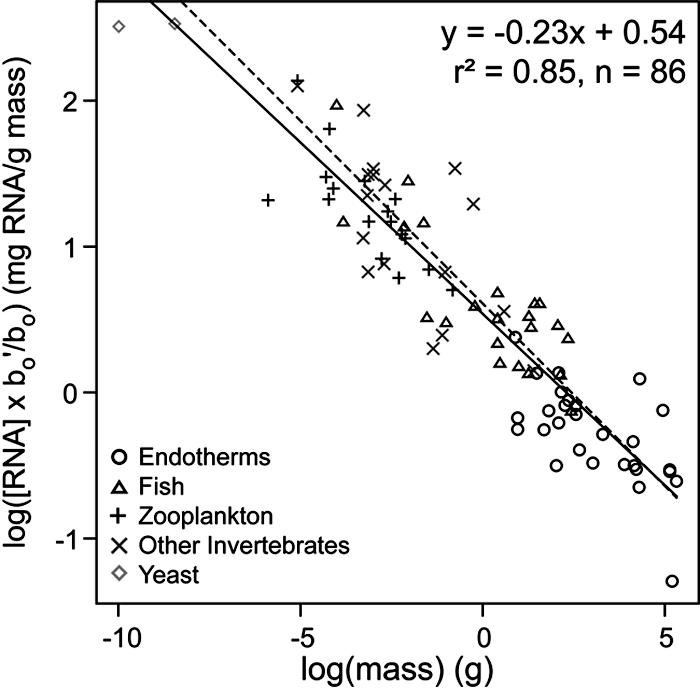
A log-log plot of whole-body RNA content corrected for the taxonspecific metabolic normalization constant, [RNA](b′o/bo), as a function of dry body mass for unicellular eukaryotes, multicellular ectotherms, and endotherms. The solid line, fitted by using ordinary least-squares regression (y = -0.23x + 0.54), is close to the predicted dashed line of y =-0.25x + 0.61. Data and sources are listed in Table 2. The yeast species were standardized by using the estimated value of bo for unicells.
Fig. 2.

The contribution of RNA to whole-body P content. (A) Effects of body size on P content only in RNA, [PRNA], and in the whole body (RNA plus other pools) [Pbody]. The dashed [PRNA] line is predicted based on the relationship of [RNA] to body mass derived in Eq. 5 and shown in Fig. 1 ([PRNA] = 0.037M-0.25). The [Pbody] line is predicted from Eq. 6 ([Pbody] = [PRNA] + [Pother]), with an estimate of [Pother] for invertebrates of 0.6% (12). Data shown are for adults of 169 insect species from the Sonoran desert (41). (B) The percentage of whole-body P contained in RNA for invertebrates and vertebrates as a function of body mass, i.e., 100 × [PRNA]/([Pbody]). The dashed line for invertebrates and the solid line for vertebrates are predicted from Eq. 6. For invertebrates, the parameter estimates used here are the same as those in A. For vertebrates, [Pother] is taken to be 2.4% (40), and the size dependence for [PRNA] is taken to be [PRNA] = 0.15M-0.25 based on Eq. 5 and differences in bo between endotherms and multicellular ectotherms. Data values and sources are listed in Table 2. Note that in A and B, the data cluster around the predicted lines and, thus, strongly support the model's predictions.
Assessing the Temperature Dependence of RNA Concentration. Rearranging Eq. 5 and taking logarithms yields the following linear model:  . This model predicts a linear relationship between ln([RNA]M1/4/bo) and 1/kT with a slope equal to Ep - Er. This model was fitted to data in Table 2 for which temperature estimates were available. Body temperatures of mammals and birds were assumed to be 38°C, and 41°C, respectively (15). The slope of the relationship, calculated by using ordinary least-squares regression, was not significantly different from 0 (P = 0.20, n = 74), indicating that Ep and Er are close in magnitude.
Results and Discussion
Data support the model's four predictions.
In support of Prediction 1, the log-log relationships of [RNA] versus body mass are linear for four different taxonomic groups, including endotherms and vertebrate and invertebrate ectotherms. Three of the four fitted slopes of these linear relationships have 95% confidence intervals that include the predicted value of -1/4, and that of endotherms is just slightly lower (Table 1).
Table 1. Statistics showing how the fitted slopes and intercepts compare to model predictions.
| Slope
|
Intercept
|
|||||||
|---|---|---|---|---|---|---|---|---|
| Group | Pred. | Obs. | 95% Cl | Pred. | Obs. | 95% Cl | r2 | n |
| Birds and mammals | –0.25 | –0.15 | –0.21 to –0.08 | 1.21 | 0.76 | 0.53 to 0.99 | 0.40 | 28 |
| Mar. and FW fish | –0.25 | –0.21 | –0.28 to –0.15 | 0.61 | 0.63 | 0.52 to 0.75 | 0.70 | 22 |
| Mar. and FW zoopl. | –0.25 | –0.21 | –0.30 to –0.12 | 0.61 | 0.59 | 0.29 to 0.90 | 0.59 | 17 |
| Other Inv. | –0.25 | –0.24 | –0.36 to –0.11 | 0.61 | 0.64 | 0.32 to 0.96 | 0.49 | 17 |
Ordinary least-squares regression was used to describe the linear relationships between log [RNA] (mg per g of dry mass) and log dry body mass (g) for different taxonomic groups. Data and sources are listed in Table 2. Pred., predicted; Obs., observed; Mar., marine; FW, freshwater; zoopl., zooplankton; inv., invertebrate.
In support of Predictions 2 and 3, the intercepts of these relationships include the predicted values for all groups except the endotherms. The log-log plot of [RNA](b′o/bo) versus body mass for all of these organisms along with two yeast species falls along a single line with a fitted slope (-0.23) and intercept (0.54 mg of RNA per g of body mass) close to the predicted values of -1/4 and 0.61, respectively (Fig. 1). The fitted line in Fig. 1 explains 85% of the variation in log-transformed RNA concentration among organisms. Body size thus imposes a substantial constraint on [RNA] through its effects on mitochondrial density and ATP production. Interestingly, data compiled on [RNA] for adult polychaete worms of a single species (42) show nearly the same size dependence over just one order of magnitude variation in size (y = -0.26x + 0.72, r2 = 0.44, n = 82), which suggests that the model has application both within and across species.
In support of Prediction 4, a log-log plot of [Pbody] against body mass for a broad assortment of adult insect species from the Sonoran desert (n = 169) (41) yields a nonlinear relationship that is well described by the line predicted from Eq. 6 (Fig. 2a). If we fit a linear model to the log-log relationship for these data, the fitted slope (-0.04) is identical to the tangent slope predicted by Eq. 7 based on the geometric mean for body size. Note that the predicted line and its tangent slope is independently calculated by using the predicted relationship for [PRNA] in Fig. 1 and the independent estimate of [Pother] for invertebrates (0.6%) (12). The shallow slope in Fig. 2a asymptotically increases to zero with increasing body size, which reflects the relatively large and increasing influence of [Pother] on [Pbody] for invertebrates over this size range. Eq. 7 may similarly predict the size dependence of [Pbody] for other groups (e.g., unicellular eukaryotes and endothermic vertebrates) given appropriate parameters to calculate [PRNA], [Pother], and bo.
A semilog plot showing the percentage of whole-body P in RNA (i.e., 100 × [PRNA]/[Pbody]) as a function of body size provides further support for Prediction 4 (Fig. 2b). Data for zooplankton and mammals show a rapid decline in the contribution of [PRNA] to [Pbody] with increasing body size. These data are again in close agreement with the lines in Fig. 2b predicted from Eq. 6. The line for invertebrates in Fig. 2b predicts that the fraction of whole-body P in RNA for organisms of 10-6, 10-3, and 1 g of dry mass will decline from 65% to 25% to 6%, respectively. The predicted line for mammals shows a decline of [PRNA]/[Pbody] from 6% to 0.3% with increases in mass from 1 g to 100 kg. Note that the lines for the invertebrates and the endotherms in Fig. 2b are virtually indistinguishable from each other because, coincidentally, the differences in bo (9.90 × 10⁷ W/g3/4 and 3.88 × 10⁸ W/g3/4, respectively) offset differences in [Pother] (0.6% and 2.4%, respectively).
Combining this model with empirical relationships yields the relationship between the concentration of RNA-associated P in an organism, the turnover rate of RNA, and the flux rate of RNA and associated P through the organism. Our model predicts that RNA varies with body size as [RNA] ∝ M-1/4. Empirical measurements of RNA degradation markers in urine indicate that RNA catabolites are excreted at a rate that scales with body size to approximately the -1/4 power, indicating FluxRNA ∝ M-1/4 (43). Thus, combining these two relationships in the following expression demonstrates that the average lifetime of an RNA molecule, τRNA (and the turnover rate of an RNA molecule, 1/τRNA), is independent of body size:
 |
[8] |
Interestingly, because life span is proportional to M1/4, this expression implies that lifetime RNA production per unit of body mass is independent of body size, much like lifetime metabolic energy production. This expression also implies that the total amount of protein produced by a ribosome over its lifetime is independent of body size. Finally, Eq. 8 implies that differences in RNA-associated P-flux among organisms of varying size are determined largely by the allometry of [RNA]. Assuming that the total protein produced by a ribosome over its lifetime is also independent of temperature, the production, degradation, and excretion of RNA and associated P should vary not only with body size but also with temperature as described by Eq. 2. Note, however, that Eq. 7 would only apply to larger organisms that have life spans that greatly exceed the lifetime of a ribosome.
Although Figs. 1 and 2 demonstrate the predicted mass dependence of RNA and P concentrations, there remains considerable unexplained variation in both relationships. Note that these data include organisms held in the laboratory as well as organisms under natural conditions. The organisms represent virtually all postembryonic life stages under nutrient-replete and nutrient-limiting conditions. Thus, the variation about the lines in Figs. 1 and 2 likely stems from three sources: differences in ontogenetic growth stage among individuals, differences in RNA and P allocation among species, and differences in nutrient availability. First, [RNA] is expected to vary within a species such that RNA concentrations are higher earlier in ontogeny (11, 12). Second, RNA and P content are expected to vary among species because of differences in metabolic rate, evolutionary history, morphology, and storage capacity. Third, our model assumes that resource availability in the environment is held constant. In natural systems, P limitation may constrain the sizes of populations, and/or limit P sequestration of individuals. In laboratory experiments, it has been shown that [RNA] can increase rapidly with increasing P availability under P-limited conditions (44). Higher RNA concentrations may in turn allow individual organisms to sustain higher rates of protein synthesis for reproduction and growth (11). These three sources of variation may be reflected in species-specific deviations in the values of parameters such as α.
Still, the overall close fit of the data to model predictions in Figs. 1 and 2 indicates that energy flux imposes a substantial constraint on RNA and P content despite these other important sources of variation. The model thus represents a step toward quantifying the role of biota in the cycling of P. Further research combining this model with theory and data on the size structure of ecological communities should yield explicit, quantitative predictions about the storage and flux of P in ecosystems. For example, it should predict how much P is being held at different trophic levels and how changes in community size structure (e.g., trophic cascade) would affect P storage and flux. Such a theoretical framework would explicitly link species to ecosystems and would be sufficiently general so as to apply to many types of ecosystems, both aquatic and terrestrial.
The model and results presented here also show how the pools and fluxes of energy and materials that are important to nutrient cycling in ecosystems can be linked through individual metabolism. Here we have only considered the case of P in heterotrophic eukaryotes, but this same framework might also be used to evaluate the size-dependence of RNA and P in algae and higher plants. Moreover, this framework may be useful in evaluating how other limiting nutrients, such as nitrogen or iron, may vary with body size. Like P, a substantial fraction of whole-body nitrogen and iron is found in cellular organelles (i.e., mitochondria and chloroplasts) whose numbers vary proportionally with metabolic rate and, thus, scale with body size to the -1/4 power (16-19, 45). Ultimately, then, this framework could provide a better mechanistic understanding of observed Redfield ratios and help quantify the longstanding question regarding the relationship between the “complementary currencies” of energy and materials in ecological systems (46).
Supplementary Material
Acknowledgments
We thank R. Sterner, A. Herman, W. Jetz, and R. Cripps for helpful comments and discussions. J.F.G., A.P.A., J.H.B., and G.B.W. were supported by a Packard Interdisciplinary Science Award, National Science Foundation Biocomplexity Grant DEB-0083422, and the Thaw Charitable Trust. A.P.A. was supported as a Postdoctoral Associate at the National Center for Ecological Analysis and Synthesis, a Center funded by National Science Foundation Grant DEB-0072909, and the University of California, Santa Barbara. G.B.W. was supported by National Science Foundation Grant PHY-0202180. J.J.E. was supported by a National Science Foundation Integrated Research Challenges in Environmental Biology Grant DEB-9977047. This paper represents an outgrowth of a workshop at the Santa Fe Institute in 2002 titled “Toward an Ecology Based on First Principles: Body Size, Temperature, and Stoichiometry.”
Author contributions: J.F.G. and A.P.A. designed research; J.F.G., A.P.A., J.H.B., J.J.E, C.M.d.R., V.M.S., G.B.W., W.H.W., and H.A.W. performed research; J.F.G., A.P.A., V.M.S., G.B.W., W.H.W., and H.A.W. contributed new reagents/analytic tools; J.F.G. and A.P.A. analyzed data; and J.F.G., A.P.A., J.H.B., J.J.E., C.M.d.R., V.M.S., G.B.W., W.H.W., and H.A.W. wrote the paper.
References
- 1.Sterner, R. W. & Elser, J. J. (2002) Ecological Stoichiometry: The Biology of Elements from Molecules to the Biosphere (Princeton Univ. Press, Princeton).
- 2.Schlesinger, W. H. (1991) Biogeochemistry: An Analysis of Global Change (Academic, San Diego).
- 3.Redfield, A. C. (1958) Am. Sci. 46, 205-221. [Google Scholar]
- 4.Elser, J. J., Fagan, W. F., Denno, R. F., Dobberfuhl, D. R., Folarin, A., Huberty, A., Interlandi, S., Kilham, S. S., McCauley, E., Schulz, K. L., et al. (2000) Nature 408, 578-580. [DOI] [PubMed] [Google Scholar]
- 5.Geider, R. J. & La Roche, J. (2002) Eur. J. Phycol. 37, 1-17. [Google Scholar]
- 6.Gusewell, S. (2004) N. Phytol. 164, 243-266. [DOI] [PubMed] [Google Scholar]
- 7.Klausmeier, C. E., Litchman, E., Daufresne, T. & Levin, S. (2004) Nature 429, 171-174. [DOI] [PubMed] [Google Scholar]
- 8.Quigg, A., Finkel, Z. V., Irwin, A. J., Rosenthal, Y., Ho, T. Y., Reinfelder, J. R., Schofield, O., Morel, F. M. & Falkowski, P. G. (2003) Nature 425, 291-294. [DOI] [PubMed] [Google Scholar]
- 9.Sanudo-Wilhelmy, S. A., Tovar-Sanchez, A., Fu, F. X., Capone, D. G., Carpenter, E. J. & Hutchins, D. A. (2004) Nature 432, 897-901. [DOI] [PubMed] [Google Scholar]
- 10.Elser, J. J., Dobberfuhl, D. R., MacKay, N. A. & Schampel, J. H. (1996) Bioscience 46, 674-684. [Google Scholar]
- 11.Sutcliffe, W. H. (1970) J. Fish. Res. Board Can. 27, 606-609. [Google Scholar]
- 12.Elser, J. J., Acharya, K., Kyle M., Cotner, J., Makino, W., Markow, T., Watts, T., Hobbie, S., Fagan, W., Schade, J., et al. (2003) Ecol. Lett. 6, 936-943. [Google Scholar]
- 13.Lygre, D. G. (1995) General Organic and Biological Chemistry (Wiley, New York).
- 14.Blier, P. U. & Guderley, H. E. (1993) J. Exp. Biol. 176, 145-157. [Google Scholar]
- 15.Gillooly, J. F., Brown, J. H., West, G. B., Savage, V. M. & Charnov, E. L. (2001) Science 293, 2248-2251. [DOI] [PubMed] [Google Scholar]
- 16.West, G. B., Woodruff, W. H. & Brown, J. H. (2002) Proc. Natl. Acad. Sci. USA 99, 2473-2478. [DOI] [PMC free article] [PubMed] [Google Scholar]
- 17.Else, P. L. & Hulbert, A. J. (1985) Am. J. Physiol. 248, R415-R421. [DOI] [PubMed] [Google Scholar]
- 18.Gunther, B., Morgado, E. & Gonzales, U. (1993) Biol. Res. 26, 341-355. [PubMed] [Google Scholar]
- 19.Kunkel, H. O., Spalding, J. F., Franciscis, G. & Futrell, M. F. (1956) Am. J. Physiol. 186, 203-206. [DOI] [PubMed] [Google Scholar]
- 20.West, G. B., Brown, J. H. & Enquist, B. J. (1997) Science 276, 122-126. [DOI] [PubMed] [Google Scholar]
- 21.Wieser, W. (1994) Biol. Rev. Cambridge Philos. Soc. 69, 1-33. [DOI] [PubMed] [Google Scholar]
- 22.Rolfe, D. & Brown, G. (1997) Physiol. Rev. 77, 731-758. [DOI] [PubMed] [Google Scholar]
- 23.Hulbert, A. & Else, P. (2000) Annu. Rev. Physiol. 62, 207-235. [DOI] [PubMed] [Google Scholar]
- 24.Beavis, R. C. & Fenyn, D. (1999) Amino Acid Properties of Interest in Protein Chemistry, Multimedia Databases and Tutorials (The Rockefeller University, New York).
- 25.Ryazanov, A., Ovchinnikov, L. & Spirin, A. (1987) Biosystems 20, 275-288. [DOI] [PubMed] [Google Scholar]
- 26.Hershey, J. (1990) Enzyme 44, 17-27. [DOI] [PubMed] [Google Scholar]
- 27.Lewin, B. (2000) Genes (Oxford Univ. Press, Oxford).
- 28.Fraser, K. P. P., Clarke, A. & Peck, L. S. (2002) J. Exp. Biol. 205, 3077-3086. [DOI] [PubMed] [Google Scholar]
- 29.Mosoni, L., Valluy, M. C., Serrurier, B., Prugnaud, J., Obled, C., Guezennec, C. Y. & Mirand, P. P. (1995) Am. J. Physiol. 31, E328-E335. [DOI] [PubMed] [Google Scholar]
- 30.Chohji, T., Sawada, T. & Kuno, S. (1976) Appl. Environ. Microbiol. 31, 864-869. [DOI] [PMC free article] [PubMed] [Google Scholar]
- 31.Sievers, A., Beringer, M., Rodnina, M. V. & Wolfenden, R. (2004) Proc. Natl. Acad. Sci. USA 101, 7897-7901. [DOI] [PMC free article] [PubMed] [Google Scholar]
- 32.Farewell, A. & Neidhardt, F. C. (1998) J. Bacteriol. 180, 4704-4710. [DOI] [PMC free article] [PubMed] [Google Scholar]
- 33.Burr, M. J. & Hunter, A. S. (1969) Comp. Biochem. Physiol. 29, 647-652. [DOI] [PubMed] [Google Scholar]
- 34.Brown, C. M. & Rose, A. H. (1969) J. Bacteriol. 97, 261-272. [DOI] [PMC free article] [PubMed] [Google Scholar]
- 35.Foster, A. R., Houlihan, D. F., Hall, S. J. & Burren, L. J. (1992) Can. J. Zool. 70, 2095-2102. [Google Scholar]
- 36.Robertson, R. F., El-Haj, A. J., Clarke, A., Peck, L. S. & Taylor, E. W. (2001) J. Exp. Mar. Biol. Ecol. 262, 113-129. [Google Scholar]
- 37.Peters, R. H. (1983) The Ecological Implications of Body Size (Cambridge Univ. Press, New York).
- 38.Ricklefs, R. E. (1974) in Avian Energetics, ed. Paynter, R. A. J. (Nuttall Ornithol. Club, Cambridge, MA).
- 39.Kolb, E., Grün, E., Büchner, A., Eichler, S. & Vallentin, G. (2000) Z. Jagdwissen. 46, 236-247. [Google Scholar]
- 40.Tanner, D. K., Brazner, J. C. & Brady, V. J. (2000) Can. J. Fish. Aquat. Sci. 57, 1243-1251. [Google Scholar]
- 41.Woods, H. A., Fagan, W. F., Elser, J. J. & Harrison, J. F. (2004) Funct. Ecol. 18, 103-109. [Google Scholar]
- 42.Foss, H. E. & Forbes, V. E. (1997) Mar. Biol. 129, 489-497. [Google Scholar]
- 43.Schoch, G., Topp, H., Held, A., Heller-Schoch, G., Ballauff, A., Manz, F. & Sander, G. (1990) Eur. J. Clin. Nutr. 44, 647-658. [PubMed] [Google Scholar]
- 44.Vrede, T., Persson, J. & Aronsen, G. (2002) Limnol. Oceanogr. 47, 487-494. [Google Scholar]
- 45.Niklas, K. J. (1994) Plant Allometry: The Scaling of Form and Process (Univ. Chicago Press, Chicago).
- 46.Reiners, W. A. (1986) Am. Nat. 127, 59-73. [Google Scholar]
Associated Data
This section collects any data citations, data availability statements, or supplementary materials included in this article.