

Abstract
Solute transport through the bone lacunar-canalicular system is believed to be essential for osteocyte survival and function but has proved difficult to measure. We report an approach that permits direct measurement of real-time solute movement in intact bones. By using fluorescence recovery after photobleaching, the movement of a vitally injected fluorescent dye (sodium fluorescein) among individual osteocytic lacunae was visualized in situ beneath the periosteal surface of mouse cortical bone at depths up to 50 μm with laser scanning confocal microscopy. Transport was analyzed by using a two-compartment mathematical model of solute diffusion that accounted for the characteristic anatomical features of the lacunar-canalicular system. The diffusion coefficient of fluorescein (376 Da) was determined to be 3.3 ± 0.6 × 10⁻⁶ cm2/sec, which is 62% of its diffusion coefficient in water and is similar to diffusion coefficients measured for comparably sized molecules in cartilage. The diffusion of fluorescein in bone is also consistent with the presence of an osteocyte pericellular matrix whose structure resembles that proposed for the endothelial glycocalyx [Squire, J. M., Chew, M., Nneji, G., Neal, C., Barry, J. & Michel, C. (2001) J. Struct. Biol. 136, 239–255]. To our knowledge, this is the first instance where the dynamics of molecular movement has been measured directly in the bone lacunar-canalicular system. This in situ imaging approach should also facilitate the analysis of convection-based transport mechanisms in bones of living animals.
Keywords: diffusion coefficient, fiber matrix theory, fluorescence recovery after photobleaching, osteocyte, confocal microscopy
Solute transport through bone is essential for tissue survival and function. Osteocytes, the most numerous cells in adult bone, lie buried within the mineralized matrix and do not directly contact the tissue's vascular supply; consequently, they depend on solute transport through the tissue to obtain nutrients, dispose of metabolic wastes (1–4), and transmit chemical signals (e.g., nitric oxide and prostaglandins) to nearby cells (5, 6). These transport processes are thought to be crucial for osteocytes to carry out their physiological functions in sensing mechanical stimuli and targeting damaged bone areas for osteoclastic resorption (5, 7–10). Because the mineralized matrix of adult bone is largely impermeable to solutes (3, 4), transport in bone occurs mainly via the extracellular spaces immediately surrounding osteocytes (termed lacunae) and their interconnecting processes (canaliculi). Typical diameters of lacunae and canaliculi are ≈10–20 and 0.5 μm, respectively (1, 11, 12). The annular fluid space surrounding the osteocyte cell processes inside canaliculi is much smaller, ≈50–100 nm wide (13), and is thought to be filled with a gel-like matrix composed of proteoglycans and other matrix molecules (8). This pericellular matrix provides resistance to fluid flows that are believed to serve as mechanical signals to osteocytes (8, 13, 14). This matrix also modulates solute transport through the bone lacunar-canalicular system as a molecular sieve (4, 15).
Neither the structural nor the functional molecular sieving properties of the pericellular matrix in bone are well understood. However, based on its proposed function in modulating fluid flow and solute transport, we hypothesized that the matrix surrounding osteocytes is similar to the glycocalyx of endothelial cells as first proposed by Weinbaum et al. (8). To test this hypothesis, we performed a functional study of solute transport in the osteocyte lacunar-canalicular system by using an imaging technique in combination with mathematical modeling. Fiber matrix theory (16) was then applied to evaluate structural models of the pericellular matrix.
Solute transport in the bone lacunar-canalicular system has proved extremely difficult to measure because of a range of technical difficulties. Measurements of solute diffusion were often performed by monitoring tracer efflux from bone blocks (17, 18), but these methods required hours to complete, during which time tissues were susceptible to deterioration that may have caused changes in the permeability of the transport pathways. Previous attempts to characterize the effects of mechanical loading on solute transport have relied on histological assays to assess tracer distributions in loaded and unloaded bones (19, 20). Because the tracer distributions were examined at single time points in these studies, the dynamics of solute transport (e.g., molecular mobility) could not be evaluated. In addition, the histological processing used in these studies introduced artifacts that made precise tracer localization difficult (15). Thus, although it has long been suggested that solute transport through bone involves both diffusion and convection induced by mechanical loading (2, 19–22) or hydraulic vascular pressure (23, 24), precise rates of solute movement have not been measured, nor have the contributions of diffusion and convection been quantified.
To overcome these problems, we combined an imaging method with mathematical modeling to directly measure real-time solute transport in intact bones. Fluorescence recovery after photobleaching (FRAP) (25, 26) has been widely applied to study molecular mobility in a range of tissues and cells (e.g., refs. 27–31). In our FRAP approach, fluorescent tracer molecules are introduced into bone and then a single lacuna is photobleached under intense laser illumination. Subsequently, the influx of unbleached tracers from neighboring lacunae, producing an increase of fluorescence intensity in the photobleached lacuna, is monitored directly by confocal microscopy. The mobility of the fluorescent molecules is then calculated from the time course of fluorescence recovery, using an anatomically based two-compartment mathematical model. Fiber matrix theory (16) was used to evaluate different structural models of the osteocyte pericellular matrix to explain this tracer mobility.
Materials and Methods
Animal Preparations. Skeletally mature C57BL/6J female mice (n = 7, 4–6 months old; The Jackson Laboratory) were slowly injected via the tail vein with sodium fluorescein (376 Da, 10 mg/ml, 0.2 ml; Sigma-Aldrich) under avertin anesthesia. Tracer was allowed to circulate for ≈20 min, at which time the tracer distribution in bone appeared to reach steady state. The animals were then killed with CO2. The left tibia was exposed by surgical dissection, leaving the periosteum intact. For observations, the mouse was placed in a glass Petri dish containing PBS, and the hindlimb was fastened by using rubber bands to a wedge-shaped aluminum holder anchored inside the Petri dish. The medial anterior surface of proximal tibia, which was relatively flat, was positioned evenly by adjusting the holder's height and wedge angle. The entire preparation was then positioned under the objective of a confocal microscope (Radiance 2000, Bio-Rad). Because osteocyte damage has been observed 2 h postmortem because of ischemia (32), all measurements were carried out within 1 h to minimize permeability changes in the lacunar-canalicular system.
FRAP Experiments. Osteocytic lacunae within the tibial proximal diaphysis were subjected to FRAP with the following microscope settings: ×63 0.9-numerical aperture water-immersion lens (Olympus LumPlan FI/IR), 512 × 512 images with an 8-bit depth, 488 nm excitation, and emission filter HQ510/30. The microscope was focused on a plane 30–50 μm below the periosteum, and a cluster of fluorescent lacunae was imaged by using a rapid scan speed (500 lines per sec). The central lacuna was then chosen as the target for photobleaching, and its boundary was tightly enclosed and outlined with a rectangle region-of-interest tool. A predefined three-step FRAP procedure was then executed automatically by using a low scan speed (166 lines per sec, ≈4 sec each frame). First, a prebleach image of the whole field was taken by using a low laser intensity [acousto-optic tunable filter (AOTF) = 20%, zoom = ×1]. Next, the laser intensity was increased by ×25 (AOTF = 50%, zoom = ≈×10), and the target lacuna was photobleached for ≈15 sec. Control experiments with cultured MC3T3-E1 osteoblastic cells verified that exposure to this level of laser intensity did not result in cell death, based on uptake of ethidium homodimer-1 (33). Finally, the laser intensity and zoom were immediately reset to prebleach levels (AOTF = 20%, zoom = ×1), and the full field was imaged for 30 more frames to capture the time course (≈120 sec) of fluorescence recovery in the photobleached lacuna until a plateau of fluorescence intensity was reached. Three FRAP measurements were carried out on different lacunae per animal.
Quantitative Measurements of FRAP Images. By using the matlab Image Processing Toolbox, the following parameters were determined: fluorescence intensities of the target lacuna before photobleaching, I0, immediately after 15 sec of photobleaching, Ib, and during the subsequent recovery, I(t); anatomical measures of the area, perimeter, volume, and surface area of the photobleached lacuna; and the distance, d, between the photobleached lacuna and its neighbors. The processing procedures were as follows: (i) all images of the photobleached lacunae were cropped to yield rectangular segments, which included the lacuna and surrounding matrix that was of roughly equal area to the lacuna; (ii) the prebleach mean intensity of the cropped area (lacuna plus matrix) was calculated; (iii) using this mean intensity as a threshold value, the cropped prebleach image was converted into a binary proof, where all pixels inside the lacuna (with fluorescence intensities greater than the threshold level) were assigned a value of 1, whereas pixels outside the lacuna (with intensities below the threshold) received a value of 0; (iv) the lacunar perimeter P and area A were measured from the binary proofs by using edge detection and pixel counting functions; (v) assuming the lacuna to be a prolate spheroid, the radii in the long axis (a) and in the other two orthogonal directions (b) were calculated
 |
which were used to determine the 3D volume (Vs = 4/3πab2) and the surface area
 |
(vi) by multiplying the binary proof with the sequential fluorescence intensity images, mean fluorescence intensities were calculated for the region of interest (the target lacuna) before photobleaching (I0), immediately after 15 sec of photobleaching (Ib), and at all times thereafter [I(t)]; and (vii) by using the original (noncropped) prebleach image, the mean distance between the photobleached lacuna and all of its neighbors was calculated.
Histological Measurements of Lacunar-Canalicular Microanatomy. Certain anatomical details, such as the number and size of canaliculi connecting to the photobleached lacunae, as well as their spatial distributions, could not be directly assessed from the FRAP images. Consequently, these anatomical measures were obtained from histological specimens of similarly aged C57BL/6J mice (n = 5). Tibiae were isolated, fixed in formalin, bulk-stained in 1% basic fuchsin, and embedded in plastic (34). Both longitudinal sections and cross-sections of proximal diaphyses were cut by using a Leica 1600 Sawing Microtome (Nussloch, Germany) and polished to a thickness of 100 and 75 μm, respectively. Longitudinal sections were used for 3D imaging of intact lacunae to measure the number density of canaliculi emanating from the lacunar surface. Stacks of 1,024 × 1,024 images were collected for 150–200 sequential frames with a z step of 120 nm by using a ×100 oil-immersion objective (1.4 numerical aperture) under 595 nm excitation. Images of lacunae in the cross-sections were also collected to quantify the fraction of canaliculi outside the laser light path.
Canalicular number density. Three-dimensional renderings of 10 individual lacunae with their associated canaliculi were reconstructed from the z image stacks by using the program volocity (Improvision, Lexington, MA). A representative 3D rendering is shown in Fig. 1. For each lacuna, the number of emanating canaliculi (N) was counted from the 3D rendering. The maximal diameters of the ellipsoidal lacunae were measured along the x, y, and z directions from the 3D images. Values in the z direction were multiplied by a correction factor of 0.89, experimentally measured for mineralized, basic fuchsin-stained cortical bone (11), to correct for the distortion (stretching) of images in this direction that is inherent in confocal microscopy. Lacunar surface areas (A) were then calculated for the ellipsoids, and the canalicular number density (dca = N/A) was obtained. The number density was found to be 0.18 ± 0.03/μm2 (mean ± SD). Fraction of canaliculi contributing to solute transport. As the target lacuna is photobleached with the high-intensity scanning laser beam, canaliculi (and lacunae) above and below the target lacuna also lie within the laser light path (shaded area in Fig. 2) and are photobleached. Therefore, these channels cannot deliver fluorescent tracers to the photobleached lacuna, and only canaliculi outside the light path contribute to subsequent lacunar fluorescence recovery. To measure the fraction of contributing canaliculi, images of 20 lacunae from the cross-sections were chosen, and photobleaching laser paths were drawn to form a 90° conical angle emanating from lacunar edges, based on the numerical aperture (0.9) of the lens used in the experiments (Fig. 2). The number of canaliculi outside the laser path and the total number of canaliculi were counted, and the fraction of contributing canaliculi was calculated for each lacuna. Contributing canaliculi, which lie outside the laser path, represented 22 ± 4% (mean ± SD) of the total number of canaliculi feeding an average lacuna.
Fig. 1.

A projection of a representative 3D rendering of a lacuna with its canaliculi.
Fig. 2.

A schematic showing that canaliculi above and below the target lacuna also lie within the laser path (shaded area) and are photobleached. Therefore, only the canaliculi outside the light path contribute to the lacunar fluorescence recovery. The contributing canaliculi fraction was found to be 22 + 4% (see text for details).
Cross-sectional area of fluid pathway in canaliculi. Canalicular dimensions in adult mice were recently determined from electron-microscopic images (13). The mean values of canalicular diameter (259 nm) and the diameter of osteocyte processes (104 nm) were used in our calculations of the annular fluid area (Afc = 0.044 μm2).
Mathematical Modeling of Solute Transport. A two-compartment model was developed to describe the movement of unbleached fluorescent tracer molecules into the photobleached lacuna (a sink with a fluorescent tracer concentration Cs) from its neighboring lacunae (a source reservoir with a constant fluorescent tracer concentration C0) through the connecting canaliculi (Fig. 3). The model assumes that (i) the sink lacuna is a prolate spheroid and 22% of its canaliculi supply unbleached tracers from the source (Fig. 3A); (ii) solute movement occurs only in the annular fluid space between the cell processes and the canalicular wall, because the processes are believed to be packed with cytoskeletal bundles (13, 14) (Fig. 3B); and (iii) diffusion of tracer within the canaliculi is one-dimensional along the long axis of the channels, and both the sink and source are well mixed compartments (Fig. 3C).
Fig. 3.

Schematics of the two-compartment model of solute transport in the lacunar-canalicular system of bone. (A) A top view of the two-compartment model developed to describe tracer movement from the neighboring lacunae (source with a constant unbleached tracer concentration C0) to the photobleached lacuna (sink with a time varying unbleached tracer concentration Cs) via the canalicular channels. The sink lacuna is assumed to be a prolate spheroid, and 22% of its canaliculi, which lie outside the incident laser light cone, are involved in delivering unbleached tracers to the sink from the neighboring sources. (B) A longitudinal view of a canaliculus where fluid and solute move through the annular space between the cell process and the canalicular wall. The cross-sectional area of the fluid annular space (0.044 μm2) is calculated from the diameters of the canalicular wall and cell process (13). (C) Mathematically, the model is reduced to two well mixed pools (source and sink lacunae) connected with a linear channel, which represents all contributing canaliculi. The model predicts the time course of fluorescence recovery in the photobleached lacuna, from which tracer diffusion coefficient is determined.
First, the tracer distribution in the canalicular channels is examined during photobleaching when the tracer concentration in the sink remains low. In our FRAP experiments, the photobleached lacuna was under high-intensity laser irradiation for ≈15 sec. This time period was required in our system to reduce the tracer concentration within the entire lacuna and to ensure that the subsequent fluorescence recovery occurred because of tracer influx through the connecting canaliculi. From Fick's second law, the tracer concentration in the canaliculi as a function of time is solved in Supporting Appendix, which is published as supporting information on the PNAS web site, and gives the following expression:
 |
[1] |
where C0 is the prebleach concentration, Cb is the reduced concentration immediately after photobleaching, x is the distance from the source reservoir, d is the canalicular length, D is the diffusion coefficient of the tracer (sodium fluorescein), and t is time. The first two terms on the right side of Eq. 1 stand for the steady-state solution, and the infinite series of exponential decay terms stand for the transient solution. The characteristic time (d2/π2/D) is estimated to be <1 sec based on our preliminary results (d = 30 μm, D = 1 × 10⁻⁶ cm2/sec). Therefore, after 15 sec of photobleaching, the transient terms diminish and tracer concentration in the canaliculi reaches the steady state, which is used as the initial condition for the subsequent recovery phase.
During the recovery phase, tracer concentration in the sink varies as a result of the time varying influx from the canaliculi, which depends on the time varying concentration profile in the canaliculi. The solution for tracer concentration in the sink is derived by using Fick's first law and is given in Supporting Appendix. The experimental measurements (fluorescence intensities in the sink lacuna), assumed to be proportional to the tracer concentrations, are given by
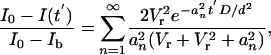 |
[2] |
where I0 and Ib are the fluorescence intensity immediately before and after photobleaching, respectively; I(t′) is the fluorescence intensity during recovery; t′ is the time after photobleaching; D is the tracer diffusion coefficient; and an are the roots of the following equation:
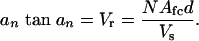 |
[3] |
The roots of Eq. 3 are tabulated in appendix 4 of ref. 35. Vr is the fluid volume ratio between the canaliculi and the sink lacuna, N is the number of contributing canaliculi, Afc is the annular fluid area in one canaliculus, d is the mean distance between the photobleached lacuna and its neighbors (canalicular length), and Vs is the volume of the photobleached lacuna.
For Vr in our FRAP experiments, which is relatively small (0.03–0.05), Eq. 2 is dominated by the first term associated with  . Because
  are nearly independent of Vr and are at least two orders of magnitude larger than
  , the higher-order terms involving an (n > 1) can be neglected, and Eq. 2 can be approximated by
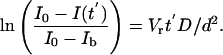 |
[4] |
Calculation of Diffusion Coefficients. The diffusion coefficient (D) was calculated for each FRAP experiment based on Eq. 4. All parameters except for the diffusion coefficient were obtained by analyzing FRAP images or histological sections. Fluorescence intensities [I0, Ib, and I(t′)] obtained from each FRAP experiment were used to plot ln[(I0 - I)/(I0 - Ib)] vs. time, and the model predicts that all data points should fall on a straight line (Eq. 4). Linear curve fitting was performed on the initial 10 data points (to minimize effects of fluorescence fading during imaging the recovery phase) by using matlab, and the slope of the fitting line (-VrD/d2) was used to determine the diffusion coefficient.
Results
We found that osteocytic lacunae were strongly labeled with the vitally injected fluorescein dye, so that osteocytic lacunae could be observed clearly up to a depth of ≈50 μm beneath the periosteal surface (Fig. 4). We were able to photobleach single osteocytic lacunae without affecting the neighboring lacunae, resulting in typical reductions in fluorescence intensity in the selected lacuna of approximately half initial value (Fig. 4B). Microscopic scans in the xz plane verified that the lacunae were effectively photobleached through their entire depth (Fig. 5). Therefore, the recovery of fluorescence after photobleaching could not be attributed to a redistribution of tracer within the lacuna itself but was due to the movement of tracer into the photobleached lacuna via the canalicular system.
Fig. 4.

Confocal images of fluorescein-labeled osteocytic lacunae up to 50 μm below the proximal diaphysial periosteum of mouse tibiae. (A) Prebleach: A cluster of labeled lacunae with the target lacuna at the center (indicated with an arrow) was imaged before photobleaching. (B) Photobleached: The target lacuna was photobleached and its fluorescence intensity was reduced, whereas its neighbors were not affected. (C) Recovered: The fluorescence intensity of the photobleached lacuna recovered 120 sec after photobleaching. Image width, 306 μm.
Fig. 5.

The entire lacuna was photobleached effectively as shown in pictures taken before photobleaching (A and B) and immediately after photobleaching (C and D). The xz scans (B and D) were taken perpendicular to the xy scans (the focal plane) along the white lines (A and C). The pseudocolors blue, green, red, and white represent ascending fluorescence intensities.
Fluorescence intensity in the photobleached lacunae increased exponentially during the initial recovery period, reaching a plateau that was ≈80% of the prebleach level by ≈40 sec after photobleaching (Figs. 6 A and B). The measurements fit a straight line with R2 = 0.99 as predicted by Eq. 4 (Fig. 6C). Good agreement was achieved for all FRAP experiments.
Fig. 6.

Examples of FRAP experimental recording and data analysis for an osteocyte lacuna. (A) Time-lapse confocal images of the photobleached lacuna in a representative FRAP experiment (animal no. 4, FRAP no. 1). (B) The fluorescence intensity of the photobleached lacuna increases exponentially after photobleaching due to influx of tracer, reaching a plateau of ≈80% of the prebleach level by 40 sec. This partial recovery is possibly due to net loss of fluorescence tracer by photobleaching. (C) Experimental data ln[(I0 - I)/(I0 - Ib)] fit well with a straight line as predicted by the two-compartment model (Eq. 4). The diffusion coefficient (D) of sodium fluorescein was calculated from the slope of the line.
Measurements of D obtained by FRAP were reproducible with reasonable intra- and inter-animal variations. The coefficient of variation for replicate measurements from individual animals was typically 10–30%, whereas inter-animal variation was found to be 17% (Table 1). Based on 21 FRAP measurements from seven mice, the diffusion coefficient of sodium fluorescein was measured to be 3.3 ± 0.6 × 10⁻⁶ cm2/sec (Table 1).
Table 1. Anatomical parameters and tracer diffusion coefficients measured in the FRAP experiments.
| Animal no. | FRAP no. | A, μm2 | P, μm | a, μm | b, μm | Vs, μm3 | S, μm2 | N | d, μm | Vr | D (× 10–6 cm2/sec) |
|---|---|---|---|---|---|---|---|---|---|---|---|
| 1 | 1 | 84 | 36 | 7.3 | 3.7 | 412 | 288 | 11 | 30 | 0.04 | 3.2 |
| 2 | 85 | 39 | 8.2 | 3.3 | 370 | 282 | 11 | 22 | 0.03 | 3.3 | |
| 3 | 82 | 42 | 8.9 | 3.0 | 325 | 270 | 11 | 27 | 0.04 | 2.3 | |
| 2 | 1 | 125 | 48 | 10.0 | 4.0 | 664 | 415 | 16 | 22 | 0.02 | 4.1 |
| 2 | 107 | 42 | 8.7 | 3.9 | 564 | 363 | 14 | 28 | 0.03 | 4.7 | |
| 3 | 108 | 51 | 11 | 3.1 | 454 | 352 | 14 | 26 | 0.03 | 4.5 | |
| 3 | 1 | 100 | 40 | 8.0 | 4.0 | 535 | 343 | 14 | 25 | 0.03 | 3.8 |
| 2 | 85 | 37 | 7.4 | 3.7 | 418 | 291 | 12 | 31 | 0.04 | 2.3 | |
| 3 | 88 | 43 | 9.2 | 3.1 | 361 | 290 | 11 | 27 | 0.04 | 3.9 | |
| 4 | 1 | 86 | 37 | 7.4 | 3.7 | 426 | 295 | 12 | 21 | 0.03 | 3.3 |
| 2 | 73 | 44 | 9.7 | 2.4 | 235 | 235 | 9 | 31 | 0.05 | 2.4 | |
| 3 | 104 | 47 | 10.0 | 3.3 | 462 | 341 | 14 | 27 | 0.04 | 4.4 | |
| 5 | 1 | 72 | 36 | 7.6 | 3.0 | 291 | 239 | 9 | 30 | 0.04 | 2.6 |
| 2 | 99 | 41 | 8.3 | 3.8 | 500 | 334 | 13 | 21 | 0.02 | 2.8 | |
| 3 | 140 | 54 | 11.6 | 3.9 | 720 | 459 | 18 | 34 | 0.04 | 3.1 | |
| 6 | 1 | 74 | 47 | 10.3 | 2.3 | 226 | 237 | 9 | 28 | 0.05 | 3.0 |
| 2 | 55 | 30 | 5.9 | 3.0 | 217 | 188 | 7 | 20 | 0.03 | 3.4 | |
| 3 | 90 | 39 | 7.9 | 3.6 | 430 | 302 | 12 | 24 | 0.03 | 4.1 | |
| 7 | 1 | 79 | 41 | 8.7 | 2.9 | 305 | 259 | 10 | 25 | 0.04 | 2.9 |
| 2 | 86 | 38 | 7.7 | 3.5 | 405 | 290 | 11 | 19 | 0.02 | 2.3 | |
| 3 | 96 | 37 | 7.4 | 4.1 | 530 | 334 | 13 | 28 | 0.03 | 3.4 |
Lacunae were assumed to be prolate spheroids. See Materials and Methods for details of calculations. Three FRAP measurements were performed on different lacunae per animal within 1 h postmortem. For all 21 measurements, D = 3.3 ± 0.6 × 10⁻⁶ cm2/sec. Coefficients of variation of intra- and inter-animal measurements were 10–30% and 17%, respectively. A, lacunar area; P, lacunar perimeter; a, lacunar radius in the long axis; b, lacunar radius in the short axes; Vs, lacunar volume; S, lacunar surface area; N, number of contributing canaliculi; d, mean canalicular length; Vr, ratio of fluid volumes of the canaliculi and the lacuna; D, diffusion coefficient.
Discussion
Application of FRAP technology in combination with mathematical modeling has allowed us to quantify real-time solute diffusion within the lacunar-canalicular system of intact bones. This in situ imaging approach overcomes many of the difficulties associated with previous methods, where tracer efflux out of bone blocks was measured sequentially at different time points (17, 18). Because of the relatively large dimensions of the tissue blocks (in millimeters), completion of diffusion measurements took 6–24 h, during which time cells and tissues might have undergone some deterioration. In the current study, individual lacunae were photobleached with laser scanning microscopy. Because the perturbation introduced to the system (photobleaching) was limited to a microscopic region (lacunar dimensions: ≈20 × 10 × 10 μm3), the corresponding response of dye movement could be measured in <2 min. In addition, the fluorescent molecules were introduced while the animals were alive, eliminating the time-consuming tracer permeation requirement of previous studies (17). Finally, tracer movement was studied in situ, eliminating the confounding effects of tracer translocation during histological processing (15). Taken together, this method allowed us to quantify diffusive transport in bone and yielded reproducible measurements of a test tracer molecule.
We found that the diffusion coefficient of fluorescein measured in intact bone (3.3 × 10⁻⁶ cm2/sec) was similar to previously reported values (1.4–3 × 10⁻⁶ cm2/sec) for molecules of comparable size in explants of cartilage (36, 37). This value is 62% of the reported free diffusion for fluorescein in water (38), indicating that solute movement is somewhat restricted in the lacunar-canalicular system. This restricted diffusion is consistent with the concept of a gel-like pericellular matrix surrounding osteocytes (8, 13, 15).
Although the detailed structure of the pericellular matrix surrounding osteocytes is unknown, fiber matrix theory can be applied to the current data to predict the molecular sieving properties of the pericellular matrix as previously used in analyzing the structural features of the endothelial glycocalyx (16, 39, 40). Assuming that the osteocytic pericellular matrix is an ordered structure, like the endothelial glycocalyx, diffusion of a solute of radius a through this fibrous matrix relative to its free diffusion in aqueous solution will depend on fiber volume fraction (vf), fiber radius (rf), and solute radius (a). For a square fiber array, this relationship is given by
 |
[5] |
Because the vf is determined by the fiber radius rf and the fiber open gap (Δ, distance between two adjacent fiber boundaries)  , Δ can be predicted from the diffusion measurements and the radii of the solute and fibers
  . From the present study, Dfiber of fluorescein (radius a of 0.45 nm) through the canalicular pericellular matrix was found to be 62% of Dfree (38), leading to a prediction that Δ= 2.66rf + 2.37 nm. If the canalicular matrix fibers are assumed to resemble glycosaminoglycans (proteoglycan side chains) in an extended conformation (rf = 0.60 nm), the predicted fiber spacing Δ is 4.0 nm. However, this value seems too small to agree with the experimental evidence that tracers of 6 nm diameter can pass through canaliculi (15). On the other hand, an alternative structure of endothelial glycocalyx was proposed recently by Squire et al. (39) and Weinbaum et al. (40), where, instead of extended side chains, spherical clusters (radius of 5–6 nm) are attached to core proteins such that the clusters repeat every 20 nm in all three dimensions. This structure was found to allow for albumin exclusion, to better explain transendothelial permeability data, and to transmit fluid shear stresses to the actin cytoskeleton (39, 40). A matrix composed of these core proteins (radius of 2 nm) and associated spherical clusters (radius of 6 nm) can be modeled as a square array of cylinder fibers with an effective radius (rf) of 4 nm and a periodicity (Δ + 2rf) of 20 nm. The effective radius of 4 nm was determined by requiring that the array of the cylinder fibers has the same fiber volume as the matrix of core proteins and spherical clusters (vf = 12.6%). Fiber matrix theory (Eq. 5) predicts that the diffusion of fluorescein through this matrix will be 60% of its free diffusion, in good agreement with our measurements (62%).
The current study has certain limitations. Physically, the method necessitates the use of long working distance objective lenses and can only be used to observe lacunae up to 50 μm below the periosteal surface. Still, in a C57BL/6 mouse this distance represents about one-third of the tibial cortical thickness. Mathematically, a linear tracer profile is used as the initial condition to solve the diffusion equation in the recovery period. However, this will need to be reevaluated for larger tracers to assess the size dependence of solute mobility in the lacunar-canalicular system. Finally, 2D FRAP images are used to construct the 3D lacunar-canalicular model, wherein some parameters such as canalicular number density and canalicular dimensions are obtained from companion histological studies but not from direct measurements of the areas undergoing FRAP experiments. We are currently attempting to develop a new method that will allow anatomical measurements on the same lacunae as the FRAP experiments.
In summary, the combined approach of FRAP imaging and mathematical modeling has allowed us to measure diffusion directly within the lacunar-canalicular system of bone. Moreover, we have shown that this approach can be used to infer certain key structural characteristics of the osteocyte pericellular matrix, which governs transport to and from the osteocytes as well as their ability to sense fluid flow due to mechanical loading (8, 14, 22). Specifically, our measurements suggest that this matrix structure is consistent with that reported for endothelial glycocalyx (39, 40). Finally, this approach will also be applicable to studies of convective transport, permitting analysis of the contributions of blood pressure and mechanical loading to fluid and solute movement in bone.
This work was supported by National Institute of Arthritis and Musculoskeletal and Skin Diseases Grants AR41210 and AR48699 and by the National Space Biomedical Research Institute through National Aeronautics and Space Administration Grant NCC 9-58. The Mount Sinai Microscopy Facility was partially supported by National Institutes of Health–National Cancer Institute Grant 1R24 CA095823-01.
Supplementary Material
Author contributions: L.W. and M.B.S. designed research; L.W., Y.W., S.C.H., and R.J.M. performed research; L.W., Y.W., Y.H., S.W., and M.B.S. analyzed data; and L.W., R.J.M., S.W., and M.B.S. wrote the paper.
Abbreviation: FRAP, fluorescence recovery after photobleaching.
References
- 1.Cooper, R. R., Milgram, J. W. & Robinson, R. A. (1966) J. Bone Joint Surg. Am. 48, 1239-1271. [PubMed] [Google Scholar]
- 2.Piekarski, K. & Munro, M. (1977) Nature 269, 80-82. [DOI] [PubMed] [Google Scholar]
- 3.Ayasaka, N., Kondo, T., Goto, T., Kido, M. A., Nagata, E. & Tanaka, T. (1992) Arch. Oral Biol. 37, 363-369. [DOI] [PubMed] [Google Scholar]
- 4.Knothe Tate, M. L., Niederer, P. & Knothe, U. (1998) Bone 22, 107-117. [DOI] [PubMed] [Google Scholar]
- 5.Klein-Nulend, J., van der Plas, A., Semeins, C. M., Ajubi, N. E., Frangos, J. A., Nijweide, P. J. & Burger, E. H. (1995) FASEB J. 9, 441-445. [DOI] [PubMed] [Google Scholar]
- 6.Johnson, D. L., McAllister, T. N. & Frangos, J. A. (1996) Am. J. Physiol. 271, E205-E208. [DOI] [PubMed] [Google Scholar]
- 7.Cowin, S. C., Moss-Salentijn, L. & Moss, M. L. (1991) J. Biomech. Eng. 113, 191-197. [DOI] [PubMed] [Google Scholar]
- 8.Weinbaum, S., Cowin, S. C. & Zeng, Y. (1994) J. Biomech. 27, 339-360. [DOI] [PubMed] [Google Scholar]
- 9.Bentolila, V., Boyce, T. M., Fyhrie, D. P., Drumb, R., Skerry, T. M. & Schaffler, M. B. (1998) Bone 23, 275-281. [DOI] [PubMed] [Google Scholar]
- 10.Verborgt, O., Tatton, N. A., Majeska, R. J. & Schaffler, M. B. (2002) J. Bone Miner. Res. 17, 907-914. [DOI] [PubMed] [Google Scholar]
- 11.McCreadie, B. R., Hollister, S. J., Schaffler, M. B. & Goldstein, S. A. (2004) J. Biomech. 37, 563-572. [DOI] [PubMed] [Google Scholar]
- 12.Reilly, G. C., Knapp, H. F., Stemmer, A., Niederer, P. & Knothe Tate, M. L. (2001) Ann. Biomed. Eng. 29, 1074-1081. [DOI] [PubMed] [Google Scholar]
- 13.You, L., Weinbaum, S., Cowin, S. C. & Schaffler, M. B. (2004) Anat. Rec. 278A, 505-513. [DOI] [PubMed] [Google Scholar]
- 14.Han, Y., Cowin, S. C., Schaffler, M. B. & Weinbaum, S. (2004) Proc. Natl. Acad. Sci. USA 101, 16689-16694. [DOI] [PMC free article] [PubMed] [Google Scholar]
- 15.Wang, L., Cinai, C., Doty, S. B. & Fritton, S. P. (2004) Bone 34, 499-509. [DOI] [PMC free article] [PubMed] [Google Scholar]
- 16.Michel, C. C. & Curry, F. E. (1999) Physiol. Rev. 79, 703-761. [DOI] [PubMed] [Google Scholar]
- 17.Lang, S. B., Stipanich, N. & Soremi, E. A. (1974) Ann. N.Y. Acad. Sci. 238, 139-148. [DOI] [PubMed] [Google Scholar]
- 18.Fernandez-Seara, M. A., Wehrli, S. L. & Wehrli, F. W. (2002) Biophys. J. 82, 522-529. [DOI] [PMC free article] [PubMed] [Google Scholar]
- 19.Knothe Tate, M. L. & Knothe, U. (2000) J. Biomech. 33, 247-254. [DOI] [PubMed] [Google Scholar]
- 20.Mak, A. F., Qin, L., Hung, L. K., Cheng, C. W. & Tin, C. F. (2000) Microvasc. Res. 59, 290-300. [DOI] [PubMed] [Google Scholar]
- 21.Kufahl, R. H. & Saha, S. (1990) J. Biomech. 23, 171-180. [DOI] [PubMed] [Google Scholar]
- 22.Wang, L., Cowin, S. C., Weinbaum, S. & Fritton, S. P. (2000) Ann. Biomed. Eng. 28, 1200-1209. [DOI] [PubMed] [Google Scholar]
- 23.Otter, M. W., Palmieri, V. R. & Cochran, G. V. (1990) J. Orthop. Res. 8, 119-126. [DOI] [PubMed] [Google Scholar]
- 24.Wang, L., Fritton, S. P., Weinbaum, S. & Cowin, S. C. (2003) J. Biomech. 36, 1439-1451. [DOI] [PMC free article] [PubMed] [Google Scholar]
- 25.Peters, R., Peters, J., Tews, K. H. & Bahr, W. (1974) Biochim. Biophys. Acta 367, 282-294. [DOI] [PubMed] [Google Scholar]
- 26.Jacobson, K., Derzko, Z., Wu, E. S., Hou, Y. & Poste, G. (1976) J. Supramol. Struct. 5, 565(417)-576(428). [DOI] [PubMed] [Google Scholar]
- 27.Chary, S. R. & Jain, R. K. (1989) Proc. Natl. Acad. Sci. USA 86, 5385-5389. [DOI] [PMC free article] [PubMed] [Google Scholar]
- 28.Berk, D. A., Yuan, F., Leunig, M. & Jain, R. K. (1997) Proc. Natl. Acad. Sci. USA 94, 1785-1790. [DOI] [PMC free article] [PubMed] [Google Scholar]
- 29.Carrero, G., McDonald, D., Crawford, E., de Vries, G. & Hendzel, M. J. (2003) Methods 29, 14-28. [DOI] [PubMed] [Google Scholar]
- 30.Leddy, H. A. & Guilak, F. (2003) Ann. Biomed. Eng. 31, 753-760. [DOI] [PubMed] [Google Scholar]
- 31.Lippincott-Schwartz, J., Altan-Bonnet, N. & Patterson, G. H. (2003) Nat. Cell Biol. S1, S7-S14. [PubMed] [Google Scholar]
- 32.James, J. & Steijn-Myagkaya, G. L. (1986) J. Bone Joint Surg. Br. 68, 620-624. [DOI] [PubMed] [Google Scholar]
- 33.Gabryel, B., Adamek, M., Pudelko, A., Malecki, A. & Trzeciak, H. I. (2002) Neurotoxicology 23, 19-31. [DOI] [PubMed] [Google Scholar]
- 34.Burr, D. & Hooser, M. (1995) Bone 17, 431-433. [DOI] [PubMed] [Google Scholar]
- 35.Carslaw, H. S. & Jaeger, J. C. (1959) Conduction of Heat in Solids (Clarendon, Oxford), p. 491.
- 36.Maroudas, A., Bullough, P., Swanson, S. A. & Freeman, M. A. (1968) J. Bone Joint Surg. Br. 50, 166-177. [PubMed] [Google Scholar]
- 37.Nimer, E., Schneiderman, R. & Maroudas, A. (2003) Biophys. Chem. 106, 125-146. [DOI] [PubMed] [Google Scholar]
- 38.Fu, B. M., Curry, F. E. & Weinbaum, S. (1995) Am. J. Physiol. 269, H2062-H2073. [DOI] [PubMed] [Google Scholar]
- 39.Squire, J. M., Chew, M., Nneji, G., Neal, C., Barry, J. & Michel, C. (2001) J. Struct. Biol. 136, 239-255. [DOI] [PubMed] [Google Scholar]
- 40.Weinbaum, S., Zhang, X., Han, Y., Vink, H. & Cowin, S. C. (2003) Proc. Natl. Acad. Sci. USA 100, 7988-7995. [DOI] [PMC free article] [PubMed] [Google Scholar]
Associated Data
This section collects any data citations, data availability statements, or supplementary materials included in this article.