Abstract
Many complications associated with type 2 diabetes mellitus (T2DM) are closely linked with the generation of reactive species or free radicals leading to oxidative/nitrosative stress. The aim of this study was to investigate the effect of combined administration of metformin with propionate on the degree of oxidative/nitrosative damage in the brain of rats with an experimental model of T2DM. Male Wistar rats were divided into control (healthy rats); rats with T2DM and no further therapy; rats with T2DM that received: metformin, propionate, propionate + metformin. Ventromedial hypothalamus samples were analyzed by transmission electron microscopy, gas–liquid chromatography, Western blotting, RT-PCR and electron paramagnetic resonance. Combined treatment resulted in normalization of the neuronal NOS levels and reduction of mRNA level of induced nitric oxide synthase (NOS) and superoxide radicals compared to untreated T2DM rats. A decrease was also observed in the level of 8-oxyguanine with normalization of fatty acids distribution. The combined treatment partially mitigated ultrastructural alterations resulting from oxidative/nitrosative damage in neurons' mitochondria in T2DM. Thus, we demonstrated a positive effect of the combined use of metformin and propionate on all indicators of oxidative/nitrosative stress in T2DM.
Keywords: Diabetes mellitus, Metformin, Propionate, Oxidative/Nitrosative stress
Introduction
A lot of complications associated with type 2 diabetes mellitus (T2DM) are closely linked with the generation of reactive oxygen species (ROS) leading to oxidative/nitrosative stress. Oxidative stress is now understood to be a major underlying mechanism for mitochondrial dysfunction, ectopic lipid accumulation, and gut microbiota impairment [1, 2]. It is generally accepted that activation of oxidative stress is accompanied by the depletion of the antioxidant defense system. Additionally, there is an imbalance of nitric oxide synthase isoforms, namely neuronal and inducible (nNOS, iNOS). It is particularly dangerous for brain neurons, as signaling pathways induce apoptosis reactions, leading to neuronal damage [3, 4].
Neurons of the ventromedial nucleus of the hypothalamus (VMH) are one of the main centers for regulating glucose, lipids, and eating behavior [5, 6]. One of the pathogenetic reasons for the development of obesity in metabolic syndrome is the occurrence of resistance of hypothalamic neurons to leptin. The neurobiological basis of leptin resistance remains partially undiscovered. The hypothesis on the leptin resistance formation includes several mechanisms including inflammation in the hypothalamic nuclei, impaired neuronal autophagy, and endoplasmic reticulum (ER) stress in neurons [7–9]. Furthermore, ROS causes damage to the membranes of neurons and their membrane structures, which further worsens the condition of diabetic cells. Therefore, the treatment of T2DM should consider antioxidant drugs. The correction of T2DM should be long-term and permanent, therefore the search for drugs that combine several pathogenetic targets is highly recommended.
Metformin is a well-known hypoglycemic drug that is often used as an antidiabetic monotherapy. The effect of metformin on the state of brain neurons in the setting of T2DM is being actively studied. However, there is no consensus that metformin monotherapy is sufficient to compensate for diabetic encephalopathy [10, 11]. Although the liver is recognised as a major site of metformin pharmacodynamics, the drug has a number of actions within the gut. It increases intestinal glucose uptake and lactate production, increases GLP-1 concentrations and the bile acid pool within the intestine, and alters the microbiome [12, 13]. Large metagenomic studies in China and Europe have described gut microbial dysbiosis in association with obesity and T2DM. The general result was a decrease in the number of bacteria producing butyrate and propionate [14]. Increasing the number of bacteria that produce butyrate and propionate has been suggested to improve glycemia. [14].
Propionic acid, also known as propionate (PA), is reasonably considered a promising pharmacological strategy. First, it is a natural substance—a microorganism metabolite produced by gut microbial fermentation. Secondly, several studies emphasize the success of oral administration of propionate as a dietary supplement for the correction of neuroinflammation, especially of autoimmune origin [15–17].
Our previous studies were focused on the elucidation of the features of the unfolded protein response (UPR) system of the endoplasmic reticulum and autophagy mechanisms in the neurons of the ventromedial hypothalamus of rats with type 2 diabetes. We have shown a positive neuroprotective effect of the combined administration of metformin with propionate on the studied indicators of UPR. We suggested that treatment of propionate and metformin may induce a switch between autophagy and apoptosis in ventromedial hypothalamus to overcome cell death caused by T2DM [18, 19].
Targeting oxidative/nitrosative stress and neuroinflammation by propionate could be a promising therapeutic strategy for brain damage treatment. Taking into consideration the results of our previous study, this study aims to investigate the effect of combined administration of metformin with propionate on the degree of oxidative/nitrosative damage in the brain of rats with an experimental model of T2DM.
Results
Combined Metformin and Propionate Treatment of T2dm Rats Contributes to a Decreased Nnos Level
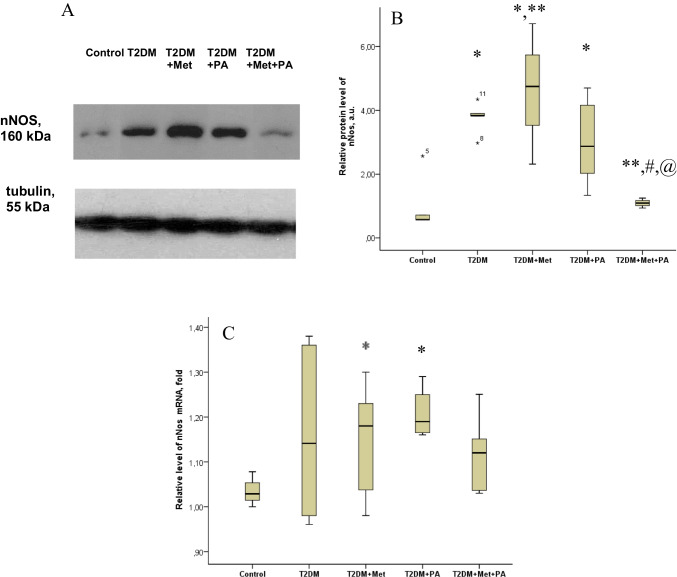
The level of the nitrosative stress marker nNOS in brain tissue was assessed using western blot analysis (Fig. 1A + B). Interestingly, the level of nNOS in the brain tissue of animals with T2DM was 3.77-fold increased compared to control (P = 0.013). In T2DM rats supplemented with metformin or propionate, the level of nNOS was 4.59-fold (P = 0.005) and threefold (P = 0.037) elevated, respectively. Combined administration of metformin and propionate reduced the level of nNOS by 3.5 times, which was nearly at the control level.
Fig. 1.
Effects of metformin and propionate (PA) administration on nNOS in rat brain. A Immunoblot analysis of nNOS in rat VMH: representative immunoblots quantified using tubulin as a loading control for hypothalamic lysates are shown. B nNOS data are presented as mean ± SD (n = 6 rats per group), C relative expression of nNOS mRNA in rat brain: data are normalized to β-actin, results of 3 independent measurement (n = 6 rats per group). All data are presented as mean ± SD; * P < 0.05 vs control, ** P < 0.05 vs T2DM, # P < 0.05 vs metformin administration and @ P < 0.05 vs PA administration
Analysis of nNOS mRNA expression (Fig. 1C) in brain tissue of different rat groups showed the following pattern. nNOS mRNA was increased in T2DM group compared to the control group, but did not reach statistical significance. Both metformin and propionate, when used separately, individually led to an increase in nNOS mRNA. The addition of propionate resulted in a 1.2-fold increase in nNOS mRNA (P = 0.046) compared to the control group. However, the combination of metformin and propionate did not cause an increase in nNOS mRNA levels in rats with T2DM, unlike the administration of each drug alone. The value was 5% lower than in the T2DM group and was closest to the control level.
Reduced Superoxide Radicals and 8-Oxoguanine Level in Brain of T2DM Rats After Combined Metformin and Propionate Treatment
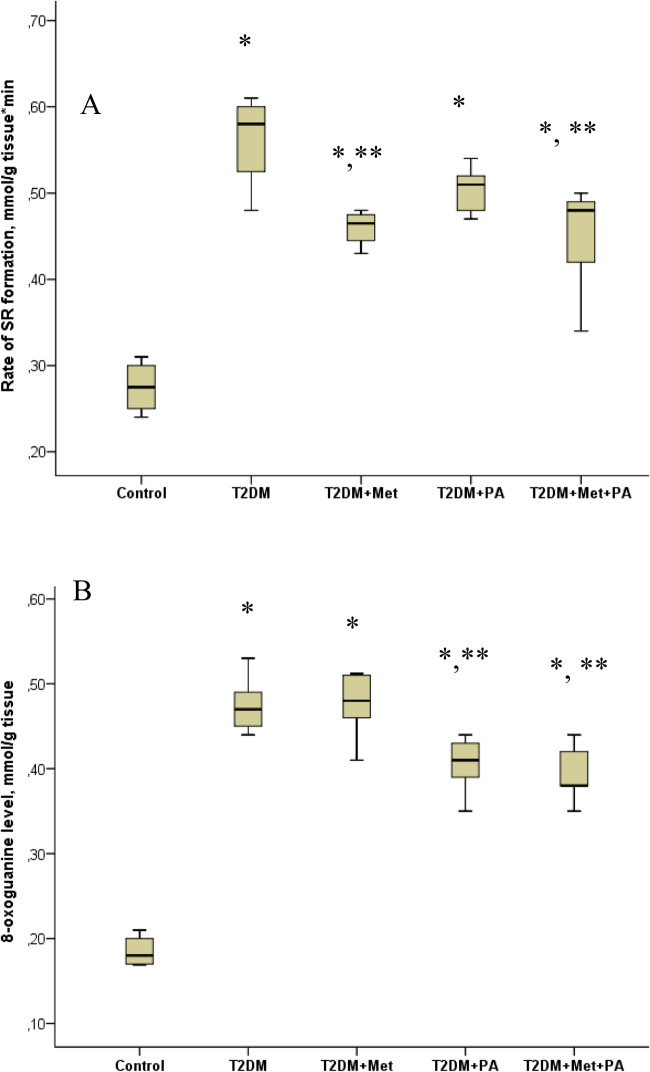
The rate of formation of superoxide radicals (SR) and 8-oxoguanine level (Fig. 2) were determined as markers of brain damage in rats due to oxidative stress [4]. The SR generation in the brain tissue of T2DM rats increased 2.1-fold compared to control rats (P = 0.00009). In T2DM rats treated by metformin or propionate, the level SR was not significantly affected. Combined supplementation with metformin and propionate led to a decrease in the formation of SR by 1.5-fold relative to T2DM rats without treatment (P = 0.005). When examining the level of 8-oxoguanine in the brain tissue of rats with T2DM, we found it increased by 2.6-fold compared to the levels in control rats (P = 0.0003). The supplementation with metformin did not significantly affect the level of 8-oxoguanine. Under the conditions T2DM, the addition of propionate decreased the level of 8-oxoguanine by 1.2 times (P = 0.048). Combination of metformin and propionate of rats with T2DM, reduced the level of 8-oxoguanine by 1.3-fold compared to T2DM rats (P = 0.046).
Fig. 2.
Effect of metformin and propionate (PA) administration on the rate of SR formation (A) and 8-oxoguanine level (B) in rat brain. The results of 3 independent measurement (n = 6 rats per group) are presented. All data are shown as means ± SD; ∗ P < 0.05 vs. control, ∗ ∗ P < 0.05 vs. T2DM
Fatty Acid Composition Under Metformin and Propionate Treatment of T2DM Rats
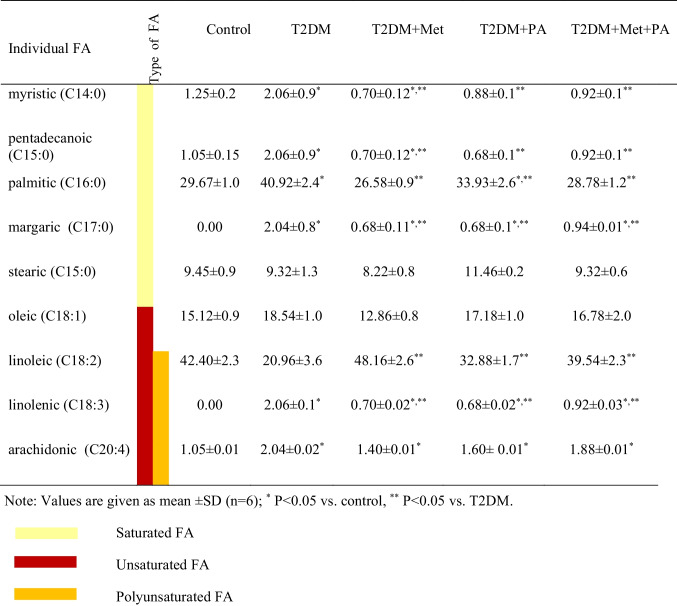
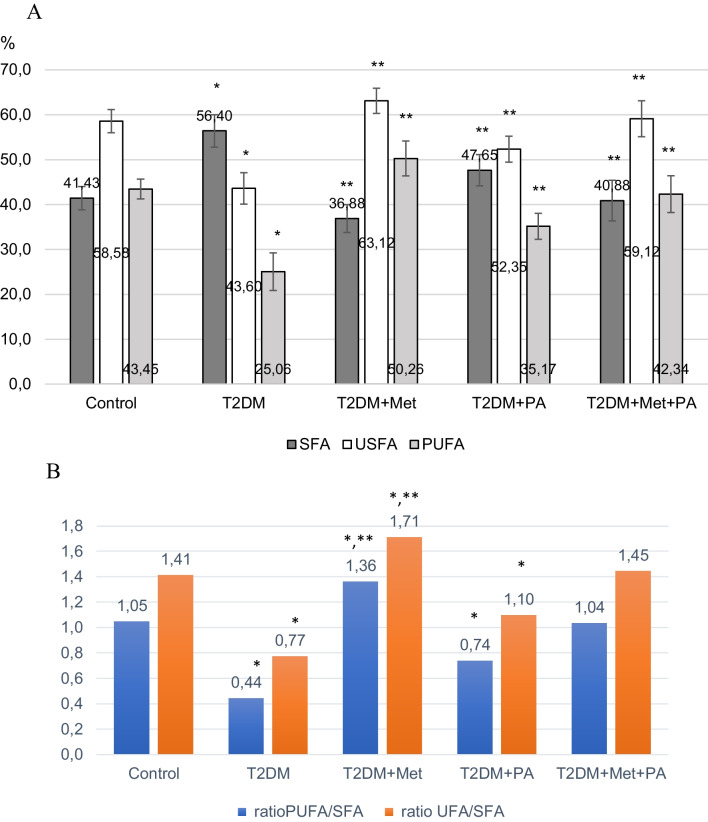
One of the important indicators of lipid metabolism is the spectrum of fatty acids (FA) in body tissues, which is more informative than the analysis of the lipid level of blood plasma cholesterol or triglycerides, which circulate in the blood. Table 1 shows the changes in each type of FA that we studied. The redistribution of FA content against the background of T2DM and treatment is shown (Fig. 3).
Table 1.
Fatty acids (FA) profiles, saturated (C14:0), (C15:0), (C16:0), (C17:0), (C15:0), unsaturated (C18:1), (C18:2), (C18:3), (C20:4) and polyunsaturated (C18:2), (C18:3), (C20:4) fatty acids measured in the homogenates of brain tissue
Fig. 3.
Percentage amount of each FA type: of saturated (C14:0), (C15:0), (C16:0), (C17:0), (C15:0), unsaturated (C18:1), (C18:2), (C18:3), (C20:4) and polyunsaturated (C18:2), (C18:3), (C20:4) fatty acids measured in the homogenates of brain tissue after metformin and/or propionate (PA) administration on the background of T2DM (A). A diagram showing the ratio PUFA/SFA, UFA/SFA (B). Data are shown as means ± SD (n = 6 rats per group); * P < 0.05 vs. control, ** P < 0.05 vs. T2DM
It has been established that the development of T2DM is characterized by a change in the distribution of fatty acids (FA) compared to the control group: a 1.7-fold decrease in polyunsaturated (PUFA) (P = 0.035), a 1.3-fold decrease in unsaturated (USFA) (P = 0.028), and a 1.4-fold increase in saturated (SFA) (P = 0.032).
Treatment with metformin reduced the content of SFA, but increased the content of PUFA and USFA even more than the control levels. Propionate administration decreased SFA levels and increased USFA relative to T2DM, but their ratio was different from that of the control group. Thus, only treatment with a combination of metformin and propionate effectively restored the FA ratio to that of the control.
The calculation of the PUFA/SFA and USFA/SFA indices (Fig. 3B) clearly demonstrates the positive effect of the combination of metformin with propionate, as the indices in this group of animals are almost indistinguishable from those of the control group. However, the indices are significantly lower in the T2DM group, showing a 2.4-fold and 1.8-fold reduction compared to the control (P < 0.05). Metformin administration increases the indices relative to T2DM group by threefold and 2.2-fold (P < 0.05), exceeding control levels by 1.3-fold and 1.2-fold (P < 0.05). Propionate administration increases the indices relative to T2DM group by 1.7-fold and 1.4-fold (P < 0.05), but the values remain lower than those of the control.
Changes of Neuronal Architecture Under Metformin and Propionate Treatment in T2DM Rats
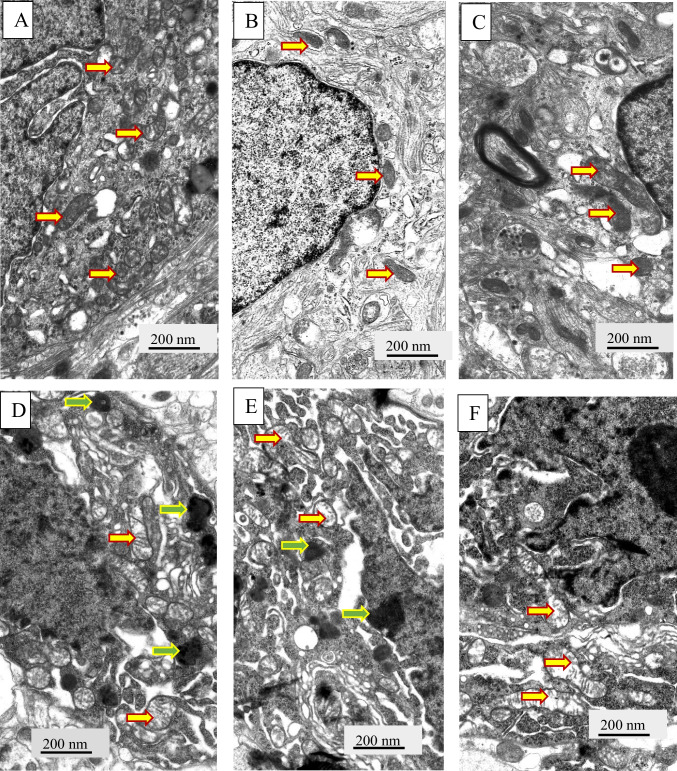
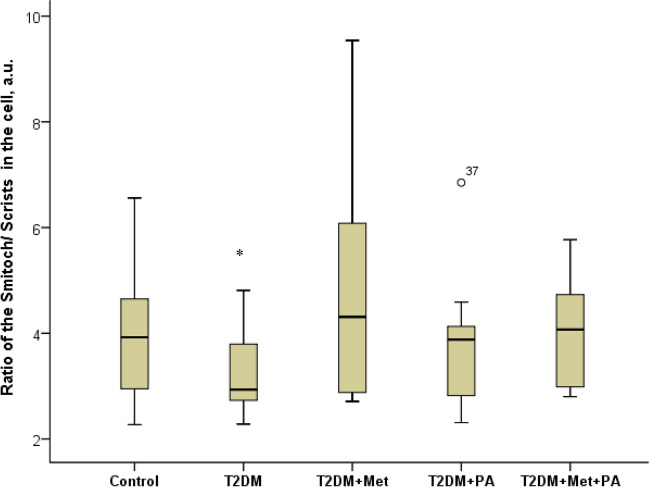
In the next step, we analyzed ultrastructural changes of neurons` mitochondria in rats with T2DM by electron microscopy (Figs. 4, 5). We found that the mitochondria of damaged neurons (Fig. 4D-F) are significantly different from the mitochondria of the control group (Fig. 4A-C). Most mitochondria have damaged structural organization, which is associated with both swelling of the matrix of these organelles and destruction of cristae. Thus, we observed a decrease in the ratio of the mitochondria areas to crists areas in cells of T2DM rats confirming swelling in the mitochondria structure (Fig. 5).
Fig. 4.
Ultrastructural changes of VMH neurons and glial cell were assessed by electron microscopy observations. Gallery of micrographs obtained by scanning electron microscope (n = 12 neurons for each group): A, B, C – control rats; D, E, F – rats from the T2DM group rats. Representative images of neurons are presented on A, C, D, E, F panels, and glial cells – B panels. The yellow arrows indicate mitochondria, green arrows – lipofuscin granules. Scale bar: 200 nm
Fig. 5.
Structural parameters of the mitochondria’s after metformin and propionate administration on the background of T2DM: ImageJ software was used to calculate the Smitoch—areas of the mitochondria and the Scrists—area of crists in each cell based on the electronic microscopic microphotographs. We counted at least 7–10 mitochondria in each neuron, while in each group we studied 6 neurons. Values are given as mean ± SD. *p < 0.05 compared with control
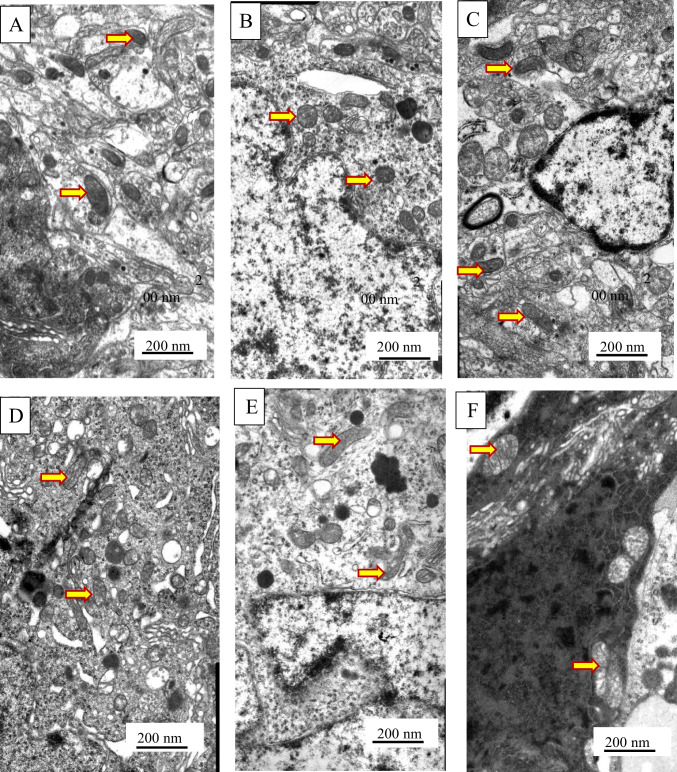
An interesting trend was observed under the influence of pharmacological supplementation metformin and propionate of T2DM. Thus, we observed the normalization of neuronal architecture almost to the control stage with improvement of all altered parameters (Fig. 6). The structure of mitochondria was re-established. The volumetric size of the mitochondria and the area of their cristae returned to the control levels (Fig. 5). They were well visualized, with distinct cristae that were almost indistinguishable from controls. However, the administration of metformin was accompanied by a visible accumulation of lipofuscin granules in the cytoplasm of VMH neurons.
Fig. 6.
Ultrastructural changes of VMH neurons were assessed by electron microscopy observations. Gallery of micrographs obtained by scanning electron microscope (n = 12 neurons for each group): A, B – metformin group; C, D – propionate group; E, F – metformin and propionate group. The arrows indicate mitochondria. Scale bar: 200 nm
Discussion
The markers we selected to assess the degree of oxidative/nitrosative damage in the brains of rats are closely associated with mitochondria and are reflected in their ultrastructure. Mitochondria are extremely important cellular organelles, especially for neurons, given their high ATP demand and their sensitivity to its reduction. Thus, mitochondria disruption can have major damage of neurons.
Neuronal NOS is widely distributed in the nervous system, modulating synaptic transmission and neuroplasticity. However, an excessive increase in NO turns the neuronal messenger into a strong oxidant, which can cause inflammation, oxidative/nitrosative stress, mitochondrial dysfunction and apoptosis. Activation of nNOS and increase of NO level become most dangerous if they occur simultaneously with increased production of free radicals [20, 21]. Hypoxia in T2DM and inhibition of the respiratory chain lead to increased ROS formation and Ca2+ imbalance in the cytosol. NO additionally competes for oxygen with cytochrome oxidase, which exacerbates mitochondrial dysfunction and reduces the body’s ability to fight ROS.
8-oxoguanine (7,8-Dihydro-8-oxoguanine), one of the major oxidative DNA adducts, is highly susceptible to further oxidation by radicals. It has a higher reactivity of 8-oxo-G toward reactive oxygen (singlet oxygen and hydroxyl radical) or nitrogen (peroxynitrite) species as compared to an unmodified base. 8-oxoguanine within DNA induces intramolecular DNA base damage [22]. The strong relation between ROS production and 8-oxoG formation makes it a good and commonly used cellular biomarker of oxidative stress [23, 24].
Superoxide is a primary oxygen radical that is produced when an oxygen molecule receives one electron. Polyunsaturated fatty acids are the preferred target of hydroxyl radicals. Radical electrons, namely those released from mitochondrial electron transfer complexes, and those produced by enzymatic reactions, such as lipoxygenases, appear to cause lipid peroxidation [25].
We observed an increase in nNOS in the group with T2DM, which was expected. Additionally, we demonstrated an increase in reactive superoxide generation in the brain tissue of rats with T2DM. The evident mitochondrial damage we observed in the electron micrographs aligns with our data showing elevated levels of superoxide formation and 8-oxoguanine in the brains of rats, further reflecting the impact of oxidative/nitrosative stress in the context of T2DM. NO interacts with various molecules, including lipids [26]. This highly reactive nitrogen species causes harmful oxidative damage to unsaturated fatty acids found in membranes, such as polyunsaturated fatty acids (PUFAs) [27]. According to our data, the development of T2DM is accompanied by a redistribution of fatty acids, with a significant increase in SFA and a critical decrease in PUFA. It can be hypothesized that the decrease in PUFA occurs due to the active use of these fatty acids in biochemical reactions with NOS, leading to an increase in reactive oxygen species and exacerbating oxidative/nitrosative stress in neurons.
The most unexpected finding of our study was the higher increase in nNOS in the group with T2DM receiving monotherapy with metformin compared to the T2DM group, as well as the high level of 8-oxoG in the context of metformin administration.
Nowadays, we have no explanation for the increase of nNOS in the VMH neurons of experimental group of rats with T2DM when using metformin administration. A number of modern reviews are focused on the evaluation of the effectiveness of metformin as a neuroprotective agent in neuroinflammation.
In a previous study [28], researchers pointed to the direct neuroprotective effect of metformin using the etoposide-induced cell death model. Here, cytotoxic insult induced the mitochondrial pore opening, the dissipation of membrane potential, cytochrome release, and subsequent cell death. Metformin together with the classical inhibitor cyclosporin strongly mitigated the activation of this apoptotic cascade [28]. Another work shows that metformin activated AMP-activated protein kinase in cultured cells of substantia nigra, inducing autophagy and eliminating mitochondrial ROS, alleviated cytotoxicity, and attenuated neuronal apoptosis [29]. Furthermore, metformin protected dopaminergic neurons by the ATF2/CREB-PGC-1α pathway and improved dopamine-sensitive motor performance in Parkinson's disease animal models [30].
Metformin has been shown to reduce the expression and activity of beta-secretase 1 (BACE1) protein in cell culture models and in vivo, thus reducing BACE1 breakdown products and Aβ (β-amyloid) production [31]. However, metformin has been found to increase Aβ formation, which in turn indicates that metformin therapy may contribute to the development of Alzheimer’s disease [32]. There are also isolated data on the antioxidant properties of metformin obtained in a rat model of Alzheimer’s disease. The authors indicate that metformin treatment reduced the damage to CA1 neurons in the hippocampus and also reduced the intensity of immunohistochemical accumulation of 3-nitrotyrosine as an indicator of nitrosative stress [33]. However, there is no consensus on the effectiveness of metformin as an antioxidant and neuroprotector [21, 26, 34–36].
Improvement of neural tissue after metformin treatment was demonstrated in our previous studies on morphofunctional damage to the VMH neuron in rats with T2DM and correction. However, compared with the T2DM group, we observed an increase in the number of lysosomes and autophagosomes, swelling of myelin fibers, accumulation of autophagosomes, and a decrease in the volume and relative area of ER cisternae were observed after metformin treatment [19]. The increased lysosomes and autophagosomes as signs of autophagy, correlated with elevated levels of the anti-apoptotic protein Bcl-xL, autophagy markers LC3 and Beclin-1, and a decrease in pro-apoptotic proteins BAX and Caspase-3 in comparison to T2DM animals. Nevertheless, some adverse effects such as the conspicuous aggregation of lipofuscin granules in the cytoplasm of VMH neurons and the development of reactive astrogliosis were present by the administration of metformin. The accumulation of lipofuscin is considered an indicator of "cell aging," and also hampers the ubiquitin-proteasomal system, appropriate stress response, and intensifies the oxidation of unsaturated fatty acids, all of which together could lead to neuronal degeneration.
To correct the disturbances in nervous tissue caused by T2DM, we chose metformin and propionate. Currently, research is being conducted on the mechanism of propionate's influence on neurons, as it is not fully understood. We observed a positive effect of propionate on most of the indicators we studied. Specifically, the levels of nNOS, 8-oxoguanine, and fatty acids in rats with T2DM improved with propionate administration. There were also positive changes in the structural components of neuronal mitochondria. However, recommending propionate monotherapy for type 2 diabetes should be approached with caution, as it is a dietary supplement that cannot be recommended without baseline therapy. However, our data provided additional evidence of the effective pharmacological action of the combination of metformin with propionate for restoring the architecture of neurons in the brain to normal, especially their mitochondria.
We found an unexpected effect of the combined use of metformin and propionate, which resulted in the normalization of nNOS in the brain tissue of experimental animals. By administering metformin and propionate together, we observed the most significant reduction in the oxidative stress marker, SR consequently enhancing brain tissue protection against the harmful effects of ROS. This was supported by a decrease in the level of 8-oxoG in rats with T2DM.
During treatment with metformin, compared to the T2DM group, we observed a positive change in the spectrum of fatty acids in neurons, caused by a decrease in saturated fatty acids and an increase in polyunsaturated fatty acids, approaching the fatty acid ratio seen in the control group.
The combined use of drugs demonstrates the highest effectiveness in establishing the ratio of SFA/UFA/PUFA, which also emphasizes the positive effect of propionate with metformin treatment on the metabolism of fatty acids in brain tissue in rats with T2DM.
Our data reflects the positive effect of the combined administration of metformin and propionate on all indicators of oxidative/nitrosative stress, which inevitably occurs in T2DM. We consider the decrease of oxidative/nitrosative stress in neurons as a decrease of inflammation and the resumption of homeostasis in the cells of the nervous system. The search for new pharmacological therapies to treat T2DM that minimize oxidative/nitrosative damage to cells remains an urgent problem [37, 38].
Today, we know that intestinal bacteria can affect the central nervous system physiology and inflammation [39, 40]. The nervous system and the gastrointestinal tract are communicating through a bidirectional network of signaling pathways called the gut-brain axis, which consists of multiple connections, including the vagus nerve, the immune system, and bacterial metabolites and products. During dysbiosis, these pathways are dysregulated and associated with altered permeability of the blood–brain barrier and neuroinflammation [14, 39, 40].
Elbere et al. [41] present data on metformin effects on the human gut microbiome profile and present novel data for therapeutic efficacy and tolerance prediction in newly diagnosed T2DM patients. Authors have characterized the differences representing metformin effects in T2DM patients and healthy individuals, accenting the need for additional microbiome studies in groups with different responses to metformin therapy. Another study aimed to examine metformin-induced alterations in gut microbiome diversity composition and functional implications of high-fat diet-induced T2DM mouse model applied for the first time in a mouse model. The authors observed sex-specific differences in response to metformin treatment [42]. Another study [43] supports the immunomodulatory effect of metformin in the ileum of obese and insulin-resistant C57BL/6N mice contributed by intestinal immunoglobulin responses, with a prominent emphasis on the downregulation of NF-kappa B signaling pathway, associated with alterations in the composition of the gut microbiome.
Taken together, we believe that the positive effect of the combined administration of metformin and propionate, which we see in animals with T2DM is the result of a positive effect on the intestinal microflora, which, in turn, was damaged by metformin monotherapy.
These data might provide new ideas for the development of more effective schemes of pharmacological treatment of T2DM, metabolic syndrome and other diseases accompanied by autonomic disorders on the background of neuroinflammation.
Materials and Methods
Animals
The current research utilized young male Wistar rats (176.8 ± 8.3 g) aged two months. All procedures involving animals adhered to both national guidelines and international laws governing animal welfare. Specifically, these included the “European Convention for the protection of vertebrate animals used for experimental and other scientific purposes” (Strasbourg, 1986), and “Bioethical expertise of preclinical and other scientific research conducted on animals” No. 3447-IV (Kyiv, 2006). The experiments conducted on rats were approved by the Bioethics Committee of the Bogomolets National Medical University (Protocol No. 123 from 26/09/2022).
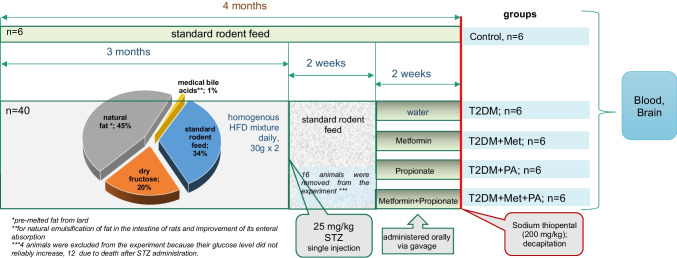
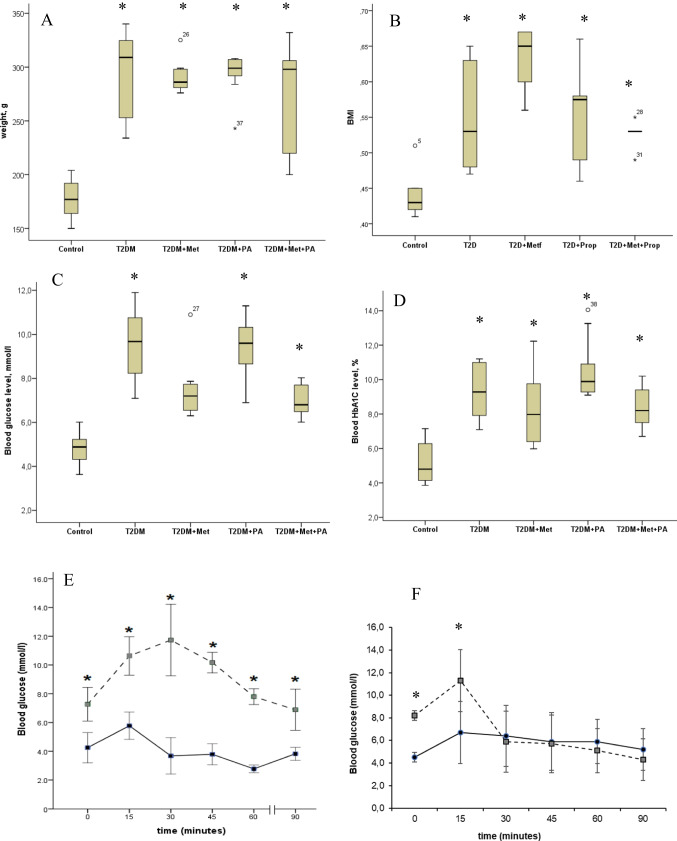
The rats were kept in conditions with a 12 h light/dark cycle (24 ± 2 °C, 65 ± 5% humidity), and they had access to a standard, balanced rodent diet and water without restrictions. To induce experimental T2DM, the rats were subjected to prior described standard protocol [44, 45]. The design scheme of the experiment is shown on Fig. 7. They were fed a uniform mixture of a high-fat diet (HFD) comprising standard rodent feed (34%), pre-melted fat from lard (45%), medical bile acids (1% for natural emulsification of fat in the rats’ intestines and improvement of its absorption), and dry fructose (20%). Subsequently, STZ administration was performed intraperitoneally after 3 months of the HFD. Following the injection, the rats were transitioned to a standard rodent food and monitored for 2 weeks. Two weeks post-STZ injection, the adequacy of the diabetes model was evaluated through anthropometric measurements, assessment of biochemical parameters, and insulin tolerance tests (Fig. 8). The T2DM group exhibited a notable increase in weight and waist compared to the control group, indicating the onset of obesity. However, treatments involving propionate and metformin showed no significant effect in reducing these parameters.
Fig. 7.
Each experimental group consisted of 6 animals. These included healthy animals as a control group, a group with T2DM without correction (which received water), and 3 groups with treatment. T2DM was induced by a high-fat diet followed by a single injection of streptozotocin (STZ, 25 mg/kg of b.w.). The first group of animals T2DM-induced group treated with metformin (GLUKOFAGE, Merck Sante, France), at a dose 60 mg/kg of b.w., for 14 days, orally on the background of T2DM. The other group treated with propionate (PROPICUM®, Flexopharm Brain GmbH & Co, Germany) at a dose 60 mg/kg of b.w., for 14 days, orally on the background of T2DM. The third group receiving both metformin and propionate concurrently while having T2DM. Following the two-week treatment, the rats were euthanized by decapitation under deep anesthesia induced by Sodium thiopental (200 mg/kg)
Fig. 8.
The animal body parameters: weight (A), body mass index (B), blood glucose (C), and HbA1C (D) after diabetes induction and metformin and propionate (PA) administration. Test results: oral glucose tolerance tests (E), intraperitoneal insulin tolerance test (F) on control rats (n = 6, solid line) and rats with T2DM (n = 6, dashed line). Blood samples were collected from the tail at the indicated time points and analyzed for glucose concentration (mmol/l). Values are means ± SD. *p < 0.05 compared with control
Furthermore, to gauge the insulin-sensitive nature of tissues, an intraperitoneal tolerance test was conducted based on measuring glucose levels in circulation post an intraperitoneal insulin injection (Fig. 8F). Four animals were excluded from the experiment because their glucose level did not reliably increase. Additionally, 12 animals died after STZ administration. To determine the necessary sample size for conducting a correlation analysis, the "MedStat" program was used ("MedStat v 5.2", Lyakh Yu.E., Guryanov V.G., Ukraine, 2004). The calculation was conducted at 80% power and at 5% significance level. It was established that N = 6 in each sample is sufficient to determine the effect of the intervention.
Glucose Tolerance Test, Intraperitoneal Insulin Tolerance Test Interpretation
To assess the adequacy of the model and confirm tissue insulin resistance, we conducted the following tests: the oral glucose tolerance test (OGTT) (Fig. 8E) and the intraperitoneal insulin tolerance test (ipITT) (Fig. 8F). For the OGTT, we administered a glucose solution (2 g/kg) orally via gavage and measured blood glucose levels from the tail vein every 15 min, six times, from the fasting baseline level. The next day, we performed the ipITT. After measuring the baseline glucose level in fasting animals, we administered a glucose solution orally via gavage and then injected an insulin solution intraperitoneally (0.175 MU/kg, Actrapid Novo Nordisk, Denmark) over 3–4 min. Blood glucose levels were measured from the tail vein every 15 min.
In rats with T2DM, the baseline glucose level was 7.26 ± 0.45 mmol/L, with a peak value of 11.73 ± 0.96 mmol/L reached at 30 min. It then gradually decreased to 10.17 ± 0.27 mmol/L at 45 min and 7.8 ± 0.21 mmol/L at 60 min. The minimum level in the T2DM group was recorded 90 min after injection (6.88 ± 0.55 mmol/L). In the control group, the baseline value was 4.25 mmol/L. Over 15 min, glucose levels increased 1.3-fold (5.77 ± 0.29 mmol/L), returning to baseline after 30 min. At 60 min, the glucose level reached its minimum (2.7 ± 0.08 mmol/L) and then rose to 3.8 ± 0.14 mmol/L after another 15 min.
The results of the ipITT showed that the tissues of the control animals actively utilized glucose in response to additional insulin administration. Consequently, we observed the peak glucose level in the control group at 15 min (6.7 ± 1.1 mmol/L). Glucose levels then gradually decreased to (5.9 ± 0.7 mmol/L) at 45 and 60 min, with the minimum value recorded at 90 min (5.2 ± 0.68 mmol/L). In T2DM animals, the kinetics were different. From the baseline level (8.2 ± 0.02 mmol/L), a peak glucose level of 11.3 ± 1.3 mmol/L was recorded at 15 min, followed by a sharp decrease to 5.9 ± 1.2 mmol/L. Subsequently, glucose levels decreased very slowly to 5.7 ± 0.9 mmol/L and 5.1 ± 0.8 mmol/L at 45 and 60 min, respectively. The minimum was recorded at 90 min (4.3 ± 0.71 mmol/L). As expected during the model validation, glucose intolerance and insulin sensitivity impairment were observed in the T2DM rats, confirming the disruption in glucose regulation.
Experimental Design and Groups
Each experimental group consisted of 6 animals (Fig. 8). The doses of the drugs were calculated using the species tolerance coefficient according to Yu. R Rybolovlev [46], based on the daily dose for humans. Groups included: healthy animals as a control, a group with T2DM, another T2DM-induced group treated for 14 days: with metformin (GLUKOFAGE, Merck Sante, France) at a dose 60 mg/kg of b.w.; a group treated with propionate (PROPICUM®, Flexopharm Brain GmbH & Co, Germany) at a dose 60 mg/kg of body weight, and a group receiving both metformin and propionate in this dosage concurrently. These agents were administered orally via gavage. In the group with T2DM, rats were given water in a comparable volume.
Following the two-week treatment, the rats were euthanized by decapitation under deep anesthesia induced by Sodium thiopental (200 mg/kg).
Slice Preparation and Electron Microscopy
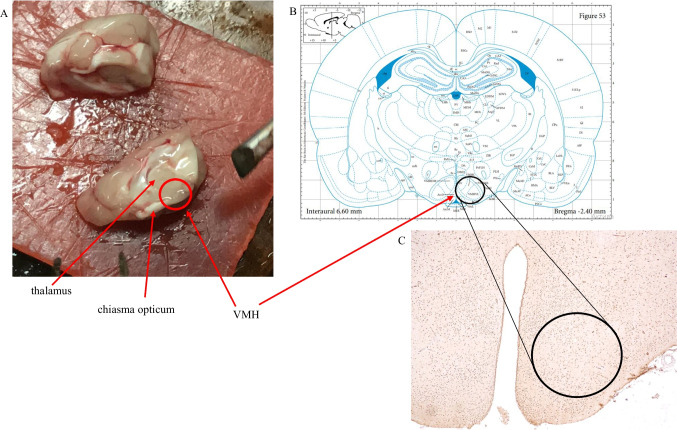
We used brain landmarks as well as a brain atlas (Fig. 9) to guide the process of sampling from the rat ventromedial hypothalamus (VMH). Samples from the rat VMH were collected and initially fixed in 2.5% glutaraldehyde for 4 h in Millonig's phosphate buffer (pH 7.4). Subsequently, the tissue underwent additional fixation with 1% osmium tetroxide for 1 h. The slices were briefly rinsed in distilled water and then dehydrated using a sequence of graded ethanol (70%, 80%, 90%, 100%) and acetone. Following this, the slices were embedded in a mixture of epon-araldite (Epoxy embedding medium, #45,345-250ML-F, Epoxy embedding medium, hardener DDSA, #45,346-250ML-F, Araldite, #10,951-250ML, Sigma, USA). Both semi-thin and ultrathin sections were produced using an ultramicrotome known as “LKB III” (Sweden). To confirm the precise brain area under investigation, semi-thin Sects. (2–3 µm) were stained using methylene blue following the Hayat method [47]. Ultrathin Sects. (600–900 Å) were contrasted using a 2% uranyl acetate solution and lead citrate. These sections were examined through a transmission electron microscope “PEM-125” (Ukraine) at magnifications ranging from 6000 × to 20000x. The ImageJ software facilitated the calculation of mitochondria areas and cristae areas within each cell. Furthermore, the ratio between these measurements was computed across the groups for analysis.
Fig. 9.
Process of ventromedial hypothalamus area (VMH) identification. A—macroscopic brain landmarks; B—The Rat Brainin Stereotaxic Coordinates George Paxinos Charles Watson. International Standard Book Number: 0–12-547,623-X (Bregma -2,4 mm); C—IGH staining of the brain slice
RNA Isolation, cDNA Synthesis, and Real-Time PCR Analysis
VMH samples, averaging 0.03 g in weight, were gathered, and their total RNAs were extracted through the GeneJET RNA Purification Kit (Thermo Fisher Scientific Inc., USA). The concentration and purity of mRNA were assessed using the DeNovix DS-11 FX + at wavelengths of 230, 260, and 280 nm, determining the OD260/280 and OD260/230 ratio. To eliminate residual DNA, RNA templates underwent treatment with RNAse-free DNAse I (Thermo Fisher Scientific Inc., USA). Purified RNA from tissue samples underwent conversion to cDNA via a reverse transcription process using the RevertAid First Strand cDNA Synthesis Kit (Thermo Fisher Scientific Inc., USA). The resulting cDNA samples served as templates for real-time PCR analysis, performed on the 7500 Real-time PCR System (Life Technologies Corporation, USA). Target genes were amplified for 40 cycles using Maxima SYBR Green/ROX qPCR Master Mix (Thermo Fisher Scientific Inc., USA). This two-stage RT-PCR amplification reaction followed specific conditions: initial denaturation at 95 °C for 5 min, succeeded by 40 cycles at 95 °C for 15 s, and then at 60 °C for 50 s. Primer sequences, designed using the Primer-BLAST software (USA), are listed in Table 2. β-Actin served as the housekeeping gene. Data were computed as the fold change concerning the control using the ΔΔCt method [48]. All experiments were conducted in duplicate runs.
Table 2.
Primers used in this study
| Primer name | Forward primer sequence (5′ → 3′) | Reverse primer sequence (5′ → 3′) |
|---|---|---|
| nNOS | GAGGAATGGAGGGGTCTAAGG | TGGCTGTGGTAAGTAATGGAGC |
| β-Actin | TGCAGAAGGAGATTACTGCCCTGG | GCTGATCCACATCTGCTGGAAGG |
Protein Extract Preparation and Western Blot Analysis
Protein levels of the target were evaluated through western blot analysis. Standard protocol involved preparing total protein extracts from frozen hypothalamus samples using RIPA homogenizing buffer (containing 20 mM Tris–HCl, pH 7.5; 150 mM NaCl; 1% Triton X-100; 1 mM EGTA; 0.1% SDS; 1% sodium deoxycholate; and 10 mM sodium pyrophosphate). VMH samples weighing 0.03 g were lysed for 20 min in a mixture of RIPA and protease inhibitor cocktails (1:9), followed by centrifugation at + 4 °C for 20 min (at 14,000 × g); the resulting pellets were discarded. The protein concentration in the supernatants was determined using the Stoscheck method [49]. Equal amounts of protein (50 μg per lane) from each sample were loaded onto a 10–15% resolving gel for electrophoresis. Subsequently, the proteins were transferred to a nitrocellulose membrane (#HATF00010, Immobilon-NC Transfer Membrane, 0.45 μm pore size, Merck Millipore, USA). These membranes underwent blocking with 5% nonfat milk in phosphate-buffered saline containing Tween-20 (PBST) for an hour, followed by overnight incubation at + 4 °C with primary antibodies targeting nNOS (1:2000, #07–571-I, Sigma-Aldrich, USA) and tubulin (1: 1000, T5168, Sigma-Aldrich, USA) in PBST and nonfat milk. After this, the membranes were incubated with HRP-conjugated secondary anti-rabbit IgG (1:4000, #A0545, Sigma-Aldrich, USA). Band visualization was achieved through enhanced chemiluminescence using chemiluminescent agents like p-coumaric acid and luminol (both Sigma-Aldrich, USA). The levels of nNOS were normalized to the levels of tubulin. The immunoreactive bands were quantified using Gel-Pro Analyzer32, v3.1 (USA).
Analysis of Fatty Acids Composition
The study of the composition of fatty acids (FA) in tissue homogenates of brain tissues was carried out by gas–liquid chromatography according to the standard method [50]. FA were identified by peaks on the chromatogram, comparing their retention time with the retention time of peaks of standard pure substances with known qualitative and quantitative composition. Quantitative assessment of the spectrum of FA was carried out by normalizing the peak areas of methylated FA derivatives and determining their composition in percent, where the sum of FA in the volume of the entire mixture was taken as 100%. We have identified the nine most informative FA (denoted as 100%), and calculated relative abundance for (a) each of these, (b) the combination of saturated fatty acids (SFA; myristic C14:0, pentadecanoic (C15:0), palmitic (C16:0), and stearic (C15:0)), (c) the combination of unsaturated fatty acids (USFA; oleic (C18:1), linoleic (C18:2), linolenic (C18:3) and arachidonic (C20:4)), and the combination of essential polyunsaturated fatty acids (PUFA; C18:2, C18:3 and C20:4).
The Rate of Generation of Superoxide Radicals
The rate of generation of superoxide radicals (SR) by mitochondria in brain tissue samples was studied by electron paramagnetic resonance (EPR) on a computerized spectrophotometer RE 1307 using a spin trap TEMPONE-H (2,2,6,6,-tetramethyl-4-oxypiperidine) (Sigma, USA) at room temperature in a special paramagnetically pure quartz cuvette. A specially oriented sample of Al2O3 single crystal with a certain concentration of Cr3+ ions was used as an intensity standard. The concentration of molecules was estimated by the double integration method, comparing the intensity of signals in the EPR spectra with the intensity of the standard. The error of the method of integration of spectra and the spread of reproduction of spectra of one sample is not more than 3% [51].
Level of 8-Oxoguanine
The level of oxidative damage to DNA was studied by determining the marker 8-oxoguanine in brain tissue by analyzing the ultraviolet spectra of eluates after their solid-phase extraction on a column (Merck, Germany) on a spectrophotometer SF-46 [52].
Statistical Analysis
The data distribution was analyzed using the Kolmogorov–Smirnov test. For normally distributed data, statistical differences between the groups were analyzed by the one-way ANOVA test with the following Tukey post hoc test. If the data distribution was different from normal, the Kruskal–Wallis criterion was used. The difference was considered to be statistically significant when P < 0.05. All data were obtained based on two or three independent experiments and expressed as mean ± SD. Statistical analysis was performed using “IBM SPSS Statistics for Windows, version 23” (IBM Corp., Armonk, N.Y., USA).
Author Contributions
Larysa Natrus and Nina Babel design the research, Yuliia Klys , Yuliіa Osadchuk performed the experiments; Yuliia Klys , Yuliіa Osadchuk Moritz Anft , Timm Westhoff collected, analyzed, and interpreted data; Moritz Anft Larysa Natrus and Nina Babel wrote the manuscript.
Funding
This project has received funding from the European Union’s Horizon 2020 Research and Innovation programme under Grant Agreement no. 871072, and by a research grant BMBF TriDiMeD (FKZ 01DK20008).
Data Availability
No datasets were generated or analysed during the current study.
Declarations
Ethics Approval
The protocol of experiments on rats was approved by the Bioethics Committee of the Bogomolets National Medical University (Protocol No. 123 from 26/09/2022).
Consent to Participate
Not applicable.
Consent for Publication
Not applicable.
Competing Interests
The authors declare no competing interests.
Footnotes
Publisher's Note
Springer Nature remains neutral with regard to jurisdictional claims in published maps and institutional affiliations.
Contributor Information
Larysa Natrus, Email: Lnatrus777@gmail.com.
Nina Babel, Email: nina.babel@charite.de, Email: nina.babel@elisabtehgruppe.de.
References
- 1.Mozos I, Luca CT (2017) Crosstalk between Oxidative and Nitrosative Stress and Arterial Stiffness. Curr Vasc Pharmacol 15(5):446–456. 10.2174/1570161115666170201115428 [DOI] [PubMed] [Google Scholar]
- 2.Spahis S, Borys JM, Levy E (2017) Metabolic Syndrome as a Multifaceted Risk Factor for Oxidative Stress. Antioxid Redox Signal 26(9):445–461. 10.1089/ars.2016.6756 [DOI] [PubMed] [Google Scholar]
- 3.Wang F, Yuan Q, Chen F, Pang J, Pan C, Xu F, Chen Y (2021) Fundamental Mechanisms of the Cell Death Caused by Nitrosative Stress. Front Cell Dev Biol 20(9):742483. 10.3389/fcell.2021.742483 [DOI] [PMC free article] [PubMed] [Google Scholar]
- 4.Muriach M, Flores-Bellver M, Romero FJ, Barcia JM (2014) Diabetes and the brain: oxidative stress, inflammation, and autophagy. Oxid Med Cell Longev 2014:102158. 10.1155/2014/102158 [DOI] [PMC free article] [PubMed] [Google Scholar]
- 5.Ruud J, Steculorum SM, Brüning JC (2017) Neuronal control of peripheral insulin sensitivity and glucose metabolism. Nat Commun 8:15259. 10.1038/ncomms15259 [DOI] [PMC free article] [PubMed] [Google Scholar]
- 6.Izquierdo AG, Crujeiras AB, Casanueva FF et al (2019) Leptin, obesity, and leptin resistance: where are we 25 years later? Nutrients 11(11):2704 [DOI] [PMC free article] [PubMed] [Google Scholar]
- 7.Park HK, Ahima RS (2015) Physiology of leptin: energy homeostasis, neuroendocrine function and metabolism. Metabolism 64(1):24–34. 10.1016/j.metabol.2014.08.004 [DOI] [PMC free article] [PubMed] [Google Scholar]
- 8.Carmo-Silva S, Cavadas C (2017) Hypothalamic dysfunction in obesity and metabolic disorders. Adv Neurobiol 19:73–116. 10.1007/978-3-319-63260-5_4 [DOI] [PubMed] [Google Scholar]
- 9.Jung CH, Kim MS (2013) Molecular mechanisms of central leptin resistance in obesity. Arch Pharm Res 36(2):201–207. 10.1007/s12272-013-0020-y [DOI] [PubMed] [Google Scholar]
- 10.Moreira PI (2014) Metformin in the diabetic brain: friend or foe? Ann Transl Med 2(6):54. 10.3978/j.issn.2305-5839.2014.06.10 [DOI] [PMC free article] [PubMed] [Google Scholar]
- 11.Oliveira WH, Braga CF, Lós DB, Araújo SMR, França MR, Duarte-Silva E, Rodrigues GB, Rocha SWS et al (2021) Metformin prevents p-tau and amyloid plaque deposition and memory impairment in diabetic mice. Exp Brain Res 239(9):2821–2839. 10.1007/s00221-021-06176-8 [DOI] [PubMed] [Google Scholar]
- 12.Wilcock C, Bailey CJ (1994) Accumulation of metformin by tissues of the normal and diabetic mouse. Xenobiotica 24:49–57. 10.3109/00498259409043220 [DOI] [PubMed] [Google Scholar]
- 13.Bailey CJ, Wilcock C, Scarpello JHB (2008) Metformin and the intestine. Diabetologia 51:1552–1553. 10.1007/s00125-008-1053-5 [DOI] [PubMed] [Google Scholar]
- 14.Forslund K, Hildebrand F, Nielsen T et al (2015) Disentangling type 2 diabetes and metformin treatment signatures in the human gut microbiota. Nature 528(7581):262–266. 10.1038/nature15766 [DOI] [PMC free article] [PubMed] [Google Scholar]
- 15.Duscha A, Gisevius B, Hirschberg S et al (2020) Propionic Acid Shapes the Multiple Sclerosis Disease Course by an Immunomodulatory Mechanism. Cell 180:1067-1080.e16. 10.1016/j.cell.2020.02.035 [DOI] [PubMed] [Google Scholar]
- 16.Haghikia A, Jörg S, Duscha A et al (2015) Dietary Fatty Acids Directly Impact Central Nervous System Autoimmunity via the Small Intestine. Immunity 43:817–829. 10.1016/j.immuni.2015.09.007 [DOI] [PubMed] [Google Scholar]
- 17.Hoyles L, Snelling T, Umlai UK, Nicholson JK, Carding SR, Glen RC, McArthur S (2018) Microbiome-host systems interactions: protective effects of propionate upon the blood-brain barrier. Microbiome 6(1):55. 10.1186/s40168-018-0439-y [DOI] [PMC free article] [PubMed] [Google Scholar]
- 18.Natrus LV, Osadchuk YS, Lisakovska OO et al (2022) Effect of propionic acid on diabetes-induced impairment of unfolded protein response signaling and astrocyte/microglia crosstalk in rat ventromedial nucleus of the hypothalamus. Neural Plast 2022:6404964 [DOI] [PMC free article] [PubMed] [Google Scholar]
- 19.Natrus L, Osadchuk Y, Lisakovska O, Roch T, Babel N, Klys Y, Labudzynskyi D, Chaikovsky Y (2022) Regulation of the apoptosis/autophagy switch by propionic acid in ventromedial hypothalamus of rats with type 2 diabetes mellitus. Heliyon 8(11):e11529. 10.1016/j.heliyon.2022.e11529 [DOI] [PMC free article] [PubMed] [Google Scholar]
- 20.Kim TA, Chen L, Ge S (2021) The Interplay of Neurovasculature and Adult Hippocampal Neurogenesis. Neurosci Lett 760:136071. 10.1016/j.neulet.2021.136071 [DOI] [PMC free article] [PubMed] [Google Scholar]
- 21.Jiménez-Jiménez FJ, Alonso-Navarro H, Herrero MT, García-Martín E, Agúndez J (2016) An Update on the Role of Nitric Oxide in the Neurodegenerative Processes of Parkinson’s Disease. Curr Med Chem 23:2666–2679. 10.2174/0929867323666160812151356 [DOI] [PubMed] [Google Scholar]
- 22.Kim JE, Choi S, Yoo JA, Chung MH (2004) 8-Oxoguanine induces intramolecular DNA damage but free 8-oxoguanine protects intermolecular DNA from oxidative stress. FEBS Lett 556(1–3):104–10. 10.1016/s0014-5793(03)01385-1 [DOI] [PubMed] [Google Scholar]
- 23.Aguiar PH, Furtado C, Repolês BM et al (2013) Oxidative stress and DNA lesions: the role of 8-oxoguanine lesions in Trypanosoma cruzi cell viability. PLoS Negl Trop Dis 7(6):e2279. 10.1371/journal.pntd.0002279 [DOI] [PMC free article] [PubMed] [Google Scholar]
- 24.Sytnyk I, Burlaka A, Vovk A, Khaitovych M (2017) Study of superoxide- and NO-dependent protective mechanisms of N-acetylcysteine and losartan in ratʼs aorta and liver under streptozoticin-induced type 1 diabetes mellitus. ScienceRise: Pharm Sci 6(10):25–31. 10.15587/2519-4852.2017.119490 [Google Scholar]
- 25.Fujii J, Homma T, Osaki T (2022) Superoxide Radicals in the Execution of Cell Death. Antioxidants (Basel) 11(3):501. 10.3390/antiox11030501 [DOI] [PMC free article] [PubMed] [Google Scholar]
- 26.Domek-Łopacińska KU, Strosznajder JB (2010) Cyclic GMP and Nitric Oxide Synthase in Aging and Alzheimer’s Disease. Mol NeuroBiol 41:129–137. 10.1007/s12035-010-8104-x [DOI] [PubMed] [Google Scholar]
- 27.Iova OM, Marin GE, Lazar I, Stanescu I, Dogaru G, Nicula CA, Bulboacă AE (2023) Nitric Oxide/Nitric Oxide Synthase System in the Pathogenesis of Neurodegenerative Disorders-An Overview. Antioxidants (Basel) 12(3):753. 10.3390/antiox12030753 [DOI] [PMC free article] [PubMed] [Google Scholar]
- 28.El-Mir MY, Detaille D, Villanueva GR et al (2008) Neuroprotective role of antidiabetic drug metformin against apoptotic cell death in primary cortical neurons. J Mol Neurosci 34(1):77–87. 10.1007/s12031-007-9002-1 [DOI] [PubMed] [Google Scholar]
- 29.Lu M, Su C, Qiao C, Bian Y, Ding J, Hu G (2016) Metformin Prevents Dopaminergic Neuron Death In MPTP/P-Induced Mouse Model Of Parkinson’s Disease Via Autophagy And Mitochondrial ROS Clearance. Int J Neuropsychopharmacol 19:pyw047. 10.1093/ijnp/pyw047 [DOI] [PMC free article] [PubMed] [Google Scholar]
- 30.Kang H, Khang R, Ham S et al (2017) Activation of the ATF2/CREB-PGC-1α pathway by metformin leads to dopaminergic neuroprotection. Oncotarget. 8:48603–18. 10.18632/oncotarget.18122 [DOI] [PMC free article] [PubMed] [Google Scholar]
- 31.Markowicz-Piasecka M, Sikora J, Szydłowska A, Skupień A, Mikiciuk-Olasik E, Huttunen KM (2017) Metformin - a Future Therapy for Neurodegenerative Diseases : Theme: Drug Discovery, Development and Delivery in Alzheimer’s Disease Guest Editor: Davide Brambilla. Pharm Res 34(12):2614–2627. 10.1007/s11095-017-2199-y [DOI] [PMC free article] [PubMed] [Google Scholar]
- 32.Imfeld P, Bodmer M, Jick SS, Meier CR (2012) Metformin, other antidiabetic drugs, and risk of Alzheimer’sdisease: a population-based case-control study. J am Geriatr Soc 60:916–921 [DOI] [PubMed] [Google Scholar]
- 33.Khaleghi-Mehr M, Delshad AA, Shafie-Damavandi S, Roghani M (2023) Metformin mitigates amyloid β1-40-induced cognitive decline via attenuation of oxidative/nitrosative stress and neuroinflammation. Metab Brain Dis 38(4):1127–1142. 10.1007/s11011-023-01170-1 [DOI] [PubMed] [Google Scholar]
- 34.Zhang Y, Zhang Y, Shi X, Han J, Lin B, Peng W, Mei Z, Lin Y (2022) Metformin and the risk of neurodegenerative diseases in patients with diabetes: A meta-analysis of population-based cohort studies. Diabet Med 39(6):e14821. 10.1111/dme.14821 [DOI] [PubMed] [Google Scholar]
- 35.Liao W, Xu J, Li B, Ruan Y, Li T, Liu J (2022) Deciphering the Roles of Metformin in Alzheimer’s Disease: A Snapshot. Front Pharmacol 27(12):728315. 10.3389/fphar.2021.728315 [DOI] [PMC free article] [PubMed] [Google Scholar]
- 36.Karami F, Jamaati H, Coleman-Fuller N, Zeini MS, Hayes AW, Gholami M, Salehirad M, Darabi M et al (2023) Is metformin neuroprotective against diabetes mellitus-induced neurodegeneration? An updated graphical review of molecular basis. Pharmacol Rep 75(3):511–543. 10.1007/s43440-023-00469-1 [DOI] [PubMed] [Google Scholar]
- 37.Zhu T, Wang L, Wang LP, Wan Q (2022) Therapeutic targets of neuroprotection and neurorestoration in ischemic stroke: Applications for natural compounds from medicinal herbs. Biomed Pharmacother 148:112719. 10.1016/j.biopha.2022.112719 [DOI] [PubMed] [Google Scholar]
- 38.Chen H, He Y, Chen S, Qi S, Shen J (2020) Therapeutic targets of oxidative/nitrosative stress and neuroinflammation in ischemic stroke: Applications for natural product efficacy with omics and systemic biology. Pharmacol Res 158:104877. 10.1016/j.phrs.2020.104877 [DOI] [PubMed] [Google Scholar]
- 39.Rutsch A, Kantsjö JB, Ronchi F (2020) The Gut-Brain Axis: How Microbiota and Host Inflammasome Influence Brain Physiology and Pathology. Front Immunol 10(11):604179. 10.3389/fimmu.2020.604179 [DOI] [PMC free article] [PubMed] [Google Scholar]
- 40.Whang A, Nagpal R, Yadav H (2019) Bi-directional drug-microbiome interactions of anti-diabetics. EBioMedicine 39:591–602 [DOI] [PMC free article] [PubMed] [Google Scholar]
- 41.Elbere I, Silamikelis I, Dindune II et al (2020) Baseline gut microbiome composition predicts metformin therapy short-term efficacy in newly diagnosed type 2 diabetes patients. PLoS One 15(10):e0241338. 10.1371/journal.pone.0241338 [DOI] [PMC free article] [PubMed] [Google Scholar]
- 42.Silamikele L, Silamikelis I, Ustinova M et al (2021) Metformin strongly affects gut microbiome composition in high-fat diet-induced type 2 diabetes mouse model of both sexes. Front Endocrinol (Lausanne) 12:626359. 10.3389/fendo.2021.626359 [DOI] [PMC free article] [PubMed] [Google Scholar]
- 43.Brīvība M, Silamiķele L, Kalniņa I (2023) Metformin targets intestinal immune system signaling pathways in a high-fat diet-induced mouse model of obesity and insulin resistance. Front Endocrinol (Lausanne) 19(14):1232143. 10.3389/fendo.2023.1232143 [DOI] [PMC free article] [PubMed] [Google Scholar]
- 44.Skovsø S (2014) Modeling type 2 diabetes in rats using high fat diet and streptozotocin. J Diabetes Investig 5(4):349–358. 10.1111/jdi.12235 [DOI] [PMC free article] [PubMed] [Google Scholar]
- 45.Natrus L, Osadchuk Y, Labudzinskyi D, Chaikovsky Y, Smirnov A (2019) The pathogenetic rationale the ways of experimental type 2 diabetes mellitus modeling. Med Sci Ukraine (MSU) 15(3–4):10–18. 10.32345/2664-4738.3-4.2019.02 [Google Scholar]
- 46.Rybolovlev YuR (1979) Dosing of substances for mammals according to biological activity constants. Dokl Acad Sci USSR 247(6):1513–1516 [Google Scholar]
- 47.Hayat MA (2000) Principles and Techniques of Electron Microscopy: Biological Applications, 4th edn. Cambridge University Press, New York, p 543 [Google Scholar]
- 48.Livak KJ, Schmittgen TD (2001) Analysis of relative gene expression data using real-time quantitative PCR and the 2(-Delta Delta C(T)) Method. Methods (San Diego, Calif.) 25(4):402–408. 10.1006/meth.2001.1262 [DOI] [PubMed] [Google Scholar]
- 49.Stoscheck CM (1990) Quantitation of protein. Methods Enzymol 182:50–68. 10.1016/0076-6879(90)82008-p [DOI] [PubMed] [Google Scholar]
- 50.Natrus LV, Ryzhko IM, Chernovol PA, Bryuzgina TS (2018) Patent 125810 UA, G01N 33/49 (2006.01) B01D15/08 (2006.01) A method of evaluating the mechanisms of tissue damage in experimental type 1 diabetes in rats; Bogomolets National Medical University of the Ministry of Health of Ukraine. - u 201709175; statement on 18.09.2017; published 12.03.2018, Bull. No. 15, 2018
- 51.Burlaka AP, Ganusevich II, Vovk AV, Burlaka AA, Gafurov MR, Lukin SN (2020) Redox state of adipose tissue for patients with gastric cancer and its connection with the body mass index and distance from the tumor. Obes Res Clin Pract 14(1):34–38. 10.1016/j.orcp.2019.10.003 [DOI] [PubMed] [Google Scholar]
- 52.Burlaka AP, Ganusevich II, Gafurov MR, Lukin SM, Sidorik EP (2016) Stomach Cancer: Interconnection between the Redox State, Activity of MMP-2, MMP-9 and Stage of Tumor Growth. Cancer Microenviron 9(1):27–32. 10.1007/s12307-016-0182-5 [DOI] [PMC free article] [PubMed] [Google Scholar]
Associated Data
This section collects any data citations, data availability statements, or supplementary materials included in this article.
Data Availability Statement
No datasets were generated or analysed during the current study.


