



Abstract
The abundance and sequence of satellite DNA at and around centromeres is evolving rapidly despite the highly conserved and essential process the centromere employs in directing chromosome inheritance1,2,3. The impact of such rapid evolution is unclear. Here, we find that sequence-dependent DNA shape dictates packaging of pericentromeric satellites in female meiosis by a conserved DNA shape-recognizing chromatin architectural protein, High Mobility Group AT-Hook 1 (HMGA1)4,5. Indeed, pericentromeric heterochromatin in two closely related mouse species, M. musculus and M. spretus, forms on divergent satellites that differ by both density of narrow DNA minor grooves and HMGA1 recruitment. HMGA1 binds preferentially to musculus satellites, and depletion in musculus oocytes causes massive stretching of pericentromeric satellites, disrupts kinetochore organization, and delays bipolar spindle assembly. In musculus-spretus hybrid oocytes, HMGA1 depletion disproportionately impairs musculus pericentromeres and microtubule attachment to their kinetochores. Thus, DNA shape impacts both pericentromere packaging and the segregation machinery. We propose that rapid evolution of centromere/pericentromere DNA does not disrupt these essential processes when the satellites harbor DNA shapes recognized by conserved architectural proteins (e.g., HMGA1). By packaging these satellites, architectural proteins become part of the centromeric/pericentromeric chromatin, suggesting an evolutionary strategy that lowers the cost of megabase-scale satellite expansion.
Main
Chromatin organization at centromeric regions ensures faithful segregation by spindle microtubules attached to centromere-nucleated kinetochore complexes (reviewed in6). Pericentromeric heterochromatin promotes centromere formation7,8,9, clusters centromeres within the nucleus10, and regulates kinetochore-microtubule attachments during cell division11,12,13. Despite these conserved functions, centromeres and pericentromeres typically form on highly repetitive satellite DNA whose sequence and abundance evolve rapidly14,15. Moreover, either one of these chromatin domains can form on different sequences within the same cell16,17,18, and functional centromeres can form de novo (neocentromeres) on non-repetitive DNA (reviewed in19). These observations suggest that the organization and function of centromeres and pericentromeres is independent of any particular DNA sequence. In contrast, the well-studied example of house mouse (Mus musculus; hereafter musculus) shows that each domain forms on a dedicated satellite, suggesting a contribution of DNA sequence. Centromeres form on minor satellite, while pericentromeres form on the more abundant major satellite20,21 (Fig. 1a). The closely related Algerian mouse (Mus spretus; hereafter spretus) has the same two satellites, but the relative abundance is reversed22,23,24 (Fig. 1a). Whether pericentromeres form on major satellite in spretus as in musculus, or instead on the more abundant minor satellite, has not been determined. Analyses of musculus/spretus hybrid oocytes reveal differences in chromatin packaging, however, with reduced condensin II localization and greater decondensation at musculus centromeres/pericentromeres compared to the homologous spretus chromosomes in the same cell25,26. These observations suggest that the two different satellites are packaged by distinct mechanisms, consistent with a dependence on DNA sequence. Thus, with conflicting lines of evidence, it remains unclear whether and how DNA sequence contributes to centromere and pericentromere organization and packaging. To address these questions, musculus and spretus provide a natural model system to determine the molecular principles underlying chromatin organization and packaging on different satellites.
Fig. 1: Pericentromeric satellites of two closely related mouse species adopt distinct DNA shapes.
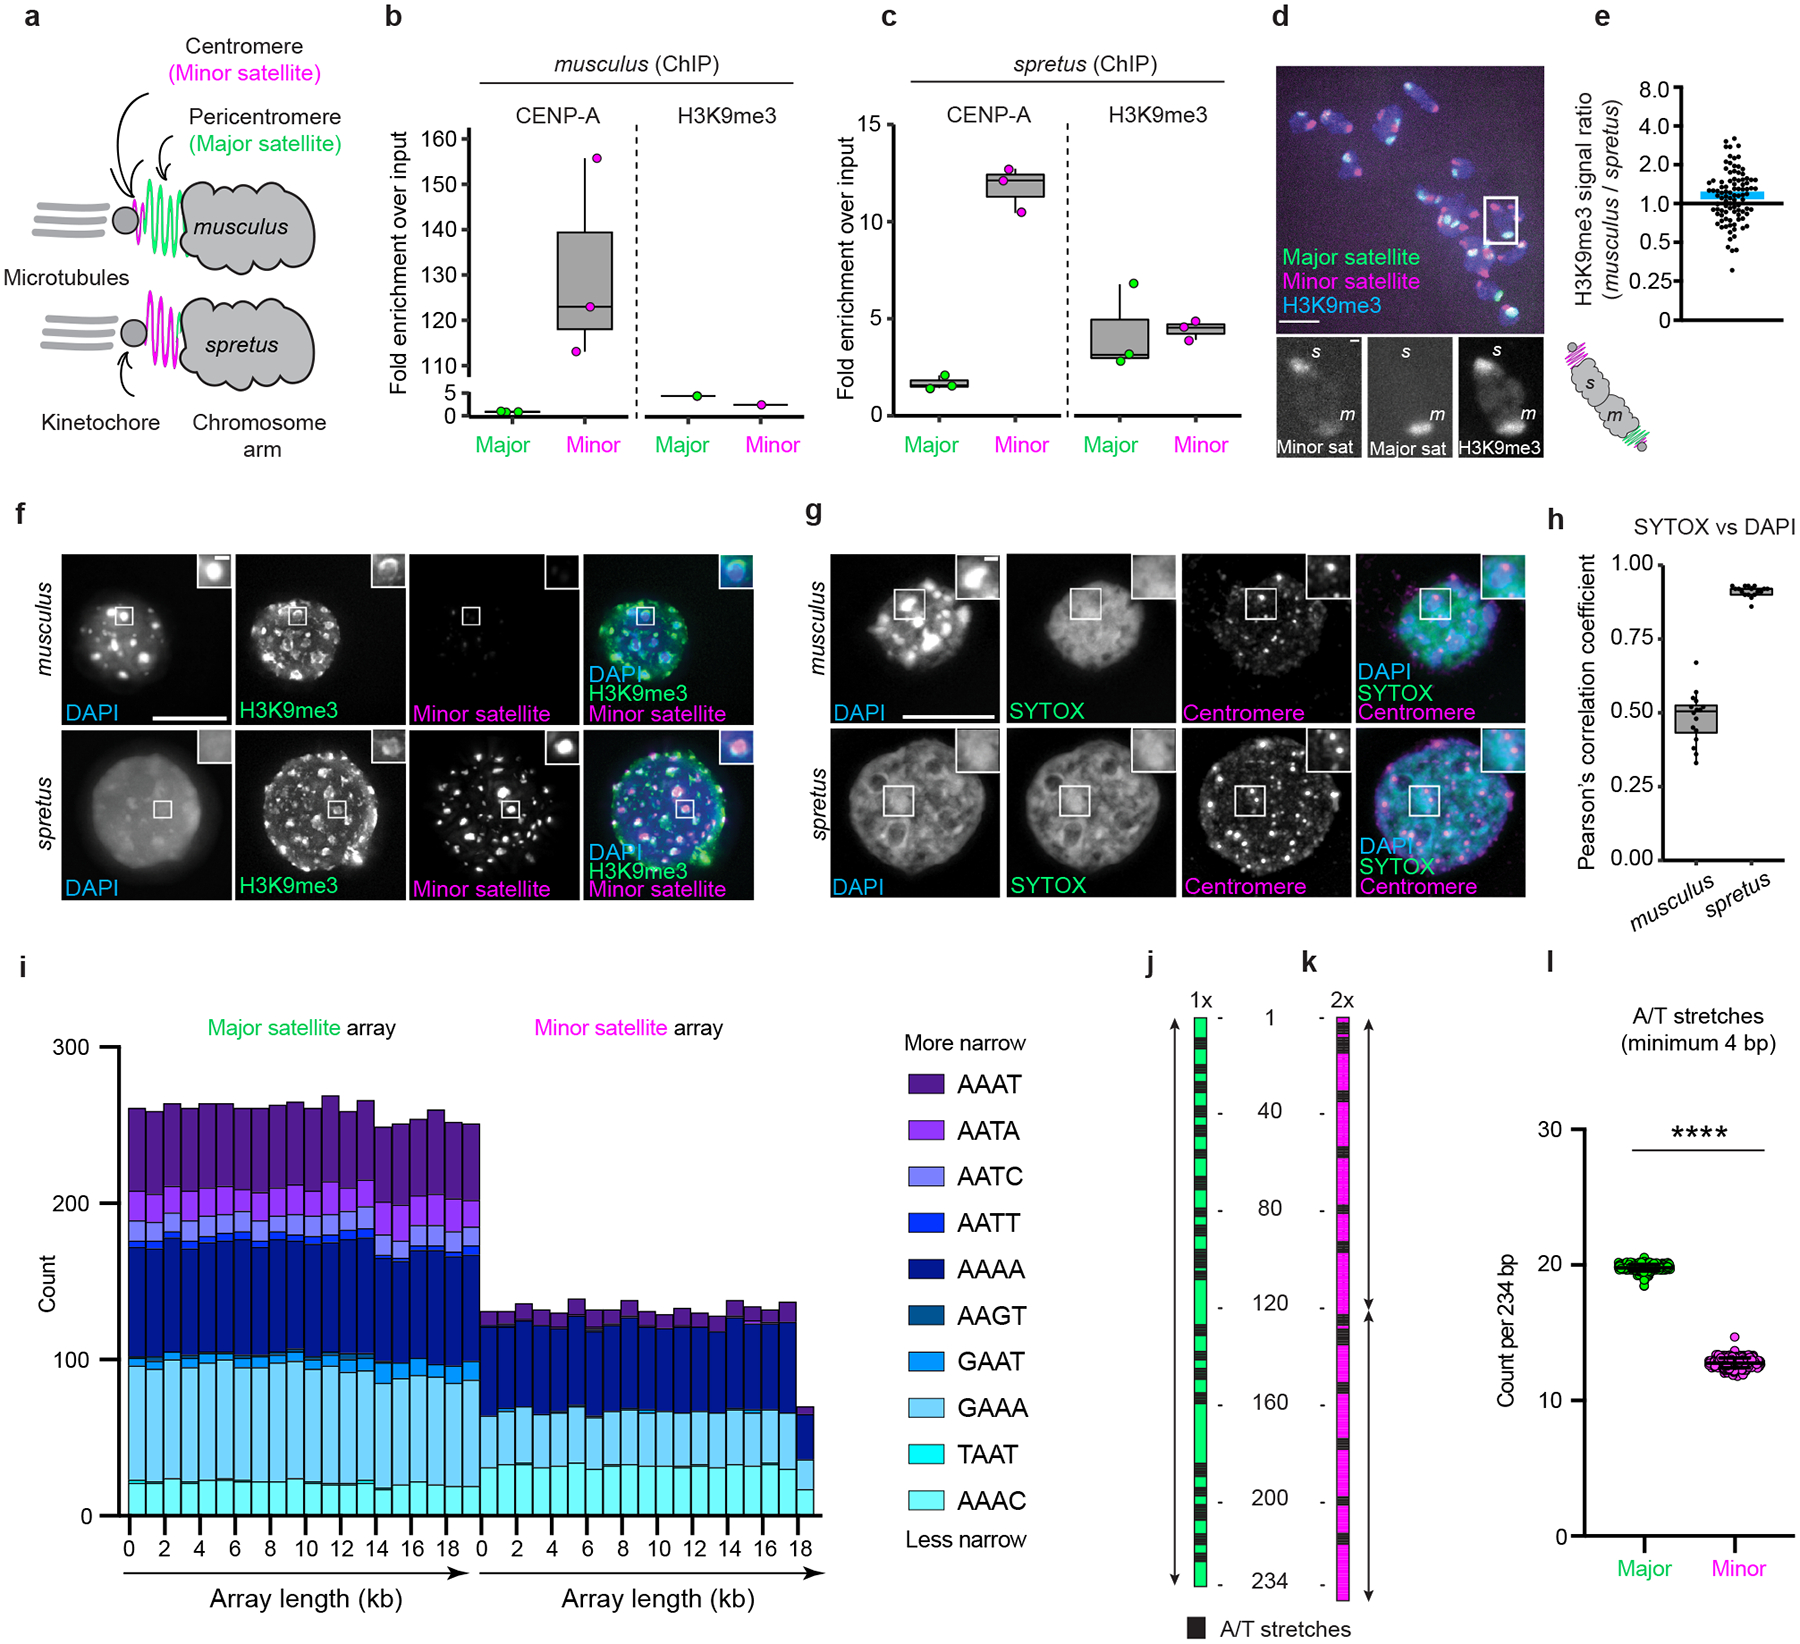
a, Organization of minor and major satellite DNA in musculus and spretus. b,c, CENP-A or H3K9me3 ChIP results from MNase-digested spretus (b) or musculus (c) chromatin isolated from liver samples. Fold enrichment was calculated as the fraction of reads that align to major or minor satellite (>80% sequence identity) in the ChIP sample divided by the fraction in the input sample (Tukey box and whiskers plots, N=3 independent experiments except musculus H3K9me3 ChIP (N=1)). d,e, Musculus/spretus hybrid oocytes expressing TALE-mClover (major satellite) and dCas9-mCherry/gRNA (minor satellite) fixed at metaphase I and stained for H3K9me3. The H3K9me3 ratio at pericentromeres (musculus/spretus) for each bivalent ((e), n=95 bivalents from 2 independent experiments; blue line, median). f, Spretus and musculus liver nuclei stained for H3K9me3, and FISH was performed with probes against CENP-B boxes (minor satellite). 14 cells per condition from 2 independent experiments yielded similar result. g,h, Spretus and musculus liver nuclei stained for DNA (SYTOX Green and DAPI) and centromeres (anti-centromere antibody). The Pearson’s correlation coefficient was calculated for nuclear SYTOX Green and DAPI ((h) n=16 and 17 nuclei). i, AT-rich tetranucleotides associated with narrow DNA minor groove35 along representative musculus major or minor satellite arrays represented side-by-side. j,k, Consensus major satellite monomer (green, left) or minor satellite dimers (magenta, right) with stretches of minimum 4 contiguous A/Ts. Despite similar A/T content (63–66%) major and minor satellites differ in how clustered the A/T bases are. l, Number of contiguous A/T in major or minor satellite arrays per 234 bp (single major satellite repeat length). Mean and standard deviation indicated, n=500 arrays; two-tailed Mann-Whitney test, **** P<0.0001. All boxplots indicate: median, 25th and 75th percentiles (hinges), smallest and largest value at most 1.5 * interquartile range of the hinge (whiskers). All scale bars 10 μm and 1 μm (insets).
Heterochromatin follows repeat abundance
We first measured the degree to which minor and major satellite abundance is reversed in the two species using liver samples: minor satellite accounts for 4.4% of the spretus but only 0.5% of the musculus input DNA, while major satellite occupies 7.9% of the musculus but only 0.2% of the spretus input DNA (Extended Data Fig. 1a–d; Supplementary Table 1). To test if satellite identities impact centromere and pericentromere formation, we analyzed the underlying DNA sequences by ChIP-seq. The two chromatin domains are defined by well-characterized epigenetic marks: the histone H3 variant CENP-A for centromeres and lysine 9 tri-methylation of histone H3 (H3K9me3) for pericentromeric heterochromatin. We found that CENP-A chromatin is present mainly on minor satellite arrays, with a similar percentage of CENP-A ChIP-seq reads mapping to minor satellite in both species (Fig. 1b; Supplementary Table 1). In contrast to the allegiance of centromeres to minor satellite, H3K9me3-defined pericentromeric heterochromatin assembles on whichever satellite is more abundant: minor satellite in spretus or major satellite in musculus (Fig. 1c; Supplementary Table 1). To determine whether heterochromatin forms to a similar extent on the different satellites, we measured pericentromeric H3K9me3 by immunofluorescence on paired homologous chromosomes in musculus/spretus hybrid oocytes. We find similar amounts of H3K9me3 on musculus and spretus pericentromeres (Fig. 1d,e). Therefore, while minor satellite is conducive to centromere specification, possibly due to the presence of CENP-B boxes27, pericentromeric heterochromatin forms equally well on either minor or major satellite. These findings also suggest that spretus centromeric and pericentromeric chromatin sorts into epigenetically distinct domains at the same type of satellite, perhaps via spatial separation as recently observed in human cells using cryo-electron tomography28.
Divergent satellites differ in DNA shape
Although musculus and spretus chromosomes have similar amounts of pericentromeric heterochromatin, only musculus nuclei form DAPI-rich foci known as chromocenters, which colocalize with H3K9me3-labeled pericentromeric heterochromatin (reviewed in29; Fig. 1f). This finding is consistent with DAPI enrichment at musculus chromosomes compared to spretus30 and at major compared to minor satellite in musculus20. In contrast, another DNA dye, SYTOX green, shows no distinct foci in either species (Fig. 1g). SYTOX and DAPI staining are well correlated in spretus nuclei but not in musculus nuclei (Fig. 1h), suggesting that higher intensities in spretus simply reflect higher DNA density, but DAPI foci in musculus must reflect some other property of the DNA. Major and minor satellites are both AT-rich (63–66%), indicating that AT content cannot explain DAPI enrichment at major satellite. Since DAPI binds to narrow DNA minor grooves formed by contiguous A/T base pairs31,32,33 that deviate from an ideal B-form double helix34, we hypothesized that the distinct satellites forming pericentromeres in musculus (major) and spretus (minor) adopt distinct DNA shapes. To address this, we quantified the abundance of tetranucleotides (including contiguous A/Ts) known to adopt narrow minor groove35 in major and minor satellite. We found that all 9 of the narrowest tetranucleotides are enriched at major satellite compared to minor (Fig. 1i; Extended Data Fig. 2a; see Methods). Moreover, each major satellite monomer has 20 stretches of minimum 4 contiguous A/Ts (Fig. 1j,l; Extended Data Fig. 2b), while the equivalent length of minor satellite contains only 12 such stretches (Fig. 1k,l; Extended Data Fig. 2c). These results indicate that major satellite repeats contain a higher density of narrow minor DNA grooves than minor satellite repeats, supporting our hypothesis that major and minor satellites differ in DNA shape.
HMGA1 distinguishes divergent satellites
Sequence-dependent DNA shape creates structural cues for binding by DNA shape-recognizing proteins35,36, suggesting that such proteins may bind differentially to pericentromeric satellites in musculus and spretus. A primary candidate for differential binding is a chromatin architectural protein, HMGA1 (High Mobility Group protein AT-hook 1), that is enriched at DAPI-rich foci in interphase in primate cells and musculus pericentromeres4,5,10. HMGA1 has three AT-hook motifs that mediate binding to AT-rich satellite DNA and can bridge major satellite repeats in vitro5, and HMGA1 competes with DAPI-like small molecules for binding to the DNA minor groove along A/T stretches37,38,39 (Extended Data Fig. 3a,b). As AT-hook motifs insert into the minor groove of one face of the DNA double helix, spanning about 4 bp39, we predicted that HMGA1 would be enriched at major satellite, which contains more contiguous A/T stretches of minimum 4 and 5 bp (Fig. 1i; Extended Data Fig. 2d) compared to minor satellite that contains more stretches of minimum 3 bp (Extended Data Fig. 2e). Indeed, by analyzing HMGA1 ChIP seq data from musculus somatic cells40, we find that HMGA1 is enriched 2-fold at major satellite compared to minor satellite (Fig. 2a; Supplementary Table 2). To test whether HMGA1 preferentially binds musculus pericentromeres, we analyzed its localization in musculus/spretus hybrid oocytes by immunostaining. Musculus and spretus HMGA1 proteins have an identical sequence (Extended Data Fig. 4a,b), excluding differences in DNA binding or epitope recognition. Measurements of paired homologous musculus and spretus chromosomes show that musculus pericentromeres recruit more HMGA1 compared to spretus (Fig. 2b,c). Moreover, HMGA1 levels are similar across hybrid and parental oocytes (Fig. 2b,c). This lack of dependence on genetic background differs from another chromatin packaging protein condensin II, whose localization to major satellite is reduced in hybrid musculus/spretus oocytes compared to musculus, contributing to hybrid subfertility26. Instead, HMGA1’s 3-fold binding preference for musculus major satellite (Fig. 2c) can be accounted for by the predicted number of minimum 4 bp-long contiguous A/T stretches (2.9-fold; Supplementary Table 1). Moreover, since HMGA1 binds to bulk chromatin in both species (Fig. 2b), its enrichment at musculus pericentromeres reflects the capacity to bind narrow DNA minor grooves of major satellite rather than heterochromatin binding. Overall, these findings strongly indicate that HMGA1 recognizes the distinct DNA shape adopted by major satellite and that DNA shape is a molecular feature that underlies differential packaging of divergent pericentromeres (Fig. 2d).
Fig. 2: HMGA1 is enriched at pericentromeres built on major satellite.
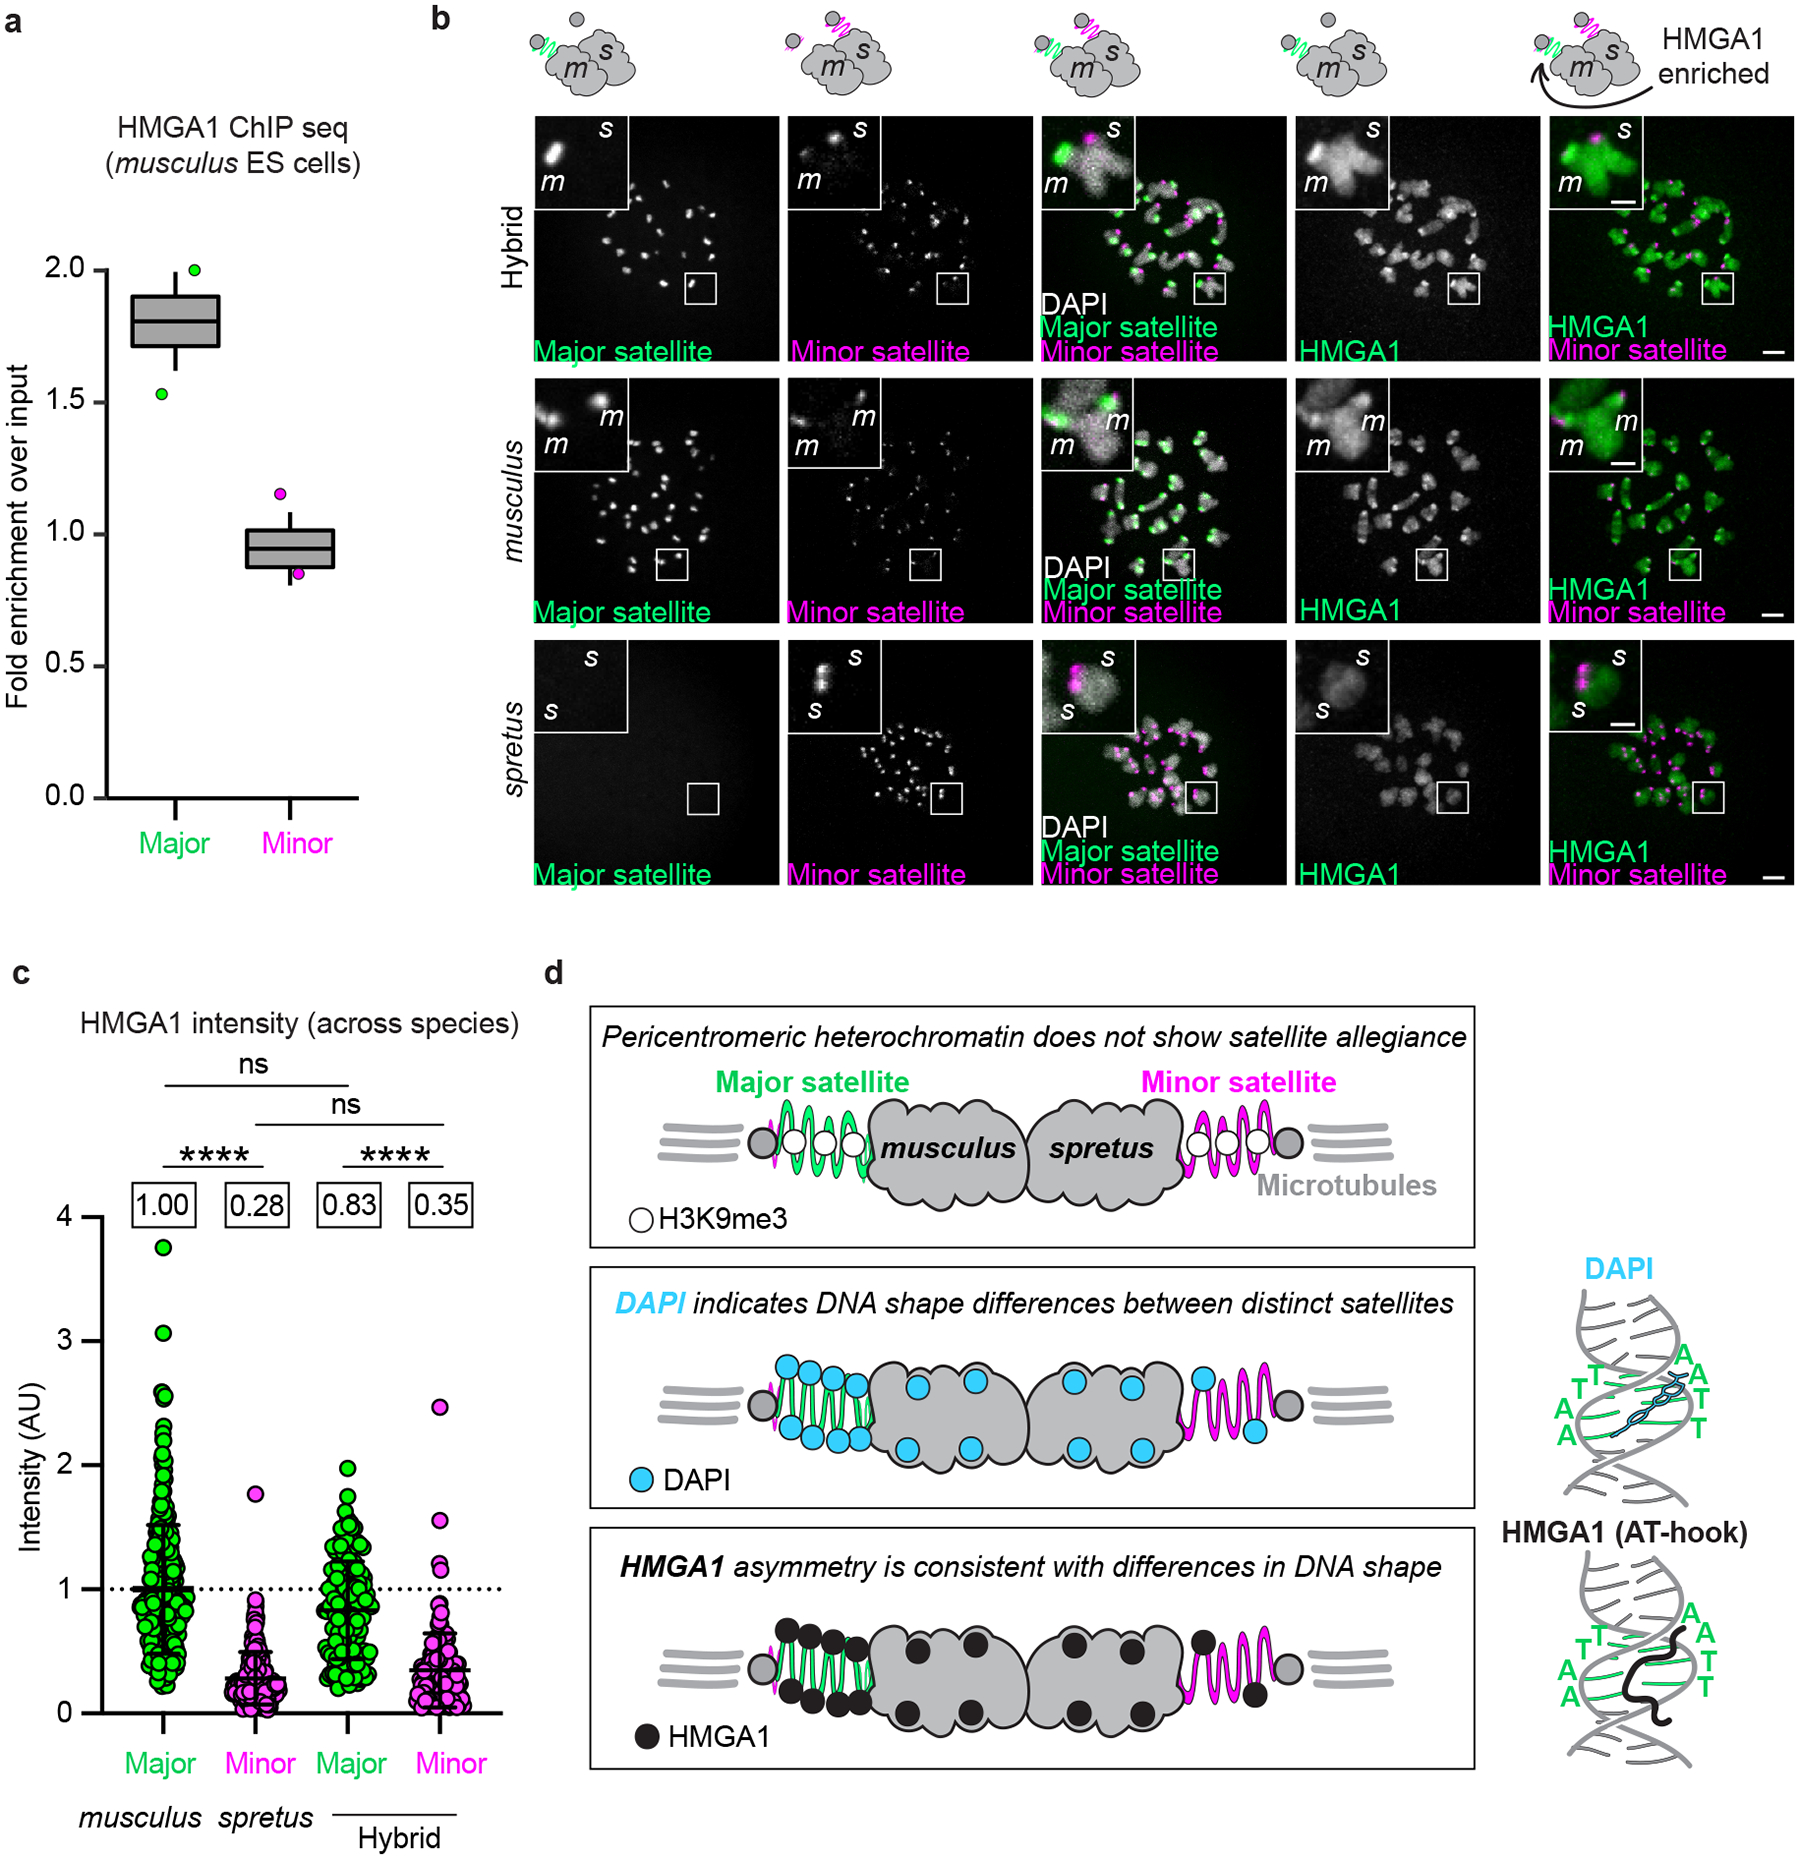
a, Previously published HMGA1 ChIP-sequencing data40 was analyzed to calculate fold enrichment as the fraction of reads that align to major or minor satellite (>80% sequence identity) in the ChIP sample divided by the fraction in the input sample (Tukey box and whiskers plots, N=2 independent experiments for each). Boxplots indicate median, 25th and 75th percentiles (hinges), smallest and largest value at most 1.5 * interquartile range of the hinge (whiskers). b,c, Hybrid musculus/spretus and parental musculus and spretus oocytes expressing TALE-mClover targeting major satellite and dCas9-mCherry in complex with guide RNA targeting minor satellite were fixed and stained for HMGA1. Scale bars 5 μm or 2 μm (insets). HMGA1 signal was quantified at major and minor satellites representing musculus (m) or spretus (s) pericentromeres. Mean and standard deviation indicated, means shown in boxes, n=284 (major satellite in musculus), 194 (minor satellite in spretus), 144 (major satellite in hybrid), and 144 (minor satellite in hybrid) pericentromeres from 2–3 independent experiments; Kruskal-Wallis test followed by Dunn’s multiple comparison test, **** P<0.0001, ns=not significant (P=0.1059; major satellite in musculus vs hybrid, P=0.4159; minor satellite in spretus vs hybrid). d, While both major and minor satellites can form pericentromeric heterochromatin, major satellite has higher density of narrow DNA minor grooves as shown by asymmetric DAPI staining. HMGA1 preferentially binds to narrow DNA minor grooves via a mechanism similar to DAPI binding and is therefore enriched on major satellite. Drawings of DNA molecule with DAPI and HMGA1 AT-hook were based on PDB: 5T4W and 2EZF respectively.
HMGA1 loss causes satellite stretching
HMGA1 regulates gene expression (reviewed in41) and bundles multiple pericentromeres into chromocenters in interphase nuclei10. However, its enrichment at individual musculus pericentromeres in female meiosis (Fig. 2b,c) and high expression in proliferating tissues in the embryo42 suggest additional functions in packaging major satellite in condensed chromosomes. To selectively disrupt HMGA1 function during cell division, we used antibody-mediated protein degradation for acute protein removal in female meiosis (Trim-away;43; Fig. 3a; see Methods). This acute depletion approach minimizes potential compensation by other HMG family members with similar chromatin packaging roles44. The injected antibody does not enter the nucleus43 (Fig. 3b,c), and the mild decrease in HMGA1 in the intact nucleus is most likely due to protein turnover. Near complete degradation occurs within 3 h of nuclear envelope breakdown (early meiosis I; Fig. 3d,e). Strikingly, kinetochores and centromeric chromatin were displaced away from the bulk chromatin in HMGA1-depleted oocytes (Fig. 3d; Extended Data Fig. 5), with massive stretching of DNA corresponding to major satellite (Fig. 3f,g). Stretching was reduced by treatment with the microtubule-depolymerizing agent nocodazole and restored by nocodazole washout (Extended Data Fig. 6), showing that stretching depends on microtubules. Together these data demonstrate that HMGA1 packages pericentromeric chromatin to withstand microtubule forces during female meiosis.
Fig. 3: HMGA1 packages pericentromeres in female meiosis.
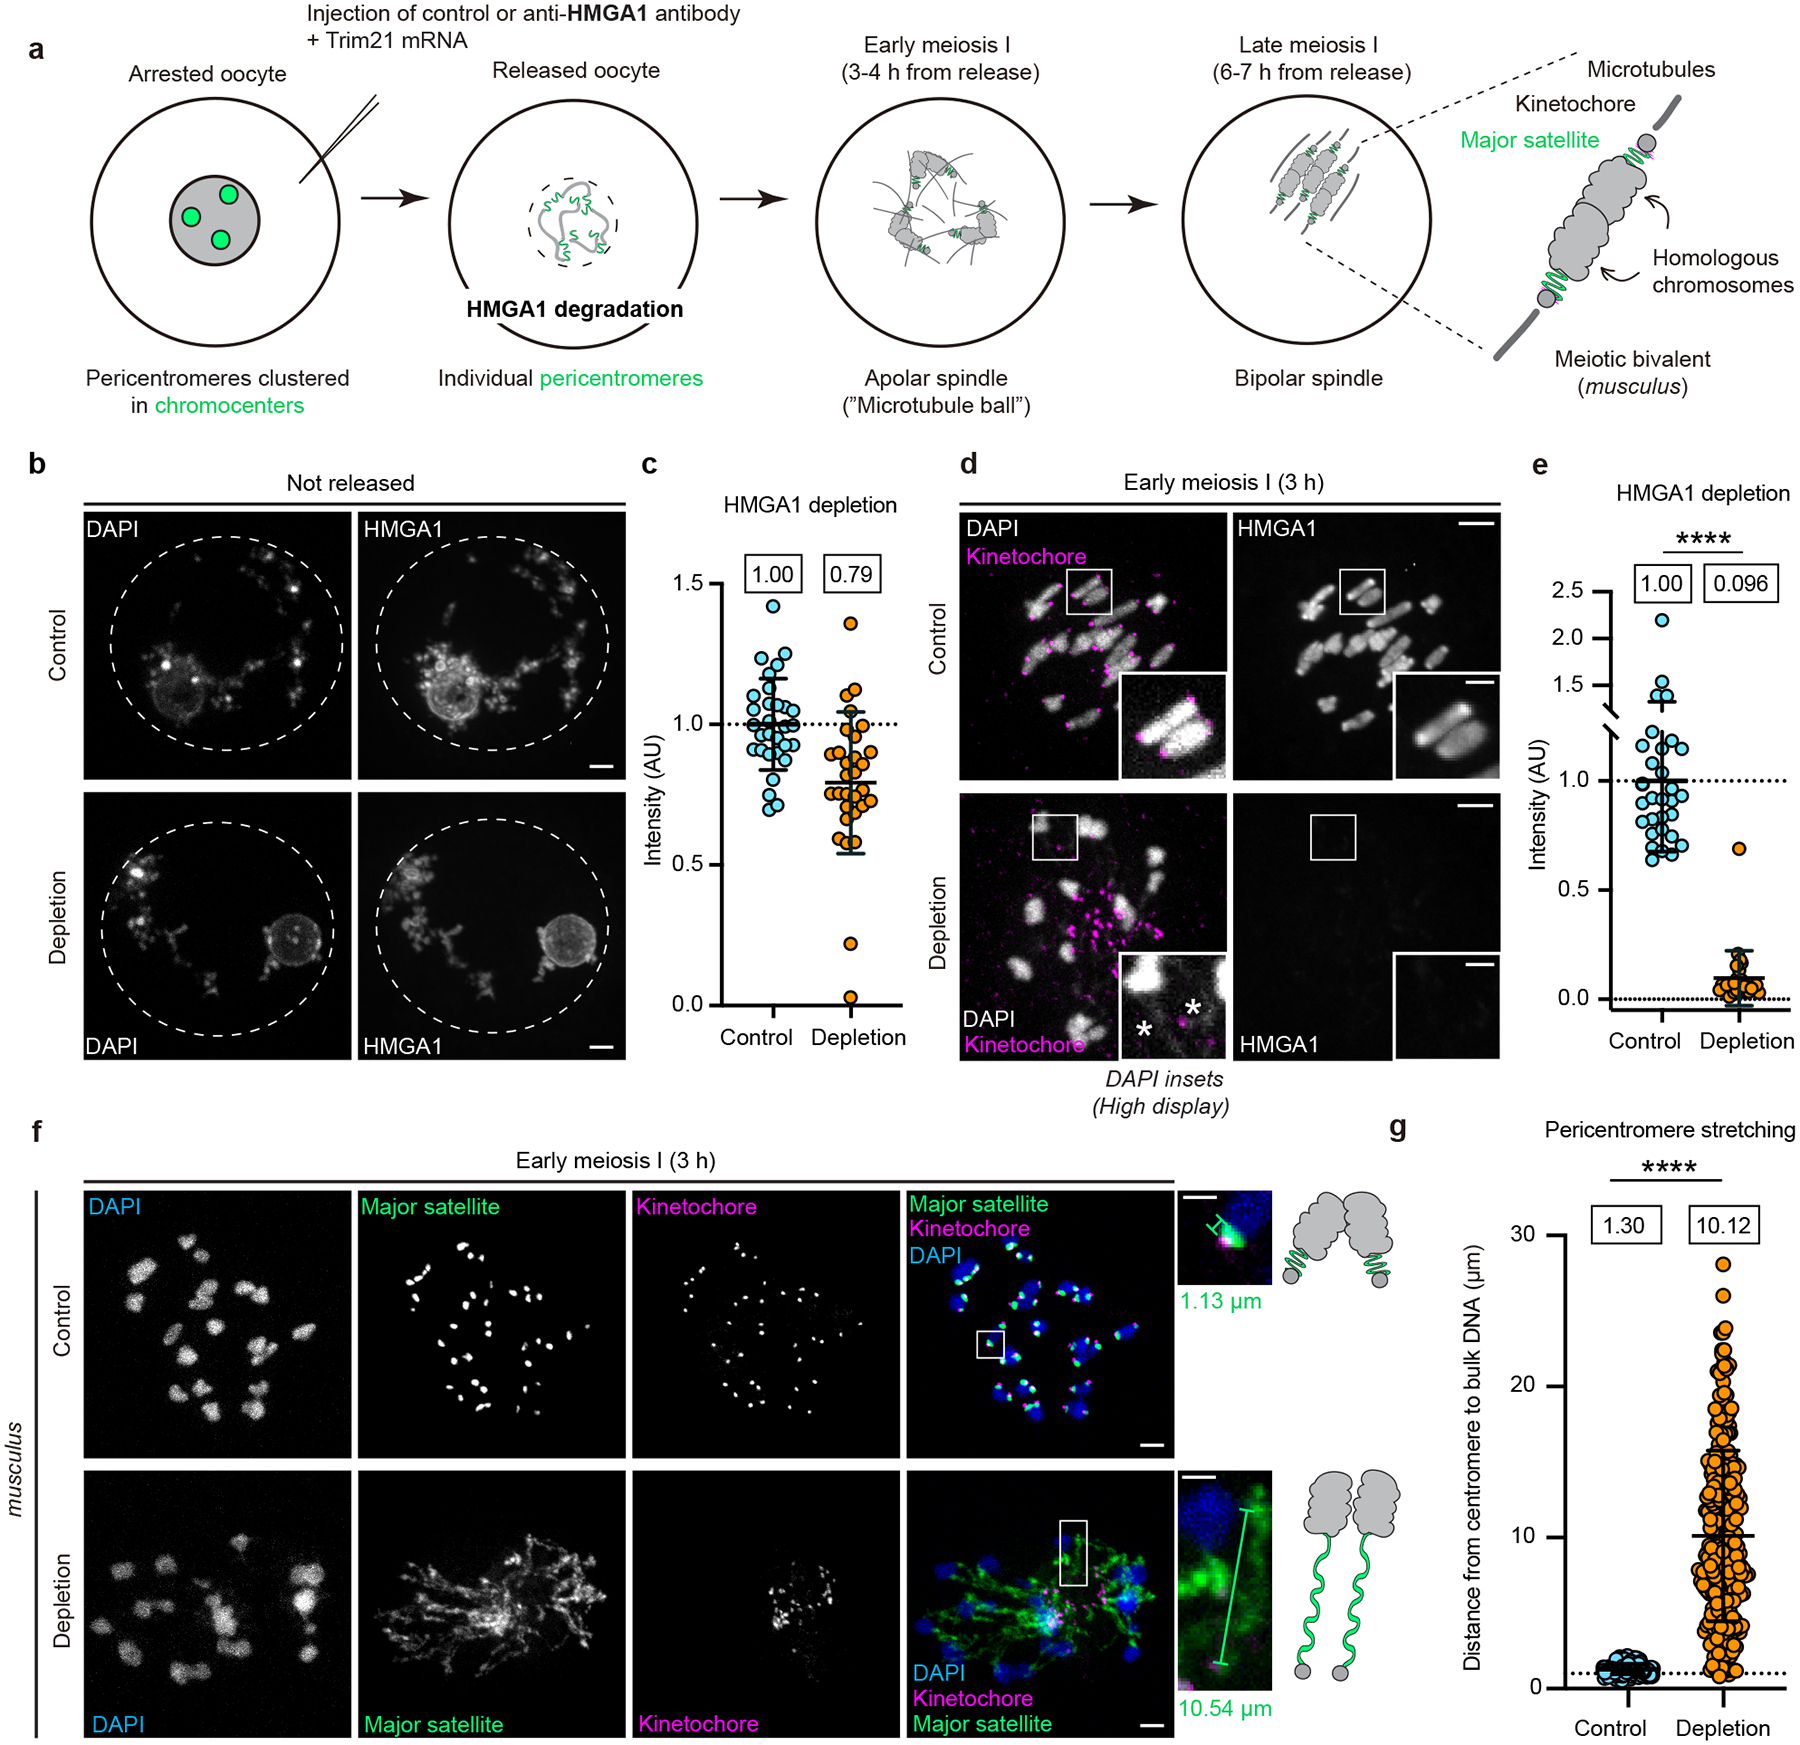
a, Schematic of meiosis I in musculus oocytes from milrinone-induced G2/prophase arrest to bipolar spindle assembly. HMGA1 is depleted after release when the nuclear envelope breaks down and anti-HMGA1 antibody and Trim21 can access condensing chromosomes (see Methods for details). Major satellite is marked in green. b,c, Arrested musculus oocytes were injected with Trim21 mRNA and anti-HMGA1 (or control) antibodies, incubated for 6 h to allow Trim21 expression, then fixed and stained for DNA (DAPI) and HMGA1. Images (b) show nuclei outlined by dashed line. HMGA1 intensity was quantified ((c), mean and standard deviation indicated, means shown in boxes, n=30 oocytes per condition from 2 independent experiments). d,e, Musculus oocytes were injected with Trim21 mRNA and anti-HMGA1 (or control) antibodies, incubated for 3 h, released from arrest, fixed 3 h later (6 h post injection), and stained for DNA (DNA), HMGA1, and the kinetochore protein Hec1. Asterisks (d) show DNA threads connecting chromosome arms with kinetochores. DAPI signal is enhanced in the insets to visualize thin threads of DNA. HMGA1 intensity was quantified ((e), mean and standard deviation indicated, means shown in boxes, n=30 (control) and 28 (depletion) oocytes from 2 independent experiments; two-tailed Mann-Whitney test, **** P<0.0001). f,g, Control or HMGA1-depleted musculus oocytes expressing TALE-mClover targeting major satellite were fixed in early meiosis I and stained for DNA (DAPI) and Hec1. Insets (f) show differences in major satellite length (green bars). Pericentromere stretching was quantified as the length of major satellite connecting a kinetochore to bulk DNA ((g), mean and standard deviation indicated, means shown in boxes, n=240 (control) and 270 (depletion) pericentromeres from 48 (control) and 54 (depletion) oocytes from 3 independent experiments; two-tailed Mann-Whitney test, **** P<0.0001). Scale bars 5 μm or 2 μm (insets).
To determine if HMGA1 depleted impacts kinetochores, which form on centromeric chromatin adjacent to pericentromeres, we examined Hec1 (Highly expressed in cancer 1), a major microtubule-binding protein at kinetochores. We find reduced levels of Hec1 at kinetochores (Fig. 4a,b) and kinetochore clustering (Fig. 4c,d), suggesting disrupted kinetochore function. In mouse oocytes kinetochores facilitate bipolar spindle assembly45. Consistent with the disrupted kinetochore function in HMGA1-depleted oocytes, we found delayed spindle bipolarization (Fig. 4e,f). Mouse oocytes typically build a transient radially symmetric apolar spindle (Fig. 3a;46). Blocking spindle bipolarization using a kinesin-5 inhibitor (STLC) revealed more asymmetric morphology in HMGA1-depleted oocytes (Extended Data Fig. 7a–c), indicating disrupted microtubule organization. HMGA1-depleted oocytes eventually formed bipolar spindles, which coincided with reduced major satellite stretching, but few cells were able to divide (Fig. 4g). Given that spindle forces remain strong in late meiosis I47, reduced stretching in late meiosis I is likely due to compensatory DNA packaging mechanisms (e.g., via condensin II26). We conclude that HMGA1 ensures pericentromere rigidity both to withstand spindle forces and promote timely kinetochore-mediated spindle assembly.
Fig. 4: HMGA1 depletion disrupts kinetochore organization and delays bipolar spindle assembly.
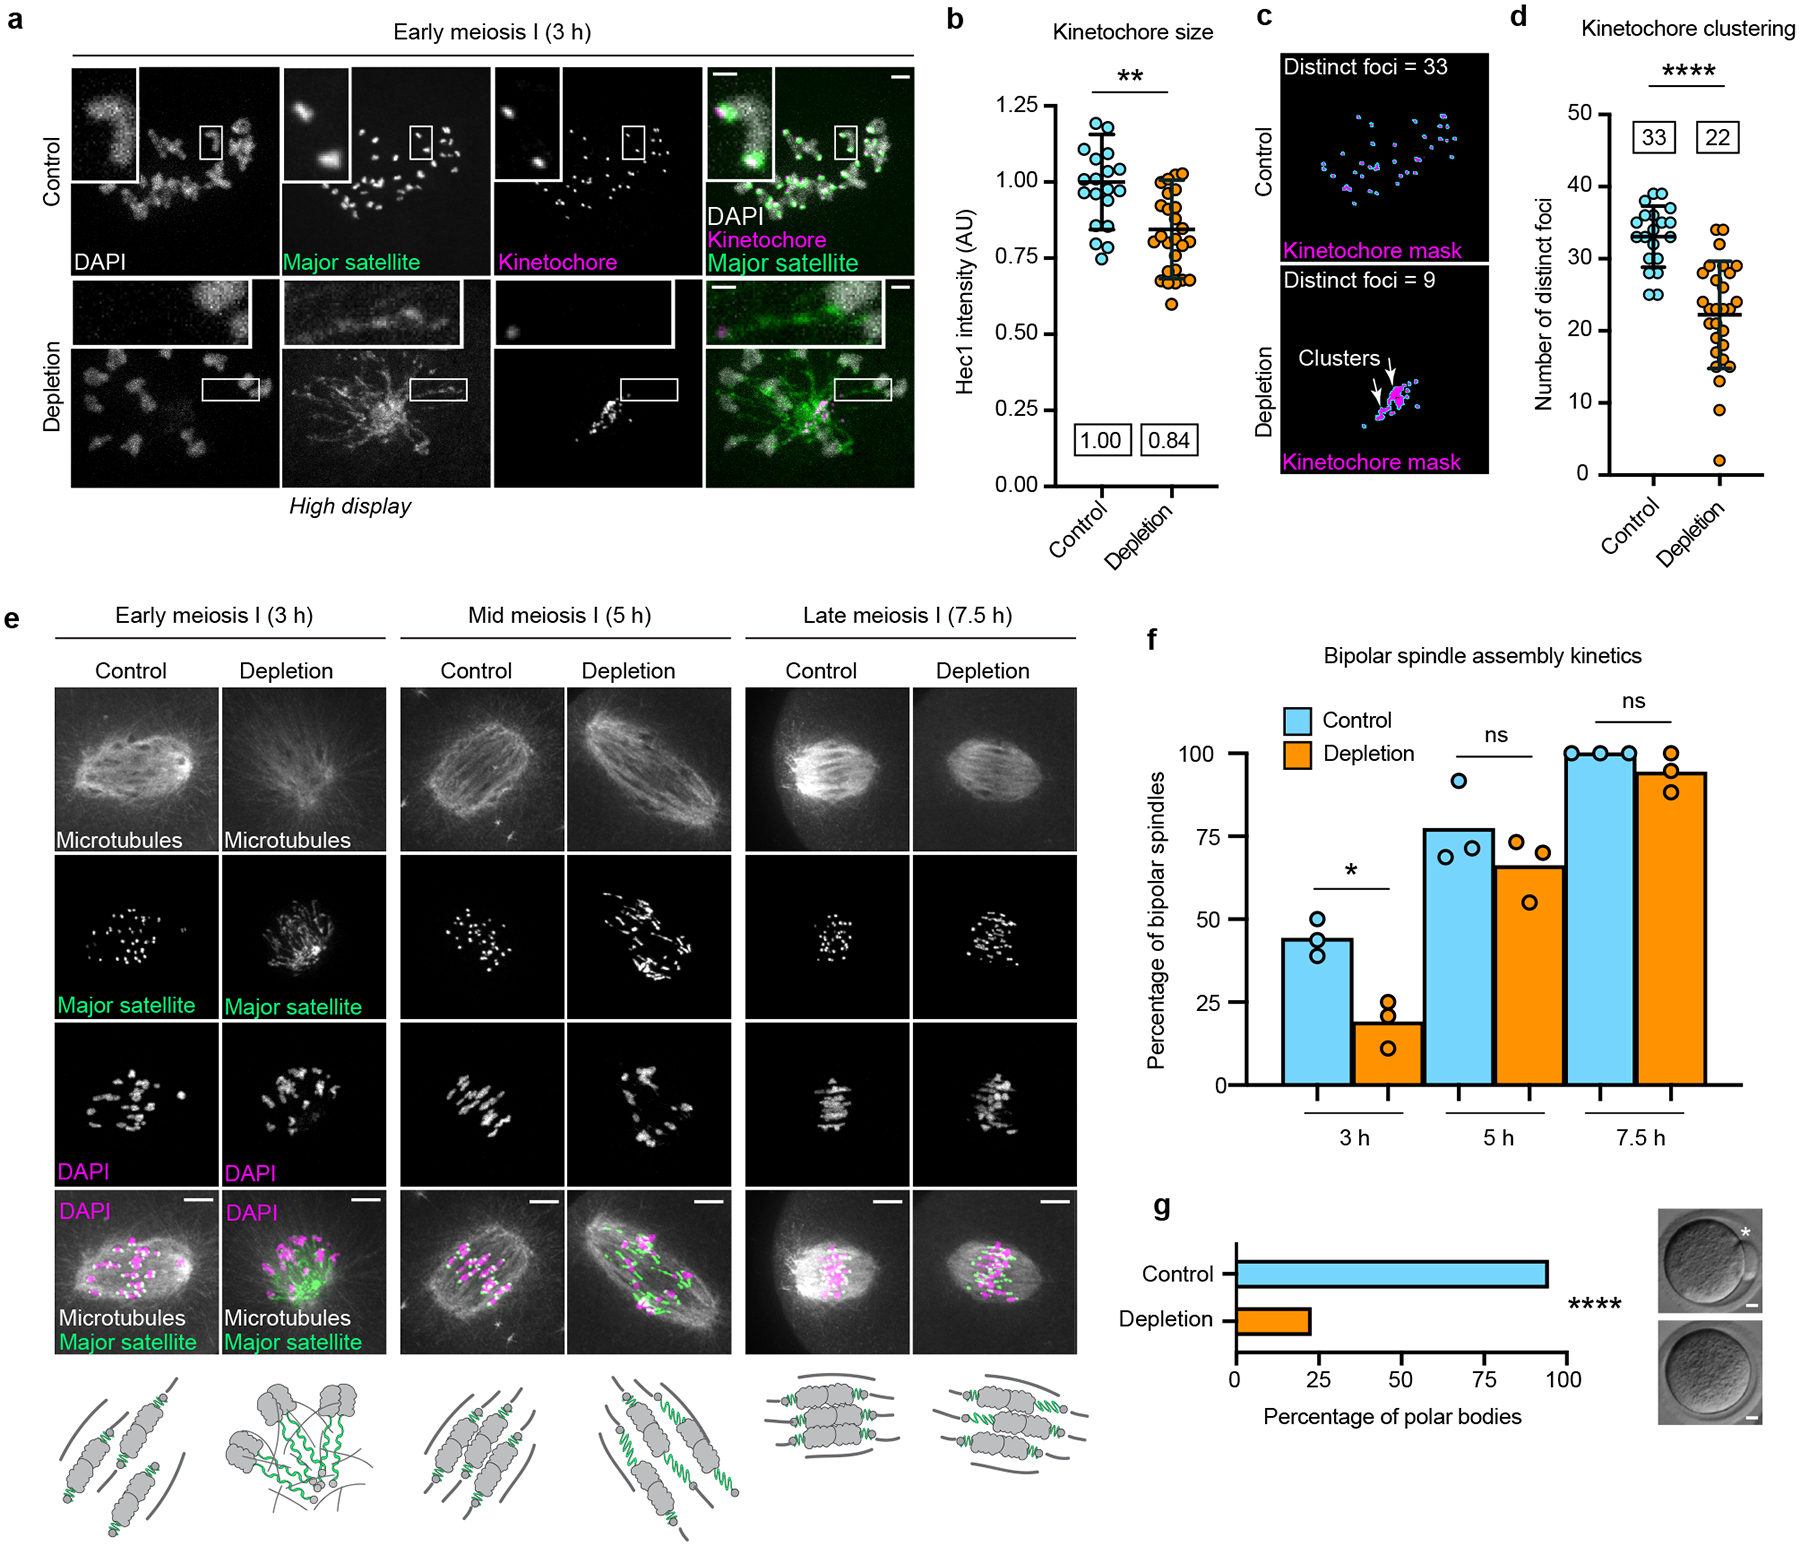
a-d, Control or HMGA1-depleted musculus oocytes expressing TALE-mClover targeting major satellite were fixed in early meiosis I and stained for DNA (DAPI) and Hec1. Scale bars 5 μm or 2 μm (insets). Major satellite signal is enhanced in the HMGA1-depleted oocyte (a) to visualize thin threads of DNA. Hec1 was quantified at individual kinetochores ((b), mean and standard deviation indicated, means shown in boxes, n=20 (control) and 27 (depletion) oocytes from 2 independent experiments; unpaired two-tailed t-test, ** P=0.0018). Kinetochore clustering was measured using Hec1 as a mask (c) and counting the number of distinct foci per cell ((d), mean and standard deviation indicated, means shown in boxes, n=20 (control) and 28 (depletion) oocytes from 2 independent experiments; unpaired two-tailed t-test, **** P<0.0001). e,f, Control or HMGA1-depleted musculus oocytes expressing TALE-mClover targeting major satellite were fixed at the indicated timepoints and stained for DNA (DAPI) and microtubules (α-tubulin). Scale bars 10 μm. Bipolar spindles were counted to quantify spindle assembly kinetics ((f), bars show means of 3 independent experiments, n=50 (3 h, control), 62 (3 h, depletion), 42 (5 h, control), 55 (5 h, depletion), 36 (7.5 h, control) and 57 (7.5 h, depletion) oocytes; ordinary one-way ANOVA followed by Tukey’s multiple comparison test, * P=0.0187 (3 h), ns=not significant (P=0.5306 (5 h) and P=0.9428 (7.5 h)). g, Control or HMGA1-depleted musculus oocytes were cultured until metaphase of meiosis II. Representative images show a polar body (control; white asterisk) or lack thereof (HMGA1-depleted). Frequency of polar body extrusion was quantified (n=60 oocytes per condition from 2 independent experiments; Fisher’s exact two-sided test, **** P<0.0001). Scale bar 10 μm.
Disproportional impact of HMGA1 loss
Since HMGA1 is enriched at major compared to minor satellite in hybrid musculus/spretus oocytes (Fig. 2b,c), and its depletion results in massive stretching of major satellite in musculus oocytes (Fig. 3f,g), we predict that HMGA1 preferentially packages major satellite over minor satellite. To test this prediction, we depleted HMGA1 in musculus/spretus hybrid oocytes to compare chromosomes with pericentromeres built on different satellites in the same cell. Consistent with our prediction, we found that musculus pericentromeres were significantly more stretched than spretus pericentromeres (Fig. 5a,b; Extended Data Fig. 8a–d). To test if differential disruption of pericentromere packaging also extends to kinetochore function, we examined Mad1 (Mitotic arrest deficient 1), a checkpoint protein that localizes to kinetochores lacking stable microtubule attachments in meiosis48. We measured Mad1 intensity at individual kinetochores and computed the ratio of musculus to spretus kinetochores in each hybrid oocyte (Fig. 5c,d; Extended Data Fig. 9a–c). At an early timepoint (3 h) most kinetochores were Mad1-positive, as expected since kinetochore-microtubule attachments are typically unstable early in metaphase I49,50, and the musculus/spretus ratio was similar in control and HMGA1-depleted oocytes. At a later timepoint (7 h), Mad1 was two-fold higher on musculus compared to spretus kinetochores in HMGA1-depleted hybrid oocytes, indicating more unstable attachments at musculus kinetochores. We could not accurately measure Mad1-GFP levels in control hybrid oocytes at 7 h because most attachments are stable by this time and lack Mad1. Higher Mad1 levels at musculus kinetochores are not explained by bigger kinetochores, because Hec1 is lower on musculus compared to spretus kinetochores in HMGA1-depleted cells (Fig. 5c,e; Extended Data Fig. 9d–f). These results demonstrate a disproportionate role of HMGA1 in the packaging of musculus pericentromeres, which are built on major satellite, compared to spretus pericentromeres built on minor satellite. Moreover, DNA shape-mediated chromatin packaging has functional implications for formation of kinetochore-microtubule attachments in female meiosis.
Fig. 5: HMGA1 depletion disproportionately disrupts musculus pericentromeres.
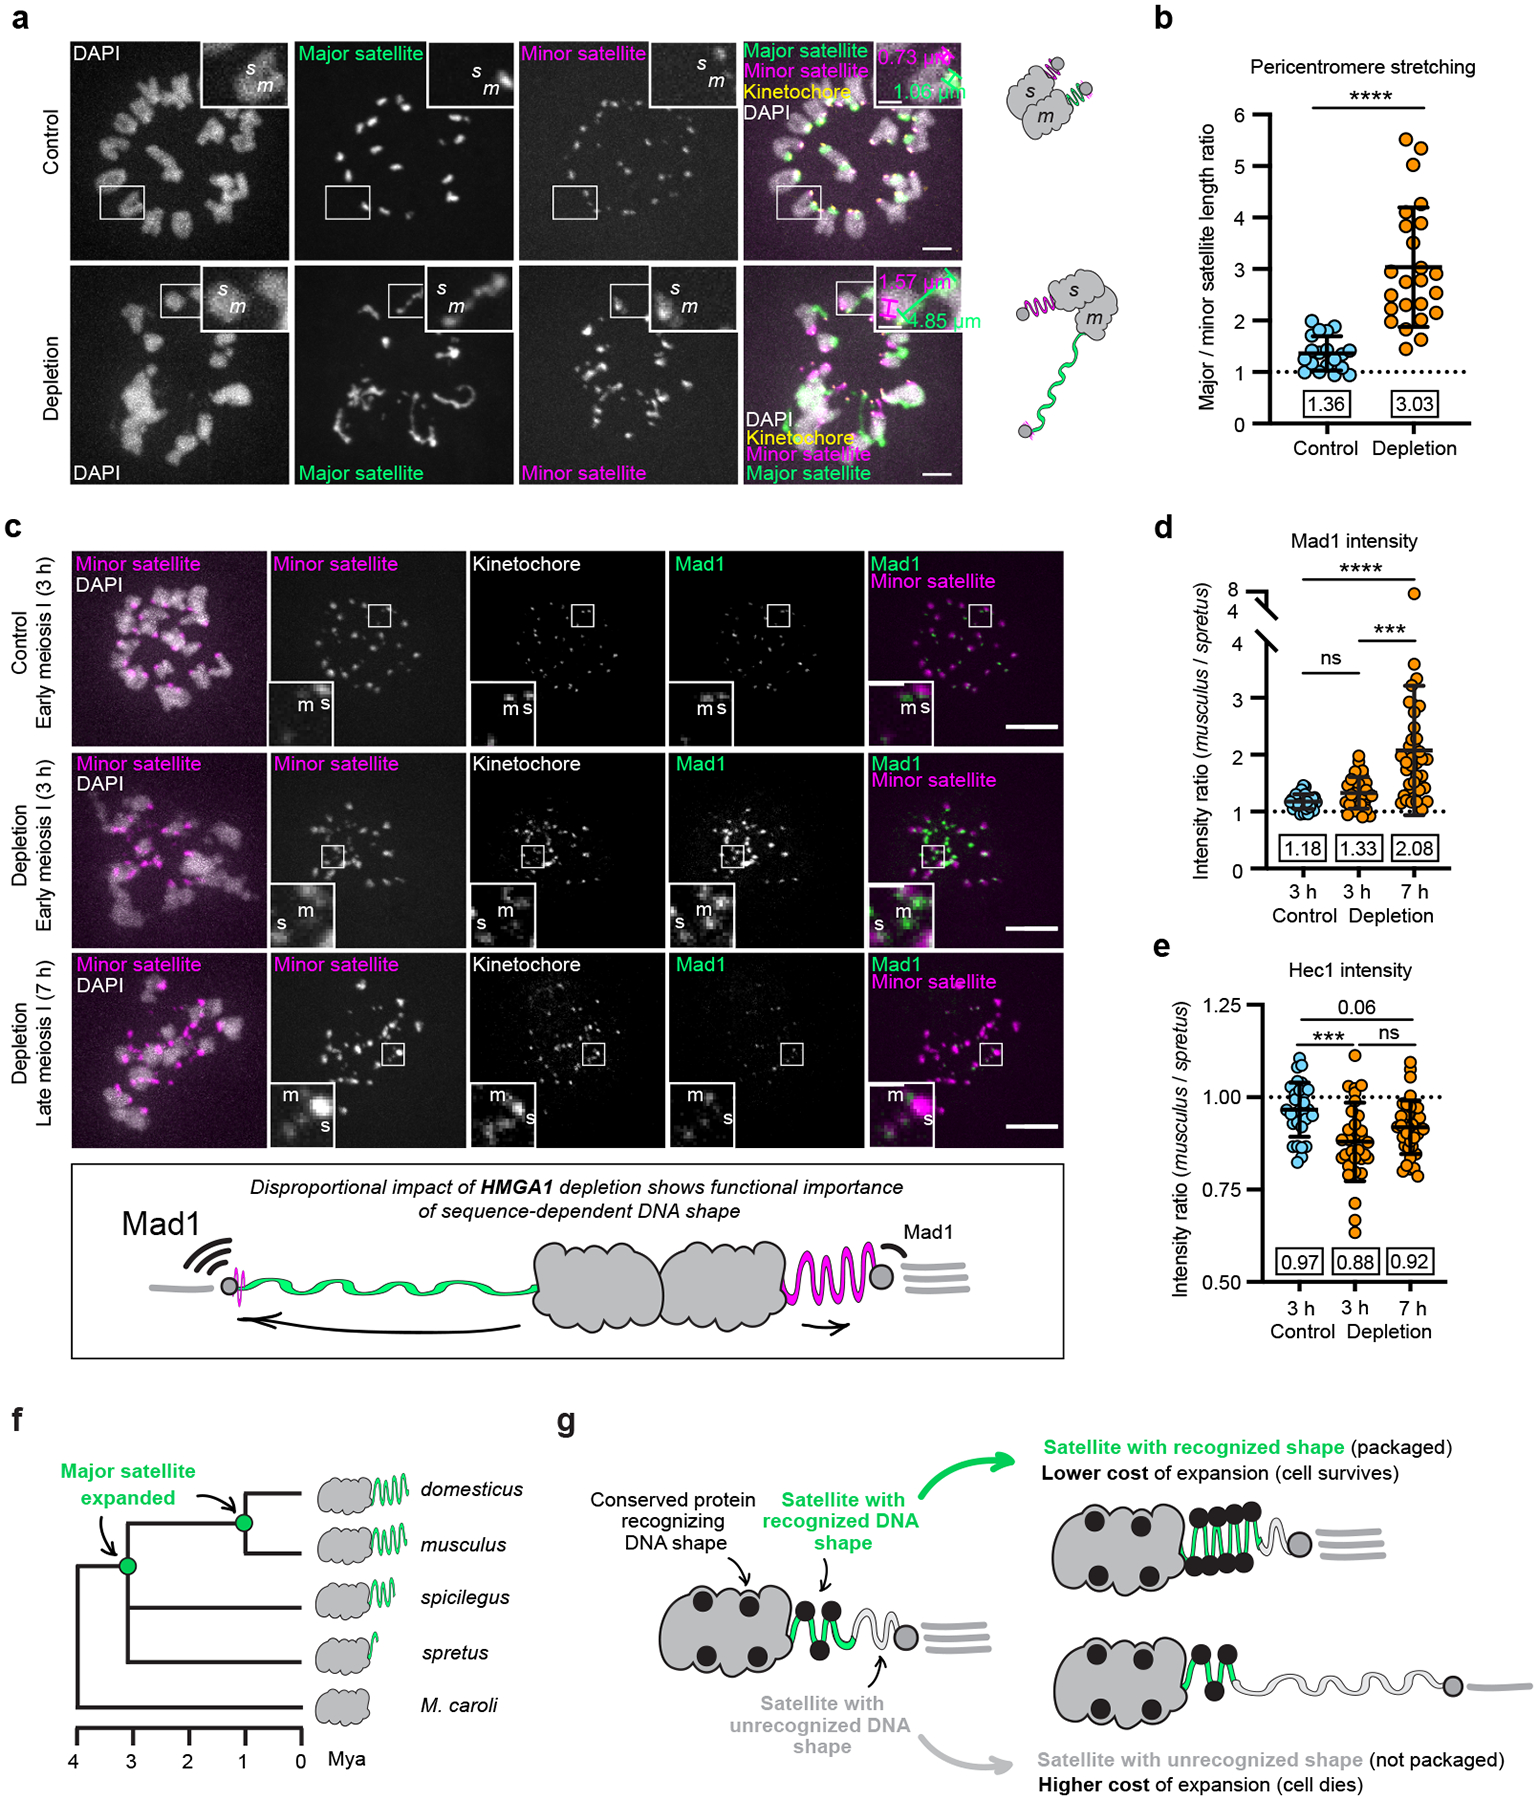
a,b, Control or HMGA1-depleted musculus/spretus hybrid oocytes were fixed in early meiosis I and stained for DNA (DAPI) and kinetochore (Hec1). Cells were expressing TALE-mClover (major satellite) and dCas9-mCherry/gRNA (minor satellite). Scale bars 5 μm or 2 μm (insets). The ratio of musculus/spretus pericentromere stretching was quantified as major satellite length/minor satellite length ((b), mean and standard deviation indicated, means shown in boxes, n=19 (control) and 24 (depletion) hybrid oocytes from 2 independent experiments, 5 pericentromeres per species measured per oocyte; unpaired two-tailed t-test, **** P<0.0001). c-e, Control or HMGA1-depleted musculus/spretus hybrid oocytes were fixed in early or late meiosis I and stained for DNA (DAPI) and kinetochore (Hec1). Cells were expressing Mad1-2xGFP and dCas9-mCherry/gRNA (minor satellite). Scale bars 10 μm or 2 μm (insets). Unattached kinetochores (d) and kinetochore size (e) were quantified as a ratio between average Mad1 or Hec1 signal at musculus and spretus kinetochores (mean and standard deviation indicated, means shown in boxes, n=30 (3 h, control), 31 (3 h, depletion) and 38 (7 h, depletion) hybrid oocytes from 2 independent experiments, at least 17 kinetochores quantified per oocyte; ordinary one-way ANOVA test followed by Tukey’s multiple comparison test, **** P<0.0001, *** P=0.0001 (Mad1), *** P=0.0004 (Hec1), ns=not significant (P=0.6906 (Mad1) and P=0.1402 (Hec1 3 h vs 7 h depletion)). f, Expansion of major satellite (green) along the musculus lineage26. g, Different satellite have distinct DNA shapes. A satellite recognized by existing packaging proteins can be efficiently packaged and expand within the genome without severe fitness costs. Conversely, a satellite that is not recognized is not packaged, leading to a fitness cost of expansion. Note that this model does not predict that DNA shape-mediated mechanisms evolved to promote satellite expansion but rather that satellites co-opt existing mechanisms that evolved to bind other parts of the genome.
Discussion
Altogether, our work provides experimental evidence that pericentromeric satellite DNA sequence impacts its packaging and function during chromosome segregation. We identify sequence-mediated shape of the DNA molecule as a determinant of pericentromere packaging in mammalian female meiosis. We find that while both minor and major satellites can form pericentromeric heterochromatin, they differ in their dependence on HMGA1, which recognizes DNA shape (Fig. 2d). The high density of contiguous A/T stretches in major satellite repeats is consistent with an intrinsic capacity to adopt narrow DNA minor groove recognized by HMGA1. We find that HMGA1 packages individual pericentromeres, likely by bundling DNA via its three AT-hook motifs5, akin to bundling multiple pericentromeres into chromocenters in interphase10. Disrupting pericentromere packaging in meiosis by HMGA1 depletion leads to pericentromere stretching by microtubules, indicating that pericentromeric rigidity is needed to withstand spindle forces51,52 that pull and push chromosomes during cell division (reviewed in53). These findings also indicate that major satellite packaging in female meiosis requires both condensin II26 and HMGA1, reflecting the challenges that large satellites pose to the genome. Given that acute HMGA1 depletion results in nearly 5-fold longer major satellite stretches compared to the equivalent condensin II depletion26, HMGA1 might be the more potent packaging mechanism.
Acute HMGA1 depletion most likely disrupts kinetochore organization (Fig. 4a–d) via the massive pericentromere stretching (Fig. 3f,g), consistent with more disrupted musculus vs spretus kinetochores in hybrid oocytes (Fig. 5c–e). Our results also reveal the importance of pericentromere rigidity for kinetochore interactions with microtubules locally and organization of the spindle more globally (Extended Data Fig. 7d). We propose that the delay in bipolar spindle formation in HMGA1-depleted cells (Fig. 4e,f) is due to kinetochore clustering (Fig. 4c,d), which would change the spatial organization of the key microtubule crosslinker PRC1 (Protein Regulator of Cytokinesis 145). Disruption of kinetochore-microtubule attachments (Fig. 5c,d) is likely mediated by Aurora A kinase destabilizing attachments near microtubule organizing centers located within the apolar “microtubule ball” (MTOCs; Extended Data Fig. 7d;48,54). Alternatively, stretched pericentromeres may fail to create tension that typically stabilizes attachments (reviewed in55). Altogether, our work using acute depletion in meiosis draws an important distinction from the role of HMGA1 in maintaining chromocenter integrity and preventing DNA damage and micronuclei formation in interphase10.
Using closely related musculus and spretus as a natural model system with variation in pericentromeric satellites provides insight into the evolution of satellite DNA. Distinct satellites are thought to emerge from a “library” of common repeats present in closely related species (library hypothesis56), but it is unclear how some repeats become more abundant than others. Satellites may have features (e.g., AT content or repeat length) that are advantageous, for example at centromeres or pericentromeres57,58,59, and thus favored by natural selection. However, that scenario does not explain the differential abundance of major and minor satellites in musculus and spretus. Although both satellites can form pericentromeric heterochromatin (Fig. 1), major satellite expansion occurred specifically in the musculus lineage15,26 (Fig. 5f). Alternatively, satellites may increase their abundance by meiotic drive via biased inheritance during female meiosis1. While expansion of centromeric minor satellite correlates with drive21,25, there is no evidence that major satellite can drive. Our findings suggest a mechanism to facilitate satellite expansion without requiring any particular satellite function (Fig. 5g). We propose that expansion is costly if the satellite is not properly packaged. A satellite that adopts a DNA shape prevalent at other genomic loci (e.g., enhancers60), however, would be efficiently packaged by conserved DNA shape-recognizing proteins, thus minimizing the cost of expansion. An alternative model is selection for heterochromatin protein variants that bind the expanded satellite to reduce fitness costs (reviewed in61). Under our model, adopting a DNA shape recognized by highly conserved HMGA1 facilitated expansion of major satellite in the musculus lineage. Consistent with our model, recent work in musculus/spretus hybrid oocytes demonstrated that failure to package major satellite can lead to chromosome mis-segregation. That effect is mediated by reduced condensin II at major satellite in the hybrid background compared to musculus and underlies hybrid subfertility26. In contrast, we show that HMGA1 recruitment depends on DNA shape and not the genetic background (Fig. 2b,c). This finding implies that HMGA1 is not involved in musculus/spretus hybrid subfertility, and that a readily available HMGA1 pool is present in musculus, spretus and hybrid oocytes, likely due to its highly conserved function in genome organization. Therefore, DNA shape-mediated satellite packaging by highly conserved and abundant architectural proteins can explain a longstanding paradox: how large satellite arrays rapidly evolve while evading fitness costs associated with their expansion.
It will be important in the future to expand on our model, which is based on binding patterns of a single DNA shape-recognizing architectural protein. We envision that this will entail defining the binding patterns of other DNA shape recognizing architectural proteins in diverse eukaryotes. We speculate that another protein that is sensitive to DNA sequence and/or shape facilitated minor satellite expansion in spretus. Candidates include other HMG proteins, histone H1 variants that compete with HMG proteins for DNA binding (reviewed in62), and the centromeric protein CENP-B63. Recent findings in Drosophila might offer an additional example as distinct pericentromeric AATAACATAG and GAACAGAACATGTTC satellites are both packaged by highly conserved Prod64, possibly because each adopted its cognate DNA shape, facilitating expansion in the closely related melanogaster and simulans lineages respectively. Interestingly, most peri/centromeric satellites in eukaryotes are AT-rich59, suggesting that the general satellite packaging principles we propose based on our mouse models may be beneficial in diverse species to withstand spindle forces. Furthermore, our model is built on experimentation using acute HMGA1 depletion. Given that HMGA1 knockout mice are viable, albeit show impaired insulin signaling65, compensatory mechanisms for packaging major satellite must arise upon traditional gene disruption. The contribution of those compensatory mechanisms in the female germline could be tested using conditional HMGA1 depletion. Finally, it will be interesting to directly test the impact of DNA shape recognition on major satellite expansion through manipulation of DNA shape. Despite recent advances in sequencing repetitive regions2,3, satellite manipulation methods remain in their infancy. For now, our model provides a mechanistic explanation for how a specific megabase satellite array could emerge at short evolutionary time scales from a library of repeats present in closely related species56,59,66.
Methods
Mice
Musculus mouse strains were purchased from Jackson Laboratory (C57BL/6J, stock# 000664; used for sequencing experiments) or Envigo/Inotiv (NSA, stock# 033 corresponding to CF-1; used for oocyte experiments). Spretus was purchased from Jackson Laboratory (SPRET/EiJ, stock# 001146; used for sequencing experiments) or RIKEN BioResource Research Center (SPR2, RBRC00208; used for oocyte experiments). CF-1 females were crossed to SPRET/EiJ males to generate hybrids. All mice used in this study were female at 2–4 months old. Mice were housed in controlled room temperature conditions with minimal disturbances, light/dark cycle of 12 h each, and humidity ranging between 30–70% depending on the season. All animal experiments were approved by the Institutional Animal Care and Use Committee of the University of Pennsylvania and were consistent with the National Institutes of Health guidelines (protocol: #804882).
MNase-digested chromatin and native chromatin immunoprecipitation
Chromatin immunoprecipitation was performed as described previously21. Briefly, nuclei were isolated from flash-frozen mouse livers musculus (C57BL/6J) or spretus. Livers were homogenized in 4 ml ice-cold Buffer I (0.32 M sucrose, 60 mM KCl, 15 mM NaCl, 15 mM Tris-Cl, pH 7.5, 5 mM MgCl2, 0.1 mM EGTA, 0.5 mM DTT, 0.1 mM PMSF, 1 mM leupeptin/pepstatin, 1 mM aprotinin) per g of tissue by Dounce homogenization. Homogenate was filtered through 100 μm cell strainer (Falcon) and centrifuged at 6000 × g for 10 min at 4°C. The pellet was resuspended in the same volume Buffer I. An equivalent volume ice-cold Buffer I supplemented with 0.2% IGEPAL was added, and samples were incubated on ice for 10 min. 4 ml nuclei were layered on top of 8 ml ice-cold Buffer III (1.2 M sucrose, 60 mM KCl, 15 mM NaCl, 5 mM MgCl2, 0.1 mM EGTA, 15 mM Tris, pH 7.5, 0.5 mM DTT, 0.1 mM PMSF, 1 mM leupeptin/pepstatin, 1 mM aprotinin) and centrifuged at 10,000 × g for 20 min at 4°C with no brake. Pelleted nuclei were resuspended in Buffer A (0.34 M sucrose, 15 mM HEPES, pH 7.4, 15 mM NaCl, 60 mM KCl, 4 mM MgCl2, 1 mM DTT, 0.1 mM PMSF, 1 mM leupeptin/pepstatin, 1 mM aprotinin), flash-frozen in liquid nitrogen, and stored at −80°C. Nuclei were digested with MNase (Affymetrix), using 0.05–0.1 U/μg chromatin in Buffer A supplemented with 3 mM CaCl2 for 10 min at 37°C. The reaction was quenched with 10 mM EGTA on ice for 5 min, and an equal volume of 2× Post-MNase Buffer (40 mM Tris, pH 8, 220 mM NaCl, 4 mM EDTA, 2% Triton X-100, 0.5 mM DTT, 0.5 mM PMSF, 1 mM leupeptin/pepstatin, 1 mM aprotinin) was added prior to centrifugation at 18,800 × g for 15 min at 4°C. The supernatant containing the MNase-digested chromatin was pre-cleared with 100 μl 50% Protein G Sepharose bead (GE Healthcare) slurry in 1× Post-MNase Buffer for ~ 2 h at 4°C with rotation. Beads were blocked in NET Buffer (150 mM NaCl, 50 mM Tris, pH 7.5, 1 mM EDTA, 0.1% IGEPAL, 0.25% gelatin, and 0.03% NaN3). Pre-cleared supernatant was divided so that an estimated 250 μg chromatin was used for ChIP (10 μg H3K9me3 antibody, Abcam ab8898; or 10 μg anti-mouse-specific CENP-A antibody18) and 12.5 μg was saved as input. ChIP samples were rotated at 4°C for 2 h. Immunocomplexes were recovered by addition of 100 μl 50% NET-blocked protein G Sepharose bead slurry followed by overnight rotation at 4°C. The beads were washed three times with Wash Buffer 1 (150 mM NaCl, 20 mM Tris-HCl, pH 8, 2 mM EDTA, 0.1% SDS, 1% Triton X-100), once with High Salt Wash Buffer (500 mM NaCl, 20 mM Tris-HCl, pH 8, 2 mM EDTA, 0.1% SDS, 1% Triton X-100), and the chromatin was eluted 2× each with 200 μl Elution Buffer (50 mM NaHCO3, 0.32 mM sucrose, 50 mM Tris, pH=8, 1 mM EDTA, 1% SDS) at 65°C for 10 min at 1500 rpm. The input sample was adjusted to a final volume of 400 μl with Elution Buffer. To each 400 μl input and ChIP sample, 16.8 μl of 5 M NaCl and 1 μl of RNAse A (10 mg/ml) was added. After 1 h at 37°C, 4 μl of 0.5M EDTA and 12 μl Proteinase K (2.5 mg/ml, Roche) were added, and samples were incubated for another 2 h at 42°C. The resulting Proteinase K-treated samples were subjected to a phenol-chloroform extraction followed by purification of DNA with a QiaQuick PCR Purification column (Qiagen) in preparation for high-throughput sequencing.
High-throughput sequencing
Purified, unamplified input or ChIP DNA (see section MNase-digested chromatin and native chromatin immunoprecipitation) was quantified using an Agilent 2100 Bioanalyzer High Sensitivity Kit. DNA libraries were prepared for multiplexed sequencing according to Illumina recommendations as described67 with minor modifications using NEB enzymes. Briefly, 5 ng input or ChIP DNA was end-repaired and A-tailed. Illumina TruSeq adaptors were ligated, libraries were size-selected to exclude polynucleosomes, and adapter-modified DNA fragments were enriched by PCR using KAPA polymerase. Libraries were assessed by Bioanalyzer, and the degree of nucleosome digestion for each experiment was assessed to avoid any potentially over-digested samples. Libraries were submitted for 150-bp, paired-end Illumina sequencing on a NextSeq 500 instrument.
Paired-end sequencing analysis
Paired-end sequencing analysis was performed as described previously21 with some modifications. Briefly, SeqPrep (https://github.com/jstjohn/SeqPrep) was used to remove adapters and merge paired end Illumina reads using a minimum overlap parameter adjusted for read length (-q 25 -L 25 -o 35). FastQC (version 0.11.8) was used pre- and post-SeqPrep to assess read quality. For analysis of minor and major satellite DNA, we used a custom tandem repeat analysis as described67 with the following modifications. Joined reads were aligned to a trimerized mouse minor satellite consensus (GenBank: X14464.168) to a dimerized mouse major satellite consensus (GenBank: V00846.169) or to the reverse complement of those tandem consensus sequences using the MATLAB localign function (MATLAB R2020a, MathWorks). Those joined reads aligning with ≥ 80% identity were chosen for further analysis. To calculate the percent of total reads, the number of joined reads aligning to the consensus sequence in either the forward or reverse complement orientation (without double-counting any joined read) was divided by the total number of joined reads. ChIP fold-enrichment was calculated as the fraction of reads mapping to minor (or major) satellite from the ChIP divided by the fraction of reads mapping to minor (or major) satellite in the input.
Analysis of HMGA1 ChIP-sequencing data
HMGA1 ChIP-sequencing data (Illumina HiSeq 2500, 50 bp read length, single-end) from musculus ESCs was downloaded from the SRA (Accession numbers SRR5749536, SRR5749537, SRR5749546, and SRR5749545)40. Single-end sequencing analysis was performed as follows. Trim Galore [https://github.com/FelixKrueger/TrimGalore] was used for adapter and quality trimming (--illumina -e 0.1 --stringency 3 --quality 20). For analysis of minor and major satellite DNA, we used the custom tandem repeat analysis described under ‘Paired-end sequencing analysis’. Additionally, the HMGA1 ChIP-sequencing data was mapped to high-fidelity long-read sequencing (LRS) reads containing continuous minor and major satellite arrays70. LRS data was downloaded from the SRA (Accession number SRR11606870; minor satellite SRR11606870.111923, major satellite SRR11606870.2342980). Sequence alignment was performed using Bowtie2 (bowtie2 --end-to-end --very-sensitive --no-mixed --no-discordant -q--phred33)71.
A/T stretch and tetranucleotide analysis
Publicly available long reads generated using PacBio Sequel II System with HiFi sequencing from C56BL/6 J Mus musculus strain72 were analyzed using Python 3.11 to count the number of A/T stretches per repeat in major and minor satellite. First, reads containing only major or minor satellite motifs were isolated (major satellite: 37744 reads with GAAAACTGAAAA motif; minor satellite: 4045 reads with CENP-B box ATTCGTTGGAAACGGGA). Second, 500 reads per satellite (15–20 kb long) were isolated via BLAST 2.6.0 package using a representative major (SRR11606870.2342980) or minor (SRR11606870.111923) satellite homogenous type I contiguous arrays as queries70. Third, an average of minimum 3, 4 and 5 bp-long A/T stretches (non-overlapping) or an average of tetranucleotides associated with narrow minor groove35 (overlapping) was computed for each of 500 reads per satellite.
HMGA1 sequence analysis
Musculus canonical HMGA1 coding sequence (ENSMUST00000118599.9) was used as a query to identify spretus HMGA1 in the non-annotated genomic assembly (GCA_001624865.1) using BLAST (tblastn) and synteny analysis.
IF-FISH
Musculus or spretus liver nuclei were cytospun onto Shandon SuperFrost Plus slides (ThermoScientific) in a cytofunnel (ThermoScientific) at 1500 rpm for 5 min prior to fixation in 4% formaldehyde in PBS for 10 min, permeabilized with 0.2% Triton X-100 in PBS for 5 min, blocked in IF block (2% FBS, 2% BSA, and 0.1% Tween-20 in PBS) for 20 min, and then incubated in primary (45 min) and secondary antibodies (20 min) diluted in IF block with washes in 0.1% Tween in PBS following each antibody incubation. Rabbit anti-H3K9me3 (1 μg/mL; abcam; ab8898) following fluorophore-conjugated secondary antibody Cy5 anti-rabbit (1:200; Jackson ImmunoResearch Laboratories; 711–175–152) were used. Following immunofluorescence treatment, cells were post-fixed in 4% formaldehyde in PBS for 10 min and further processed for FISH using CENP-B-Cy3 PNA probes (Panagene) for minor satellite detection following the manufacturer’s protocol. Briefly, cells were pretreated with 100 μg/mL RNase A followed by 0.005% pepsin, fixed in 4% formaldehyde, dehydrated, air-dried, hybridized with 200 nM PNA probe, washed, and counterstained in DAPI before mounting in Vectashield (Vector Laboratories).
SYTOX staining
Liver nuclei were cytospun onto slides, as above, and fixed in 4% formaldehyde in PBS for 10 min. IF was performed as above, using ACA (anti-centromere antibody; 1:500; Antibodies Incorporated 15–235) and Cy5 anti-human (Jackson ImmunoResearch Laboratories; 709-175-149) to detect the centromeres. Cells were again fixed in 4% formaldehyde in PBS for 10 min, treated with 100 μg/mL RNase A in 2x SSC for 1 h at 37°C, counterstained in DAPI in 2x SSC for 5 min followed by 167 nM SYTOX Green (Invitrogen) in 2x SSC for 30 min, with rinses in 2x SSC after each stain, and rinsed in distilled water prior to mounting. Pearson’s correlation coefficient between SYTOX intensity and DAPI intensity was quantified from deconvolved images of nuclei (20 z-slices, elliptical ROI of constant size across images using the ImageJ73 plug-in Coloc 2 (PSF 2 pixels)).
Oocyte collection and culture
Female mice were primed with pregnant mare somatic gonadotropin (musculus; 5 U per mouse; 367222; Calbiochem) or CARD HyperOva (spretus and musculus/spretus hybrid; 150 μl per mouse; Cosmo Bio USA; KYD-010-EX-X5) injected into the intraperitoneal cavity 38–48 h prior to oocyte collections to induce superovulation. The ovaries were isolated in M2 medium (M7167; Sigma-Aldrich) with 2.5 mM phosphodiesterase 3 inhibitor milrinone (M4659; 2.5 mM; Sigma-Aldrich Milipore) to block maturation. Germinal-vesicle oocytes were collected, denuded mechanically from cumulus cells using mouth pipette with plastic 100 μm dimeter stripper tips (CooperSurgical; MXL3–100), and incubated for at least 1 h prior to microinjection on a hot plate (38°C) under mineral oil (9305; FUJIFILM Irvine Scientific).
Plasmid and RNA preparation
pGEMHE-Trim21-OLLAS plasmid used for Trim-away experiments was generated by Trim21 subcloning from pGEMHE-mCherry-Trim21 plasmid (kind gift from Melina Schuh; Addgene; #10552243) into a pGEMHE backbone with C-terminal OLLAS tag. pGEMHE-Borealin-OLLAS was generated by cloning Borealin from a cDNA library of mouse testis and subcloning into a pGEMHE backbone with C-terminal OLLAS tag. Inserts and backbones were linearized by PCR reaction using KAPA Polymerase HiFi HotStart ReadyMix (KK2602; Roche) and ligated using In-Fusion Snap Assembly (638948; Takara). Primers were designed using SnapGene 7.1.1 (Dotmatics) software. Other plasmids were generated elsewhere: pIVT-dCas9-mCherry expressing catalytically dead Cas9 targeting minor satellite via a guide RNA recognizing “5′-ACACTGAAAAACACATTCGT-3′” sequence74; pTALYM3-TALE-mClover (kind gift from Maria-Elena Torres-Padilla; Addgene; #47874) expressing a TALE protein recognizing “5′-TGCCATATTCCACGT-3” sequence of the major satellite repeat24, pIVT-Mad1-2xGFP48. All plasmids were amplified in an E.coli strain Stellar™ Competent Cells (636763; Takara) and purified using NucleoSpin kit (740588.25; Takara). mRNA was prepared using T7 mScript™ Standard mRNA Production System (C-MSC100625; CellScript) in vitro transcription kit.
Oocyte microinjection
Oocytes were microinjected with ~5 pl of mRNAs in M2 medium with 2.5 mM milrinone and 3 mg/ml BSA at RT with a micromanipulator TransferMan NK 2 or TransferMan 4r (Eppendorf) and picoinjector (Medical Systems Corp). Oocytes were then incubated in 30–50 μl drops of Chatot-Ziomek-Bavister (CZB) medium (MR019D; Thermo Fisher Scientific) under mineral oil (M5310; Sigma-Aldrich Milipore) at 37.8°C and 5% CO2 (Airgas) for 16 h to allow protein expression. To deplete HMGA1, the Trim-away approach was used43. Briefly, milrinone-arrested oocytes were microinjected with ~5 pl mix containing Trim21-OLLAS mRNA and 0.5 mg/ml of purified polyclonal Normal rabbit IgG (used as control; 12–370; Sigma) or recombinant rabbit monoclonal anti-HMGA1 antibodies (EPR7839 clone; ab226112; abcam). The mix was supplemented with other mRNAs (see figure legends) at the following concentrations: TALE-mClover – 200 ng/μl; Mad1-2xGFP – 100 ng/μl; Trim21-OLLAS – 300–600 ng/μl; dCas9-mCherry – 120–160 ng/μl; gRNA – 20–30 ng/μl; Borealin-OLLAS – 100 ng/μl. Oocytes were then incubated for at least 3 h to allow mRNA expression prior to release by washing out milrinone by passing cells through 5×100 μl drops of CZB medium. Antibodies were passed through Amicon Ultra-0.5 100-K columns (Sigma Milipore, UFC5100625) to remove preservatives and glycerol following an established protocol75. IGEPAL at 0.05% final concentration was added to facilitate injections of viscous mRNA and protein solution.
Oocyte immunofluorescence
Oocytes were fixed in 2% paraformaldehyde dissolved in PBS (pH=7.4) for 20 min in room temperature (RT) with 0.1% Triton X-100 for 15 min at RT, placed in blocking solution (PBS with 0.3% BSA and 0.01% Tween-20) overnight at 4°C, incubated 1 h with primary antibody in blocking solution, washed three times for 15 min each, incubated 1 h with secondary antibody, washed three times for 15 min each, and mounted in Vectashield with DAPI (H-1200; Vector) to visualize chromosomes. Kinetochores were labelled using mouse anti-Hec1 antibody (C-11; sc-515550; Santa Cruz; 1:100–200). Recombinant rabbit monoclonal anti-HMGA1 antibody (EPR7839 clone; ab226112; abcam; at 0.1 μg/ml concentration) was used to determine HMGA1 enrichment at pericentromeres, and AlexaFluor 488-conjugated anti-HMGA1 antibody (EPR7839 clone; ab204667; abcam) was used to assess depletion efficiency in meiosis I (1:500) and to test binding in netropsin-treated GV oocytes (1:5000). Rabbit anti-H3K9me3 (1:500; abcam; ab8898) antibody was used to measure heterochromatin in hybrid musculus/spretus oocytes. Rat monoclonal anti-OLLAS (1:100; clone L2; NBP1–06713; Novus Biologicals) antibody was used to detect Borealin-OLLAS. To stain microtubules, oocytes were fixed in preheated 2% paraformaldehyde dissolved in PEM buffer (200 mM Pipes; 20 mM EGTA; 2 mM MgCl2; pH=6.9) with 0.5% Triton X-100 for 20 min at 38°C, washed with 0.5% Triton X-100 in PEM buffer for 15 min at 38°C, placed in blocking solution (PBS with 0.3% BSA and 0.01% Tween-20) overnight at 4°C, incubated 1 h with mouse monoclonal anti-α-tubulin (1:1000; DM1A clone; T6199; Sigma) antibody in blocking solution, washed three times for 15 min each, incubated 1 h with secondary antibody, and washed three times for 15 min each before mounting. The secondary antibodies used were: donkey anti-rabbit AlexaFluor 488 (1:500, Invitrogen), anti-mouse AlexaFluor 555 (1:500, Invitrogen), anti-mouse AlexaFluor 594 (1:500, Invitrogen), anti-mouse AlexaFluor 647 (1:500, Invitrogen) and anti-rat AlexaFluor 647 (1:500, Invitrogen). To test HMGA1 competition for narrow DNA minor groove GV musculus oocytes were treated with 200 μM netropsin (Sigma; N9653–5MG) for 1 h prior to fixation and subsequent staining with AlexaFluor 488-conjugated anti-HMGA1 antibody (EPR7839 clone; ab204667; abcam) performed as described above.
Image acquisition
Images of liver cells were captured on an inverted fluorescence microscope (DMI6000 B; Leica) equipped with a charge-coupled device camera (ORCA AG; Hamamatsu Photonics) and a 100x, 1.4 NA oil immersion objective. Images were collected as 0.2 μm z-sections, and z-series were deconvolved using LAS-AF 3.6.0.20104 (Leica). Images of oocytes were collected as z-stacks (31 or 41 slices) at 0.5-μm intervals to visualize the entire meiotic spindle, using a confocal microscope (DMI4000B; Leica) equipped with a 63× 1.3 NA glycerol-immersion objective lens, an xy piezo Z stage (Applied Scientific Instrumentation), a spinning disk (Yokogawa Corporation of America), and an electron multiplier charge-coupled device camera (ImageEM C9100–13; Hamamatsu Photonics), controlled by MetaMorph 7.5 software (Molecular Devices). Excitation was done with a Vortran Stradus VersaLase 4 laser module with 405-, 488-, 561-, and 639-nm lasers (Vortran Laser Technology). Panels of microscopic images were prepared using ImageJ 1.53t software73. Oocytes extruding polar bodies were imaged using transmitted light with a Nikon Eclipse TE2000-U inverted light microscope equipped with a 10x objective using 1.5x magnification, RS RoperScientific 7360–0001 camera and MetaMorph 7.5 software (Molecular Devices).
Image analysis
To quantify relative HMGA1 intensity at pericentromeres in musculus, spretus and hybrid bivalents, sum intensity projections were used. Circular 6 pixel diameter regions were drawn to measure intensities at major (musculus) or minor (spretus) satellite and the nearby cytoplasm. Mean HMGA1 background intensity (cytoplasm) was subtracted from the mean HMGA1 intensity at pericentromeres. Values were obtained for ten randomly selected, non-overlapping hybrid bivalents for each cell. HMGA1 depletion efficiency was calculated based on maximum projection images. A DAPI-based mask was created for each image using identical intensity threshold for control or HMGA1-depleted cells and ImageJ 1.53t software plug-in Analyze Particles (size 3-inifinity; circularity 0.00–3.00). Mean HMGA1 intensity within the mask was measured, and a 50 × 50-pixel box drawn at the cell periphery was used to subtract cytoplasmic background. HMGA1 intensity at chromocenters in control and netropsin-treated musculus oocytes was calculated using custom-size circular ROIs based on mean intensity projection of each chromocenter. First, mean cytoplasmic HMGA1 signal (background) was subtracted from mean chromocenter HMGA1 signal and mean non-chromocenter chromatin HMGA1 signal. Second, intensity ratio of chromocenter HMGA1 signal over non-chromocenter chromatin HMGA1 signal was computed. Pericentromere length in musculus and hybrid oocytes was measured by connecting chromosome arms and the nearest kinetochore signal linked by a thread of major (musculus) or minor (spretus) satellite based on maximum projection images. Due to poor kinetochore staining, pericentromeric length in spretus oocytes was measured as the longest axis of the minor satellite signal based on maximum projection images. The ratio of major to minor satellite length was reported to estimate relative stretching of musculus and spretus pericentromeres. To measure kinetochore size in oocytes, circular 5 pixel diameter regions were drawn, and mean Hec1 intensities were calculated and correcting for local cytoplasmic background based on sum intensity projection images. Intensities for eight randomly selected distinct kinetochores were obtained for each cell, and mean intensity was calculated for each cell. Kinetochore clustering in oocytes was calculated using the Analyze Particles ImageJ plug-in (size 3-inifinity; circularity 0.00–1.00) based on maximum intensity projection images. Aster eccentricity in oocytes arrested with 10 μM STLC (S-trityl-L-cysteine; 164739; Sigma) was measured using a modified MTAster pipeline (CellProfiler v2.1.1.76). Briefly, maximum intensity projection images were used to identify microtubule asters as objects of 80–500 pixels in diameter. Objects outside the diameter or adjacent to the border of the image were discarded. The threshold strategy and method were “Adaptive” and “Otsu” respectively, with two-class thresholding, weighted variance, smoothing method selected automatically and correction factor 4.0. The lower and upper bounds on the threshold were 0.0 and 1.0. Image size was used to calculate adaptive window size. The remaining parameters were left unchanged. Kinetochore-microtubule attachment stability in hybrid oocytes was measured by quantifying Mad1 intensity at kinetochores using the automated Python-built Centrocalc tool77. Briefly, kinetochores were identified automatically as spots of 150 nm radius, and local maxima were found using Hec1 signal. Up to 38 spots were selected, separated by a minimum two pixels, and 3D ellipsoid regions of 4 × 4 × 3 pixels were drawn. Hec1 and Mad1 intensities are calculated as mean greyscale pixel values corrected for local cytoplasmic background. Each kinetochore was manually assigned as musculus or spretus based on the size of minor satellite signal. Mean intensity was calculated for each species per cell. Only spots associated with a minor satellite signal were analyzed.
Statistics
All experiments have been done in two to three independent biological replicates with the exact sample sizes listed in the figure legends. The analyses were performed using Microsoft Excel and GraphPad Prism 10. All graphs were generated in GraphPad Prism 10. Two-tailed t-test and one-way ANOVA test were used for analyzing data following a normal distribution. Two-tailed Mann-Whitney and Kruskal-Wallis tests were used to analyze data that do not follow a normal distribution. Corrections for comparing multiple variables and exact P values were listed in figure legends. Sample size choice was dictated by the ability to derive meaningful statistics, typically by selecting at least 10 oocytes/liver cells for each condition per experiment. The investigators were not blinded for data collection and quantification because the phenotypic changes were visibly distinguishable for analyzed conditions. Cells analyzed were selected at random.
Extended Data
Extended Data Fig. 1: Musculus and spretus harbor different amounts of major and minor satellites.
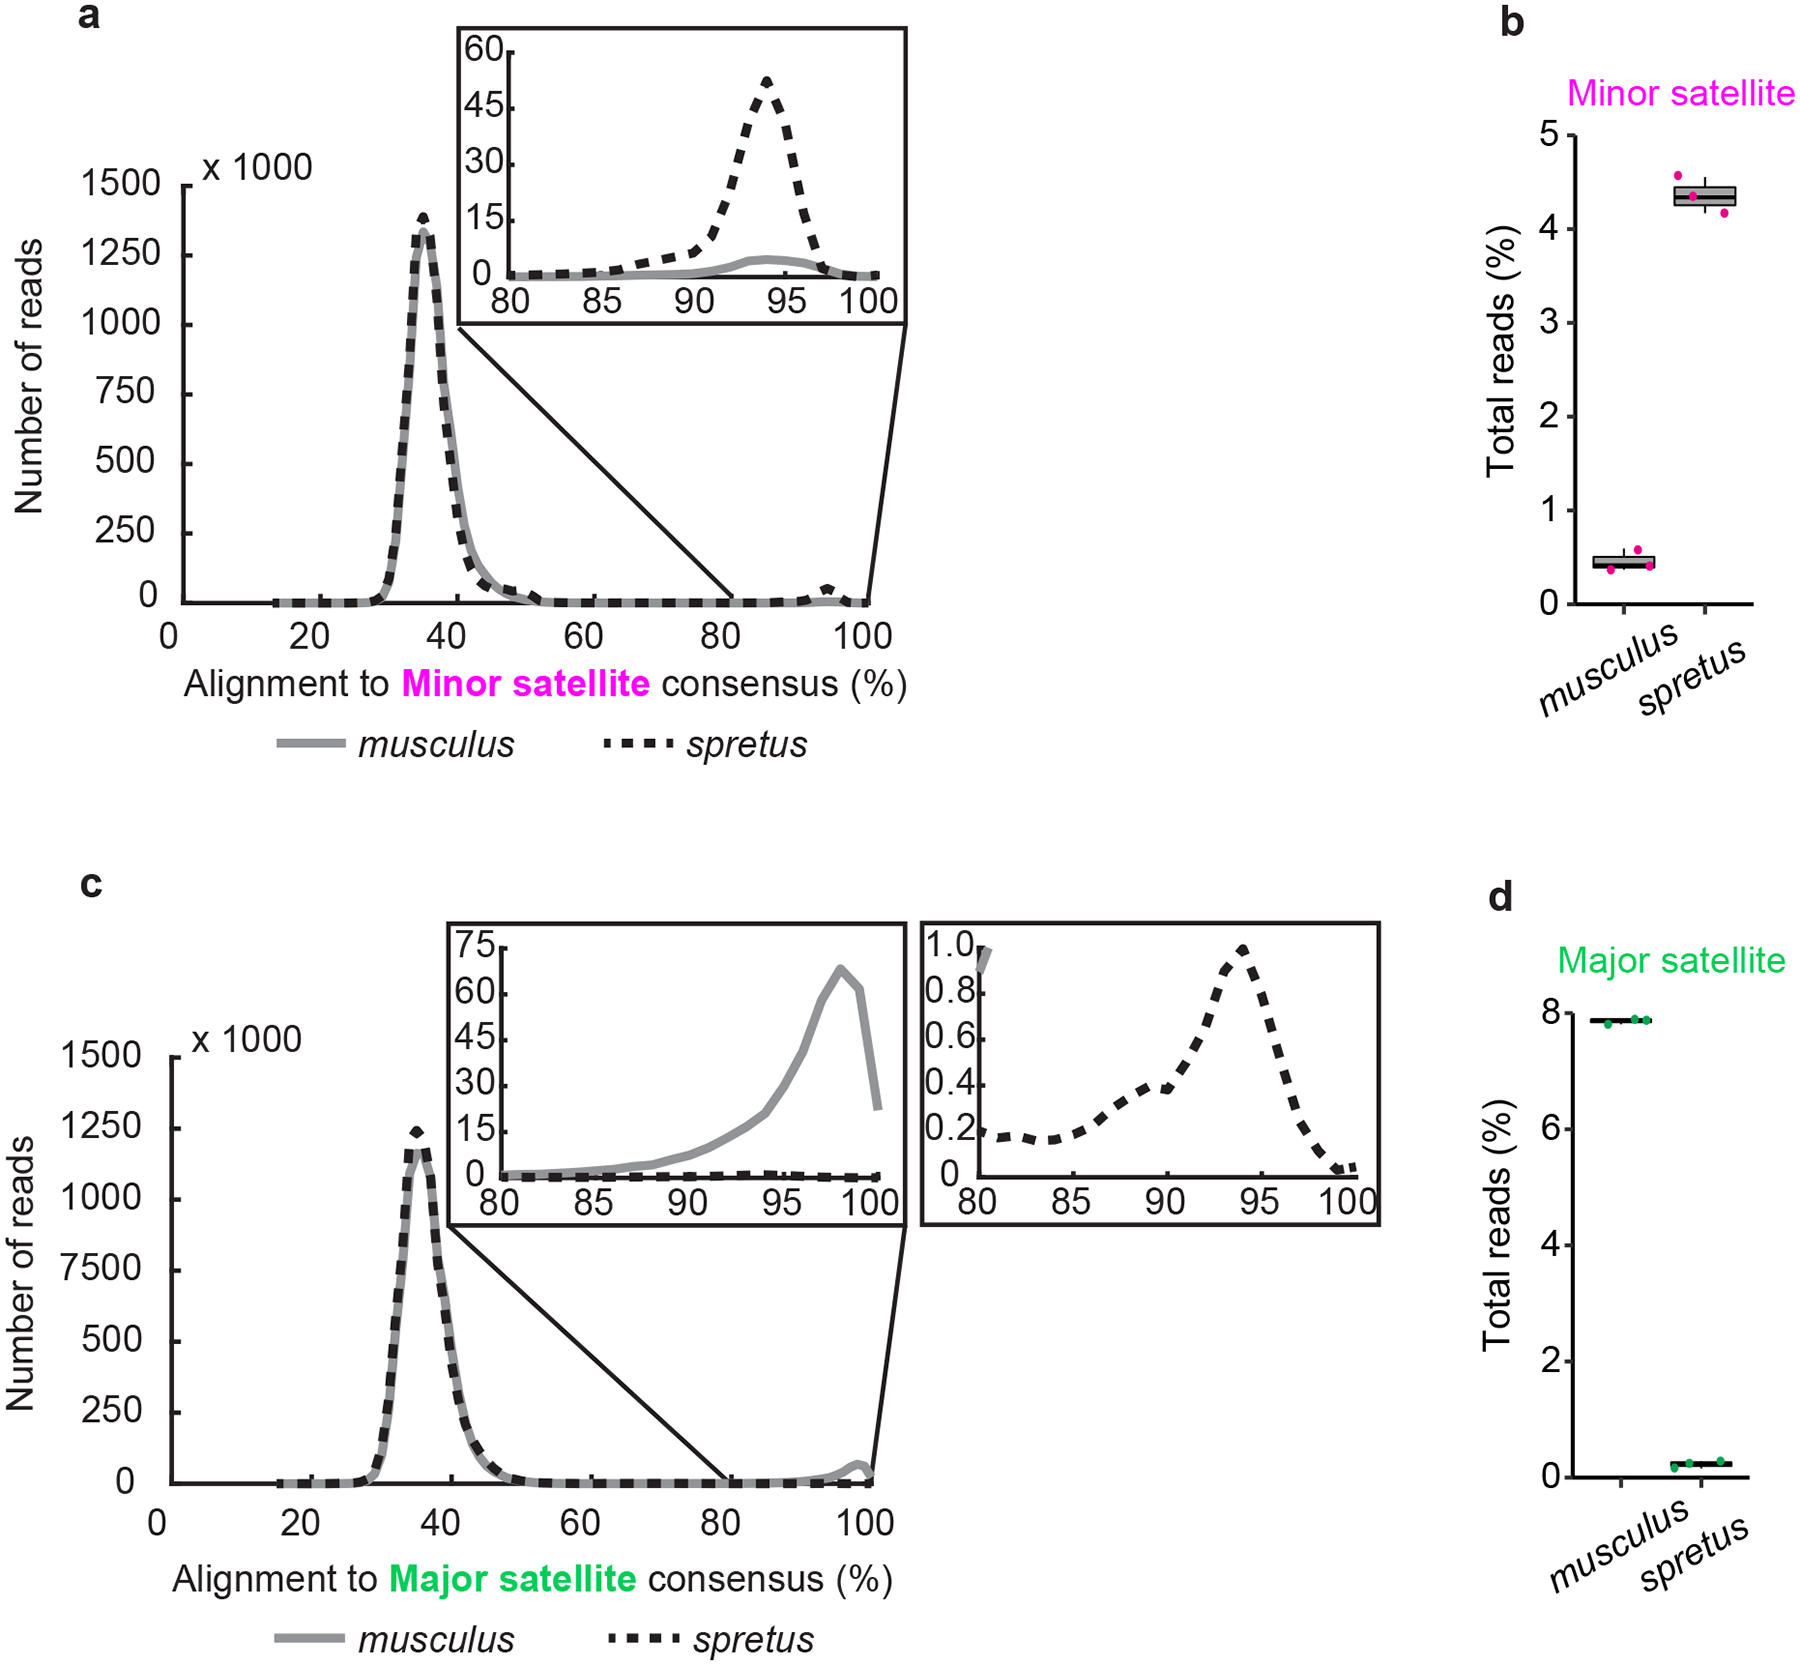
a-d, High-throughput sequencing of MNase-digested spretus or musculus chromatin. Reads were aligned to a trimer of minor satellite (a,b) or a dimer of major satellite (c,d) consensus sequences (see Methods). Histograms show distribution of reads aligning to minor (a) or major (c) satellite, with 80–100% range expanded in insets. The percent of reads that aligned with ≥ 80% identity to minor (b) or major (d) satellite is plotted as a Tukey box and whiskers plot (N=3 independent experiments). Boxplots indicate median, 25th and 75th percentiles (hinges), smallest and largest value at most 1.5 * interquartile range of the hinge (whiskers).
Extended Data Fig. 2: Musculus and spretus pericentromeric satellites differ in AT-rich tetranucleotides and frequencies of contiguous A/Ts.
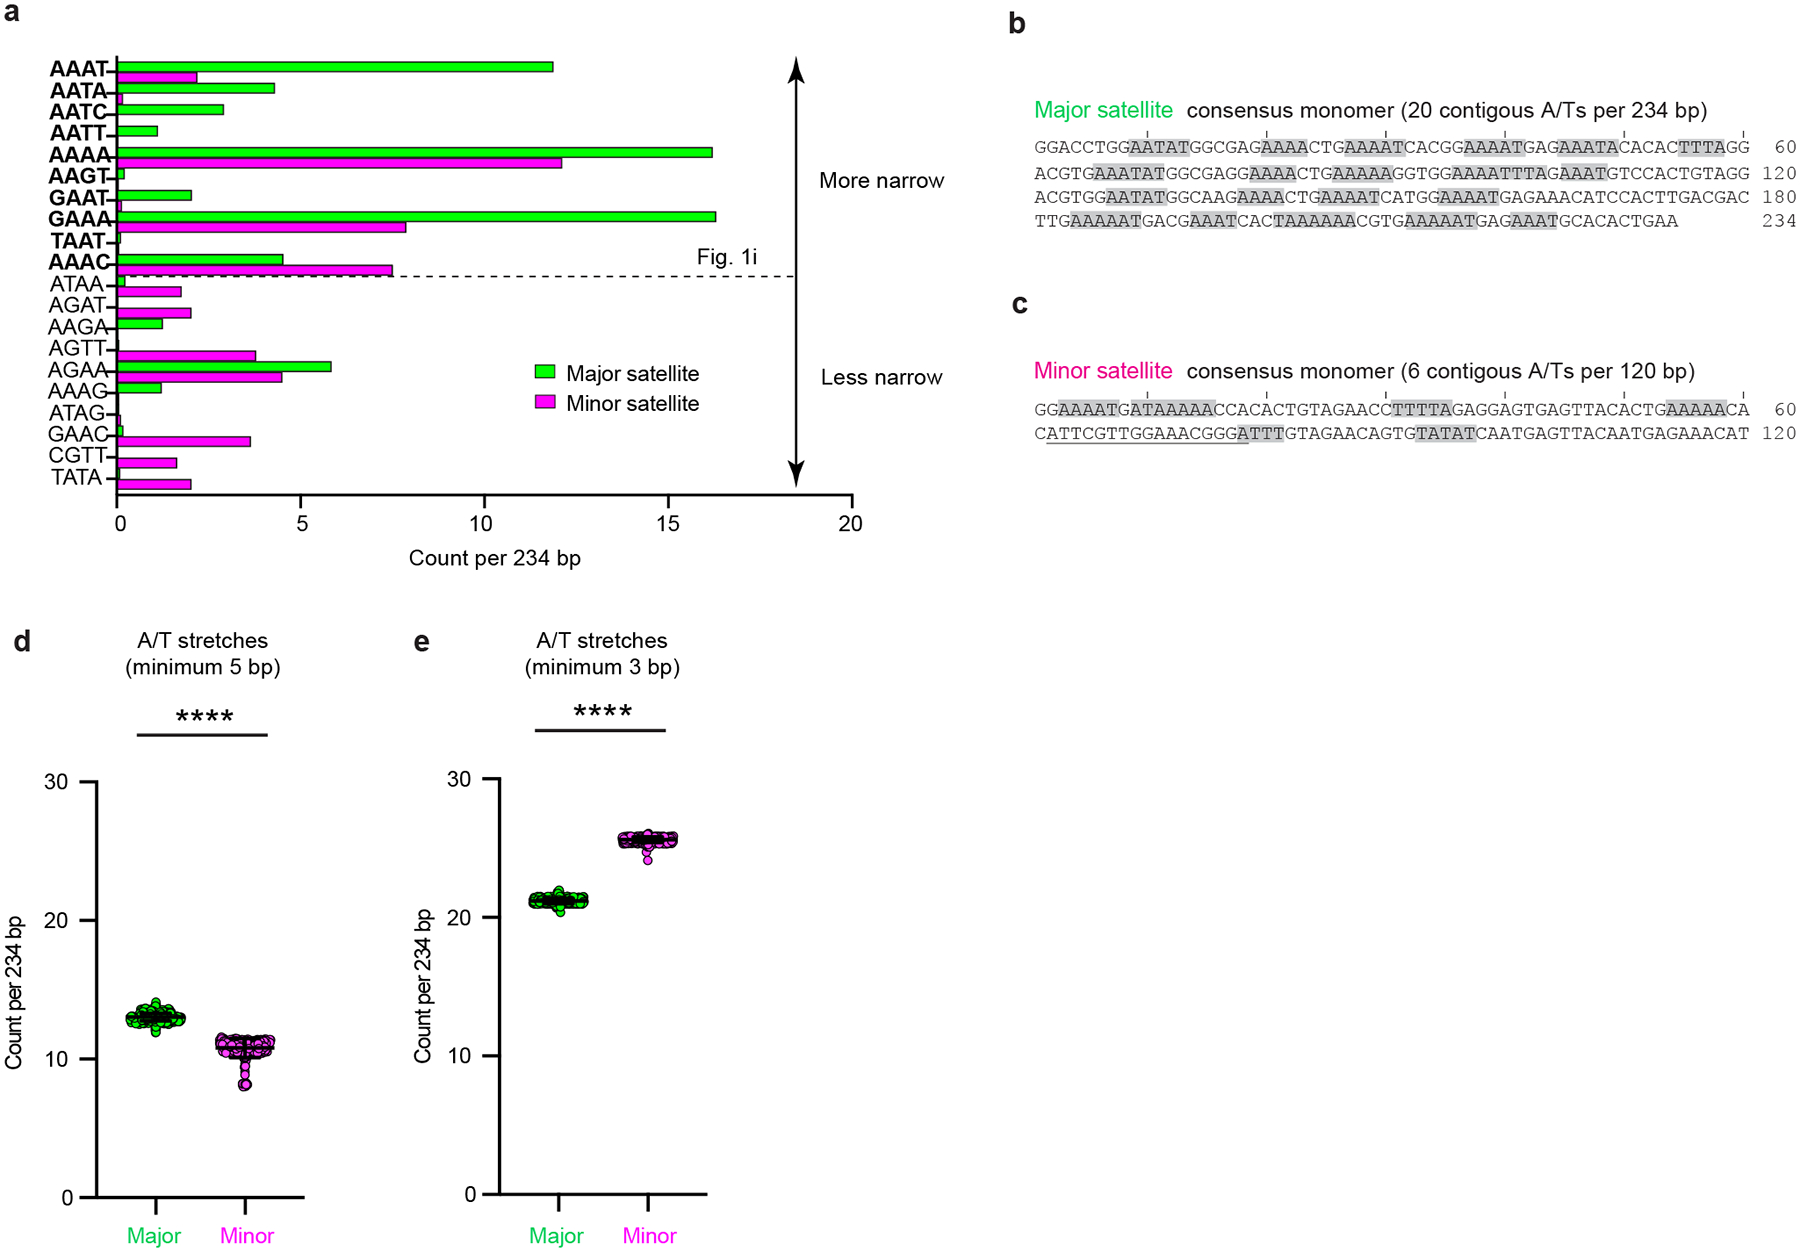
a, Number of AT-rich tetranucleotides associated with narrow DNA minor groove35 per length of a single major satellite repeat (234 bp) averaged from 500 musculus major or minor satellite arrays. Note that the ten tetranucleotides with narrowest minor grooves (top, bold) are counted along representative arrays in Fig. 1i. b,c, Major (b) or minor (c) satellite consensus monomer sequences with stretches of 4 or more consecutive A/Ts shaded in grey; the 17-bp CENP-B box is underlined. d,e, Number of minimum 5 bp- (d) or 3 bp-long (e) contiguous A/T stretches in major or minor satellite arrays per 234 bp length of a single major satellite repeat). Mean and standard deviation indicated, n=500 arrays; two-tailed Mann-Whitney test, **** P<0.0001.
Extended Data Fig. 3: HMGA1 competes with netropsin for binding to major satellite.
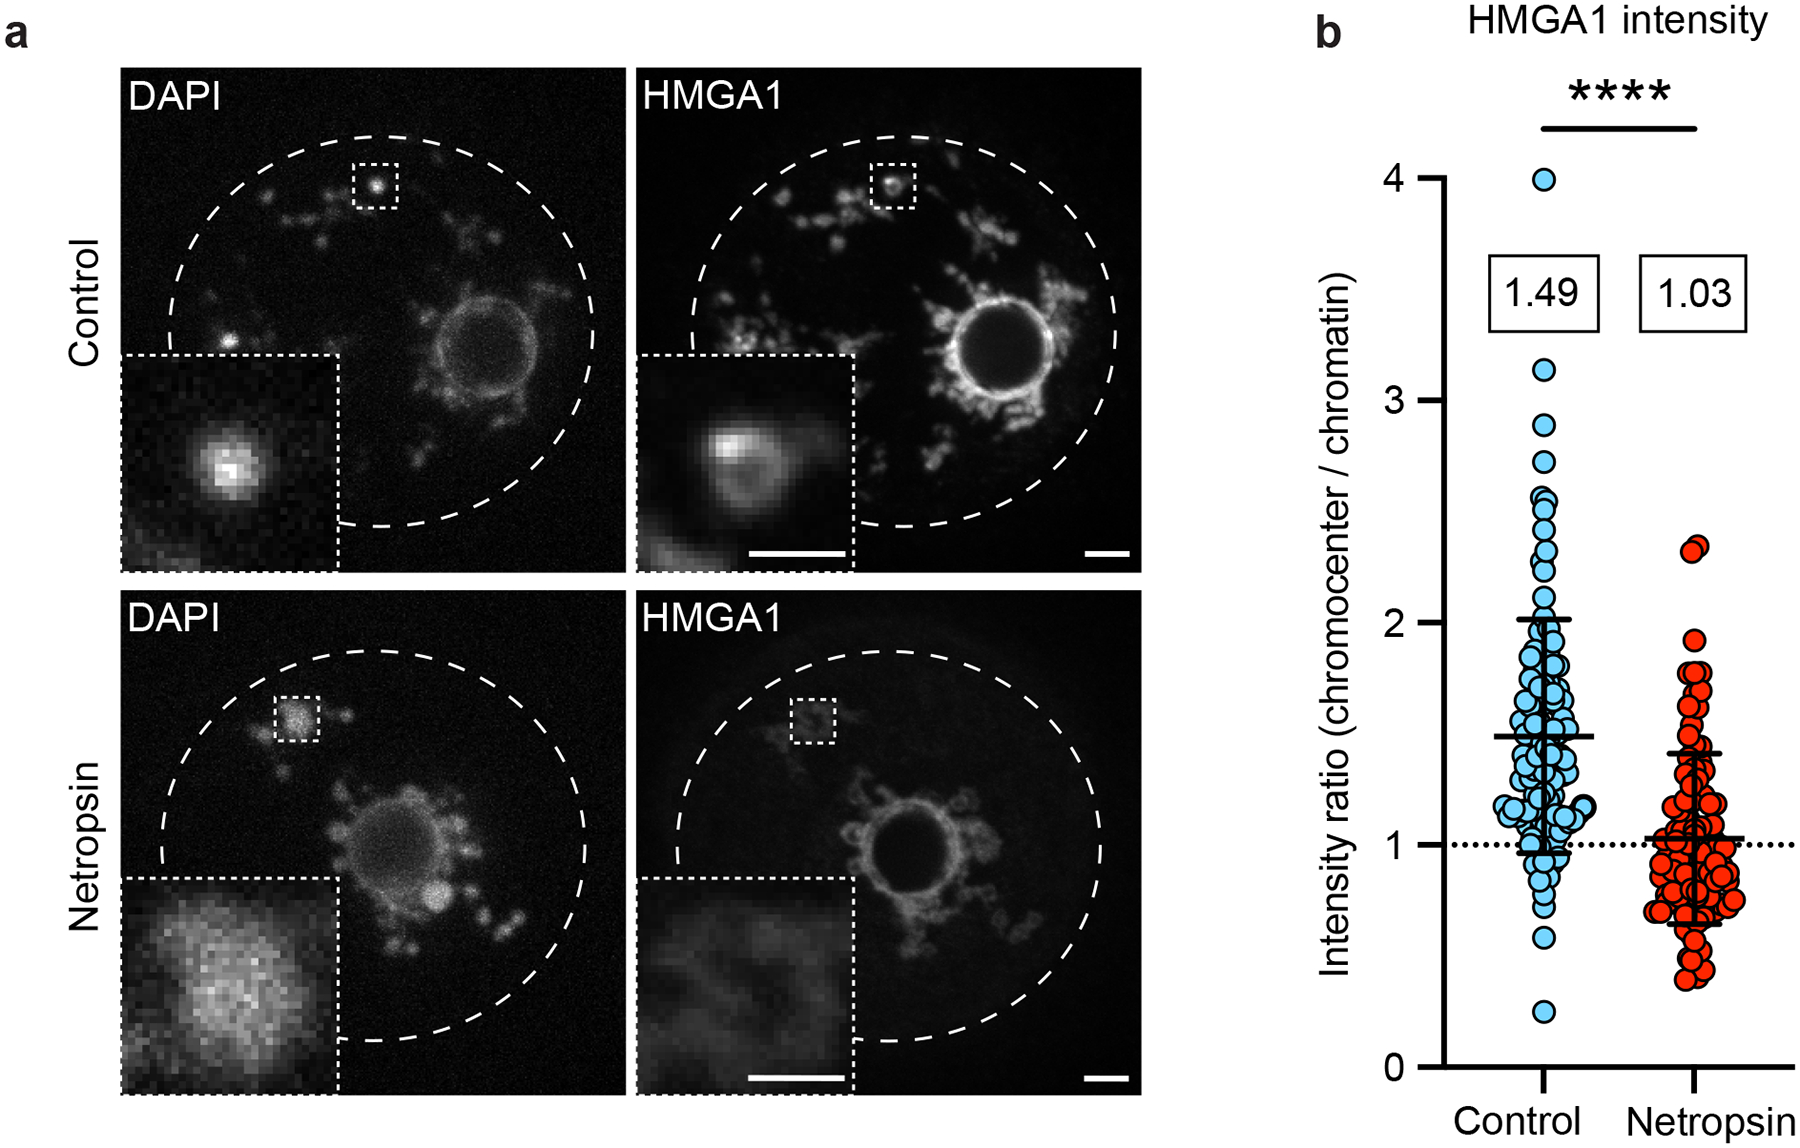
a,b, Control or netropsin-treated musculus oocytes were fixed in GV stage and stained for DNA (DAPI) and HMGA1 (a). Scale bars 5 μm or 2 μm (insets). The ratio of HMGA1 signal at chromocenters to non-chromocenter chromatin was quantified (b). Mean and standard deviation indicated, means shown in boxes, n=40 (control) and 30 (netropsin) oocytes from 3 independent experiments, with an average of 3 chromocenters measured in each oocyte; two-tailed Mann-Whitney test, **** P<0.0001.
Extended Data Fig. 4: HMGA1 protein sequence is identical between musculus and spretus.
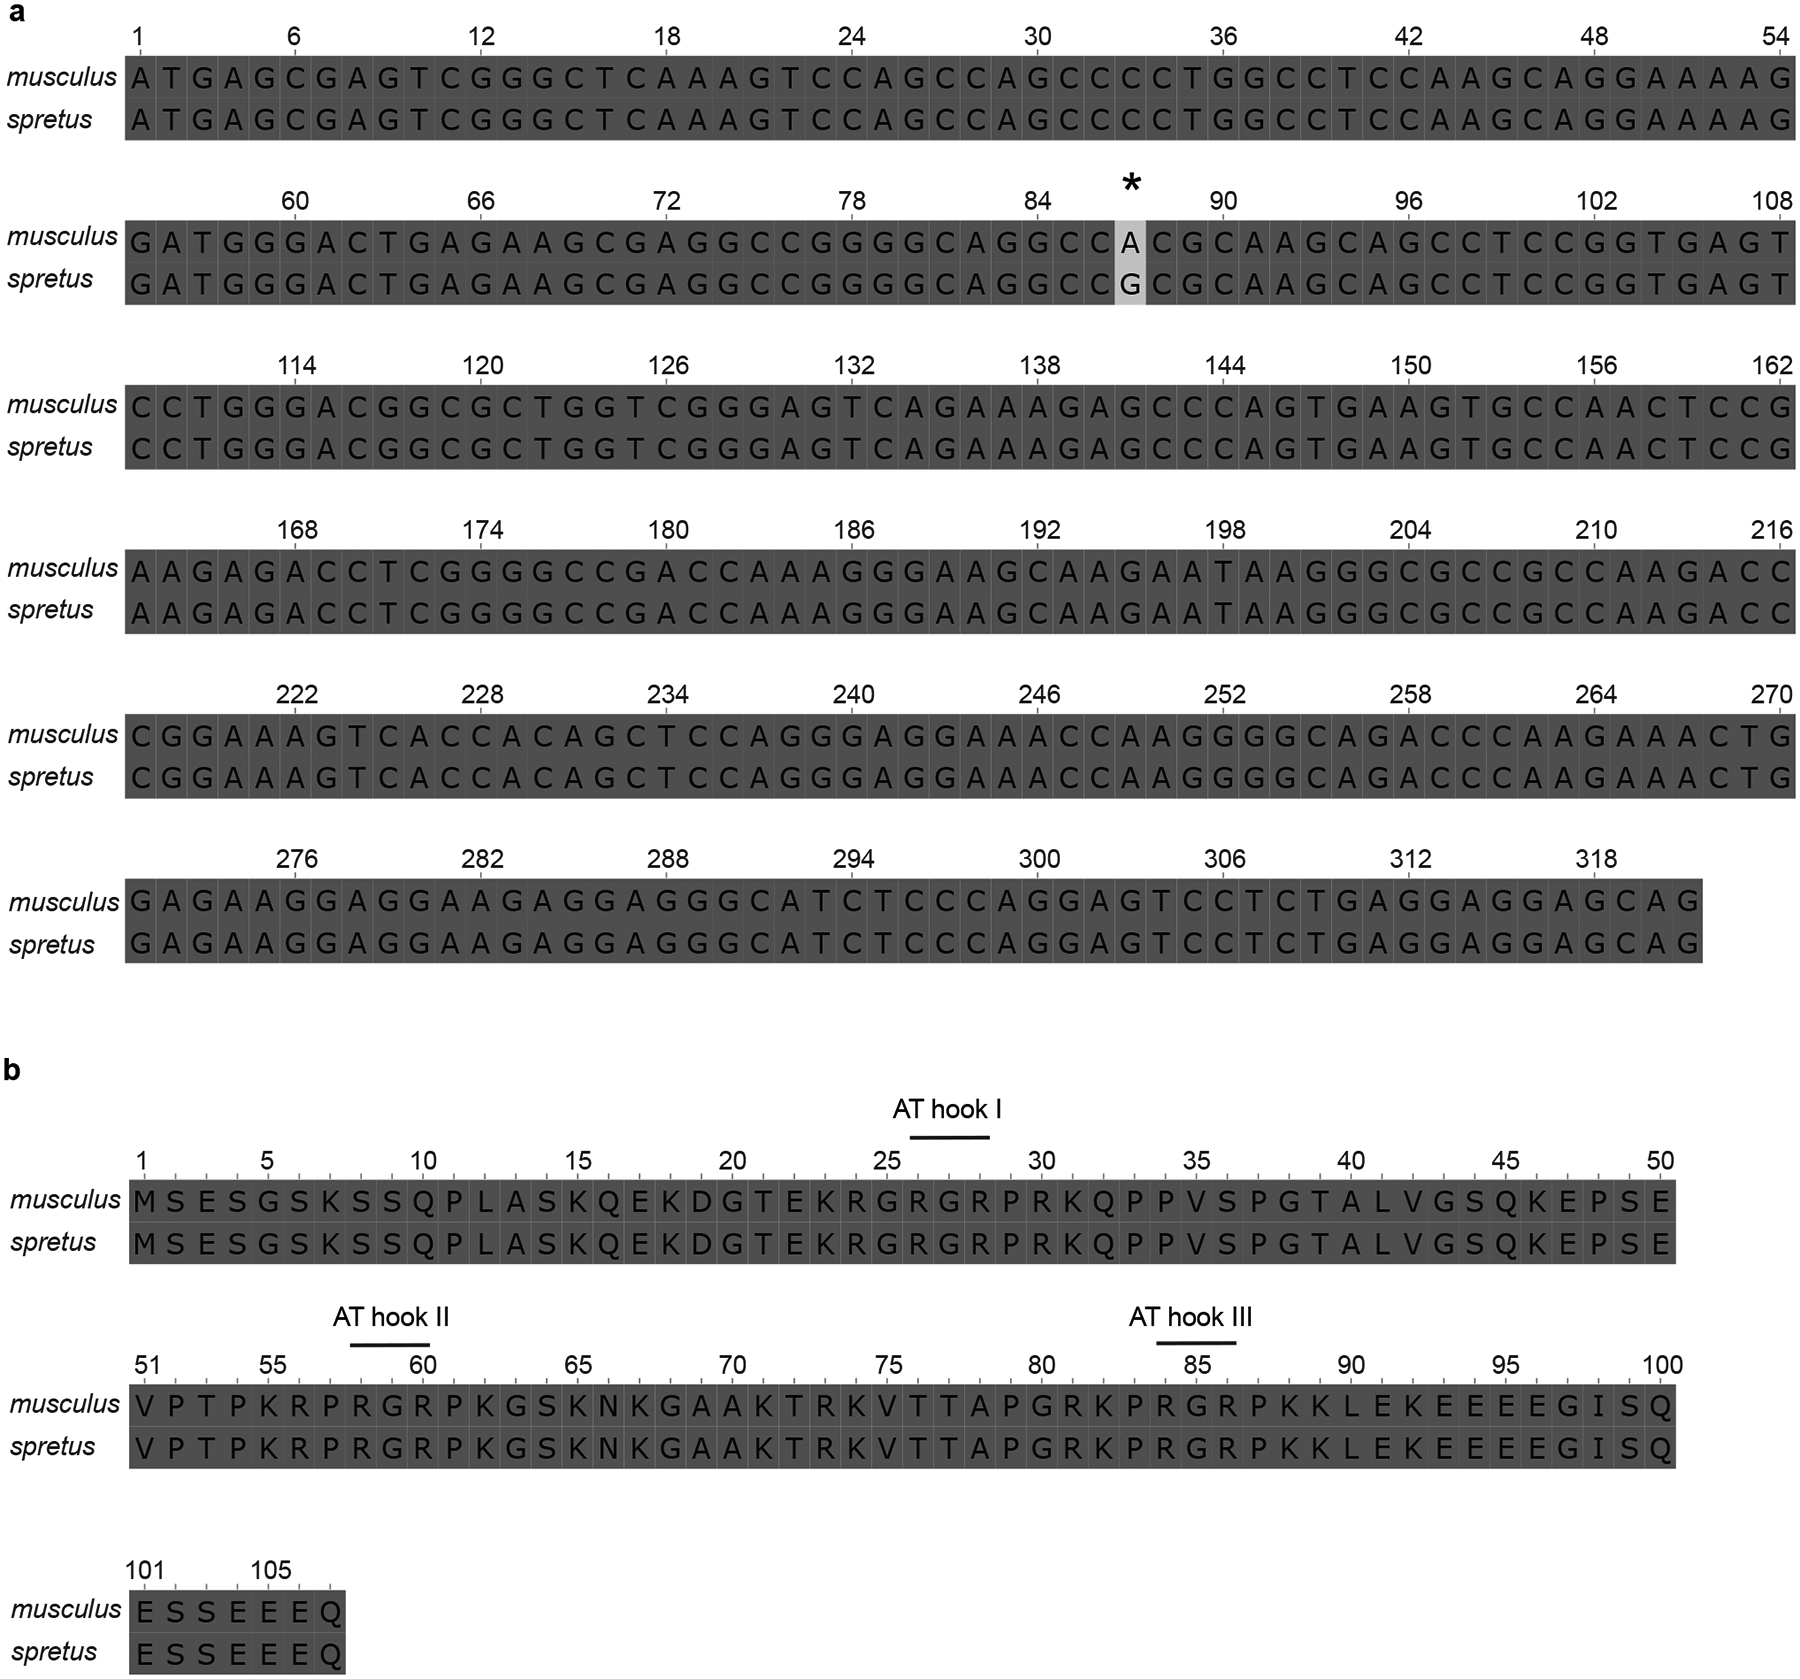
a,b, Alignment of musculus and spretus HMGA1 coding (a) and amino acid (b) sequences. Asterisk (a) marks a single synonymous substitution. AT hooks (RGR motifs) are shown (b) based on5.
Extended Data Fig. 5: Kinetochores displaced from chromosome arms remain associated with centromeric chromatin.
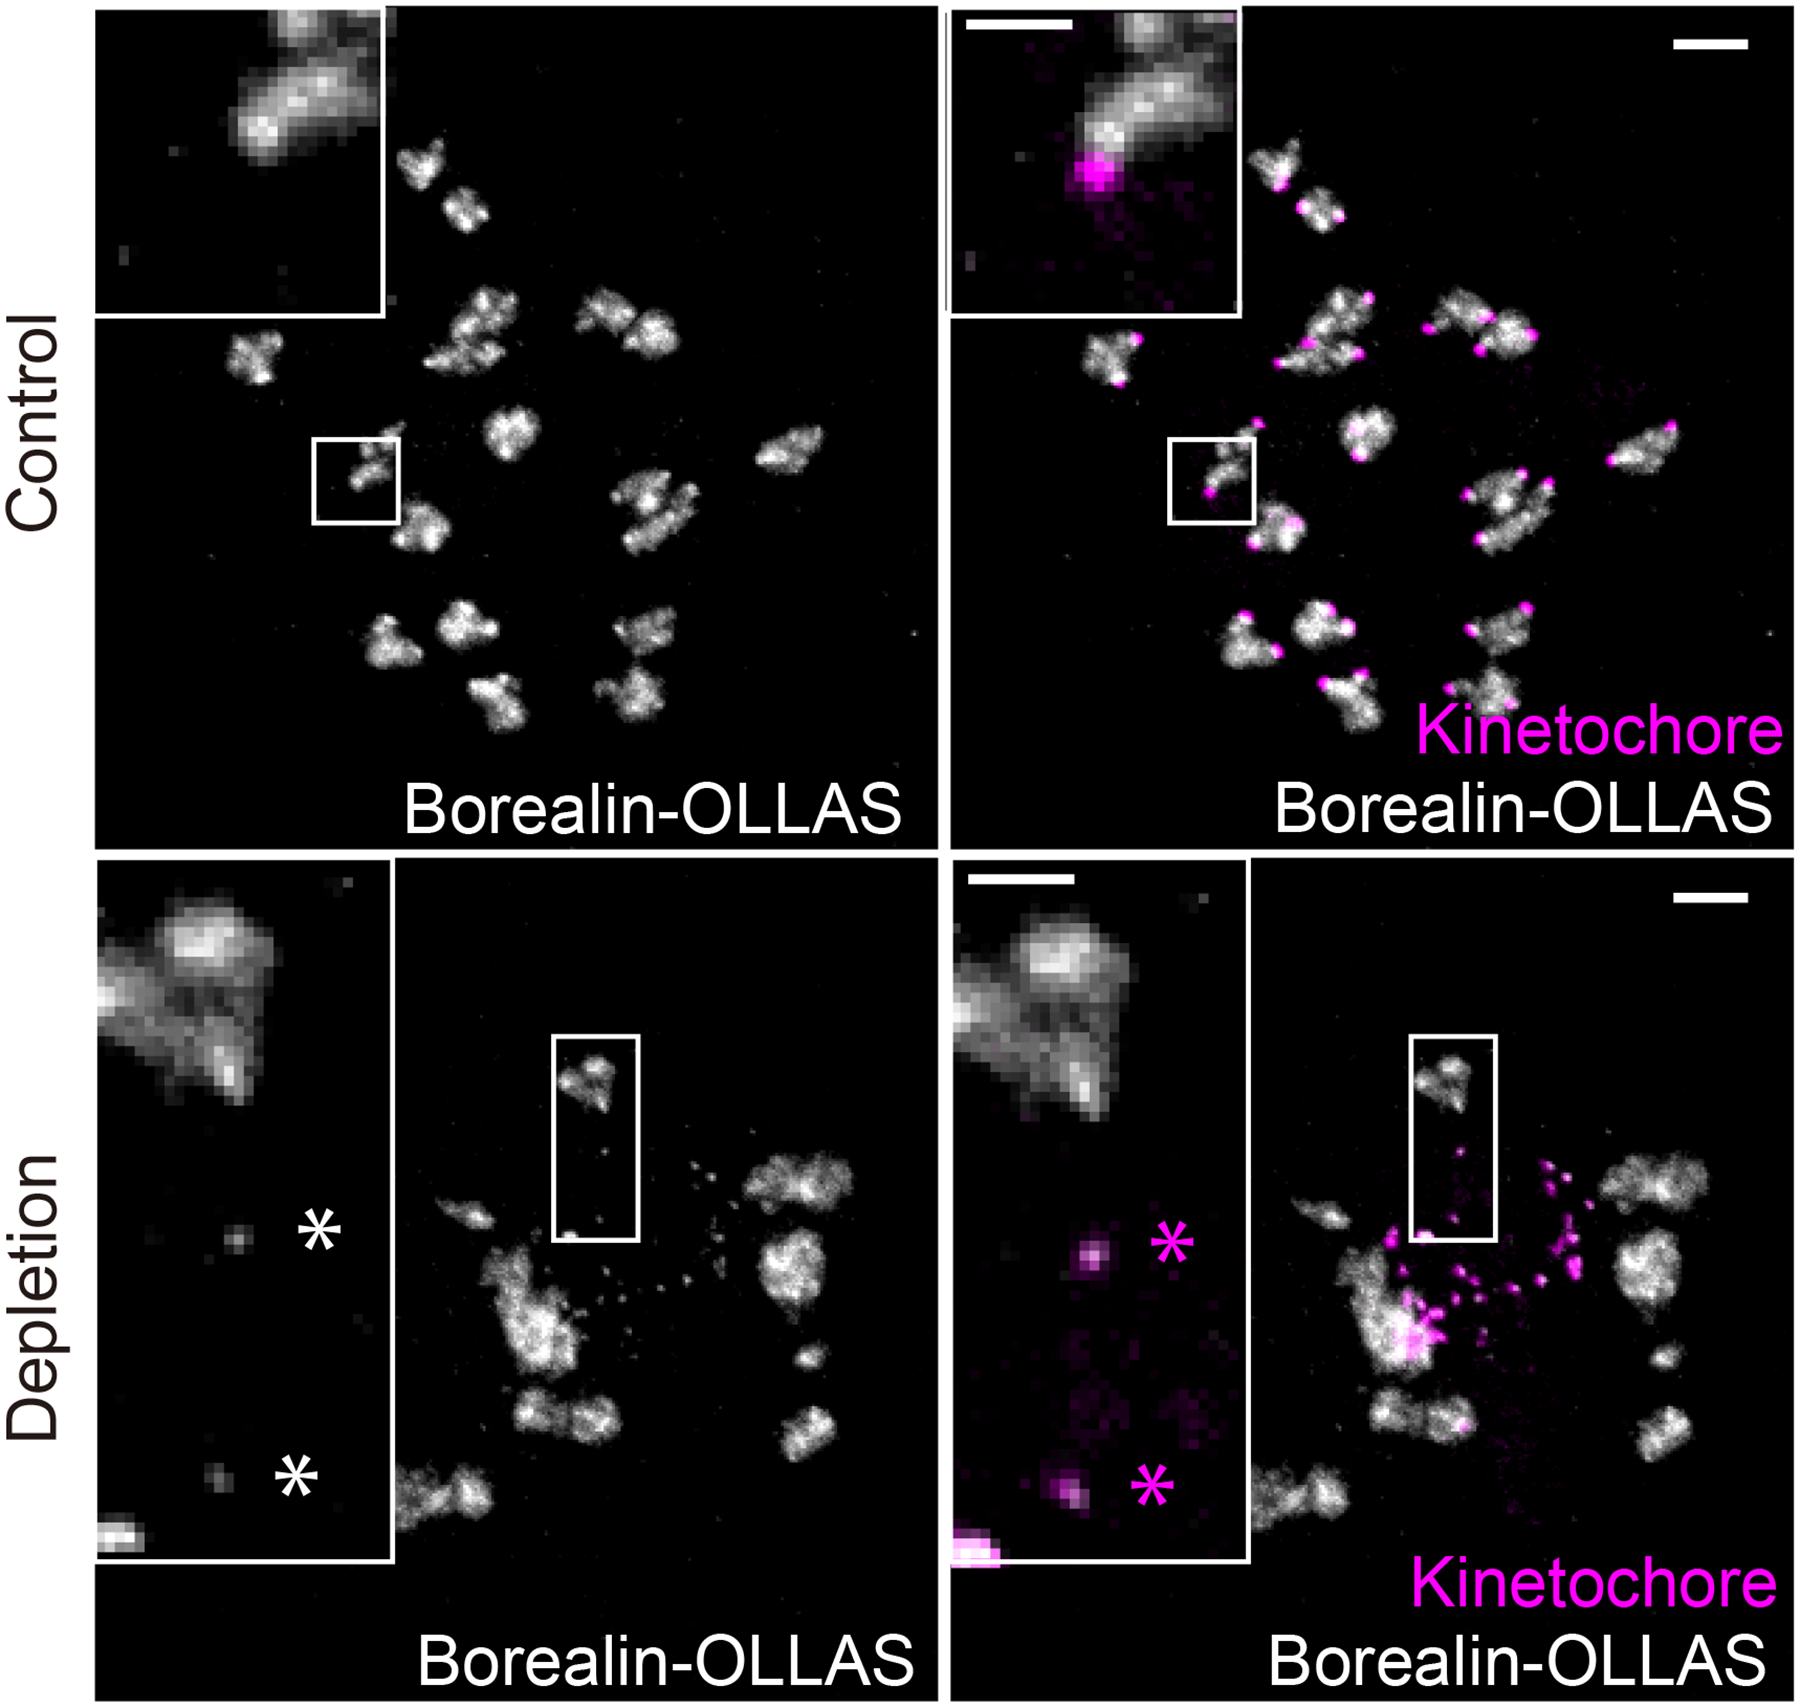
Immunofluorescence images of control or HMGA1-depleted musculus oocytes represented in Fig. 3f. Cells were expressing Borealin tagged with the OLLAS epitope to visualize centromeric chromatin. Colocalization of Hec1 (kinetochore; magenta asterisks) and centromeric Borealin-OLLAS is shown (white asterisks). Note that Borealin also localizes to bulk chromatin. Scale bars 5 μm and 2 μm (insets). 3 independent experiments showed the same result.
Extended Data Fig. 6: Microtubules mediate major satellite stretching in HMGA1-depleted oocytes.
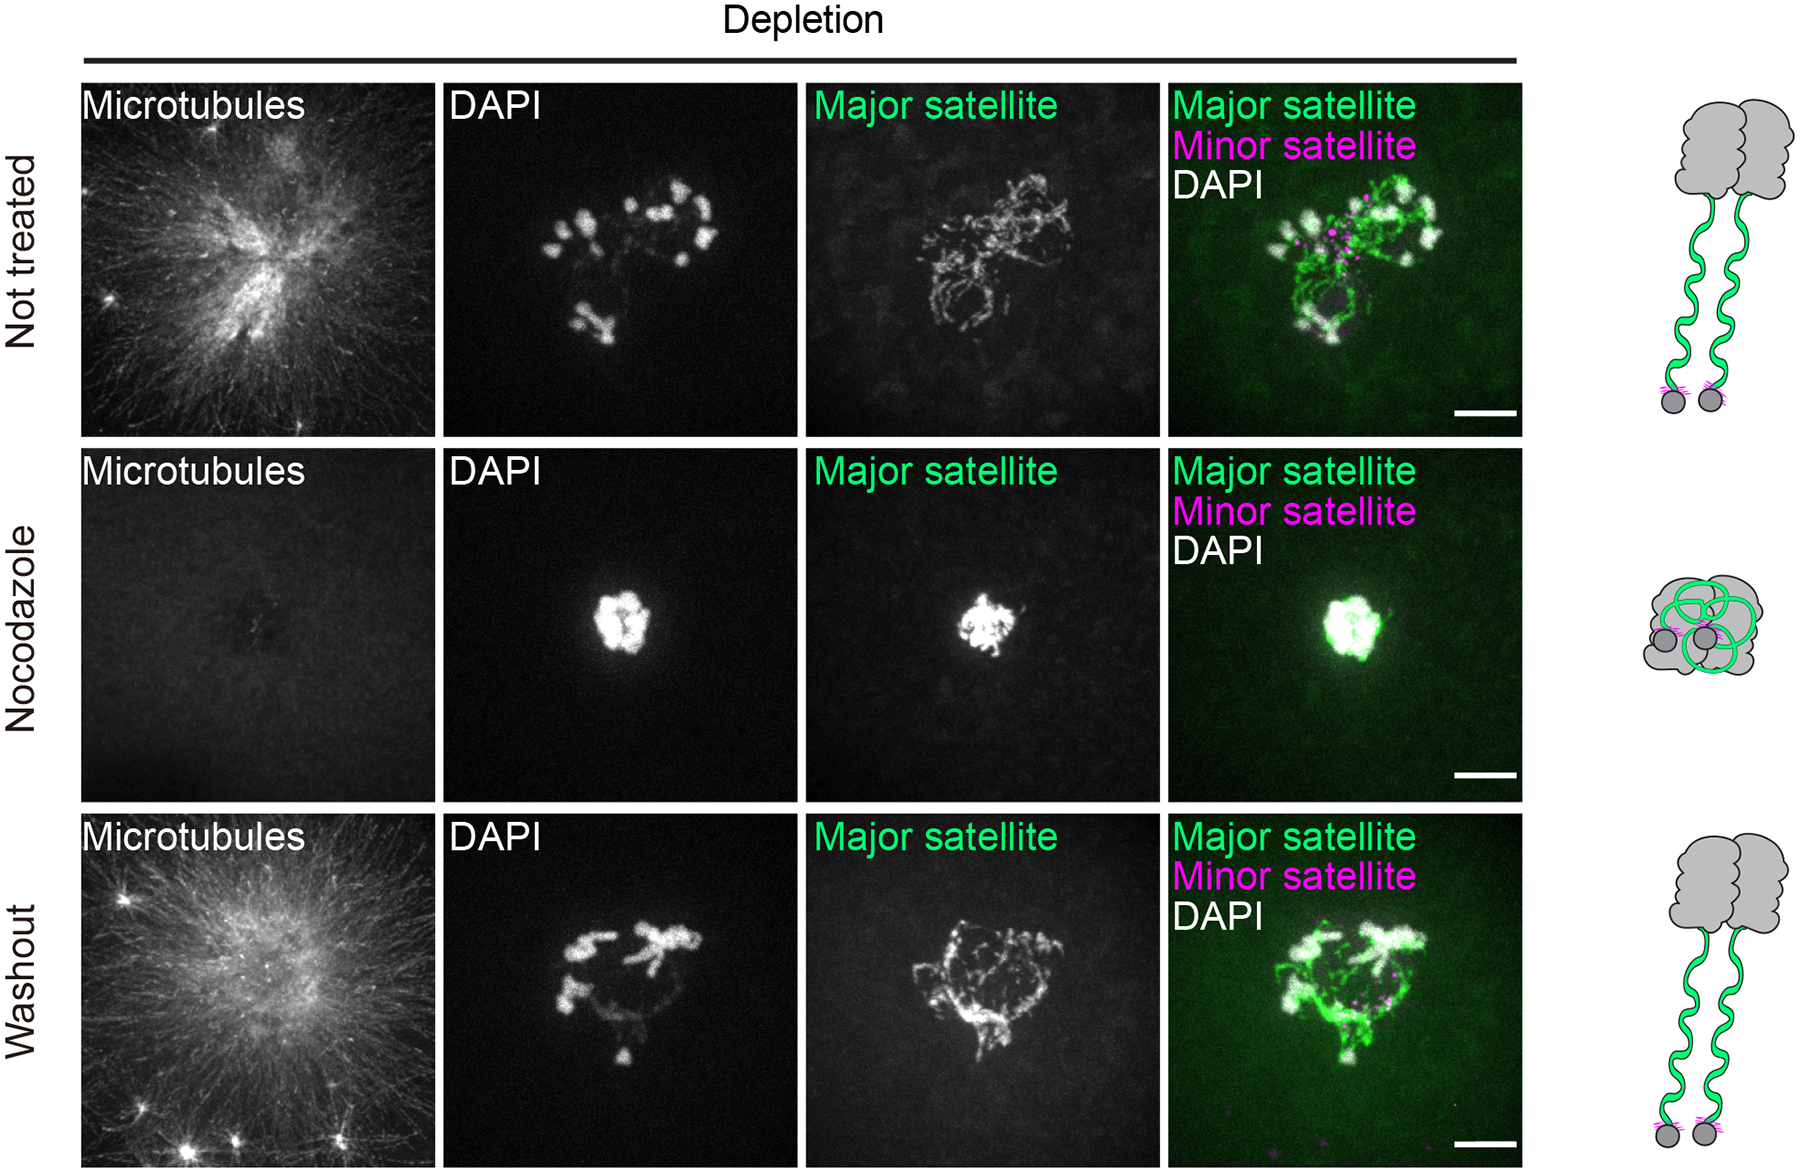
Immunofluorescence images of HMGA1-depleted musculus oocytes expressing major-satellite-targeting TALE-mClover and treated with nocodazole to depolymerize microtubules. Oocytes were fixed in early meiosis I before removing microtubules (“not treated”), during treatment (“nocodazole”), or after microtubules were allowed to regrow (“washout”). DAPI stained DNA and anti-α-tubulin antibody-stained microtubules. Scale bar 10 μm. 2 independent experiments showed the same result (17 control- and 15 nocodazole-treated oocytes). Nocodazole washout was done once in 10 oocytes, all showing the same result.
Extended Data Fig. 7: HMGA1 depletion disrupts microtubule organization.
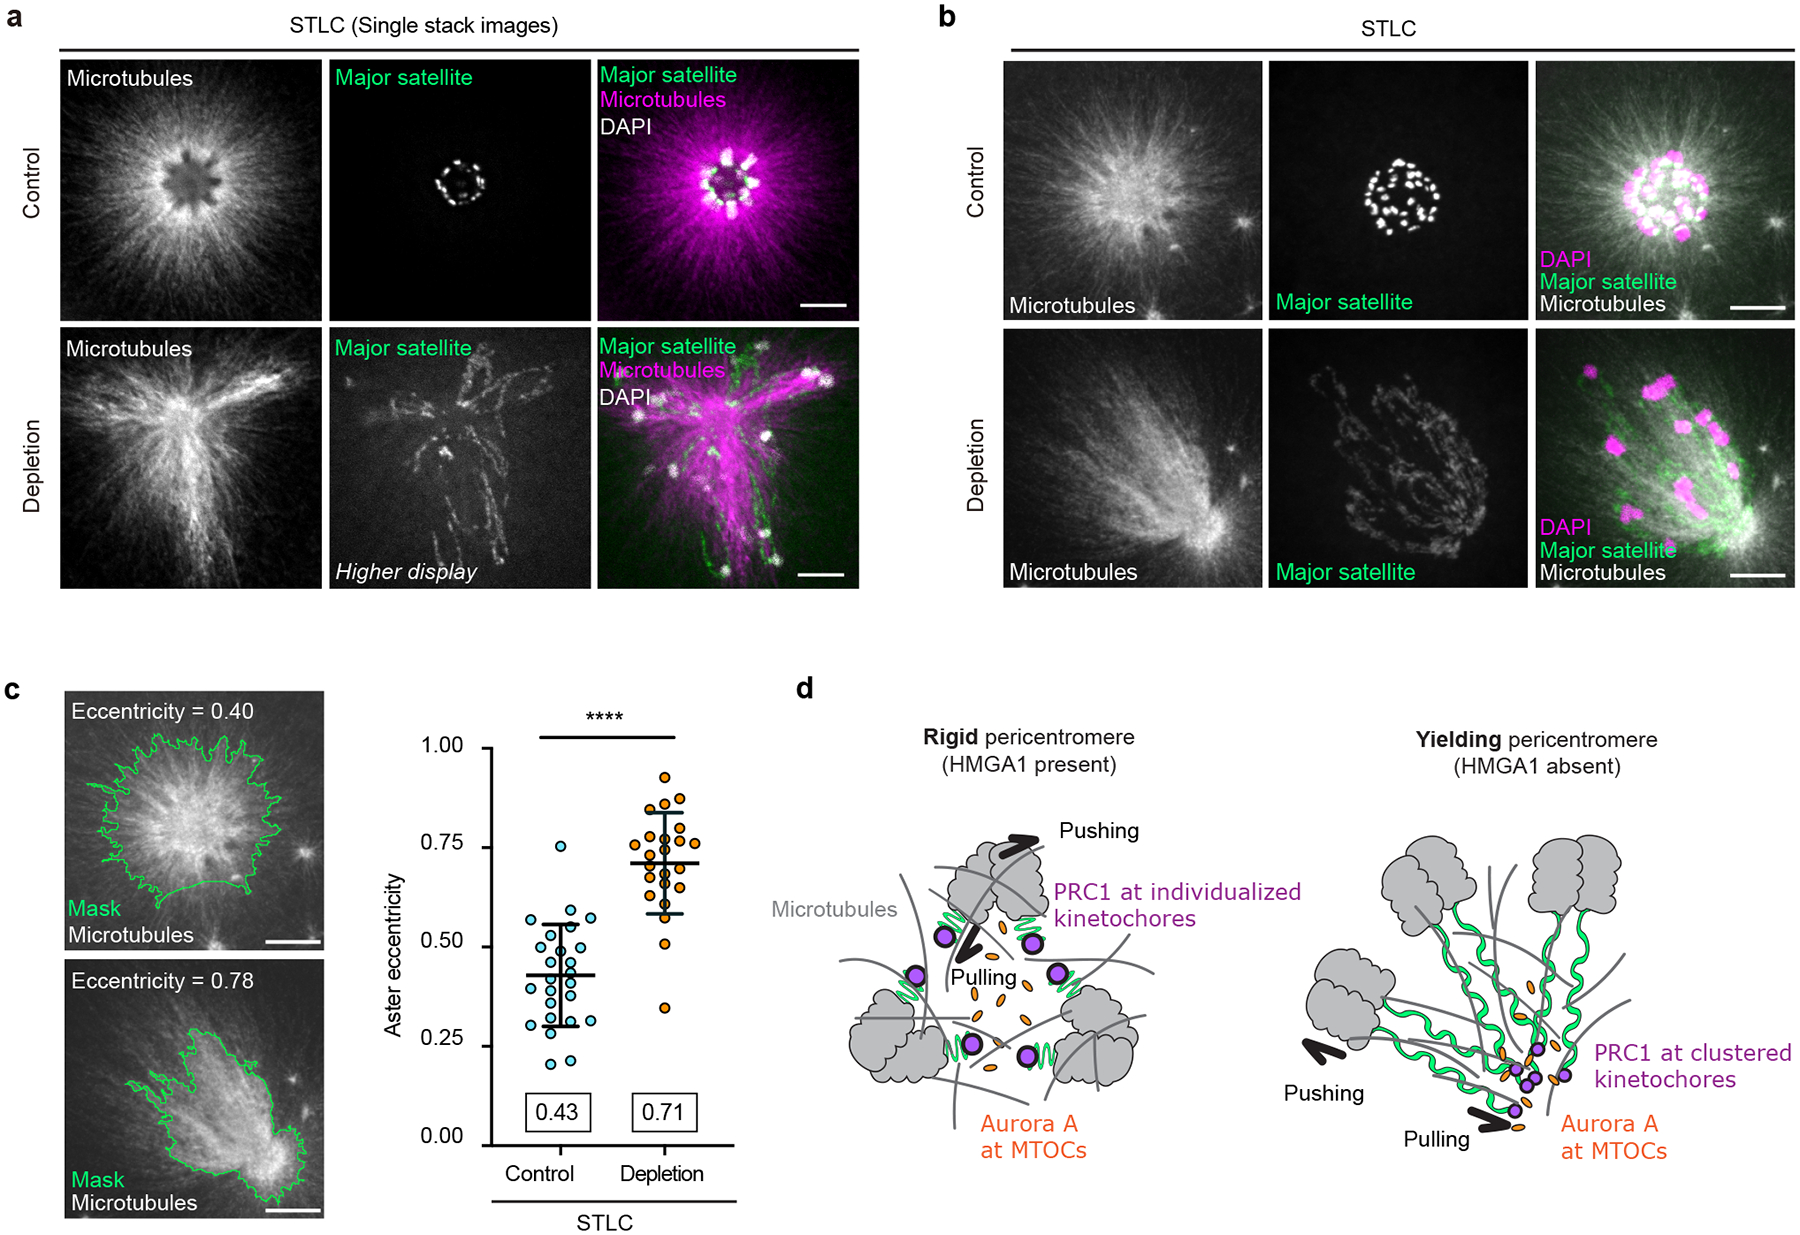
a-c, Control and HMGA1-depleted musculus oocytes expressing major satellite-targeting TALE-mClover were treated with a kinesin-5 inhibitor (STLC) in early meiosis I to arrest cells before spindle bipolarization, fixed, and stained for DNA (DAPI) and microtubules (anti-α-tubulin). 2 independent experiments showed the same result. Single z-slices (a) from confocal stacks show the concentric ring formed by chromosomes and radial symmetry of the microtubule aster in control oocytes, but lack of symmetry in HMGA1-depleted oocytes. Note that major satellite signal is enhanced in HMGA1-depleted oocyte to visualize thin threads of DNA. Maximal intensity projections (b) show the entire microtubule aster and were used to automatically generate a mask around the aster ((c), green outline) using CellProfiler (see Methods). Scale bars 10 μm. Note that A and B show different cells. For control and HMGA1-depleted musculus oocytes treated with STLC, aster eccentricity was quantified on a scale of 0 (perfect circle) to 1 (straight line) ((c), mean and standard deviation indicated, means shown in boxes, n=25 (control) and 23 (depletion) oocytes from 2 independent experiments; unpaired two-tailed t-test, **** P<0.0001). d, HMGA1 packages major satellite in musculus oocytes to withstand forces exerted by microtubules and microtubule motors that pull kinetochores toward spindle poles while pushing chromosomes away from the poles. In the absence of HMGA1, major satellite-built pericentromeres lose rigidity and yield under spindle forces, resulting in stretching, kinetochore clustering, and reduction in kinetochore size. Kinetochore clustering may destabilize microtubule attachments because of proximity to Aurora A kinase at microtubule organizing centers (orange, MTOCs). Disrupted kinetochore organization may also interfere with the oocyte spindle assembly pathway dependent on PRC1 at kinetochores (purple).
Extended Data Fig. 8: Disproportionate impact of HMGA1 depletion on packaging of musculus and spretus pericentromeres.
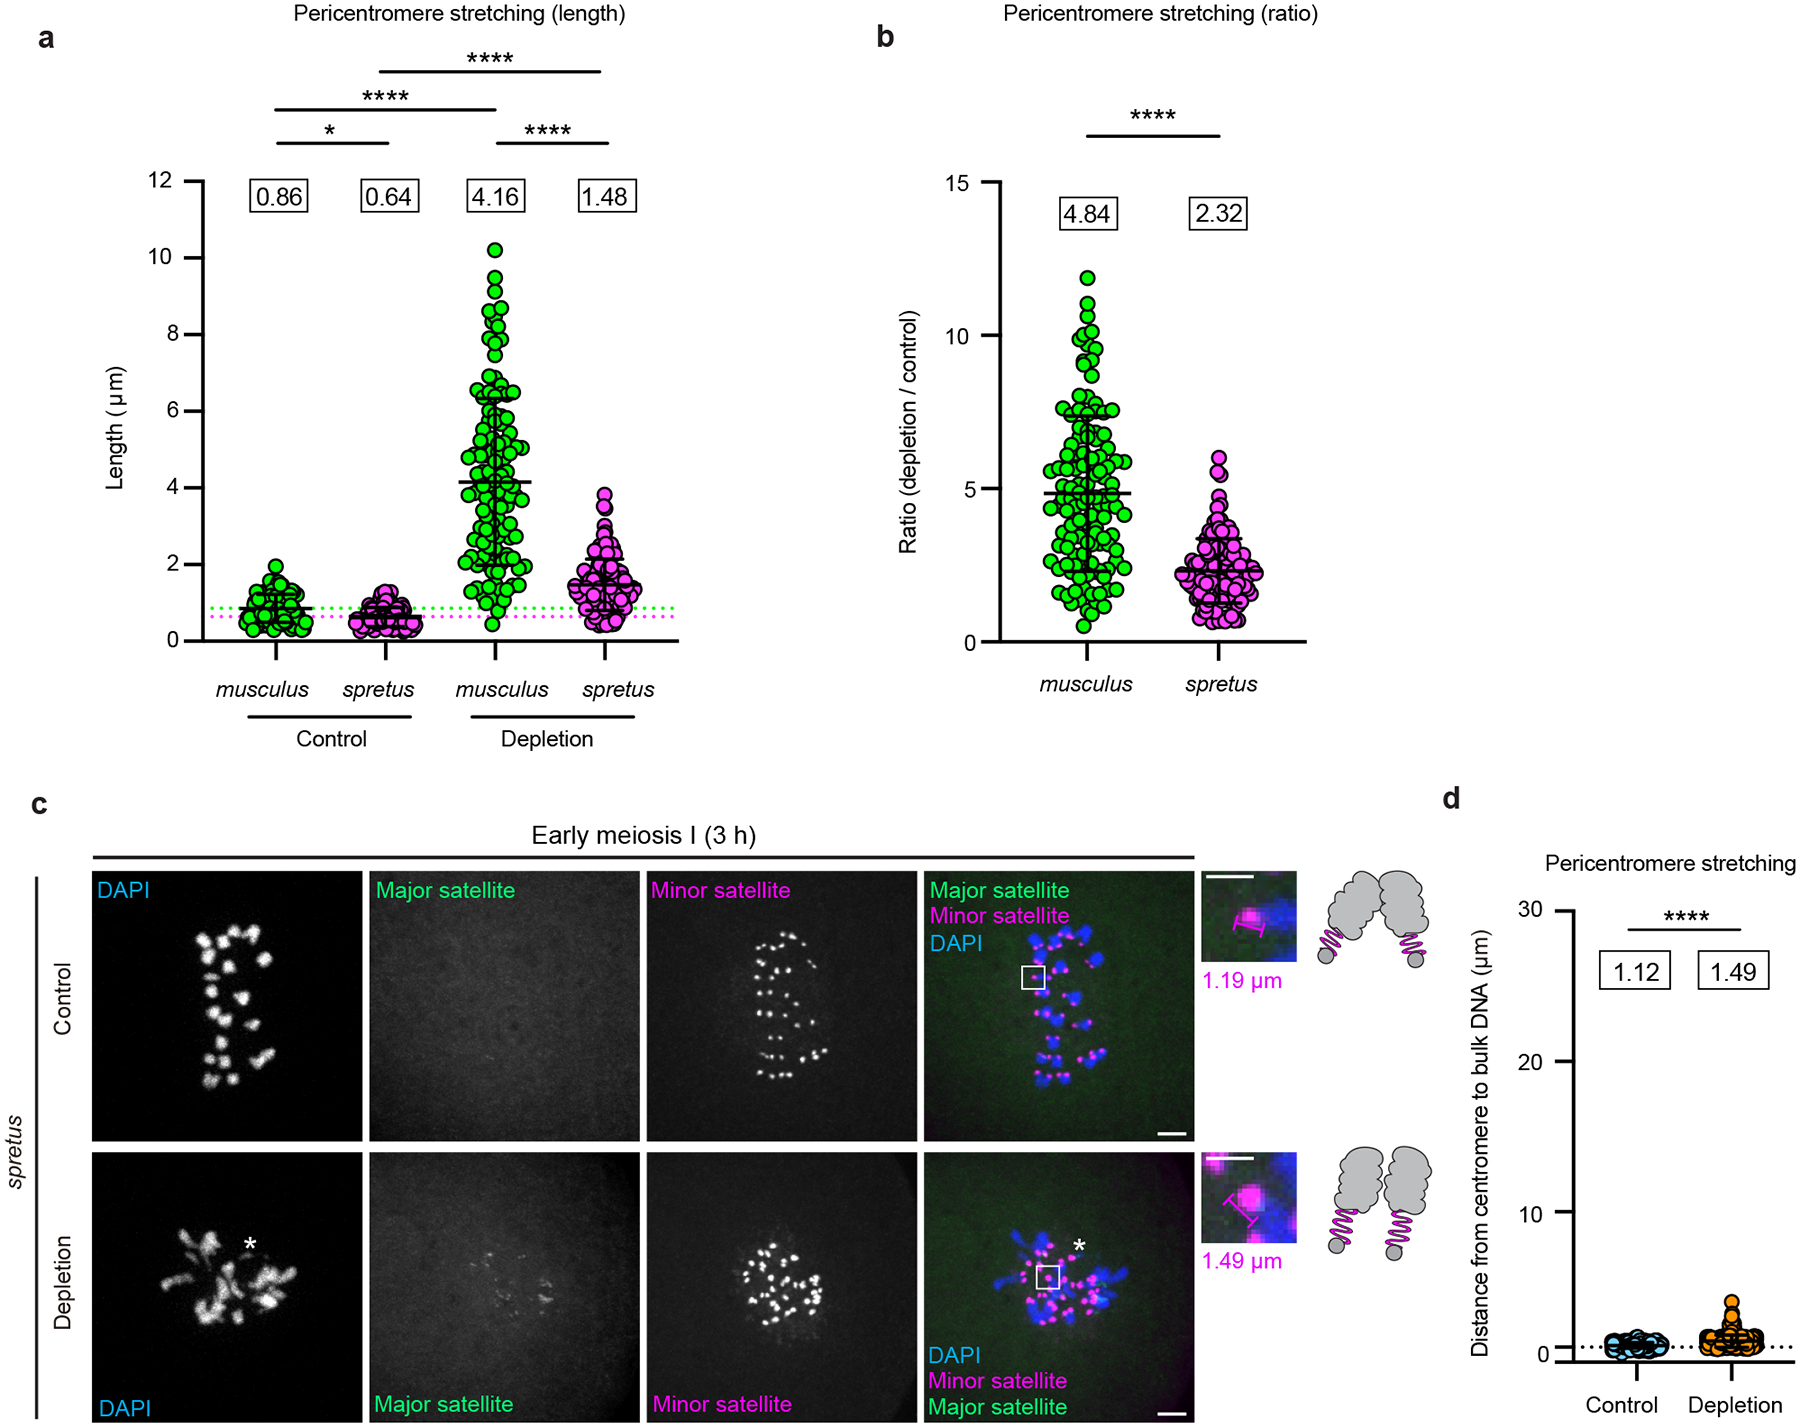
a, Quantification of musculus and spretus pericentromere length in control or HMGA1-depleted hybrid musculus/spretus oocytes (means and standard deviations are indicated, means shown in boxes, n=95 (control) and 120 (depletion) pericentromeres from 2 independent experiments; Kruskal-Wallis test followed by Dunn’s multiple comparison test, **** P<0.0001, * P=0.0466). Dotted lines indicate mean musculus (green) or spretus (magenta) pericentromere length in control hybrid oocytes. These data were used to calculate major over minor satellite length ratios shown in Fig. 5b. b, Data in panel A were used to calculate the depleted over control satellite length ratios for musculus (major) or spretus (minor) pericentromeres in hybrid musculus/spretus oocytes (means and standard deviations are indicated, means shown in boxes; two-tailed Mann-Whitney test; **** P<0.0001). c,d, Control or HMGA1-depleted spretus oocytes were fixed in early meiosis I and stained for DNA (DAPI). Cells were expressing TALE-mClover (major satellite) and dCas9-mCherry/gRNA (minor satellite). Scale bars 5 μm or 2 μm (insets). Pericentromere stretching was quantified as the longest axis of minor satellite signal. Mean and standard deviation indicated, means shown in boxes, n=17 (control) and 16 (depletion) spretus oocytes from 2 independent experiments, up to 20 pericentromeres per satellite measured in each oocyte; two-tailed Mann-Whitney test, **** P<0.0001. Note that some pericentromeres were displaced from bulk chromatin without detectable minor satellite stretching (asterisk).
Extended Data Fig. 9: Disproportionate impact of HMGA1 depletion on musculus and spretus kinetochores.
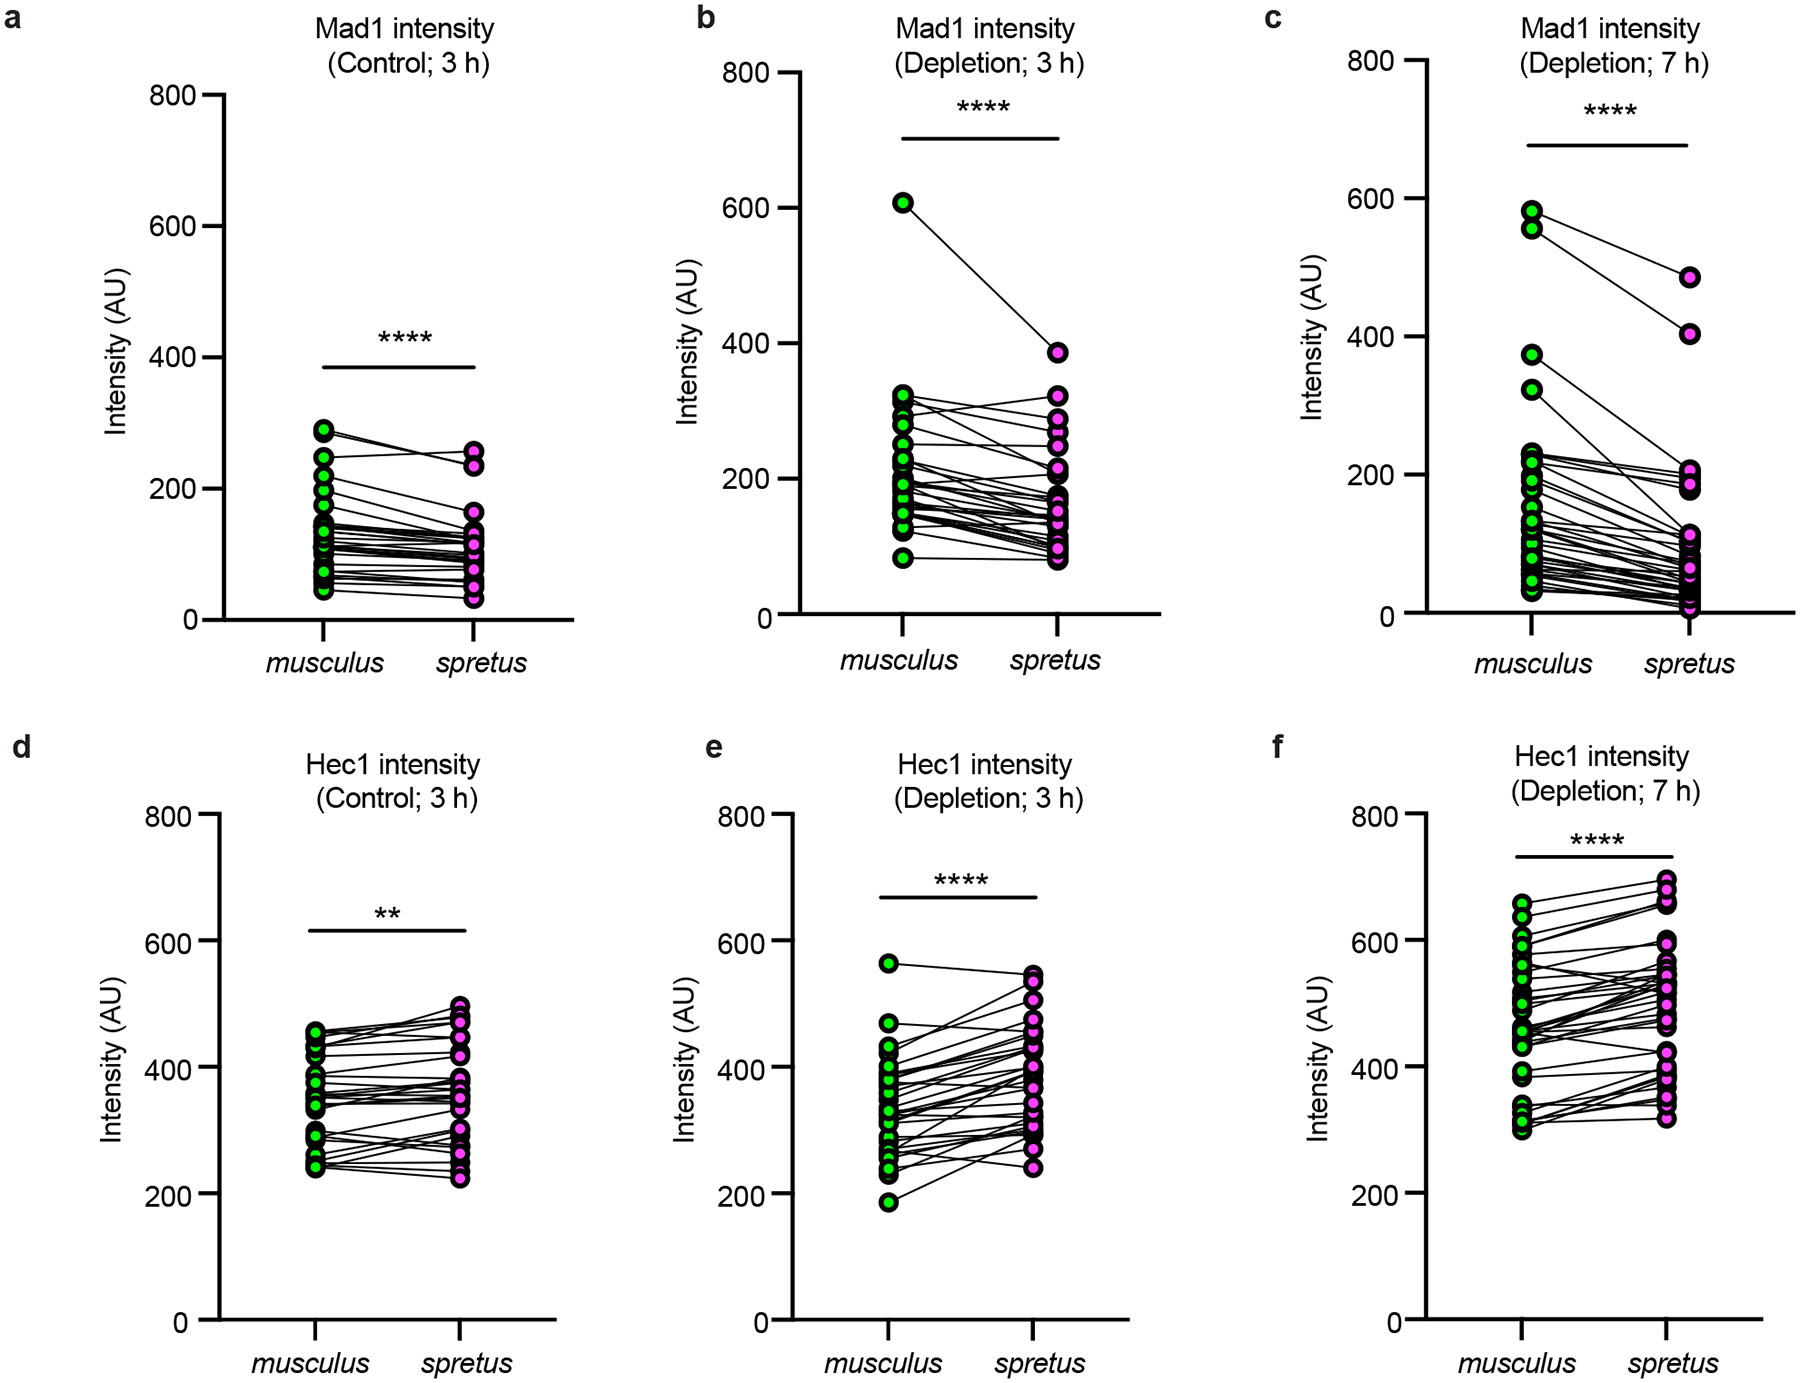
a-f, Mad1 (a-c) or Hec1 (d-f) signal intensities from Fig. 5d,e plotted as paired measurements in hybrid musculus/spretus oocytes in early meiosis I ((a,d) – control; (b,e) – HMGA1 depleted) or in late meiosis I ((c,f) – HMGA1 depleted) (n=30 (3 h, control), 31 (3 h, depletion) and 38 (7 h, depletion) hybrid oocytes from 2 independent experiments; paired two-tailed t-test, ****P<0.0001; **P=0.0039). Each pair of measurements (connected by a line) represents a single cell. Control oocytes in late meiosis I were not quantified due to the lack of Mad1 signal. Note that musculus kinetochores harbor marginally more Mad1 than spretus in control early meiosis I, but musculus kinetochores are marginally smaller than spretus.
Supplementary Material
Acknowledgments
We thank our UPenn colleagues J. Ma for assistance and C. Brand for comments on the manuscript. We also thank members of the Philadelphia Chromosome Club for discussions on our findings. Special thanks to Arunika Das (Cornell University) for experimental advice. We acknowledge Y. Yang for preliminary HMGA1 Trim-away experiments. Funding was from NIH grants GM130302 (B.E.B.), GM122475 (M.A.L.) and HD058730 (M.A.L. and B.E.B.).
Footnotes
Competing interests
The authors declare that they have no competing interests.
Code availability
Python code used to analyze A/T stretches and tetranucleotides is publicly available from Github: https://github.com/DDudka9/DNA-shape.git.
Data availability
The ChIP-seq data generated in this study have been deposited in the Sequence Read Archive (SRA) under BioProject accession code PRJNA1074844. The analyzed datasets are publicly available under SRA Experiment accession codes: (musculus input) SRX2939766, SRX2939768, SRX2939769; (musculus CENP-A ChIP-seq) SRX2939767, SRX2939772, SRX2939773; (musculus H3K9me3 ChIP-seq) SRR27928404; (spretus input) SRR27922556, SRR27922557, SRR27922558; (spretus CENP-A ChIP-seq) SRR27922553, SRR27922554, SRR27922555; (spretus H3K9me3 ChIP-seq) SRR27922552; (input and HMGA1 ChIP-seq) SRR5749536, SRR5749537, SRR5749546, and SRR5749545; (long-read musculus genome assembly) SRR11606870. All other data needed to evaluate our conclusions are included in the main paper or the supplementary materials.
References
- 1.Henikoff S, Ahmad K & Malik HS The centromere paradox: stable inheritance with rapidly evolving DNA. Science 293, 1098–1102 (2001). [DOI] [PubMed] [Google Scholar]
- 2.Altemose N et al. Complete genomic and epigenetic maps of human centromeres. Science 376, eabl4178 (2022). [DOI] [PMC free article] [PubMed] [Google Scholar]
- 3.Logsdon GA et al. The variation and evolution of complete human centromeres. Nature 629, 136–145 (2024). [DOI] [PMC free article] [PubMed] [Google Scholar]
- 4.Strauss F & Varshavsky A A protein binds to a satellite DNA repeat at three specific sites that would be brought into mutual proximity by DNA folding in the nucleosome. Cell 37, 889–901 (1984). [DOI] [PubMed] [Google Scholar]
- 5.Vogel B, Loschberger A, Sauer M & Hock R Cross-linking of DNA through HMGA1 suggests a DNA scaffold. Nucleic Acids Res. 39, 7124–7133 (2011). [DOI] [PMC free article] [PubMed] [Google Scholar]
- 6.Kixmoeller K, Allu PK & Black BE The centromere comes into focus: from CENP-A nucleosomes to kinetochore connections with the spindle. Open Biol 10, 200051 (2020). [DOI] [PMC free article] [PubMed] [Google Scholar]
- 7.Bernard P et al. Requirement of heterochromatin for cohesion at centromeres. Science 294, 2539–2542 (2001). [DOI] [PubMed] [Google Scholar]
- 8.Folco HD, Pidoux AL, Urano T & Allshire RC Heterochromatin and RNAi are required to establish CENP-A chromatin at centromeres. Science 319, 94–97 (2008). [DOI] [PMC free article] [PubMed] [Google Scholar]
- 9.Olszak AM et al. Heterochromatin boundaries are hotspots for de novo kinetochore formation. Nat. Cell Biol 13, 799–808 (2011). [DOI] [PubMed] [Google Scholar]
- 10.Jagannathan M, Cummings R & Yamashita YM A conserved function for pericentromeric satellite DNA. Elife 7, e34122 (2018). [DOI] [PMC free article] [PubMed] [Google Scholar]
- 11.Nonaka N et al. Recruitment of cohesin to heterochromatic regions by Swi6/HP1 in fission yeast. Nat. Cell Biol 4, 89–93 (2002). [DOI] [PubMed] [Google Scholar]
- 12.Kawashima SA et al. Shugoshin enables tension-generating attachment of kinetochores by loading Aurora to centromeres. Genes Dev. 21, 420–435 (2007). [DOI] [PMC free article] [PubMed] [Google Scholar]
- 13.Eckert CA, Gravdahl DJ & Megee PC The enhancement of pericentromeric cohesin association by conserved kinetochore components promotes high-fidelity chromosome segregation and is sensitive to microtubule-based tension. Genes Dev. 21, 278–291 (2007). [DOI] [PMC free article] [PubMed] [Google Scholar]
- 14.Alkan C et al. Genome-wide characterization of centromeric satellites from multiple mammalian genomes. Genome Res. 21, 137–145 (2011). [DOI] [PMC free article] [PubMed] [Google Scholar]
- 15.Arora UP, Charlebois C, Lawal RA & Dumont BL Population and subspecies diversity at mouse centromere satellites. BMC Genomics 22, 279 (2021). [DOI] [PMC free article] [PubMed] [Google Scholar]
- 16.Jagannathan M, Warsinger-Pepe N, Watase GJ & Yamashita YM Comparative analysis of satellite DNA in the Drosophila melanogaster species complex. G3 (Bethesda) 7, 693–704 (2017). [DOI] [PMC free article] [PubMed] [Google Scholar]
- 17.Chang CH et al. Islands of retroelements are major components of Drosophila centromeres. PLoS Biol. 17, e3000241 (2019). [DOI] [PMC free article] [PubMed] [Google Scholar]
- 18.Gambogi CW et al. Centromere innovations within a mouse species. Sci Adv 9, eadi5764 (2023). [DOI] [PMC free article] [PubMed] [Google Scholar]
- 19.DeBose-Scarlett EM & Sullivan BA Genomic and Epigenetic Foundations of Neocentromere Formation. Annu. Rev. Genet 55, 331–348 (2021). [DOI] [PubMed] [Google Scholar]
- 20.Guenatri M, Bailly D, Maison C & Almouzni G Mouse centric and pericentric satellite repeats form distinct functional heterochromatin. J. Cell Biol 166, 493–505 (2004). [DOI] [PMC free article] [PubMed] [Google Scholar]
- 21.Iwata-Otsubo A et al. Expanded satellite repeats amplify a discrete CENP-A nucleosome assembly site on chromosomes that drive in female meiosis. Curr. Biol 27, 2365–2373 e2368 (2017). [DOI] [PMC free article] [PubMed] [Google Scholar]
- 22.Wong AK, Biddle FG & Rattner JB The chromosomal distribution of the major and minor satellite is not conserved in the genus Mus. Chromosoma 99, 190–195 (1990). [DOI] [PubMed] [Google Scholar]
- 23.Narayanswami S et al. Cytological and molecular characterization of centromeres in Mus domesticus and Mus spretus. Mamm. Genome 2, 186–194 (1992). [DOI] [PubMed] [Google Scholar]
- 24.Miyanari Y, Ziegler-Birling C & Torres-Padilla ME Live visualization of chromatin dynamics with fluorescent TALEs. Nat. Struct. Mol. Biol 20, 1321–1324 (2013). [DOI] [PubMed] [Google Scholar]
- 25.Akera T, Trimm E & Lampson MA Molecular strategies of meiotic cheating by selfish centromeres. Cell 178, 1132–1144 e1110 (2019). [DOI] [PMC free article] [PubMed] [Google Scholar]
- 26.El Yakoubi W & Akera T Condensin dysfunction is a reproductive isolating barrier in mice. Nature 623, 347–355 (2023). [DOI] [PMC free article] [PubMed] [Google Scholar]
- 27.Masumoto H, Masukata H, Muro Y, Nozaki N & Okazaki T A human centromere antigen (CENP-B) interacts with a short specific sequence in alphoid DNA, a human centromeric satellite. J. Cell Biol 109, 1963–1973 (1989). [DOI] [PMC free article] [PubMed] [Google Scholar]
- 28.Kixmoeller K, Chang YW & Black BE Centromeric chromatin clearings demarcate the site of kinetochore formation. bioRxiv, 10.1101/2024.04.26.591177 (2024). [DOI] [PMC free article] [PubMed] [Google Scholar]
- 29.Brandle F, Fruhbauer B & Jagannathan M Principles and functions of pericentromeric satellite DNA clustering into chromocenters. Semin. Cell Dev. Biol 128, 26–39 (2022). [DOI] [PubMed] [Google Scholar]
- 30.Matsuda Y & Chapman VM In situ analysis of centromeric satellite DNA segregating in Mus species crosses. Mamm. Genome 1, 71–77 (1991). [DOI] [PubMed] [Google Scholar]
- 31.Larsen TA, Goodsell DS, Cascio D, Grzeskowiak K & Dickerson RE The structure of DAPI bound to DNA. J. Biomol. Struct. Dyn 7, 477–491 (1989). [DOI] [PubMed] [Google Scholar]
- 32.Wilson WD et al. Binding of 4’,6-diamidino-2-phenylindole (Dapi) to GC and mixed sequences in DNA - intercalation of a classical groove-binding molecule. J. Am. Chem. Soc 111, 5008–5010 (1989). [Google Scholar]
- 33.Wilson WD et al. DNA sequence dependent binding modes of 4’,6-diamidino-2-phenylindole (DAPI). Biochemistry 29, 8452–8461 (1990). [DOI] [PubMed] [Google Scholar]
- 34.Hizver J, Rozenberg H, Frolow F, Rabinovich D & Shakked Z DNA bending by an adenine--thymine tract and its role in gene regulation. Proc Natl Acad Sci U S A 98, 8490–8495 (2001). [DOI] [PMC free article] [PubMed] [Google Scholar]
- 35.Rohs R et al. The role of DNA shape in protein-DNA recognition. Nature 461, 1248–1253 (2009). [DOI] [PMC free article] [PubMed] [Google Scholar]
- 36.Joshi R et al. Functional specificity of a Hox protein mediated by the recognition of minor groove structure. Cell 131, 530–543 (2007). [DOI] [PMC free article] [PubMed] [Google Scholar]
- 37.Solomon MJ, Strauss F & Varshavsky A A mammalian high mobility group protein recognizes any stretch of six A.T base pairs in duplex DNA. Proc Natl Acad Sci U S A 83, 1276–1280 (1986). [DOI] [PMC free article] [PubMed] [Google Scholar]
- 38.Radic MZ, Saghbini M, Elton TS, Reeves R & Hamkalo BA Hoechst 33258, distamycin A, and high mobility group protein I (HMG-I) compete for binding to mouse satellite DNA. Chromosoma 101, 602–608 (1992). [DOI] [PubMed] [Google Scholar]
- 39.Huth JR et al. The solution structure of an HMG-I(Y)-DNA complex defines a new architectural minor groove binding motif. Nat. Struct. Biol 4, 657–665 (1997). [DOI] [PubMed] [Google Scholar]
- 40.Colombo DF, Burger L, Baubec T & Schubeler D Binding of high mobility group A proteins to the mammalian genome occurs as a function of AT-content. PLoS Genet. 13, e1007102 (2017). [DOI] [PMC free article] [PubMed] [Google Scholar]
- 41.Vignali R & Marracci S HMGA genes and proteins in development and evolution. Int J Mol Sci 21, 654 (2020). [DOI] [PMC free article] [PubMed] [Google Scholar]
- 42.Chiappetta G et al. High level expression of the HMGI (Y) gene during embryonic development. Oncogene 13, 2439–2446 (1996). [PubMed] [Google Scholar]
- 43.Clift D et al. A method for the acute and rapid degradation of endogenous proteins. Cell 171, 1692–1706 e1618 (2017). [DOI] [PMC free article] [PubMed] [Google Scholar]
- 44.Federico A et al. Hmga1/Hmga2 double knock-out mice display a “superpygmy” phenotype. Biol Open 3, 372–378 (2014). [DOI] [PMC free article] [PubMed] [Google Scholar]
- 45.Yoshida S et al. Prc1-rich kinetochores are required for error-free acentrosomal spindle bipolarization during meiosis I in mouse oocytes. Nat Commun 11, 2652 (2020). [DOI] [PMC free article] [PubMed] [Google Scholar]
- 46.Schuh M & Ellenberg J Self-organization of MTOCs replaces centrosome function during acentrosomal spindle assembly in live mouse oocytes. Cell 130, 484–498 (2007). [DOI] [PubMed] [Google Scholar]
- 47.Vallot A et al. Tension-Induced Error Correction and Not Kinetochore Attachment Status Activates the SAC in an Aurora-B/C-Dependent Manner in Oocytes. Curr. Biol 28, 130–139 e133 (2018). [DOI] [PubMed] [Google Scholar]
- 48.Chmatal L, Yang K, Schultz RM & Lampson MA Spatial regulation of kinetochore microtubule attachments by destabilization at spindle poles in meiosis I. Curr. Biol 25, 1835–1841 (2015). [DOI] [PMC free article] [PubMed] [Google Scholar]
- 49.Brunet S et al. Kinetochore fibers are not involved in the formation of the first meiotic spindle in mouse oocytes, but control the exit from the first meiotic M phase. J. Cell Biol 146, 1–12 (1999). [DOI] [PMC free article] [PubMed] [Google Scholar]
- 50.Kitajima TS, Ohsugi M & Ellenberg J Complete kinetochore tracking reveals error-prone homologous chromosome biorientation in mammalian oocytes. Cell 146, 568–581 (2011). [DOI] [PubMed] [Google Scholar]
- 51.Amor DJ, Kalitsis P, Sumer H & Choo KH Building the centromere: from foundation proteins to 3D organization. Trends Cell Biol. 14, 359–368 (2004). [DOI] [PubMed] [Google Scholar]
- 52.Vermaak D & Malik HS Multiple roles for heterochromatin protein 1 genes in Drosophila. Annu. Rev. Genet 43, 467–492 (2009). [DOI] [PubMed] [Google Scholar]
- 53.Risteski P, Jagric M, Pavin N & Tolic IM Biomechanics of chromosome alignment at the spindle midplane. Curr. Biol 31, R574–R585 (2021). [DOI] [PubMed] [Google Scholar]
- 54.Ye AA et al. Aurora A kinase contributes to a pole-based error correction pathway. Curr. Biol 25, 1842–1851 (2015). [DOI] [PMC free article] [PubMed] [Google Scholar]
- 55.Lampson MA & Grishchuk EL Mechanisms to avoid and correct erroneous kinetochore-microtubule attachments. Biology (Basel) 6, 1 (2017). [DOI] [PMC free article] [PubMed] [Google Scholar]
- 56.Fry K & Salser W Nucleotide sequences of HS-alpha satellite DNA from kangaroo rat Dipodomys ordii and characterization of similar sequences in other rodents. Cell 12, 1069–1084 (1977). [DOI] [PubMed] [Google Scholar]
- 57.Plohl M, Mestrovic N, Bruvo B & Ugarkovic D Similarity of structural features and evolution of satellite DNAs from palorus subdepressus (Coleoptera) and related species. J. Mol. Evol 46, 234–239 (1998). [DOI] [PubMed] [Google Scholar]
- 58.Plohl M, Luchetti A, Mestrovic N & Mantovani B Satellite DNAs between selfishness and functionality: structure, genomics and evolution of tandem repeats in centromeric (hetero)chromatin. Gene 409, 72–82 (2008). [DOI] [PubMed] [Google Scholar]
- 59.Melters DP et al. Comparative analysis of tandem repeats from hundreds of species reveals unique insights into centromere evolution. Genome Biol 14, R10 (2013). [DOI] [PMC free article] [PubMed] [Google Scholar]
- 60.Parker SC, Hansen L, Abaan HO, Tullius TD & Margulies EH Local DNA topography correlates with functional noncoding regions of the human genome. Science 324, 389–392 (2009). [DOI] [PMC free article] [PubMed] [Google Scholar]
- 61.Brand CL & Levine MT Functional Diversification of Chromatin on Rapid Evolutionary Timescales. Annu. Rev. Genet 55, 401–425 (2021). [DOI] [PMC free article] [PubMed] [Google Scholar]
- 62.Postnikov YV & Bustin M Functional interplay between histone H1 and HMG proteins in chromatin. Biochim Biophys Acta 1859, 462–467 (2016). [DOI] [PMC free article] [PubMed] [Google Scholar]
- 63.Chardon F et al. CENP-B-mediated DNA loops regulate activity and stability of human centromeres. Mol. Cell 82, 1751–1767 e1758 (2022). [DOI] [PubMed] [Google Scholar]
- 64.Jagannathan M & Yamashita YM Defective satellite DNA clustering into chromocenters underlies hybrid incompatibility in Drosophila. Mol. Biol. Evol 38, 4977–4986 (2021). [DOI] [PMC free article] [PubMed] [Google Scholar]
- 65.Foti D et al. Lack of the architectural factor HMGA1 causes insulin resistance and diabetes in humans and mice. Nat. Med 11, 765–773 (2005). [DOI] [PubMed] [Google Scholar]
- 66.Mestrovic N, Plohl M, Mravinac B & Ugarkovic D Evolution of satellite DNAs from the genus Palorus--experimental evidence for the “library” hypothesis. Mol. Biol. Evol 15, 1062–1068 (1998). [DOI] [PubMed] [Google Scholar]
- 67.Hasson D et al. The octamer is the major form of CENP-A nucleosomes at human centromeres. Nat. Struct. Mol. Biol 20, 687–695 (2013). [DOI] [PMC free article] [PubMed] [Google Scholar]
- 68.Wong AK & Rattner JB Sequence organization and cytological localization of the minor satellite of mouse. Nucleic Acids Res. 16, 11645–11661 (1988). [DOI] [PMC free article] [PubMed] [Google Scholar]
- 69.Horz W & Altenburger W Nucleotide sequence of mouse satellite DNA. Nucleic Acids Res. 9, 683–696 (1981). [DOI] [PMC free article] [PubMed] [Google Scholar]
- 70.Packiaraj J & Thakur J DNA satellite and chromatin organization at mouse centromeres and pericentromeres. Genome Biol 25, 52 (2024). [DOI] [PMC free article] [PubMed] [Google Scholar]
- 71.Langmead B & Salzberg SL Fast gapped-read alignment with Bowtie 2. Nat. Methods 9, 357–359 (2012). [DOI] [PMC free article] [PubMed] [Google Scholar]
- 72.Hon T et al. Highly accurate long-read HiFi sequencing data for five complex genomes. Sci Data 7, 399 (2020). [DOI] [PMC free article] [PubMed] [Google Scholar]
- 73.Schindelin J et al. Fiji: an open-source platform for biological-image analysis. Nat. Methods 9, 676–682 (2012). [DOI] [PMC free article] [PubMed] [Google Scholar]
- 74.Kumon T et al. Parallel pathways for recruiting effector proteins determine centromere drive and suppression. Cell 184, 4904–4918 e4911 (2021). [DOI] [PMC free article] [PubMed] [Google Scholar]
- 75.Clift D, So C, McEwan WA, James LC & Schuh M Acute and rapid degradation of endogenous proteins by Trim-Away. Nat Protoc 13, 2149–2175 (2018). [DOI] [PubMed] [Google Scholar]
- 76.Grenfell AW et al. A versatile multivariate image analysis pipeline reveals features of Xenopus extract spindles. J. Cell Biol 213, 127–136 (2016). [DOI] [PMC free article] [PubMed] [Google Scholar]
- 77.Dudka D, Akins RB & Lampson MA FREEDA: An automated computational pipeline guides experimental testing of protein innovation. J. Cell Biol 222, e202212084 (2023). [DOI] [PMC free article] [PubMed] [Google Scholar]
Associated Data
This section collects any data citations, data availability statements, or supplementary materials included in this article.
Supplementary Materials
Data Availability Statement
The ChIP-seq data generated in this study have been deposited in the Sequence Read Archive (SRA) under BioProject accession code PRJNA1074844. The analyzed datasets are publicly available under SRA Experiment accession codes: (musculus input) SRX2939766, SRX2939768, SRX2939769; (musculus CENP-A ChIP-seq) SRX2939767, SRX2939772, SRX2939773; (musculus H3K9me3 ChIP-seq) SRR27928404; (spretus input) SRR27922556, SRR27922557, SRR27922558; (spretus CENP-A ChIP-seq) SRR27922553, SRR27922554, SRR27922555; (spretus H3K9me3 ChIP-seq) SRR27922552; (input and HMGA1 ChIP-seq) SRR5749536, SRR5749537, SRR5749546, and SRR5749545; (long-read musculus genome assembly) SRR11606870. All other data needed to evaluate our conclusions are included in the main paper or the supplementary materials.