

Abstract
Critical limb ischemia (CLI) is the most advanced stage of peripheral arterial disease, posing a high risk of mortality. Sphingomyelin, a sphingolipid synthesized by sphingomyelin synthases (SMSs) 1 and 2, plays an essential role in signal transduction as a component of lipid rafts. However, the role of sphingomyelin in the inflammation of ischemic skeletal muscles remains unclear. In this study, we analyzed the roles of sphingomyelin and SMSs in CLI‐induced myopathy using a mouse hindlimb ischemia model. We observed that hypoxia after CLI triggered an increase in SMS2 levels, thereby elevating sphingomyelin concentrations in ischemic skeletal muscles. The expression of SMS2 and sphingomyelin was induced by hypoxia in C2C12 myotubes and regulated by the prolyl hydroxylase domain enzyme. Additionally, SMS2 deficiency suppressed skeletal muscle inflammation after CLI, attenuated the phosphorylation of inhibitor of κBα (IκBα), and reduced the nuclear translocation of nuclear factor κB (NFκB) p65. Meanwhile, the administration of sphingomyelin hampered skeletal muscle inflammation by inhibiting IκBα phosphorylation and NFκB p65 nuclear translocation and extending inflammation post‐CLI. Our results suggest that hypoxia‐induced enhancement in SMS2 levels and the consequent increase in sphingomyelin expression levels promote inflammation in ischemic muscle tissues via the NFκB pathway and propose sphingomyelin as a potential therapeutic target in patients with CLI and other hypoxia‐related inflammatory diseases.
Keywords: critical limb ischemia, hypoxia, NFκB, sphingomyelin, sphingomyelin synthase 2
Critical limb ischemia (CLI) enhances sphingomyelin synthase 2 (SMS2) production, which increases sphingomyelin concentrations in ischemic skeletal muscles, promoting inflammation via the NFκB pathway. Hypoxia induces this process, which hampers muscle inflammation post‐CLI. SMS2 deficiency can counteract these effects, suggesting that sphingomyelin could be a potential therapeutic target for CLI and hypoxia‐related inflammatory diseases.

Abbreviations
- AKT
protein kinase B
- BSA
bovine serum albumin
- CLI
critical limb ischemia
- CSA
cross‐sectional area
- DAG
diacylglycerol
- EPR
electron paramagnetic resonance
- H&E
hematoxylin and eosin
- HDL
high‐density lipoprotein
- HIF
hypoxia‐inducible factor
- IC
intermittent claudication
- IL‐18
interleukin‐18
- IκBα
inhibitor of κBα
- KO
knock out
- LDL
low‐density lipoprotein
- LPS
lipopolysaccharide
- MAPK
mitogen‐activated protein kinase
- mTOR
mammalian target of rapamycin
- NFDM
non‐fat dry milk
- NFκB
nuclear factor κB
- NLRP3
NLR family pyrin domain‐containing protein 3
- PAD
peripheral artery disease
- PHD
prolyl hydroxylase domain enzyme
- PI3K
phosphoinositide 3 kinase
- ROS
reactive oxygen species
- RT‐qPCR
reverse transcription‐quantitative PCR
- SM
sphingomyelin
- SMS
sphingomyelin synthase
- STAT3
signal transducer and activator of transcription 3
- TLR
Toll‐like receptor
- TNFα
tumor necrosis factor
- VLDL
very low‐density lipoprotein
- WT
wild type
Introduction
Lower‐extremity peripheral arterial disease (PAD) is caused by atherosclerotic arterial blockages and is characterized by reduced delivery of oxygen and/or energy [1]. Critical limb ischemia (CLI) is the most severe form of PAD, and patients suffer a high risk of major amputation and mortality. The 5‐year survival rate is approximately 50% [2, 3]. Although revascularization is the primary therapeutic goal for CLI, regeneration of ischemic muscle also improves the prognosis of CLI [4, 5]. Ischemia‐induced myopathy is involved in the failure of revascularization therapy [4, 6, 7], and calf muscle density is associated with mortality in patients with CLI [8]. Therefore, it is essential to understand the pathophysiology of blood vessels and skeletal muscles after CLI.
Hypoxia induces tissue degeneration following CLI. The deficiency of oxygen molecules severely inhibits ATP production by blocking electron transfer in the mitochondria. Thus, cell death occurs due to impaired energy metabolism [9]. In addition, a hypoxic region (pO2 < 10 mm Hg) appears in the tissues surrounding the ischemic area, and an adaptive response to hypoxia is evoked by the deactivation of prolyl hydroxylases (PHDs) and hypoxia‐inducible factors (HIFs). Previously, we reported that hypoxia decreased the levels of gangliosides, a type of sphingolipid, and conferred resistance to radiation and oxidative stress [10]. Therefore, hypoxic stress may regulate cellular functions by altering sphingolipid composition in the plasma membrane.
Sphingomyelin (SM) is the most abundant eukaryotic sphingolipid and an essential component of cellular membranes [11]. SM is preferentially concentrated in the outer leaflets of the plasma membrane and interacts with cholesterol to form lipid rafts that modulate signal transduction [12, 13, 14, 15]. Sphingomyelin synthase (SMS), which transfers a phosphocholine moiety to ceramides to synthesize SM [14, 16], has two isoforms, namely SMS1 and SMS2, which are abundant in the Golgi apparatus and plasma membrane [17]. In addition, SMS regulates the SM levels in cells and cell membranes [18]. We have previously reported the involvement of SM and SMSs in keratinocytes in the pathogenesis of dermatitis via the STAT3 (signal transducer and activator of transcription 3) pathway [15]. SM plays a vital role in NFκB activation [19]. These findings suggest the involvement of SMs and SMSs in inflammatory responses and are potential therapeutic targets for various inflammatory diseases.
Several sphingolipid derivatives, such as ceramide and sphingosine‐1‐phosphate, play crucial roles in skeletal muscle function [20, 21, 22]. In addition, in patients with sarcopenia, loss of skeletal muscle strength and lipid composition occurs with aging, and the amount of SM increases in the affected muscles [23]. However, the functions of SM and SMS1/2 in the skeletal muscles have not been explored. Therefore, in this study, we investigated the roles of SM and SMSs in CLI‐induced myopathy. Our findings suggest that hypoxia‐induced expression of SMS2 and an increase in the expression level of SM contribute to inflammation in ischemic muscle tissues. These results will help in devising strategies for the treatment of CLI and hypoxia‐related inflammatory diseases.
Results
Expression levels of sphingomyelin (SM) and sphingomyelin synthase 2 (SMS2) increase in ischemic skeletal muscle
The expression level of SMS1/2 in gastrocnemius tissue was analyzed 1 and 3 days after ischemia. The expression level of Sgms2 was significantly increased in the ischemic limbs, whereas an increase in Sgms1 expression level was not observed (Fig. 1A). Furthermore, the protein expression level of SMS2 significantly increased in the ischemic limbs, but that of SMS1 did not change (Fig. 1B). SM concentration markedly increased in the ischemic limbs 3 days after ischemia (Fig. 1C). To examine the role of hypoxia in SMS2 upregulation, pimonidazole was administered to the mice at 1 day after CLI. Pimonidazole is reductively activated specifically in hypoxic cells and forms stable adducts with thiol groups in proteins, peptides, and amino acids. Immunohistochemical analysis allows for the assessment of hypoxia in different tissues as well as cell types [24]. As shown in Fig. 1D, SMS2 was expressed in pimonidazole‐positive muscle fibers. Moreover, analysis of the public database showed that the expression of SGMS2 in gastrocnemius of CLI patients increased compared to non‐PAD control and patients with intermittent claudication (IC) (Fig. 1E). These results suggest that the expression of SM is increased in ischemic skeletal muscles, and SMS2 expression is associated with hypoxia‐induced upregulation of SM expression.
Fig. 1.
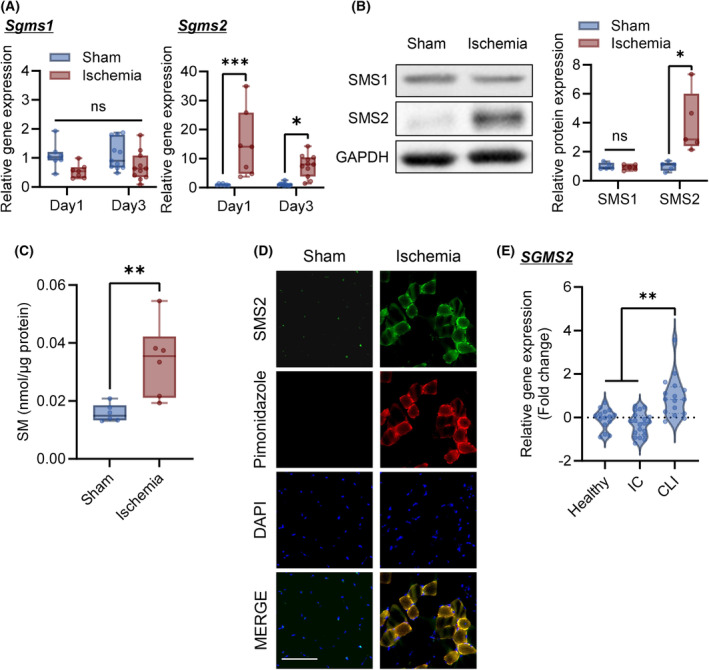
Sphingomyelin and SMS2 expression levels are increased in gastrocnemius after critical limb ischemia. The femoral artery/vein of the C57BL/6N mice was ligated to create a CLI (critical limb ischemia) model. Gastrocnemius tissue samples were collected 1 and 3 days after CLI. (A) Expression of Sgms1 and Sgms2 was analyzed using RT‐qPCR (Day 1, n = 7; Day 3, n = 11; internal control: Rn18s). (B) Representative western blot images of sphingomyelin synthase (SMS) 1 and SMS2 in the gastrocnemius 3 days after CLI. Relative band intensities were normalized to that of GAPDH (n = 5). (C) The sphingomyelin (SM) concentration in the gastrocnemius muscle was analyzed 3 days after CLI (n = 6). (D) Representative images of gastrocnemius immunohistology 1 day after CLI. SMS2 expression (green); hypoxic area detected by pimonidazole (red); nucleus stained with DAPI (blue); scale bar = 100 μm. (E) Expression of SGMS2 in the gastrocnemius of non‐peripheral arterial disease (PAD) controls (Healthy), patients with intermittent claudication (IC), and CLI (Healthy, n = 15; IC, n = 20; CLI, n = 16). The relative gene expression is shown in log2 fold change. Data are shown as box‐whisker plots or violin plots. In the box‐whisker plot, horizontal bar represents the median, and whiskers represent the maximum and minimum values. Comparison between two groups was analyzed using the t‐test. For comparison between three or more groups, the Tukey's multiple comparison test was used (*P < 0.05, **P < 0.01, and ***P < 0.001).
Inhibition of prolyl hydroxylase domain enzyme (PHD) increased sphingomyelin synthase 2 (SMS2) expression
C2C12 myotubes were used to analyze the regulatory mechanism of SMS2 expression under hypoxic conditions. Hypoxia markedly increased SMS2 gene expression levels in a time‐dependent manner, and the expression level peaked at 48 h, whereas no difference in SMS1 gene expression level was observed (Fig. 2A). Moreover, SMS2 protein expression level significantly increased after 48 h of hypoxia (Fig. 2B). In addition, hypoxia increased the cellular SM concentration (Fig. 2C).
Fig. 2.
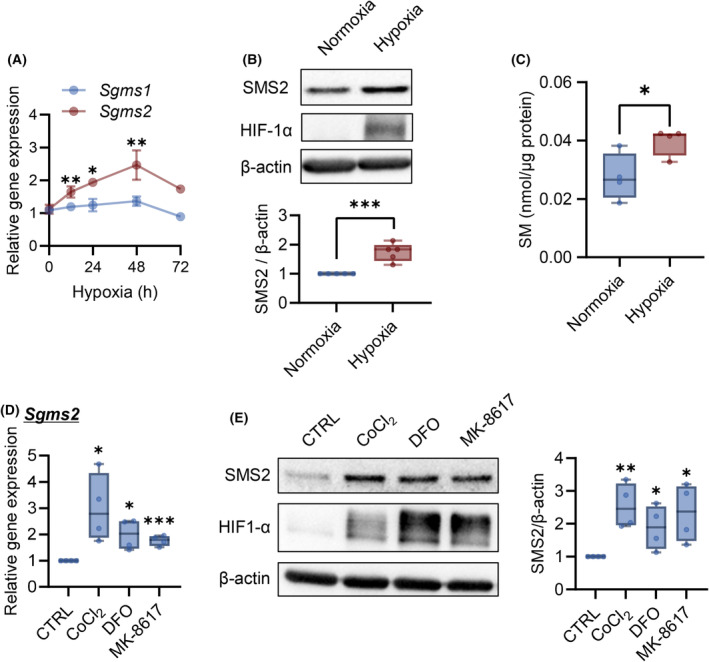
Hypoxia and prolyl hydroxylase domain enzyme inhibitors induce SMS2 expression. C2C12 myotubes were cultured under hypoxic conditions for the indicated times. (A) Expression of Sgms1/2 was analyzed using RT‐qPCR (n = 4; internal control: Tbp). (B) Representative western blot image and quantitative analysis of band intensities after 48 h of hypoxia. The relative band intensities were normalized to that of actin (n = 5). (C) The SM concentration in C2C12 myotube cells was analyzed 48 h after hypoxia. C2C12 myotube cells were treated with prolyl hydroxylase domain enzyme (PHD) inhibitors CoCl2 (200 μm), deferoxamine (DFO; 200 μm), and MK‐8617 (10 μm). (D) Gene expression of Sgms2 was analyzed using RT‐qPCR after 24 h of treatment with PHD inhibitors (n = 4). (E) Representative images of western blot and quantitative analysis of band intensities obtained after 48 h of treatment with PHD inhibitors (n = 4). Data are shown as mean ± SD in line graphs. In the box‐whisker plot, horizontal bar represents the median, and whiskers represent the maximum and minimum values. Comparison between two groups was analyzed using the t‐test. For comparison between three or more groups, the Tukey's multiple comparison test was used (*P < 0.05, **P < 0.01, and ***P < 0.001).
The involvement of PHD in hypoxia‐induced SMS2 was analyzed [25]. C2C12 myotubes treatment with PHD inhibitors (CoCl2, deferoxamine, and MK‐8617) [25, 26] increased SMS2 gene and protein expression levels with the accumulation of HIF‐1α (Fig. 2D,E). Interference of Hif1a RNA slightly inhibited hypoxia‐induced Sgms2 expression (Fig. 3A) and partially inhibited SMS2 protein expression (Fig. 3B). Moreover, CoCl2 treatment upregulated p53 and SMS2, while PFTα inhibited SMS2 gene/protein upregulation (Fig. 3C,D). These results indicated that expression of SMS2 is regulated via both axis of PHD/HIF‐1α, p53 in hypoxia.
Fig. 3.
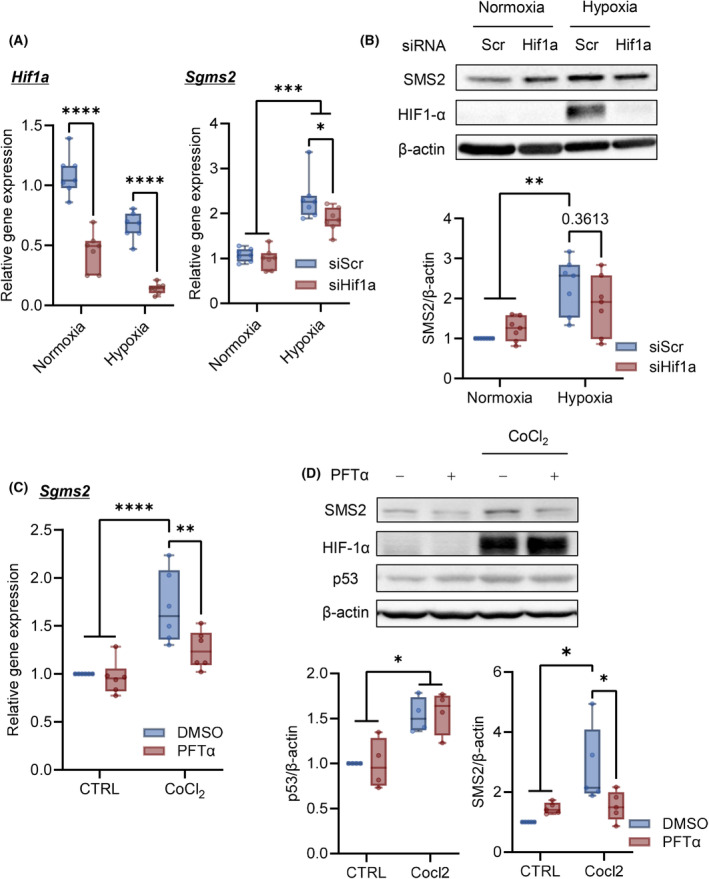
HIF‐1α and p53 are involved in SMS2 expression in hypoxia. C2C12 myotube cells were transfected with siRNA of HIF1‐α. Three days after transfection, C2C12 myotubes were cultured under hypoxia. (A) Expression of Hif1a and Sgms2 after 24 h of hypoxia (n = 7). (B) Representative western blot images of SMS2 expression and HIF1‐α accumulation after 48 h of hypoxia (n = 7). C2C12 myotube cells were treated with Pifithrin‐α (PTFα) (5 μm) with CoCl2 for 48 h. (C) Gene expression of Sgms2 was analyzed using RT‐qPCR (n = 6). (D) Representative western blot images and quantitative analyses (n = 5). In the box‐whisker plot, horizontal bar represents the median, and whiskers represent the maximum and minimum values. Comparison between groups, the Tukey's multiple comparison test was used (*P < 0.05, **P < 0.01, ***P < 0.001, and ****P < 0.0001).
Sphingomyelin synthase 2 (SMS2) deficiency promotes tissue repair in ischemic limbs
To investigate the effects of hypoxia‐induced SMS2 expression on the pathophysiology of CLI, we used SMS2‐knock‐out (KO) mice. Recovery of walking ability occurred more easily in SMS2‐KO mice than in wild‐type (WT) mice after ischemia (Fig. 4A). The mean fiber cross‐sectional area (CSA) of the gastrocnemius considerably increased in SMS2‐KO mice 14 days after ischemia (Fig. 4B,C). Enlarged myofibers were also observed in the CSA distribution of the SMS2‐KO mice (Fig. 4D). We observed no difference between the pO2 values of WT and KO mice after ischemia (Fig. 5A) Moreover, VEGFA expression and Pecam1 gene expression in WT and KO mice were not altered after CLI (Fig. 5B–D), and also no significant changes in the area of CD31‐positive cells in the ischemic limb were observed either (Fig. 5E).
Fig. 4.
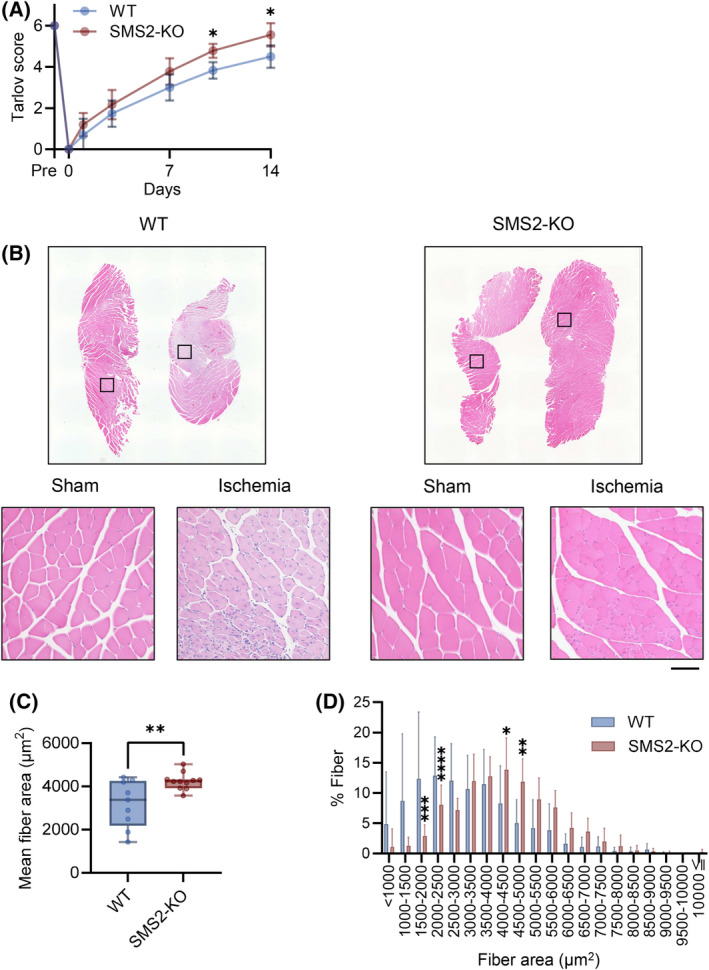
SMS2 deficiency promotes recovery from critical limb ischemia. Critical limb ischemia (CLI) was induced in wild‐type (WT) and SMS2‐knock‐out (KO) mice. (A) The walking ability after CLI was evaluated using the Tarlov score (WT, n = 16; KO, n = 15). (B) Fourteen days after CLI, the gastrocnemius muscle was collected and stained with hematoxylin and eosin (H&E; scale bar = 100 μm). (C) Mean fiber area and (D) distribution of fiber area (WT, n = 9; KO, n = 11). In the bar graph, the data is shown as mean ± SD. Horizontal bar represents the median, and whiskers represent the maximum and minimum values in the box‐whisker plot. Comparison between two groups was analyzed using the t‐test. For comparison between three or more groups, the Tukey's multiple comparison test was used (*P < 0.05, **P < 0.01, ***P < 0.001, and ****P < 0.0001).
Fig. 5.
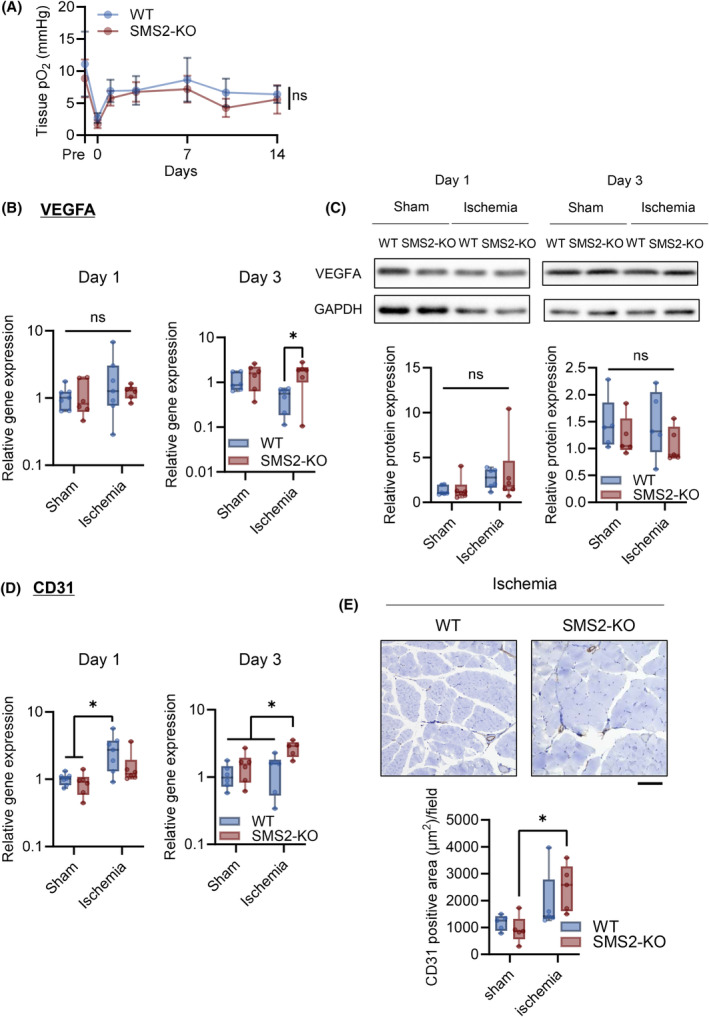
SMS2 plays a minimal role in the oxygenation of the tissue and angiogenesis of ischemic limbs. Angiogenesis after critical limb ischemia (CLI) in skeletal muscle of wild type (WT) and SMS2‐KO (KO) was evaluated. (A) Footpad tissue pO2 obtained by electron paramagnetic resonance (EPR) oximetry (WT, n = 21; KO, n = 16). (B) Gene expression of Vegfa in the gastrocnemius after 1 and 3 days CLI was analyzed using RT‐qPCR (Day 1, n = 7; Day 3, n = 6; internal control: Rn18s). (C) Representative image and of western blotting for VEGFA indicated days after CLI. Protein expression was normalized by GAPDH (Day 1, n = 6; Day 3, n = 5). (D) Gene expression of Pecam1 (Day 1, n = 7; Day 3, n = 6; internal control: Rn18s). (E) Representative image and quantification of CD31‐positive (brown, CD31; blue, nuclei, scale bar = 100 μm, n = 6). In the line graph, the data is shown as mean ± SD. Horizontal bar represents the median, and whiskers represent the maximum and minimum values in the box‐whisker plot. Comparison between groups, the Tukey's multiple comparison test was used (*P < 0.05).
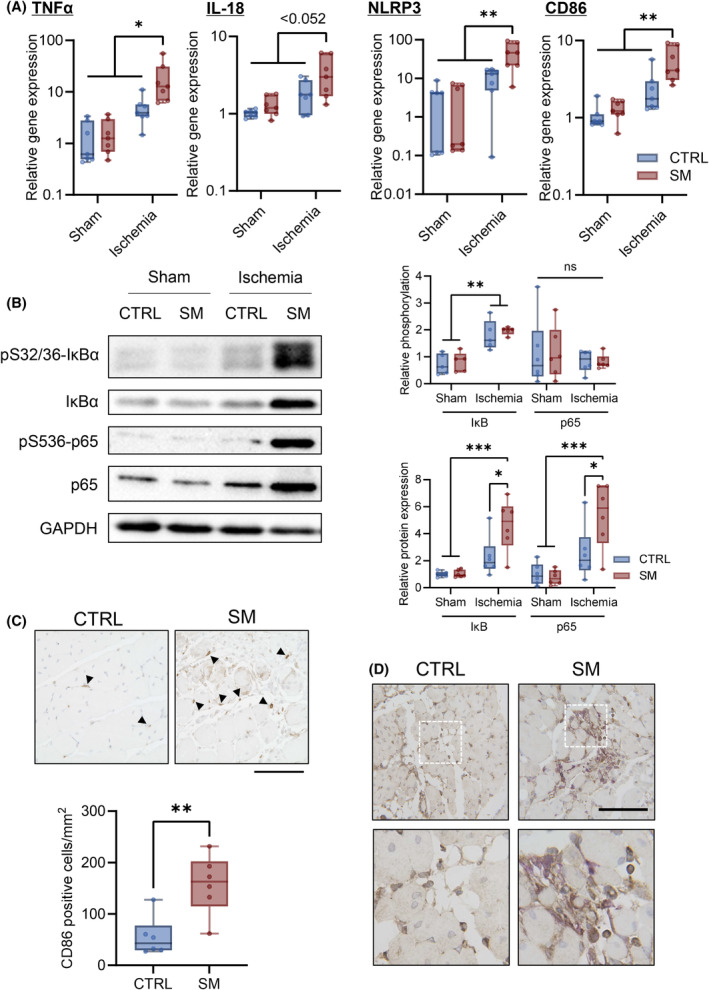
Furthermore, the gene expression levels of inflammatory cytokines (TNFα and IL‐18) were significantly increased in the ischemic limbs of WT mice, while their expression was suppressed in the ischemic limbs of SMS2‐KO mice. Similarly, the gene expression levels of activated macrophage markers (NLRP3 and CD86) increased in WT mice but not in KO mice (Fig. 6A). In addition, IκBα phosphorylation was increased in ischemic limbs of WT mice; however, SMS2 deficiency prevented IκBα phosphorylation. WT and KO mice showed similar p65 phosphorylation levels, although the total protein expression levels significantly increased in WT mice but not in KO mice (Fig. 6B). We compared the number of activated macrophages (CD86‐positive cells) in ischemic muscle between WT and KO mice and we found increased infiltration of activated macrophages in the ischemic tissues of WT mice (Fig. 6C). Also, expression of p65 was observed in the nuclei of skeletal muscle cells and macrophages (Iba1‐positive cells) in the ischemic limbs of WT mice. However, p65 expression was barely observed in KO mice (Fig. 6D).
Fig. 6.
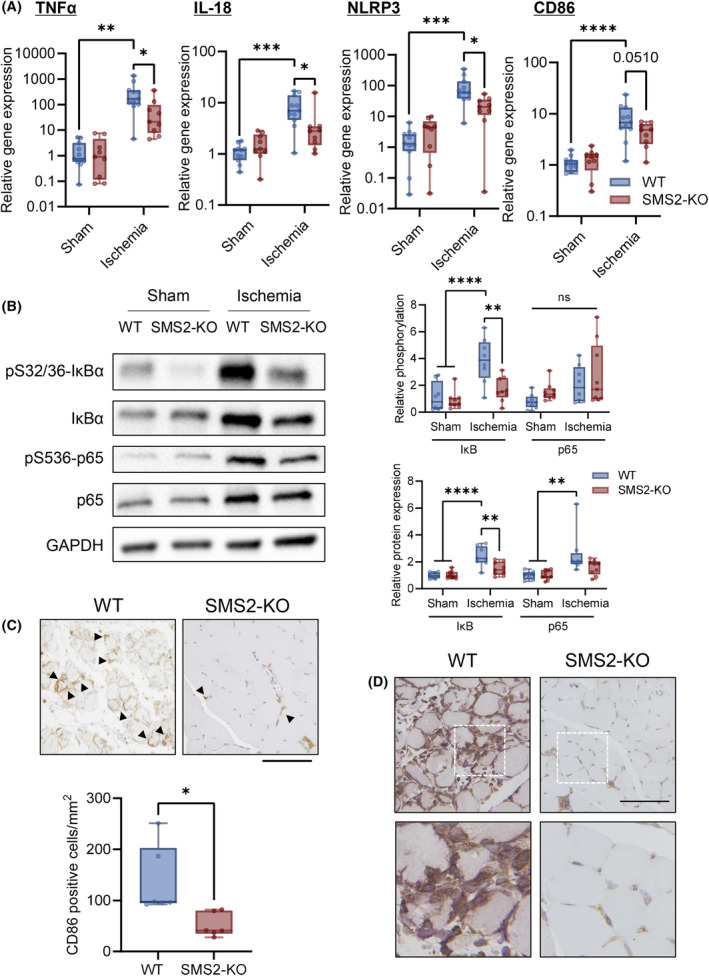
SMS2 deficiency suppresses the production of inflammatory cytokines in ischemic limbs. Gastrocnemius samples were collected 3 days after CLI from wild‐type (WT) and SMS2‐knock out (KO) mice, and gene and protein expression levels were examined. (A) Gene expression levels of TNFα, IL‐18, NLRP3, and CD86 were analyzed using RT‐qPCR (WT, n = 11; KO, n = 9; internal control: Rn18s). (B) Representative images of western blotting and quantitative analyses. The relative band intensities of the phosphorylated proteins were normalized to that of the total protein, and protein expression levels were normalized to that of GAPDH (Sham, n = 8; Ischemia, n = 9). Infiltration of CD86‐ and p65‐positive cells in skeletal muscle was examined using immunohistochemical analysis. (C) Representative image and quantification of CD 86‐positive cells (Arrows indicate CD86; scale bar = 100 μm; n = 6). (D) Representative immunohistochemistry image of p65 and Iba1 in skeletal muscle (brown, p65; purple, Iba1; scale bar = 100 μm). In the box‐whisker plot, horizontal bar represents the median, and whiskers represent the maximum and minimum values. Comparison between two groups was analyzed using the t‐test. For comparison between three or more groups, the Tukey's multiple comparison test was used (*P < 0.05, **P < 0.01, ***P < 0.001, and ****P < 0.0001).
SM perturbs tissue repair in ischemic limbs
To determine whether SM increases ischemic limb involvement in muscle injury after CLI, SM was administered after CLI induction. Ischemia elevated intramuscular SM concentrations; however, SM administration did not alter these levels (Fig. 7A). In contrast, SM administration increased serum SM concentration (Fig. 7B).
Fig. 7.
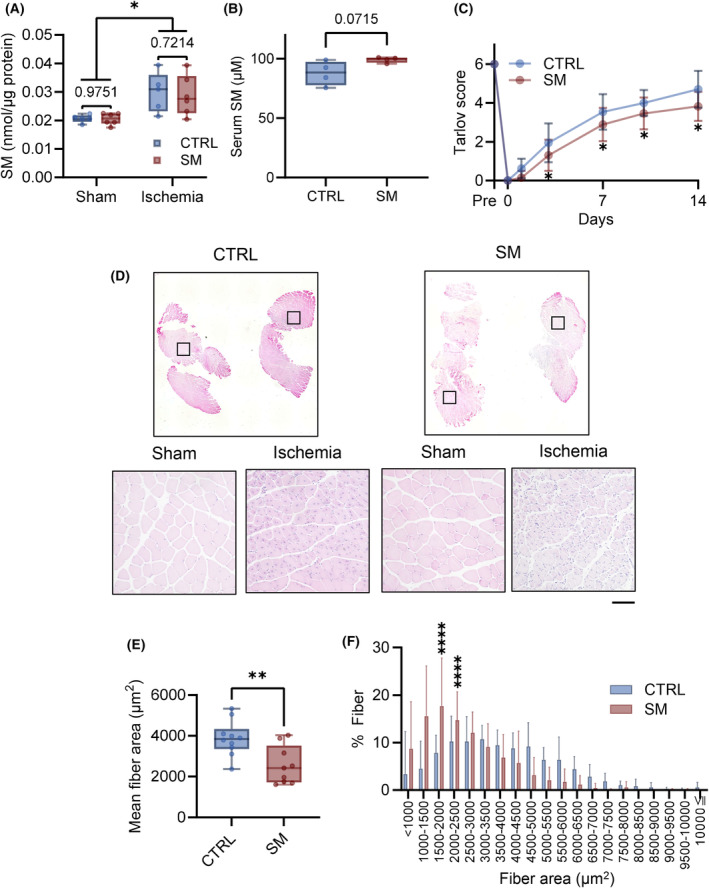
Sphingomyelin (SM) represses skeletal muscle regeneration. SM was administered intravenously (0.5 mg·kg−1) immediately after CLI (critical limb ischemia) surgery and 7 days after CLI surgery. (A) SM concentration of skeletal muscle 8 days after CLI (control mice [CTRL], n = 5; SM‐treated mice [SM], n = 6). (B) SM concentration of serum 8 days after CLI (n = 5). (C) Walking ability after CLI was evaluated by Tarlov scoring (CTRL, n = 18; SM, n = 20). (D) Fourteen days after CLI, the gastrocnemius muscle was collected and stained with H&E (scale bar = 100 μm). (E) Mean fiber area and (F) distribution (CTRL, n = 10; SM, n = 9). In the line and bar graphs, the data is shown as mean ± SD. Horizontal bar represents the median, and whiskers represent the maximum and minimum values in the box‐whisker plot. Comparison between two groups was analyzed using the t‐test. For comparison between three or more groups, the Tukey's multiple comparison test was used (*P < 0.05, **P < 0.01, and ****P < 0.0001).
Sphingomyelin administration delayed the improvement in walking ability compared with control mice (Fig. 7C). In addition, SM treatment decreased muscle fiber CSA and shifted the CSA distribution toward smaller values 14 days after ischemia (Fig. 7D–F). SM treatment did not affect blood flow recovery after ischemia (Fig. 8A). We did not observe alterations in Vegfa and Pecam1 gene expression after CLI with or without SM treatment (Fig. 8B). No significant changes in the area of CD31‐positive cells in the ischemic limb were observed (Fig. 8C). In the ischemic limbs of the control mice, TNFα, IL‐18, NLRP3, and CD86 gene expression did not increase compared with the sham group. However, SM administration increased the levels of inflammatory markers 14 days after ischemia (Fig. 9A) and the protein expression of IκBα and p65 (Fig. 9B). SM treatment did not affect the phosphorylation of IκBα and p65; however, it increased the number of activated‐macrophages (CD86‐positive cell) in the ischemic tissue (Fig. 9C). In addition, p65 was expressed in the nuclei of skeletal muscle cells and macrophages in ischemic tissue (Fig. 9D). These results suggest that SM inhibits recovery from skeletal muscle damage by prolonging inflammation.
Fig. 8.
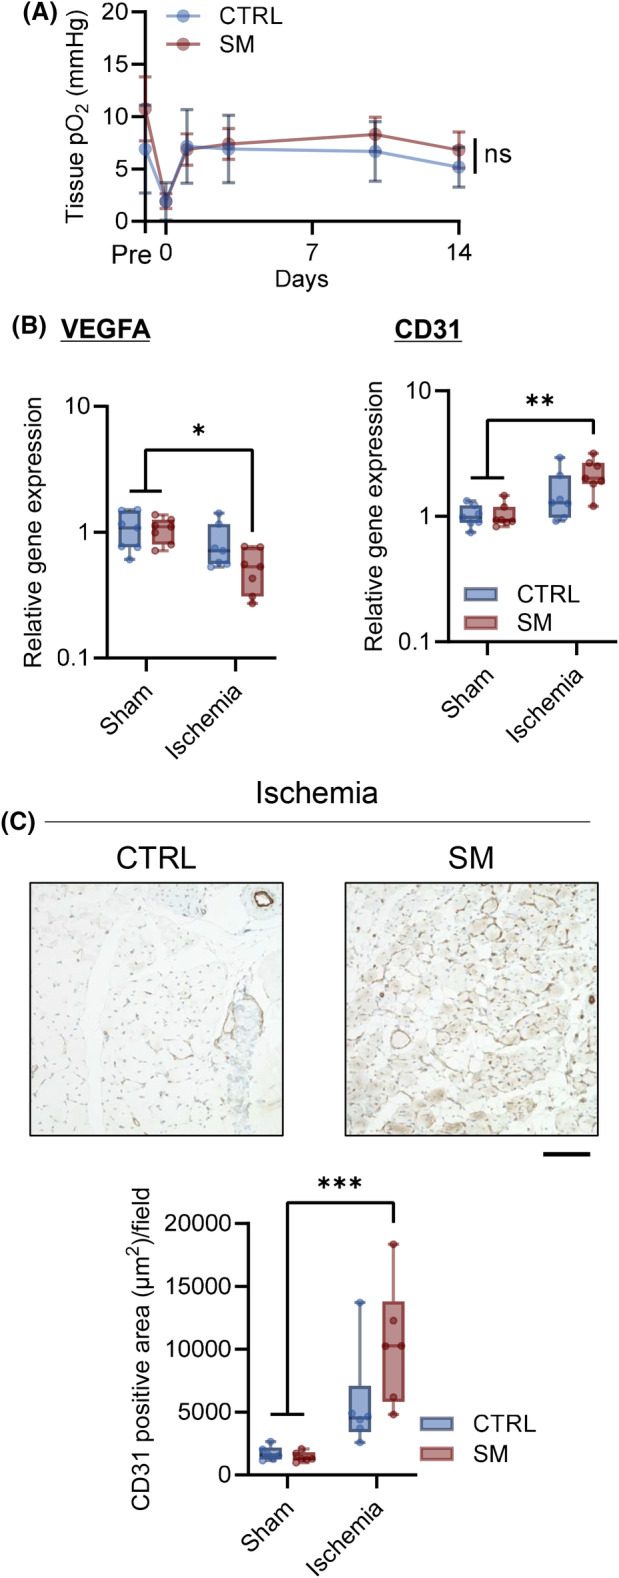
Sphingomyelin plays a minimal role in the oxygenation of the tissue and angiogenesis of ischemic limbs. Sphingomyelin (SM) was intravenously administered (0.5 mg·kg−1) immediately after CLI (critical limb ischemia) surgery and 7 days after CLI, and also angiogenesis after CLI in skeletal muscle with and without SM injection was evaluated. (A) Footpad tissue pO2 was measured using electron paramagnetic resonance (EPR) oximetry (CTRL mice [CTRL], n = 15; SM‐treated mice [SM], n = 19). (B) Gene expression of Vegfa and Pcam1 was analyzed using qPCR 14 days after CLI (n = 7, internal control: Rn18s). (C) Representative image of immunohistochemistry and CD31 positive area was quantified (brown, CD31; blue, nuclei, scale bar = 100 μm, n = 6). In the line graph, the data is shown as mean ± SD. Horizontal bar represents the median, and whiskers represent the maximum and minimum values in the box‐whisker plot. Comparison between groups, the Tukey's multiple comparison test was used (*P < 0.05, **P < 0.01, and ***P < 0.001).
Fig. 9.
Sphingomyelin prolongs inflammation in skeletal muscles. Gastrocnemius samples were collected 14 days after CLI with or without sphingomyelin (SM) treatment. (A) Gene expression levels of TNFα, IL‐18, NLRP3, and CD86 were analyzed using RT‐qPCR (n = 7; internal control: Rn18s). (B) Representative images of western blotting and quantitative analyses. The relative band intensities of the phosphorylated proteins were normalized to that of the total protein, and the protein expression levels were normalized to that of GAPDH (n = 6). (C) Infiltration of CD86‐positive cells in skeletal muscle was examined using immunohistochemical analysis. Representative image and quantification of CD 86‐positive cells (Arrows = CD86; scale bar = 100 μm; n = 6). (D) Representative immunohistochemistry image of p65 and Iba1 in skeletal muscle (brown, p65; purple, Iba1; scale bar = 100 μm). In the box‐whisker plot, horizontal bar represents the median, and whiskers represent the maximum and minimum values. Comparison between two groups was analyzed using the t‐test. For comparison between three or more groups, the Tukey's multiple comparison test was used (*P < 0.05, **P < 0.01, and ***P < 0.001).
Discussion
Critical limb ischemia is associated with a high mortality rate and the risk of amputation, affecting millions of patients globally [27]. Several studies have been conducted to devise strategies to decrease the mortality rate of CLI; however, an effective treatment for CLI has not been elucidated. In this study, the levels of SM, synthesized by SMS2, were increased in ischemic muscles and PHD was involved in SMS2 expression under hypoxic conditions. In addition, the loss of SMS2 reduced tissue damage caused by ischemia, whereas SM administration exacerbated tissue damage. These results suggested that SMS2 deficiency reduced myopathy without affecting re‐vacuolization, owing to the suppression of skeletal muscle inflammation.
Three PHD isoforms, PHD1, PHD2, and PHD3, have been identified in mammals [28]. PHDs hydroxylate proline residues of substrate proteins using oxygen and divalent iron ions, 2‐oxoglutaric acid, and ascorbic acid. Although HIF‐1α is a well‐known substrate of PHDs [29], the knockdown of HIF‐1α partially suppressed SMS2 upregulation under hypoxic conditions (Fig. 3A,B). Furthermore, the p53 inhibitor suppressed SMS2 upregulation by CoCl2 (Fig. 3C,D). Expression of p53 is regulated by PHD1 and PHD3 [30, 31]. Moreover, SGMS2 is a target gene of p53 in human mesenchymal stem cells [32]. Therefore, SMS2 is regulated by p53 under the control of PHD rather than HIF‐1α. More than 20 potential non‐HIF substrates regulated by PHDs have been identified [33]. For example, NFκB is regulated by PHD1 through the repression of IκB kinase in hypoxia [34]. AKT is prolyl hydroxylated by PHD2 and is suppressed by direct binding of the von Hippel Lindau protein [35]. Further studies are required to identify the transcription factors involved in regulating SMS2 expression by PHD.
Sphingomyelin is the most abundant sphingolipid in cellular membranes and is involved in various cellular functions such as proliferation, differentiation, and viability [36]. In this study, the promotion of walking ability and muscle repair was observed in SMS2‐KO mice after CLI. Moreover, SMS2‐KO led to suppression of skeletal muscle inflammation, as indicated by the suppression of expression of TNFα, IL‐18, NLRP3, and CD86 (Fig. 6A). After 14 days of CLI, the disease was in the chronic phase, and the expression of inflammatory cytokines decreased to the baseline level in the control group (Fig. 9A). Infiltration of vascular endothelial cells into ischemic muscle was slightly increased in SMS2‐KO mice and the trend of recovery of tissue pO2 was similar in WT and KO mice. Therefore, SM is involved in CLI pathology by increasing macrophage infiltration rather than angiogenesis.
External administration of SM has been reported to have biological effects; for example, oral administration of SM improves epidermal function when SM reaches the skin [37, 38]. We have previously shown that external administration of SM suppresses the hyperphosphorylation of STAT3 that occurs in SMS1‐deficient mouse and mouse embryonic fibroblasts [15]. Furthermore, in the plasma, sphingomyelin is the most abundant sphingolipid (approximately 200–300 μm in human) in lipoproteins and is associated with VLDL, LDL, and HDL [39]. As shown in Fig. 7A,B, SM administration slightly increased serum SM concentration rather than muscle SM. Several studies have reported the involvement of SM and SMS in the expression of inflammatory cytokines in vitro. Li et al. [40] reported that SMS1‐KO macrophages exhibited decreased LPS‐induced cell surface recruitment of TLR4 and its coreceptor, the MD2 complex. Moreover, Hailemariam et al. [41] reported that SMS2‐KO decreased the formation of LPS‐induced TLR4‐MD2 complex in HEK293 cells. These reports suggested that SM and SMSs are related to NFκB pathway activation. Luberto et al. [19] demonstrated that the SMS1/2 inhibitor D609 inhibited NFκB activation without the generation of ceramide. D609 inhibits SM synthesis and diacylglycerol (DAG) production, as DAG is a byproduct of SM synthesis. Phosphorylation of IκB stabilizes p65, which is crucial for the transcription of inflammatory cytokines, including TNFα [42]. In this study, SMS2‐KO prevented the increase of IκBα and p65 expression at 3 days after CLI, along with this phosphorylation. Conversely, SM administration increased IκBα and p65 expression levels at 14 days after CLI and promoted the transition of p65 to nuclei in skeletal muscle and macrophages. These findings imply that hypoxia boosts intramuscular SM levels by SMS2 induction, and SM stabilized NFκB p65 leading to the macrophage‐driven inflammation.
An essential link between hypoxia and tissue inflammation has been described previously [43]. Hypoxia signaling pathways are conserved in almost all mammalian cells, including immune cells and tissues, such as the epithelium and endothelium. Moreover, this signaling is known to enhance the inflammatory response by affecting several cellular pathways, such as phosphoinositide 3 kinase (PI3K)‐mammalian target of rapamycin (mTOR) signaling, NFκB pathway, and Mitogen‐activated Protein Kinase (MAPK) pathway [44]. A limitation of this study is that SMS2 expression in different cell types under hypoxia has yet to be analyzed in detail. As shown in Fig. 1D, SMS2 expression is observed in muscle cells under hypoxia, but it is possible that SMS2 expression is also increased in immune cells, including macrophages, under hypoxia. Further studies are needed on the cell‐specific regulation of sphingolipids under hypoxia. Jin et al. [16] reported that SMS2 expression is elevated following hypoxia and promotes apoptosis and ROS generation in cardiomyocytes. Moreover, SMSs are involved in many aspects of ischemic injury and play essential roles in the brain [45, 46]. Therefore, SM is a potential target for the treatment of many hypoxia‐related diseases, such as cancer, atherosclerosis, and ischemia–reperfusion injury.
In conclusion, our findings indicated that SM levels were increased in ischemic muscle tissues via the induction of SMS2 due to hypoxia. Hypoxia‐induced SM expression promoted inflammation in muscle tissues via the NFκB pathway, demonstrating that SMS2 is not only a potential therapeutic target in CLI but also in other inflammatory diseases.
Materials and methods
General animal protocols and mouse hindlimb ischemia model
All animal experiments were performed according to the established guidelines of the “Law for the Care and Welfare of Animals in Japan” and approved by the Animal Experiment Committee of Azabu University (approval no. 210811‐7). Mice were housed under Specific Pathogen Free conditions in plastic cages in an air‐conditioned room at 24 °C with a 12‐h light–dark cycle (lights on at 7:00 am) with food and water available ad libitum. C57BL6/N mice were purchased from The Jackson Laboratory Japan (Yokohama, Japan) and Sgms2‐KO mice were generated according to previously established protocols [47].
The hindlimb ischemia model was established as previously described [48]. Briefly, 8–10‐week‐old male mice were anesthetized by intraperitoneal injection of a mixed anesthetic containing medetomidine (0.3 mg·kg−1), midazolam (4 mg·kg−1), and butorphanol (5 mg·kg−1). The right femoral arteries and veins were separated from the nerves. The vessels were ligated at two points, the inguinal ligament and the popliteal bifurcation, with a 7‐0 polypropylene suture (cat. no. M8734; Ethicon, Bridgewater, NJ, USA), and branches between the two points were removed. The left limb was a sham as it was surgically controlled and separated from the nerve. The wound was closed using a 5‐0 monofilament absorbent thread (cat. no. SMM‐5043; Covidien, Dublin, Ireland). SM (cat. no. NS220103, Nagara Science Co., Ltd., Gifu, Japan) was dissolved in saline containing 0.1% ethanol. Previous research has confirmed that SM dissolves in aqueous solutions under conditions of 0.1% ethanol concentration [15]. As necessary, SM (0.5 mg·kg−1; i.v., injection volume = 100 μL) was administered immediately after CLI surgery and 7 days after CLI surgery.
Walking ability after CLI was analyzed for 2 weeks using the Tarlov score [49]. The scores were 0 (no voluntary movement), 1 (barely perceptible movement), 2 (brisk movement of the limb but no coordination with the uninjured side, no weight support), 3 (alternate stepping and propulsive movement, no weight support), 4 (weight support), 5 (ambulation with mild defect), and 6 (normal ambulation).
Cell culture
Mouse myoblast C2C12 cell line (cat. no. ECA91031101; RIKEN Cell Bank, Saitama, Japan) was maintained in Dulbecco's Modified Eagle Medium (DMEM) (cat. no. 04429765; Wako Pure Chemicals Co., Osaka, Japan) supplemented with 10% fetal bovine serum (Sigma‐Aldrich, St. Louis, MO, USA) and 10 mm HEPES buffer solution (cat. no. 345‐06681; Wako Pure Chemicals Industries). C2C12 cell line authenticated in the past 3 years by STR analysis, and all experiments were performed with mycoplasma‐free cells.
The cells were cultured in 5% CO2 at 37 °C. At 80–90% confluence, and the culture medium was replaced with DMEM supplemented with 2% horse serum (cat. no. H1270; Sigma‐Aldrich) and 10 mm HEPES for 3 days to allow the cells to differentiate into myotubes. C2C12 myotubes were treated with the PHD inhibitor CoCl2 (cat. no. 036‐03682; Wako Pure Chemicals Industries), deferoxamine (Desferal; Novartis Pharma, Basel, Schweizerische Eidgenossenschaft), and MK8617 (cat. no. S8443; Selleck Chemicals, Houston, TX, USA) for 24–48 h. These PHD inhibitors inhibit PHD isoforms 1–3. The inhibitor of trans‐activation of p53, PFTα (cat. no. S2929; Selleck Chemicals) was treated simultaneously with CoCl2.
In addition, C2C12 myotubes were cultured under hypoxia for 12–72 h using a 5% anaerobic AnaeroPack‐Kenki system (cat. no. A‐07; Mitsubishi Gas Chemical Co., Tokyo, Japan) in an incubation chamber (cat. no. A‐0110; Mitsubishi Gas Chemical).
Oxygen measurement
The tissue partial pressure of oxygen (pO2) was measured using electron paramagnetic resonance (EPR) oximetry with OxyChip, an implanted oxygen‐sensitive probe. The OxyChip is an FDA‐approved minimally invasive oxygen‐sensitive probe consisting of an oxygen‐sensitive paramagnetic molecule, lithium 5, 9, 14, 18, 23, 27, 32, 36‐octa‐n‐butoxy‐2,3‐naphthalocyanine (LiNc‐BuO), encapsulated in polydimethylsiloxane (PDMS) [50, 51]. The line width of the OxyChip was measured using a locally constructed L‐band EPR spectrometer with a surface‐coil resonator [52, 53, 54], and the pO2 value was obtained from the calibration curve of the OxyChip signal linewidth against the oxygen partial pressure measured before implantation. Tissue pO2 was calculated from the calibration curves of the peak‐to‐peak line widths and pO2 (R 2 = 0.9997).
One day before hind limb ischemia, the OxyChip was implanted into the footpad. An OxyChip was placed at the end of an 18‐G needle and inserted by pushing it out using a plunger [55]. During measurement, the mice were anesthetized with isoflurane, and surface coil resonator was placed over the site with OxyChip. Typical measurement parameters for acquiring EPR spectra were RF frequency of 754 MHz, magnetic field modulation amplitude (mT) was adjusted to approximately 1/3 of the line width (approximately 0.03–0.1 mT), magnetic field scan width (mT) was adjusted to 25 times the line width (approximately 0.25–0.75 mT), and the magnetic field sweep time was 3 ms. The incident power fed and field modulation amplitude were adjusted so that the recorded spectral line shapes were not distorted. Signal accumulation was performed to improve the accuracy of the line width estimation.
Histological analysis
Histological analysis was performed as previously described [56]. Briefly, the gastrocnemius muscle was collected and fixed with 4% buffered formaldehyde, embedded in paraffin, and sectioned at 5‐μm thickness. Sectioned tissues were stained with hematoxylin and eosin (H&E) to determine muscle CSA. To calculate the mean CSA, 150 muscle fibers per mouse were evaluated using the imagej software (NIH, Bethesda, MD, USA).
Immunohistochemistry
SMS2 expression in hypoxic regions was analyzed using a fluorescent‐labeled antibody. Pimonidazole (Hypoxyprobe™ Kit, cat. no. HP1‐100KIT; HPI, Inc., Burlington, MA, USA) was administered 1 day after CLI to label the hypoxic regions. Gastrocnemius tissue was collected 1 h after pimonidazole administration (60 mg·kg−1; 100 μL; i.p.). Deparaffinized sections of gastrocnemius were subjected to antigen retrieval by Tris‐EDTA buffer (pH 9.0) and heated using a pressure cooker (120 Pa; 121 °C; 2.5 min). Slides were blocked using Blocking One‐Histo (cat. no. 06349‐64; Nacalai Tesque, Kyoto, Japan) at 27 °C for 30 min and incubated with the primary antibodies against SMS2 (cat. no. SAB2103374‐100UL; Sigma‐Aldrich; 1 : 100) and anti‐pimonidazole (cat. no. HP1‐100; HPI, Inc.; 1 : 50) at 4 °C overnight. The slides were washed with PBS and incubated with the secondary antibodies (Alexa Fluor 488 plus‐conjugated goat anti‐rabbit IgG or 594 plus‐conjugated goat anti‐mouse IgG [cat. no. A32731, A32742; Thermo Fisher Scientific, Waltham, MA, USA]) at 4 °C for 1 h. Then, the slides were washed with PBS and mounted using ProLong™ Gold antifade reagent with DAPI (cat. no. P36931; Thermo Fisher Scientific).
Immunohistochemistry for NFκB p65, CD86, and CD31 were analyzed using the enzyme‐labeled antibody method. Deparaffinized sections were subjected to antigen retrieval using citrate buffer (pH 6.0) and heated in a pressure cooker. The slides were treated with H2O2 for 20 min, followed by blocking with Blocking One‐Histo at 27 °C for 30 min. The primary antibodies (anti‐p65; cat. no. #8242; Cell Signaling Technology, Beverly, MA, USA; 1 : 2000, anti‐CD86; cat. no. #91882; Cell Signaling Technology; 1 : 200, anti‐CD31; cat. no. ab28364; Abcam, Cambridge, UK; 1 : 200) were incubated on the slides at 4 °C overnight. The slides were washed with PBS and incubated with HRP‐conjugated anti‐rabbit IgG or anti‐mouse IgG (cat. no. 414321, 414322; Nichirei Biosciences, Tokyo, Japan) at 27 °C for 30 min. The coloring reaction for the first antigen was performed using the DAB substrate kit (cat. no. SK‐4105; Vector Laboratories, Newark, CA, USA). The slides were then washed with PBS at 98 °C for 30 min to remove the binding antibodies and reacted with primary/secondary antibodies against the second antigen (anti‐Iba1; cat no. ab283346; Abcam; 1 : 7000; HRP‐conjugated anti‐rat IgG, cat no. 414341; Nichirei Biosciences). The coloring reaction for the secondary antigen was performed using a VIP Substrate kit (cat. no. SK‐4600; Vector Laboratories).
Thereafter, the samples on the slides were subjected to nuclear staining with Mayer's hematoxylin or methyl green and mounted using coverslips. The images were acquired and quantified using a BZ‐X700 microscope system (Keyence, Tokyo, Japan).
RNA interference
RNA interference was performed as previously described [56]. Briefly, siRNA‐mediated knockdown of Hif1a was performed using Opti‐MEM® (cat. no. 31985‐070; Thermo Fisher Scientific), lipofectamine RNAiMax (Thermo Fisher Scientific), and siRNAs. The siRNAs of mouse Hif1a (sense, 5′‐GACAAAGCUUCGCAGAAAUTT‐3′; anti‐sense, 5′‐AUUCUGCGAAGCUAUUGUCTT‐3′) and negative control siRNAs (cat. no. SIC‐002‐5) were obtained from Sigma‐Aldrich. C2C12 cells (1 × 10⁵ cells per 6‐well plate) were seeded and incubated for 2 days (80–90% confluence), and the medium was replaced with the differentiation medium. After the medium was changed, the cells were transfected with the siRNA complex (siRNA: 5 nm; RNAiMax: 2.2 μL per 6‐well plate). After 3 days of transfection, C2C12 myotubes were subjected to hypoxia for 24 or 48 h, and the cells were harvested for biochemical analysis.
Reverse transcription‐quantitative PCR
Reverse transcription‐quantitative PCR (RT‐qPCR) was performed as previously reported with some modifications [57]. Muscles and cells were lysed using RNAiso Plus (cat. no. 9109; Takara Bio, Shiga, Japan). Gastrocnemius samples were homogenized using a bead beater‐type homogenizer (μT‐12; Taitec Corporation, Saitama, Japan) at 3200 r.p.m. for 90 s with a steel bead (φ5 mm). After phase separation using chloroform, total RNA dissolved in the colorless supernatant was purified using a Tissue Total RNA Extraction Mini Kit (cat. no. FATEK 001‐2; Favorgen, Ping Tung, Taiwan) according to the manufacturer's instructions. The concentration of the extracted RNA was measured using a spectrophotometer (BioDrop LITE; Biochrom Ltd., Cambridge, UK). RNA (500 ng) was reverse‐transcribed using ReverTra Ace qPCR RT Master Mix with gDNA remover (cat. no. FSQ‐301; Toyobo, Osaka, Japan). Real‐time PCR was performed using a LightCycler 96 System with the FastStart Essential DNA Green Master Mix (cat. no 215392; Roche Molecular Systems, Inc., CA, USA). The PCR conditions were as follows: 95 °C for 10 min, followed by 40 cycles of 95 °C for 10 s, 60 °C for 10 s, and 72 °C for 15 s. The fluorescence intensity was measured at the end of the extension reaction of each cycle. Relative mRNA expression levels were calculated using the ΔΔC t method, and 18S ribosomal RNA (Rn18s) or TATA‐binding protein (Tbp) was used as an internal control. The primer sequences are listed in Table 1.
Table 1.
Primers used for reverse transcription–quantitative polymerase chain reaction analysis.
| Gene | Forward primer (5′–3′) | Reverse primer (3′–5′) |
|---|---|---|
| Mouse Tbp | TGACCTAAAGACCATTGCAC | CACCATTTTTCCAGAACTGA |
| Mouse Sgms1 | ATAGTTGGCACGCTGTACCT | AAAGAGCTTCGGAGAACAGT |
| Mouse Sgms2 | GGAGACTCTCAGGCAAAAAT | GACCAAGTGATACCACCAGA |
| Mouse Hif1a | CATTCCTCATCCGTCAAA | GCTCATAACCCATCAACTCA |
| Mouse Rn18s | TCAGTTATGGTTCCTTTGGT | CGTGGGCATGTATTAGCTCT |
| Mouse Tnf | CCAGGGACCTCTCTCTAATC | TTTGCTACAACATGGGCTAC |
| Mouse Il18 | AAAATGTCTACCCTCTCCTGT | ACTCCATCTTGTTGTGTCCT |
| Mouse Nlrp3 | TAAGAAGGACCAGCCAGAGT | GAGAGATATCCCAGCAAACC |
| Mouse Cd86 | TGGCAATCCTTATCTTTGTG | GGCTTATGTTTTGAGCCTTT |
| Mouse Pecam1 | CACTGGACCCTGGCTTTAC | CTGGCTTTGGTGAGGTTT |
| Mouse Vegfa | CAAGATGCTCCTGGCTCTG | GATGCTGTTGATGGTGAAGG |
SDS/PAGE and western blotting
For gastrocnemius tissues, samples were collected and lysed in modified RIPA buffer (50 mm Tris–HCl [pH 7.4], 150 mm NaCl, 1 mm EDTA, 1% NP‐40, 0.1% SDS, 0.1% sodium deoxycholate, a protease inhibitor cocktail [cat. no. 04693132001; Roche Molecular Systems], and a phosphatase inhibitor cocktail [cat. no. 04906837001; Roche Molecular Systems]). Gastrocnemius samples were homogenized using a bead beater‐type homogenizer as described above.
C2C12 myotubes were lysed in modified RIPA buffer containing 1% SDS, followed by sonication (on: 30 s; off: 3 s; five cycles) using a Bioruptor II (BM Equipment Co., Ltd., Tokyo, Japan) and an ultrasonic generator (Handy Sonic UR‐21P; cat. no. 4‐2187‐01; TOMY SEIKO Co. Ltd., Tokyo, Japan) for 10 s at 1 W.
Lysates were centrifuged at 15 000 g for 15 min at 4 °C, and the supernatants were collected as protein samples. Protein samples were quantified using the XL‐Bradford method (cat. no. KY‐1031; APRO Science Inc., Tokushima, Japan). Laemmli sample buffer (0.1875 m Tris–HCl [pH 6.8], 15%‐mercaptoethanol, 6% SDS, 30% glycerol, and 0.006% bromophenol blue) was added to the supernatant, and the samples were boiled for 3 min. Next, 10–20 μg of the protein was separated using 10% SDS/PAGE and transferred onto a polyvinylidene fluoride membrane (Immobilon‐P; Merck KGaA, Darmstadt, Germany). The transfer conditions were 100 V in Towbin buffer (25 mm Tris, 192 mm glycine, 1% SDS, and 20% methanol) at 4 °C for 60 min. The membrane was probed with primary antibodies diluted with TBST (10 mm Tris–HCl [pH 7.4], 0.1 m NaCl, and 0.1% Tween‐20) containing 5% bovine serum albumin (BSA) or non‐fat dry milk (NFDM) at 4 °C overnight. After probing with HRP‐conjugated secondary antibodies, bound antibodies were detected using Immobilon Forte Western HRP substrate (cat. no. WBLUF0500; Merck KGaA) and an iBright imaging system (Thermo Fisher Scientific). Densitometric analysis was performed using the imagej software. The antibodies used for western blotting are listed in Table 2.
Table 2.
Antibodies used for western blot analysis.
| Target | Blocking buffer | Dilution | Company (cat. no.) |
|---|---|---|---|
| SMS1 | 5% NFDM | 1 : 2000 in 5% NFDM | Proteintech (19050‐1‐AP) |
| SMS2 | 5% NFDM | 1 : 1000 in 5% BSA | Sigma‐Aldrich (WH0166929MB‐100UG) |
| HIF‐1α | 5% NFDM | 1 : 2500 in 5% NFDM | Cell Signaling Technology (#36169) |
| pSer32/36 IκBα | 5% NFDM | 1 : 2000 in 5% BSA | Cell Signaling Technology (#9246) |
| IκBα | 5% NFDM | 1 : 2000 in 5% BSA | Cell Signaling Technology (#4818) |
| P53 | 5% NFDM | 1 : 10 000 in 5% NFDM | Proteintech (60283‐2‐Ig) |
| pSer536 p65 | 5% NFDM | 1 : 2000 in 5% BSA | Cell Signaling Technology (#3033) |
| P65 | 5% NFDM | 1 : 5000 in 5% BSA | Cell Signaling Technology (#8242) |
| GAPDH | 5% NFDM | 1 : 50 000 in 5% NFDM | Proteintech (HRP‐60004) |
| β‐Actin | 5% NFDM | 1 : 200 000 in 5% NFDM | Sigma‐Aldrich (A3854) |
Sphingomyelin assay
The SM concentration was determined using an SM Quantification Colorimetric Assay Kit (cat. no. ab287856; Abcam), following the manufacturer's protocol. Briefly, 25 mg tissue or cells were lysed in 250 μL SM Assay buffer and homogenized as described in “SDS/PAGE and western blotting.” The samples were centrifuged at 4 °C for 5 min at 10 000 g , and the supernatant was collected. The supernatant (20 μL) was mixed with the same volume of SM Assay Buffer and subjected to incubation at 70 °C until it became cloudy (approximately 1–2 min). The sample was cooled at 27 °C and the heating steps were repeated. After centrifugation (27 °C; 2 min; 10 000 g ), the supernatant was mixed with 25 μL of the enzyme reaction mix and incubated at 37 °C for 1 h. Absorbance (570 nm) was measured using a microplate reader (MULTISCAN FC; cat. no. 51119000; Thermo Fisher Scientific).
Patient data analysis
RNA‐seq raw data were obtained using Gene Expression Omnibus under accession code GSE120642. Data sets were classified as non‐PAD controls, IC patients, and CLI patients. The diagnosis of IC and CLI was based on clinical characteristics and ankle‐brachial index. RNA‐seq data analysis was conducted using CLC Genomics Workbench v20.0 (Qiagen Digital Insights, Aarhus, Denmark), a software suite that provides various tools for next‐generation sequence analysis [3, 58].
Statistical analysis
Data are expressed as scatter or box‐whisker plots. The differences between the results of different groups were analyzed using an unpaired t‐test or two‐way ANOVA, followed by Tukey's multiple comparison test. Data were analyzed using prism 10 (GraphPad Software, San Diego, CA, USA).
Conflict of interest
The authors declare no conflict of interest.
Author contributions
MN contributed to conceptualization. HMiz, MN, NA, JK, WM, IY, TF, HS‐A, MK, PK, HY, OI, HMur, and YN contributed to methodology. HMiz, MN, HS‐A, MK, PK, HMur contributed to formal analysis and investigation. HS‐A, MK, PK, HY, OI, and HMur contributed to resources. HMiz contributed to writing – original draft preparation. MN and TY contributed to writing – review and editing. MN, PK, OI, and TY contributed to funding acquisition. All authors contributed to the conception and design of this study and approved the final version of the manuscript.
Peer review
The peer review history for this article is available at https://www.webofscience.com/api/gateway/wos/peer‐review/10.1111/febs.17379.
Acknowledgements
Some illustrations were created with BioRender.com. This work was supported by the Japan Society for the Promotion of Science (JSPS) KAKENHI grant numbers19K20452 (MN), 20KK0250 (OI), 23K05580 (TY), and 23H03539 (MN), and by the Center for Human and Animal Symbiosis Science (Azabu University). The oximetry measurements using the OxyChip were supported by NIH grant R01EB004031 (PK).
Data availability statement
The data that support the findings of this study are available from the corresponding author upon reasonable request.
References
- 1. McDermott MM, Ferrucci L, Gonzalez‐Freire M, Kosmac K, Leeuwenburgh C, Peterson CA, Saini S & Sufit R (2020) Skeletal muscle pathology in peripheral artery disease: a brief review. Arterioscler Thromb Vasc Biol 40, 2577–2585. [DOI] [PMC free article] [PubMed] [Google Scholar]
- 2. Uccioli L, Meloni M, Izzo V, Giurato L, Merolla S & Gandini R (2018) Critical limb ischemia: current challenges and future prospects. Vasc Health Risk Manag 14, 63–74. [DOI] [PMC free article] [PubMed] [Google Scholar]
- 3. Ryan TE, Yamaguchi DJ, Schmidt CA, Zeczycki TN, Shaikh SR, Brophy P, Green TD, Tarpey MD, Karnekar R, Goldberg EJ et al. (2018) Extensive skeletal muscle cell mitochondriopathy distinguishes critical limb ischemia patients from claudicants. JCI Insight 3, e123235. [DOI] [PMC free article] [PubMed] [Google Scholar]
- 4. Mohiuddin M, Lee NH, Moon JY, Han WM, Anderson SE, Choi JJ, Shin E, Nakhai SA, Tran T, Aliya B et al. (2019) Critical limb ischemia induces remodeling of skeletal muscle motor unit, myonuclear‐, and mitochondrial‐domains. Sci Rep 9, 9551. [DOI] [PMC free article] [PubMed] [Google Scholar]
- 5. Olea FD, Locatelli P, Hnatiuk A, De Lorenzi A, Valdivieso L, Rocha E, Ramírez R, Laguens R & Crottogini A (2015) Vascular endothelial growth factor overexpression does not enhance adipose stromal cell‐induced protection on muscle damage in critical limb ischemia. Arterioscler Thromb Vasc Biol 35, 184–188. [DOI] [PubMed] [Google Scholar]
- 6. Brooks PC (1996) Role of integrins in angiogenesis. Eur J Cancer 32A, 2423–2429. [DOI] [PubMed] [Google Scholar]
- 7. Kilarski WW, Samolov B, Petersson L, Kvanta A & Gerwins P (2009) Biomechanical regulation of blood vessel growth during tissue vascularization. Nat Med 15, 657–664. [DOI] [PubMed] [Google Scholar]
- 8. McDermott MM, Liu K, Tian L, Guralnik JM, Criqui MH, Liao Y & Ferrucci L (2012) Calf muscle characteristics, strength measures, and mortality in peripheral arterial disease: a longitudinal study. J Am Coll Cardiol 59, 1159–1167. [DOI] [PMC free article] [PubMed] [Google Scholar]
- 9. Snyder CM & Chandel NS (2009) Mitochondrial regulation of cell survival and death during low‐oxygen conditions. Antioxid Redox Signal 11, 2673–2683. [DOI] [PMC free article] [PubMed] [Google Scholar]
- 10. Shimizu T, Nagane M, Suzuki M, Yamauchi A, Kato K, Kawashima N, Nemoto Y, Maruo T, Kawakami Y & Yamashita T (2020) Tumor hypoxia regulates ganglioside GM3 synthase, which contributes to oxidative stress resistance in malignant melanoma. Biochim Biophys Acta Gen Subj 129723, 129723. [DOI] [PubMed] [Google Scholar]
- 11. Mühle C, Bilbao Canalejas RD & Kornhuber J (2019) Sphingomyelin synthases in neuropsychiatric health and disease. Neurosignals 27, 54–76. [DOI] [PubMed] [Google Scholar]
- 12. Bieberich E (2018) Sphingolipids and lipid rafts: novel concepts and methods of analysis. Chem Phys Lipids 216, 114–131. [DOI] [PMC free article] [PubMed] [Google Scholar]
- 13. Huitema K, van den Dikkenberg J, Brouwers JF & Holthuis JC (2004) Identification of a family of animal sphingomyelin synthases. EMBO J 23, 33–44. [DOI] [PMC free article] [PubMed] [Google Scholar]
- 14. Asano S, Kitatani K, Taniguchi M, Hashimoto M, Zama K, Mitsutake S, Igarashi Y, Takeya H, Kigawa J, Hayashi A et al. (2012) Regulation of cell migration by sphingomyelin synthases: sphingomyelin in lipid rafts decreases responsiveness to signaling by the CXCL12/CXCR4 pathway. Mol Cell Biol 32, 3242–3252. [DOI] [PMC free article] [PubMed] [Google Scholar]
- 15. Komuro M, Nagane M, Fukuyama T, Luo X, Hiraki S, Miyanabe M, Ishikawa M, Niwa C, Murakami H, Okamoto M et al. (2022) Sphingomyelin maintains the cutaneous barrier via regulation of the STAT3 pathway. FASEB J 36, e22111. [DOI] [PubMed] [Google Scholar]
- 16. Jin A, Cheng H, Xia L, Ye S & Yang C (2021) Inhibition of sphingomyelin synthase 2 relieves hypoxia‐induced cardiomyocyte injury by reinforcing Nrf2/ARE activation via modulation of GSK‐3β. Hum Exp Toxicol 40, 791–800. [DOI] [PubMed] [Google Scholar]
- 17. D'Angelo G, Moorthi S & Luberto C (2018) Role and function of sphingomyelin biosynthesis in the development of cancer. Adv Cancer Res 140, 61–96. [DOI] [PubMed] [Google Scholar]
- 18. Li Z, Hailemariam TK, Zhou H, Li Y, Duckworth DC, Peake DA, Zhang Y, Kuo MS, Cao G & Jiang XC (2007) Inhibition of sphingomyelin synthase (SMS) affects intracellular sphingomyelin accumulation and plasma membrane lipid organization. Biochim Biophys Acta 1771, 1186–1194. [DOI] [PMC free article] [PubMed] [Google Scholar]
- 19. Luberto C, Yoo DS, Suidan HS, Bartoli GM & Hannun YA (2000) Differential effects of sphingomyelin hydrolysis and resynthesis on the activation of NF‐kappa B in normal and SV40‐transformed human fibroblasts. J Biol Chem 275, 14760–14766. [DOI] [PubMed] [Google Scholar]
- 20. Adams JM, Pratipanawatr T, Berria R, Wang E, DeFronzo RA, Sullards MC & Mandarino LJ (2004) Ceramide content is increased in skeletal muscle from obese insulin‐resistant humans. Diabetes 53, 25–31. [DOI] [PubMed] [Google Scholar]
- 21. Donati C, Meacci E, Nuti F, Becciolini L, Farnararo M & Bruni P (2005) Sphingosine 1‐phosphate regulates myogenic differentiation: a major role for S1P2 receptor. FASEB J 19, 449–451. [DOI] [PubMed] [Google Scholar]
- 22. Tan‐Chen S, Guitton J, Bourron O, Le Stunff H & Hajduch E (2020) Sphingolipid metabolism and signaling in skeletal muscle: from physiology to physiopathology. Front Endocrinol (Lausanne) 11, 491. [DOI] [PMC free article] [PubMed] [Google Scholar]
- 23. Lee SM, Lee SH, Jung Y, Lee Y, Yoon JH, Choi JY, Hwang CY, Son YH, Park SS, Hwang GS et al. (2020) FABP3‐mediated membrane lipid saturation alters fluidity and induces ER stress in skeletal muscle with aging. Nat Commun 11, 5661. [DOI] [PMC free article] [PubMed] [Google Scholar]
- 24. Russell J, Carlin S, Burke SA, Wen B, Yang KM & Ling CC (2009) Immunohistochemical detection of changes in tumor hypoxia. Int J Radiat Oncol Biol Phys 73, 1177–1186. [DOI] [PMC free article] [PubMed] [Google Scholar]
- 25. Fan L, Li J, Yu Z, Dang X & Wang K (2014) The hypoxia‐inducible factor pathway, prolyl hydroxylase domain protein inhibitors, and their roles in bone repair and regeneration. Biomed Res Int 2014, 239356. [DOI] [PMC free article] [PubMed] [Google Scholar]
- 26. Debenham JS, Madsen‐Duggan C, Clements MJ, Walsh TF, Kuethe JT, Reibarkh M, Salowe SP, Sonatore LM, Hajdu R, Milligan JA et al. (2016) Discovery of N‐[bis(4‐methoxyphenyl)methyl]‐4‐hydroxy‐2‐(pyridazin‐3‐yl)pyrimidine‐5‐carboxamide (MK‐8617), an orally active pan‐inhibitor of hypoxia‐inducible factor prolyl hydroxylase 1‐3 (HIF PHD1‐3) for the treatment of anemia. J Med Chem 59, 11039–11049. [DOI] [PubMed] [Google Scholar]
- 27. Duff S, Mafilios MS, Bhounsule P & Hasegawa JT (2019) The burden of critical limb ischemia: a review of recent literature. Vasc Health Risk Manag 15, 187–208. [DOI] [PMC free article] [PubMed] [Google Scholar]
- 28. Appelhoff RJ, Tian YM, Raval RR, Turley H, Harris AL, Pugh CW, Ratcliffe PJ & Gleadle JM (2004) Differential function of the prolyl hydroxylases PHD1, PHD2, and PHD3 in the regulation of hypoxia‐inducible factor. J Biol Chem 279, 38458–38465. [DOI] [PubMed] [Google Scholar]
- 29. Ivan M, Kondo K, Yang H, Kim W, Valiando J, Ohh M, Salic A, Asara JM, Lane WS & Kaelin WG (2001) HIFalpha targeted for VHL‐mediated destruction by proline hydroxylation: implications for O2 sensing. Science 292, 464–468. [DOI] [PubMed] [Google Scholar]
- 30. Ullah K, Rosendahl AH, Izzi V, Bergmann U, Pihlajaniemi T, Mäki JM & Myllyharju J (2017) Hypoxia‐inducible factor prolyl‐4‐hydroxylase‐1 is a convergent point in the reciprocal negative regulation of NF‐κB and p53 signaling pathways. Sci Rep 7, 17220. [DOI] [PMC free article] [PubMed] [Google Scholar]
- 31. Rodriguez J, Herrero A, Li S, Rauch N, Quintanilla A, Wynne K, Krstic A, Acosta JC, Taylor C, Schlisio S et al. (2018) PHD3 regulates p53 protein stability by hydroxylating proline 359. Cell Rep 24, 1316–1329. [DOI] [PMC free article] [PubMed] [Google Scholar]
- 32. Itahana Y, Zhang J, Göke J, Vardy LA, Han R, Iwamoto K, Cukuroglu E, Robson P, Pouladi MA, Colman A et al. (2016) Histone modifications and p53 binding poise the p21 promoter for activation in human embryonic stem cells. Sci Rep 6, 28112. [DOI] [PMC free article] [PubMed] [Google Scholar]
- 33. Cockman ME, Lippl K, Tian YM, Pegg HB, Figg WD, Abboud MI, Heilig R, Fischer R, Myllyharju J, Schofield CJ et al. (2019) Lack of activity of recombinant HIF prolyl hydroxylases (PHDs) on reported non‐HIF substrates. Elife 8, e46490. [DOI] [PMC free article] [PubMed] [Google Scholar]
- 34. Cummins EP, Berra E, Comerford KM, Ginouves A, Fitzgerald KT, Seeballuck F, Godson C, Nielsen JE, Moynagh P, Pouyssegur J et al. (2006) Prolyl hydroxylase‐1 negatively regulates IkappaB kinase‐beta, giving insight into hypoxia‐induced NFkappaB activity. Proc Natl Acad Sci USA 103, 18154–18159. [DOI] [PMC free article] [PubMed] [Google Scholar]
- 35. Guo J, Chakraborty AA, Liu P, Gan W, Zheng X, Inuzuka H, Wang B, Zhang J, Zhang L, Yuan M et al. (2016) pVHL suppresses kinase activity of Akt in a proline‐hydroxylation‐dependent manner. Science 353, 929–932. [DOI] [PMC free article] [PubMed] [Google Scholar]
- 36. Taniguchi M & Okazaki T (2014) The role of sphingomyelin and sphingomyelin synthases in cell death, proliferation and migration‐from cell and animal models to human disorders. Biochim Biophys Acta 1841, 692–703. [DOI] [PubMed] [Google Scholar]
- 37. Ahn Y, Kim MG, Jo K, Hong KB & Suh HJ (2022) Effects of sphingomyelin‐containing milk phospholipids on skin hydration in UVB‐exposed hairless mice. Molecules 27, 2545. [DOI] [PMC free article] [PubMed] [Google Scholar]
- 38. Haruta‐Ono Y, Setoguchi S, Ueno HM, Higurashi S, Ueda N, Kato K, Saito T, Matsunaga K & Takata J (2012) Orally administered sphingomyelin in bovine milk is incorporated into skin sphingolipids and is involved in the water‐holding capacity of hairless mice. J Dermatol Sci 68, 56–62. [DOI] [PubMed] [Google Scholar]
- 39. Iqbal J, Walsh MT, Hammad SM & Hussain MM (2017) Sphingolipids and lipoproteins in health and metabolic disorders. Trends Endocrinol Metab 28, 506–518. [DOI] [PMC free article] [PubMed] [Google Scholar]
- 40. Li Z, Fan Y, Liu J, Li Y, Huan C, Bui HH, Kuo MS, Park TS, Cao G & Jiang XC (2012) Impact of sphingomyelin synthase 1 deficiency on sphingolipid metabolism and atherosclerosis in mice. Arterioscler Thromb Vasc Biol 32, 1577–1584. [DOI] [PMC free article] [PubMed] [Google Scholar]
- 41. Hailemariam TK, Huan C, Liu J, Li Z, Roman C, Kalbfeisch M, Bui HH, Peake DA, Kuo MS, Cao G et al. (2008) Sphingomyelin synthase 2 deficiency attenuates NFkappaB activation. Arterioscler Thromb Vasc Biol 28, 1519–1526. [DOI] [PubMed] [Google Scholar]
- 42. Liu T, Zhang L, Joo D & Sun SC (2017) NF‐κB signaling in inflammation. Signal Transduct Target Ther 2, 17023. [DOI] [PMC free article] [PubMed] [Google Scholar]
- 43. Watts ER & Walmsley SR (2019) Inflammation and hypoxia: HIF and PHD isoform selectivity. Trends Mol Med 25, 33–46. [DOI] [PubMed] [Google Scholar]
- 44. Luo Z, Tian M, Yang G, Tan Q, Chen Y, Li G, Zhang Q, Li Y, Wan P & Wu J (2022) Hypoxia signaling in human health and diseases: implications and prospects for therapeutics. Signal Transduct Target Ther 7, 218. [DOI] [PMC free article] [PubMed] [Google Scholar]
- 45. Yang Y, Hu F, Yang G & Meng Q (2020) Lack of sphingomyelin synthase 2 reduces cerebral ischemia/reperfusion injury by inhibiting microglial inflammation in mice. Exp Ther Med 20, 241. [DOI] [PMC free article] [PubMed] [Google Scholar]
- 46. Tu R, Yang W & Hu Z (2016) Inhibition of sphingomyelin synthase 1 affects ceramide accumulation and hydrogen peroxide‐induced apoptosis in neuro‐2a cells. Neuroreport 27, 967–973. [DOI] [PubMed] [Google Scholar]
- 47. Mitsutake S, Zama K, Yokota H, Yoshida T, Tanaka M, Mitsui M, Ikawa M, Okabe M, Tanaka Y, Yamashita T et al. (2011) Dynamic modification of sphingomyelin in lipid microdomains controls development of obesity, fatty liver, and type 2 diabetes. J Biol Chem 286, 28544–28555. [DOI] [PMC free article] [PubMed] [Google Scholar]
- 48. Ministro A, de Oliveira P, Nunes RJ, Dos Santos Rocha A, Ferreira T, Goyri‐O'Neill J & Rosa Santos SC (2019) Assessing therapeutic angiogenesis in a murine model of hindlimb ischemia. J Vis Exp. doi: 10.3791/59582 [DOI] [PubMed] [Google Scholar]
- 49. Assina R, Sankar T, Theodore N, Javedan SP, Gibson AR, Horn KM, Berens M, Sonntag VK & Preul MC (2008) Activated autologous macrophage implantation in a large‐animal model of spinal cord injury. Neurosurg Focus 25, E3. [DOI] [PubMed] [Google Scholar]
- 50. Blank A, Halevy R, Shklyar M, Shtirberg L & Kuppusamy P (2010) ESR micro‐imaging of LiNc‐BuO crystals in PDMS: spatial and spectral grain distribution. J Magn Reson 203, 150–155. [DOI] [PubMed] [Google Scholar]
- 51. Pandian RP, Parinandi NL, Ilangovan G, Zweier JL & Kuppusamy P (2003) Novel particulate spin probe for targeted determination of oxygen in cells and tissues. Free Radic Biol Med 35, 1138–1148. [DOI] [PubMed] [Google Scholar]
- 52. Sato‐Akaba H, Emoto MC, Hirata H & Fujii HG (2017) Design and testing of a 750MHz CW‐EPR digital console for small animal imaging. J Magn Reson 284, 48–58. [DOI] [PubMed] [Google Scholar]
- 53. Sato‐Akaba H & Tseytlin M (2019) Development of an L‐band rapid scan EPR digital console. J Magn Reson 304, 42–52. [DOI] [PMC free article] [PubMed] [Google Scholar]
- 54. Sato‐Akaba H, Okada Y, Tsuji K, Emoto MC & Fujii HG (2021) Design and fabrication of compact arrayed magnet for biological EPR imaging. Appl Magn Reson 52, 1017–1029. [Google Scholar]
- 55. Kmiec MM, Tse D, Mast JM, Ahmad R & Kuppusamy P (2019) Implantable microchip containing oxygen‐sensing paramagnetic crystals for long‐term, repeated, and multisite in vivo oximetry. Biomed Microdevices 21, 71. [DOI] [PubMed] [Google Scholar]
- 56. Nagane M, Kanai E, Shibata Y, Shimizu T, Yoshioka C, Maruo T & Yamashita T (2018) Sulfasalazine, an inhibitor of the cystine‐glutamate antiporter, reduces DNA damage repair and enhances radiosensitivity in murine B16F10 melanoma. PLoS One 13, e0195151. [DOI] [PMC free article] [PubMed] [Google Scholar]
- 57. Nagane M, Yasui H, Yamamori T, Zhao S, Kuge Y, Tamaki N, Kameya H, Nakamura H, Fujii H & Inanami O (2013) Radiation‐induced nitric oxide mitigates tumor hypoxia and radioresistance in a murine SCCVII tumor model. Biochem Biophys Res Commun 437, 420–425. [DOI] [PubMed] [Google Scholar]
- 58. Cong G, Cui X, Ferrari R, Pipinos II, Casale GP, Chattopadhyay A & Sachdev U (2020) Fibrosis distinguishes critical limb ischemia patients from claudicants in a transcriptomic and histologic analysis. J Clin Med 9, 3974. [DOI] [PMC free article] [PubMed] [Google Scholar]
Associated Data
This section collects any data citations, data availability statements, or supplementary materials included in this article.
Data Availability Statement
The data that support the findings of this study are available from the corresponding author upon reasonable request.