For clinicians to use a diagnostic test in clinical practice, they need to know how well the test distinguishes between those who have the suspected disease or condition and those who do not. If investigators choose clinically inappropriate populations for their study of a diagnostic test and thereby introduce what is sometimes called spectrum bias, the results may seriously mislead clinicians.
In this article we present a series of examples that illustrate why clinicians need to pay close attention to the populations enrolled in studies of diagnostic test performance before they apply the results of those studies to their own patients. After working through these examples, you should understand which characteristics of a study population are likely to result in misleading interpretations of test results and which are not.
The tips in this article are adapted from approaches developed by educators with experience in teaching evidence-based medicine principles to clinicians.1,2 A related article, intended for people who teach these concepts to clinicians, is available online at www.cmaj.ca/cgi/content/full/173/4/385/DC1.
Clinician learners' objectives
“Ideal” spectrum of disease.
Understand the importance of spectrum of disease in the evaluation of diagnostic test characteristics.
Prevalence, spectrum and test characteristics.
Understand the lack of impact of disease prevalence on sensitivity, specificity and likelihood ratios.
Understand the impact of disease prevalence or likelihood on the probability of the target condition (post-test probability) after test results are available.
Tip 1: “Ideal” spectrum of disease
Let's consider a clinical example that illustrates the concept of “disease spectrum” in relation to diagnostic tests. Brain natriuretic peptide (BNP) is a hormone secreted by the ventricles in the heart in response to expansion. Plasma levels of BNP increase when acute or chronic congestive heart failure is present. Consequently, investigators have suggested using BNP levels to distinguish congestive heart failure from other causes of acute dyspnea among patients presenting to emergency departments.3
One highly publicized study reported promising results using a BNP cutoff point of 100 pg/mL.4,5 This cutoff point means that patients with BNP levels greater than 100 pg/mL are considered to have a “positive” test result for congestive heart failure and those with levels below this threshold are considered to have a “negative” test result. The investigators compared the number of diagnoses of congestive heart failure using BNP levels with those using a criterion standard (or “gold standard”) defined by established clinical and imaging criteria. Commentaries have challenged the investigators' estimates of the sensitivity and specificity of the BNP test at the proposed cutoff point on the basis that clinicians were already confident with respect to the likelihood of congestive heart failure in most of the patients in the study.6,7
Ideally, the ability of a test to correctly identify patients with and without a particular disease would not vary between patients. However, if you are a clinician, you already intuitively understand that a test may perform better when it is used to evaluate patients with more severe disease than it would with patients whose disease is less advanced and less obvious. You also appreciate that diagnostic tests are not needed when the disease is either clinically obvious or sufficiently unlikely that you need not seriously consider it.
A study of the performance of a diagnostic test involves performing that test on patients with and without the disease or condition of interest together with a second test or investigation that we will call the “criterion standard.” We accept the results of the second test as the criterion by which the results of the test under investigation are assessed.
In designing such a study, investigators sometimes choose both patients in whom the disease is unequivocally advanced and patients who are unequivocally free of disease, such as healthy, asymptomatic volunteers. This approach ensures the validity of the criterion standard and may be appropriate in the early stages of developing a test. However, any study done with a population that lacks diagnostic uncertainty may produce a biased estimate of a test's performance relative to that produced by a study restricted to patients for whom the test would be clinically indicated.
Returning to the use of BNP levels to test for congestive heart failure among patients with acute dyspnea, consider Fig. 1. The horizontal axis represents increasing values of BNP. The 2 bell curves constitute hypothetical probability density plots of the distribution of BNP values among patients with and without congestive heart failure.8 The height at any point in either curve reflects the proportion of emergency patients in the particular subgroup with the corresponding BNP value. Aside from the choice of cutoff value, this figure does not reflect the results of any actual study.
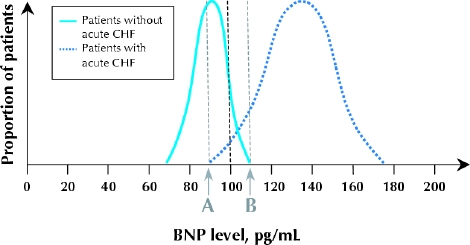
Fig. 1: Hypothetical probability density distributions of measured plasma brain natriuretic peptide (BNP) levels in 2 subgroups of a study population. The cutoff point for a diagnosis of congestive heart failure (CHF) is 100 pg/mL. Patients with a negative test result for CHF (left-hand curve) are younger, with known asthma and no risk factors for CHF. The patients with confirmed CHF are older, and the disease is clinically severe and unequivocal. Clinicians in the emergency department have little uncertainty regarding the cause of dyspnea in any of these patients.
The bell curve on the left in Fig. 1 represents the hypothetical distribution of BNP values in a group of young patients with known asthma and no risk factors for congestive heart failure. They will tend to have low levels of circulating BNP. The bell curve on the right represents the distribution of BNP values among older patients with unequivocal and severe congestive heart failure. Such patients will have test results clustered on the high end of the scale.
If Fig. 1 accurately represented the performance of the BNP test in distinguishing between all patients with and without congestive heart failure as the cause of their symptoms, the test would be very useful. The 2 curves demonstrate very little overlap. For BNP values below 90 pg/mL (point A), no patients have congestive heart failure, and for BNP values above 110 pg/mL (point B), all patients have congestive heart failure. This means, assuming that Fig. 1reflects reality, that you can be completely certain about the diagnosis for all people with BNP values below 90 pg/mL or above 110 pg/mL. Only for patients whose BNP values are between 90 and 110 pg/mL is there residual uncertainty about their likelihood of congestive heart failure.
However, before you embrace a test on the basis of its performance among patients in whom the presence or absence of disease is unequivocal, you need to consider the likely distribution of test results in a population of patients for whom you would be less certain.
In Fig. 2, imagine that the entire study population is made up of middle-aged patients, all of whom have chronic congestive heart failure and recurrent asthma. The distributions of BNP values in the subgroups with and without acute congestive heart failure are both much closer to the middle of the range. The extent of the overlap of the curves between points A and B is much greater, which means that there is residual uncertainty about the disease status of a large proportion of the patients even after the BNP test has been performed.
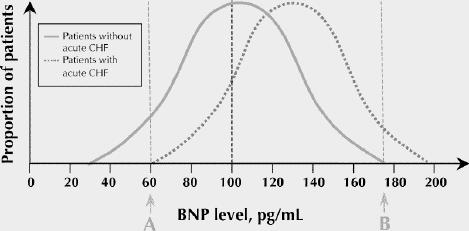
Fig. 2: These hypothetical probability density distributions reflect a study population of middle-aged patients who all have recurrent asthma and chronic CHF. The patients whose dyspnea is caused by asthma exacerbations look clinically similar to those whose symptoms are caused by acute CHF.
It may be helpful to note that the sensitivity of the BNP test at a cutoff value of 100 pg/mL (the proportion of patients with acute congestive heart failure whose BNP level is greater than 100 pg/mL) is defined in Fig. 1 and Fig. 2 as the percentage of the total area of the right-hand curve that lies to the right of the cutoff value. Notice that this percentage is markedly lower in Fig. 2 than in Fig. 1. The same is true of specificity, which is the proportion of patients without acute congestive heart failure whose BNP level is less than 100 pg/mL. This is defined in the figures as the proportion of the left-hand curve that lies to the left of the cutoff point. Again this percentage is appreciably lower in Fig. 2 compared with Fig. 1.
These theoretical concerns play out (albeit with a lesser magnitude of impact than depicted in Fig. 1 and Fig. 2) in studies of the BNP test as a diagnostic tool. In the BNP study to which we have referred, the sensitivity and specificity of the test using the 100 pg/mL cut-off were 90% and 76% respectively when all patients were included.4 Only about 25% of the study population were judged by the treating physicians to be in the intermediate range of probability of acute congestive heart failure.5 When only patients in this subgroup were considered in a number of studies, the sensitivity and specificity of the BNP test at a cutoff point of 100 pg/mL were only 88% and 55% respectively.7
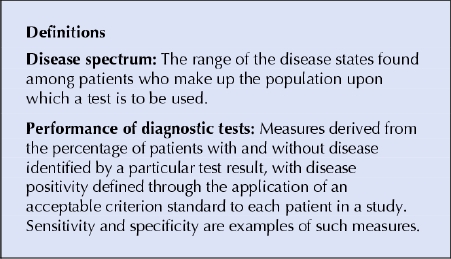
The range of disease states found among the patients in the population upon which a test is to be used is commonly referred to as “disease spectrum.” In making your final assessment on the value of a test, consider the spectrum of the disease or condition in which you are interested. You don't need to differentiate healthy patients from patients with severe disease. Rather, you must differentiate those who have the disease from those who do not among all those who appear as if they might have it. The “right” population for a diagnostic test study includes (1) those in whom we are uncertain of the diagnosis; (2) those in whom we will use the test in clinical practice to resolve our uncertainty; and (3) patients with the disease who have a wide spectrum of severity and patients without the disease who have symptoms commonly associated with it.
Readers familiar with the concept and interpretation of likelihood ratios for diagnostic test results1 may find it useful to note that the likelihood ratio for any given test value is represented by the respective height of the curves at that point on the horizontal axis (Fig. 3). The point on the horizontal axis below the intersection of the 2 curves is the test result with a likelihood ratio of 1. Fig. 3 also identifies test values corresponding to likelihood ratios of 0.25 and 4. Comparing Fig. 1 and Fig. 2 once more, you will notice that the relative heights of the 2 curves, and hence the likelihood ratios, corresponding to a given BNP level will change as the curves move closer together and the area of overlap increases.
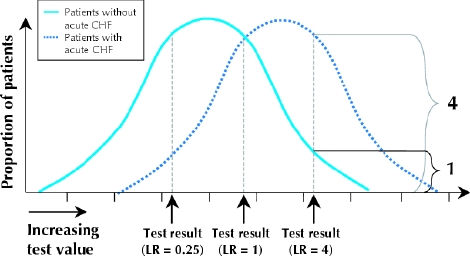
Fig. 3: Likelihood ratios (LRs) and spectrum of disease. The likelihood ratio of a test result represented by a point on the horizontal line is the height of the right-hand bell curve (patients with the disease of interest) divided by the height of the left-hand bell curve (patients without the disease of interest) at that point.
The bottom line.
Test performance will vary with the spectrum of disease within a study population.9
The sensitivity and specificity of a test, when it is used to differentiate patients who obviously do not have the disease from patients who obviously do, likely overestimate its performance when the test is applied in a clinical context characterized by diagnostic uncertainty.
Tip 2: Prevalence, spectrum and test characteristics
You may have learned the rule of thumb that post-test probabilities (which are closely related to predictive values) vary with disease prevalence, but sensitivities, specificities and likelihood ratios do not. Is this true? The answer is “yes,” provided that disease spectrum remains the same in high- and low-prevalence populations. In the discussion that follows, for purposes of simplicity, we use the term “prevalence” to denote the likelihood that any patient randomly selected from the study population has the disease or condition as defined by the criterion standard. This is not the same thing as the probability of disease in any individual patient.
Referring once again to Fig. 1, let's consider 3 cases. In the first, we'll assume that there were 1000 patients in each subgroup: 1000 in whom congestive heart failure was unequivocally the cause of their dyspnea and 1000 in whom asthma was almost certainly the cause. The prevalence of congestive heart failure is 50%. Each bell curve corresponds to the distribution of BNP values within the respective subgroup. Now consider a second case, where there are 2000 older patients with severe congestive heart failure and 1000 younger patients with recurrent asthma and no risk factors for congestive heart failure. The prevalence of congestive heart failure is 67%. Finally, consider a third case, where 2000 patients with asthma and 1000 patients with severe congestive heart failure are studied. The prevalence of congestive heart failure is 33%.
In each case the height of either curve corresponding to any particular BNP level still corresponds to the proportion of patients with that test value in that group. Changes in the total number of patients will not alter these proportions, and the performance of the test, as measured by sensitivity, specificity or likelihood ratios, will be unaffected.
The performance of the BNP test in identifying patients with and without acute congestive heart failure remained the same. Hence, when the spectrum remains the same, the prevalence of congestive heart failure within the study population is irrelevant to the estimation of test characteristics.
Let's take a different clinical example. The ICON urine test for pregnancy (Beckman Coulter, Inc., Fullerton, Calif.) has a very high sensitivity and specificity when performed later than 2 weeks postconception.10
It is a qualitative, and inherently dichotomized, test: both clinicians and patients recognize that it is not possible to be “a little bit pregnant.” In short, although estimates of performance values for the ICON test vary in the literature,11,12 the performance of the test in detecting pregnancy is likely to be uniform if the percentage of subjects who are less than 2 weeks postconception does not vary.
For the purpose of our demonstration, let's assume that ICON test results are positive in 95% of women who are pregnant and negative in 99% of women who are not. Fig. 4 shows the sensitivity and specificity of the test when it is administered in 3 different geographic locations with high, moderate and low population growth and where the proportion of women presenting within 2 weeks of conception is constant. Again, for simplicity, we are considering only the prevalence of pregnancy in the population being studied — in other words, the percentage of women tested who are pregnant. A practitioner might estimate the probability of pregnancy in an individual patient to be higher or lower than this on the basis of clinical features such as use of birth control methods, history of recent sexual activity and past history of gynecologic disease. As Fig. 4 shows, the prevalence of pregnancy in the population has no effect on the estimation of test characteristics.
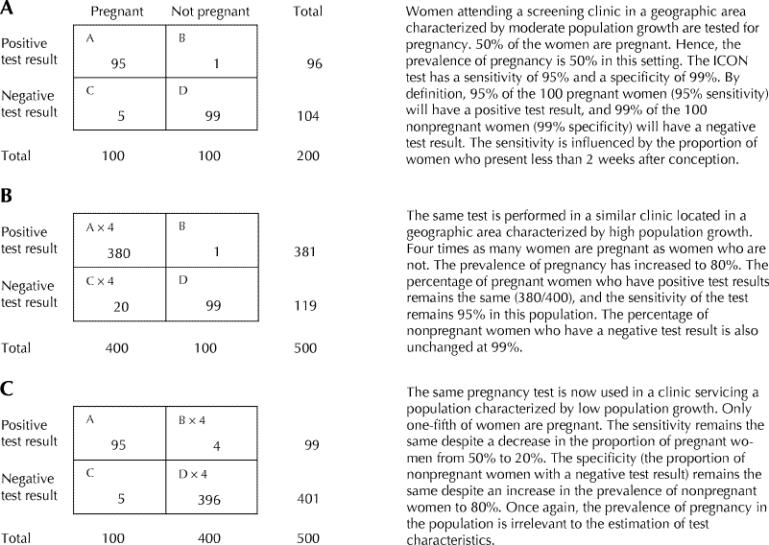
Fig. 4: Changes in disease prevalence have no effect on diagnostic test characteristics.
There are many examples of conditions that may present with equal severity in people with different demographic characteristics (age, sex, ethnicity) but that are much more prevalent in one group than in another. Mild osteoarthritis of the knee is rare among young patients but common among older patients. Asymptomatic thyroid abnormalities are rare among men but common among women. In both examples, diagnostic tests will have the same sensitivity, specificity and likelihood ratios in young and old patients and in men and women respectively.
However, higher prevalence will result in a higher proportion of those with a positive test result who do in fact have the disease for which they are being tested. Referring to Fig. 4, in the population with a lower prevalence of pregnancy, 95 of 99 women (96%) with positive test results are pregnant (Fig. 4C) compared with 380 of 381 women (99.7%) in the population with a higher prevalence (Fig. 4B). The likelihood of the condition or disease among patients who have a positive test result is sometimes referred to as the predictive value of a test. The predictive value corresponds with the post-test probability of the disease when the test result is positive. Unlike sensitivity, specificity or likelihood ratios, predictive values are strongly influenced by changes in prevalence in the population being tested.
Although differences in prevalence alone should not affect the sensitivity or specificity of a test, in many clinical settings disease prevalence and severity may be related. For instance, rheumatoid arthritis seen in a family physician's office will be relatively uncommon, and most patients will have a relatively mild case. In contrast, rheumatoid arthritis will be common in a rheumatologist's office, and patients will tend to have relatively severe disease. Tests to diagnose rheumatoid arthritis in the rheumatologist's waiting area (e.g., hand inspection for joint deformity) are likely to be relatively more sensitive not because of the increased prevalence but because of the spectrum of disease present (e.g., degree and extent of joint deformity) in this setting.
The bottom line.
Disease prevalence has no direct effect on test characteristics (e.g., likelihood ratios, sensitivity, and specificity).
Spectrum of disease and disease prevalence have different effects on diagnostic test characteristics.
Conclusions
Clinicians need to understand how and when the choice of patients for a diagnostic test study may affect the performance of the test. Both disease spectrum in patients with the condition of interest and the spectrum of competing conditions in patients without the condition of interest can affect the test's apparent diagnostic power. Despite the potentially powerful impact of disease spectrum and competing conditions, changes in prevalence that do not reflect changes in spectrum will not alter test performance.
Figure.

Figure.
Articles to date in this series .
Barratt A, Wyer PC, Hatala R, McGinn T, Dans AL, Keitz S, et al. Tips for learners of evidence-based medicine: 1. Relative risk reduction, absolute risk reduction and number needed to treat. CMAJ 2004;171(4):353-8.
Montori VM, Kleinbart J, Newman TB, Keitz S, Wyer PC, Moyer V, et al. Tips for learners of evidence-based medicine: 2. Measures of precision (confidence intervals). CMAJ 2004;171(6):611-5.
McGinn T, Wyer PC, Newman TB, Keitz S, Leipzig R, Guyatt G, et al. Tips for learners of evidence-based medicine: 3. Measures of observer variability (kappa statistic). CMAJ 2004;171(11):1369-73.
Hatala R, Keitz S, Wyer P, Guyatt G; for the Evidence-Based Medicine Teaching Tips Working Group. Tips for learners of evidence-based medicine: 4. Assessing heterogeneity of primary studies in systematic reviews and whether to combine their results. CMAJ 2005;172(5):661-5.
Supplementary Material
Footnotes
This article has been peer reviewed.
Contributors: Victor Montori, as principal author, oversaw and contributed to the writing of the manuscript. Thomas Newman reviewed the manuscript at all phases of development and contributed to the writing as coauthor of tip 2. Sheri Keitz used all tips as part of a live teaching exercise and submitted comments, suggestions and the possible variations that are reported in the manuscript. Peter Wyer reviewed and revised the final draft of the manuscript to achieve uniform adherence with format specifications. Gordon Guyatt developed the original idea for tips 1 and 2, reviewed the manuscript at all phases of development, contributed to the writing as coauthor, and reviewed and revised the final draft of the manuscript to achieve accuracy and consistency of content as general editor.
Competing interests: None declared.
Correspondence to: Dr. Peter C. Wyer, 446 Pelhamdale Ave., Pelham NY 10804; fax 212 305-6792; pwyer@att.net
References
- 1.Jaeschke R, Guyatt G, Lijmer J. Diagnostic tests. In: Guyatt G, Rennie D, editors. Users' guides to the medical literature: a manual for evidence-based clinical practice. Chicago: AMA Press; 2002. p. 121-40.
- 2.Wyer P, Keitz S, Hatala R, Hayward R, Barratt A, Montori V, et al. Tips for learning and teaching evidence-based medicine: introduction to the series. CMAJ 2004;171(4):347-8. [DOI] [PMC free article] [PubMed]
- 3.Dao Q, Krishnaswamy P, Kazanegra R, Harrison A, Amirnovin R, Lenert L, et al. Utility of B-type natriuretic peptide in the diagnosis of congestive heart failure in an urgent-care setting. J Am Coll Cardiol 2001;37:379-85. [DOI] [PubMed]
- 4.Maisel AS, Krishnaswamy P, Nowak RM, McCord J, Hollander JE, Duc P, et al.; Breathing Not Properly Multinational Study Investigators. Rapid measurement of B-type natriuretic peptide in the emergency diagnosis of heart failure. N Engl J Med 2002;347:161-7. [DOI] [PubMed]
- 5.McCullough PA, Nowak RM, McCord J, Hollander JE, Herrmann HC, Steg PG, et al. B-type natriuretic peptide and clinical judgment in emergency diagnosis of heart failure: analysis from Breathing Not Properly (BNP) Multinational Study. Circulation 2002;106:416-22. [DOI] [PubMed]
- 6.Hohl CM, Mitelman BY, Wyer P, Lang E. Should emergency physicians use B-type natriuretic peptide testing in patients with unexplained dyspnea? Can J Emerg Med 2003;5:162-5. [DOI] [PubMed]
- 7.Schwam E. B-type natriuretic peptide for diagnosis of heart failure in emergency department patients: a critical appraisal. Acad Emerg Med 2004;11:686-91. [PubMed]
- 8.Tandberg D, Deely JJ, O'Malley AJ. Generalized likelihood ratios for quantitative diagnostic test scores. Am J Emerg Med 1997;15:694-9. [DOI] [PubMed]
- 9.Lijmer JG, Mol BW, Heisterkamp S, Bonsel GJ, Prins MH, van der Meulen JH, et al. Empirical evidence of design-related bias in studies of diagnostic tests. JAMA 1999;282:1061-6. [DOI] [PubMed]
- 10.Product insert. Available: www.beckman.com/literature/ClinDiag/08109.D.pdf (accessed 13 Jul 2005).
- 11.Lauszus FF. Clinical trial of 2 highly sensitive pregnancy tests — Tandem ICON HCG-urine and OPCO On-step Pacific Biotech. Ugeskr Laeger 1992;154:2069-70. [PubMed]
- 12.Mishalani SH, Seliktar J, Braunstein GD. Four rapid serum–urine combination assays of choriogonadotropin (hCG) compared and assesed for their utility in quantitative determinations of hCG. Clin Chem 1994;40:1944-99. [PubMed]
Associated Data
This section collects any data citations, data availability statements, or supplementary materials included in this article.


