

Abstract
Polysaccharide quantification plays a vital role in understanding ecological and nutritional processes in microbes, plants, and animals. Traditional methods typically hydrolyze these large molecules into monomers using chemical methods, but such approaches do not work for all polysaccharides. Enzymatic degradation is a promising alternative but typically requires the use of characterized recombinant enzymes or characterized microbial isolates that secrete enzymes. In this study, we introduce a versatile method that employs undefined enzyme cocktails secreted by individual microbes or complex environmental microbial communities for the hydrolysis of polysaccharides. We focus on colloidal chitin and laminarin as representative polysaccharides of ecological relevance. Our results demonstrate that colloidal chitin can be effectively digested with an enzyme cocktail derived from a chitin-degrading Psychromonas sp. isolate. Utilizing a 3,5-dinitrosalicylic acid reducing sugar assay or liquid chromatography-mass spectrometry for monomer and oligomer detection, we successfully determined chitin concentrations as low as 62 and 15 mg/l, respectively. This allows for effective monitoring of microbial chitin degradation. To extend the applicability of our method, we also leveraged complex, undefined microbial communities as sources of enzyme cocktails capable of degrading laminarin. With this approach, we achieved a detection limit of 30 mg/l laminarin through the reducing sugar assay. Our findings highlight the potential of utilizing enzyme cocktails from both individual microbes and, notably, from undefined microbial communities for polysaccharide quantification. This advancement addresses limitations associated with traditional chemical hydrolysis methods.
Keywords: polysaccharide, chitin, laminarin, enzyme assay
Introduction
Polysaccharides play vital roles in various functions, such as energy storage molecules [1], structuring cell walls [2], and biofilms [3], and supplying carbon to microbial communities [4–6]. Quantifying these polysaccharides is essential for studying their biological processes; however, their diverse chemical properties pose challenges in developing universally applicable quantification methods. The predominant methodologies for polysaccharide quantification involve hydrolyzing these complex molecules into monosaccharides, which are then quantified using colorimetric or chromatographic techniques [5, 7–9]. Typically, this hydrolysis is conducted through chemical or enzymatic methods. One major limitation of chemical hydrolysis is its inefficacy across different polysaccharides, which may yield varying results or remain non-hydrolyzed [5]. Additionally, the harsh conditions employed in acid hydrolysis can damage acid-sensitive components [10, 11]. A notable example of a polysaccharide resistant to acid hydrolysis is chitin, a linear homopolymer of β-(1,4)-linked N-acetylglucosamine (GlcNAc) monomers [12]. Chitin is the main constituent of mollusk and arthropod exoskeletons in marine environments [13], making it one of the ocean’s most prevalent polysaccharides. While chitin can be deacetylated into chitosan to facilitate acid hydrolysis to glucosamine [14], this approach is time-consuming and not suitable for microtiter plate formats.
On the other hand, enzymatic degradation presents a viable alternative for quantifying polysaccharides [8, 15–17], especially those resistant to chemical hydrolysis. Enzymes produce specific degradation products that help identify particular polysaccharides in complex mixtures [15]. Nonetheless, a challenge in this approach lies in the difficulty of identifying enzymes with the desired activity. For instance, chitin can be quantified using commercial chitinases [18] or those extracted from seeds [19], but these sources are often hard to obtain and time-consuming to prepare, while commercial enzymes remain prohibitively expensive. Furthermore, recombinant enzyme expression in microbes and purification are time-consuming and may require optimization. An underutilized yet promising alternative is the utilization of microbial enzyme cocktails. This approach involves cultivating a polysaccharide-degrading bacterium or community on the target polysaccharide, which induces the expression of enzymes with desired hydrolytic activities. The resulting undefined mixture of secreted enzymes, referred to as a cocktail, can be concentrated from the supernatant and subsequently used to digest a polysaccharide, followed by the quantification of monomer or oligomer. Previous studies have demonstrated the application of enzyme cocktails to determine monomeric compositions of polysaccharides [20, 21], as well as to evaluate the catalytic capabilities [21–23] and relative activities [21, 22] of secreted enzymes. For instance, purified enzyme cocktails derived from a characterized fucoidan-degrading microbe have successfully been used for the degradation and quantification of fucoidan [20], indicating the potential of enzyme cocktails as a method for polysaccharide quantification.
We present a methodology for developing enzyme cocktail-based assays to quantify polysaccharides, extending this approach to utilize natural microbial communities. This effectively addresses the limitations of chemical hydrolysis and the reliance on recombinant enzymes or specific degrading microbes. As proof of concept for quantifying colloidal chitin, we extracted an enzyme cocktail from the model chitin-degrading isolate Psychromonas sp. Psy6C06 [24, 25]. Building on this foundation, we used undefined microbial seawater communities to induce a laminarin-degrading enzyme cocktail, which we then purified to quantify laminarin. This method offers a readily adaptable solution for quantifying polysaccharides across various biological systems.
Methods
Chemicals and strains
All chemicals were obtained from Sigma Aldrich unless otherwise specified.
Preparation of colloidal chitin
To prepare colloidal chitin as described [22, 26], 10 g of powdered chitin from shrimp shells were dissolved in 100 ml of concentrated phosphoric acid and incubated at 4°C for 48 h. After incubation, 500 ml of MilliQ water was added to precipitate the chitin, which was then purified by vacuum filtration. The chitin was dialyzed against water for 72 h using a cellulose dialysis tubing membrane (Sigma D9402) to remove any remaining phosphoric acid and subsequently resuspended in water to achieve a concentration of approximately 15 g/l. The suspension was homogenized using a Bosch SilentMixx Pro blender to obtain a uniform colloidal chitin solution. To determine the exact chitin concentration, a 10 ml aliquot was vacuum-concentrated overnight, and the dried chitin was weighed. Based on this measurement, the original suspension was diluted to obtain a final concentration of 10 g/l chitin. The colloidal chitin was autoclaved before use as a bacterial substrate to ensure sterility.
LC–MS quantification
Measurements were performed using liquid chromatography (Agilent Infinity II UHPLC stack) coupled with an Agilent 6520 Time of Fight Quadrupole Time of Flight Mass Spectrometer in negative mode, 4 GHz, high-resolution mode.
For quantification of chitin oligomers, an Agilent EC-CN Poroshell column (50 × 2.1 mm, 2.7 µM) was used isocratically to reduce the interference of salts on metabolite ionization [27]. The buffer contained 90% water, 10% (v/v) acetonitrile (CHROMOSOLVE) and 0.1% (v/v) formic acid. The flow rate was 0.35 ml/min. Prior to measurement, the sample was diluted 20-fold in millQ water. Three microliter was injected every 2 min. Data analysis and quantification were performed using Agilent Quantitative Masshunter software.
For time course laminarin pentose degradation, an Agilent EC-CN Poroshell column (50 × 2.1 mm, 2.7 µM) was used isocratically as described above. Here, the assay was initiated in the Agilent Infinity autosampler by adding 50 µl of 10 mM laminarin pentose to 50 µl of enzyme cocktail, and 3 µl of the enzyme reaction was injected every 3 h. Data analysis was performed through manual peak integration using Agilent Qualitative Masshunter software.
For quantification of laminarin oligomers of different chain lengths, an Agilent HILIC-Z Poroshell column (100 × 2.1 mm, 1.8 µM) was used. Buffer A contains 10% (v/v) acetonitrile and 0.3% (v/v) ammonium hydroxide. Buffer B contains 90% acetonitrile (v/v) and 0.3% ammonium hydroxide (v/v). The flow was 0.9 ml/min and the column was kept at 35°C. The gradient is as follows: 0% A for 1 min, followed by a gradient to 40% A until 5 min. This is held for 1 min before dropping to 0% A and re-equilibration for 3 min. Three microliter of sample was injected. Data analysis and quantification were performed using manual peak integration with Agilent Qualitative Masshunter software.
Enzyme cocktail purification
Psy6C06 was streaked from −80°C glycerol stocks onto 1.5% (w/v) agar plates of MB 2216 (Fisher) medium. A single colony was used for an overnight preculture in MB 2216, and the following day the preculture was inoculated 1% into 400 ml of simplified MBL medium with 2 g/l colloidal chitin and shaken at 200 rpm until early stationary phase. A simplified MBL medium is created from several stocks: 4-fold concentrated seawater salts (NaCl, 80 g/l; MgCl2*6H2O, 12 g/l; CaCl2*2H2O, 0.6 g/l; KCl, 2 g/l), 1000-fold diluted sodium sulfate (1 M), 500-fold diluted phosphate dibasic (0.5 mM), and 20-fold diluted HEPES buffer (1 M pH 8.2).
After growth, the medium was centrifuged at 2800 relative centrifugal force for 20 min to remove any remaining chitin and cells, then sterile filtered using a 0.2 µm membrane. This supernatant was then concentrated 10-fold using an Amicon stirred cell (Millipore) with a 3 kDa cutoff filter. A protease inhibitor was added to the final concentrate (Roche cOmplete EDTA free protease inhibitor cocktail). Aliquots of 500 µl were added to 1.5 ml microcentrifuge tubes, which were then snap-frozen by placing them in liquid nitrogen before storing at −80°C until use. The concentration of protein in the chitinase enzyme cocktail is 0.07 mg/ml as quantified using Bradford reagent.
For generation of laminarinases from seawater microbes, the same growth and purification protocol was followed, except the medium contained 1 g/l Laminarin from Laminaria digitata (Sigma) as the carbon source and 10 mM ammonium chloride as the nitrogen source. Seawater was collected from the North Sea on the shore of Cuxhaven (53°53′04.3″N 8°37′57.1″E), passed through a 5 µm filter, mixed 1:1 with 80% (v/v) glycerol, and stored at −80°C until inoculation. The concentration of protein in the laminarinase enzyme cocktail is 0.012 mg/ml as quantified using Bradford reagent.
Chitin quantification assay
Frozen enzyme aliquots were thawed on ice. An enzyme volume of 100 µl was added to an equal volume of sample and placed at room temperature until sampling. If the sample is suspected to contain more than 500 mg/l chitin, we diluted it to fall within this quantifiable range. To sample, the assay was centrifuged at 2800 rcf for 1 min and the supernatant was collected and stored at −20°C until we measured enzyme products using 3,5-dinitrosalicylic acid (DNS) reagent or liquid chromatography–mass spectrometry (LC–MS).
Laminarin quantification assay
Frozen enzyme aliquots were thawed on ice. For laminarin oligomer formation, 50 µl of enzyme was added to 50 µl of laminarin pentamer (Megazyme, dissolved in 40 mM ammonium bicarbonate buffer pH 7.8) and placed at room temperature for 24 h. The reaction mixture was directly quantified using LC–MS as described above. For laminarin quantification, 50 µl laminarin from Laminaria digitata was added at various concentrations to 50 µl of enzyme cocktail. Samples were taken at 24 h and directly quantified using DNS reagent.
DNS reagent preparation
A volume of 100 ml of water was heated to 70–75°C, then poured over 2 g of NaOH pellets with constant stirring. A total of 2.18 g of DNS was then dissolved in this mixture, and 30 g of sodium potassium tartrate (Rochelle salts) was added. The solution was cooled to room temperature and stored in the dark.
DNS-reducing sugar assay
An aliquot of 25 µl of sample was added to 75 µl of DNS reagent and the mixture was heated to 95°C for 15 min in a thermocycler. An aliquot of 80 µl was added to a 384-well plate and a colorimetric readout was measured at OD540.
Results
Assay design
To cultivate a polysaccharide-degrading microbe or complex microbial community, the organism(s) is grown on the target polysaccharide until it reaches early stationary phase. This process selects for degraders and induces the expression of hydrolytic enzymes. Following cultivation, the cells are filtered to obtain a cell-free supernatant that contains the secreted enzymes (Fig. 1A). These enzymes are then concentrated 10-fold using a 3 kDa molecular weight cutoff filter, aliquoted, snap-frozen in liquid nitrogen, and stored at −80°C. When ready for use, the enzyme cocktail is thawed and mixed with a polysaccharide sample to initiate hydrolysis (Fig. 1B). After hydrolysis, the supernatant is collected for the quantification of monomers and oligomers using either a reducing sugar assay or LC–MS. Akin to other enzyme-based quantification methods [15, 28], this assay relies on consistent enzyme activity across all samples, leading to the production of uniform sets of oligomers and monomers. This consistency establishes a quantitative relationship between the amount of polysaccharide digested and the number of reducing sugar ends and degradation products formed. A calibration curve is calculated based on the digestion of standards with known polysaccharide concentrations. These standards are digested concurrently with unknown samples to account for variations in enzyme activity among different cocktail batches, any degradation that may occur during storage, or residual monomer or oligomer that may remain in the cocktails after concentration.
Figure 1.

Assay design and workflow (A) Enzyme cocktail preparation involves growing a microbe, or microbial community, on the polysaccharide as a sole carbon source, followed by filtering cells and concentrating enzymes using a 3 kDa molecular weight cutoff membrane. The concentrate is aliquoted and stored until use. (B) Polysaccharide quantification entails mixing the enzyme cocktail with a sample to initiate digestion, leading to the formation of monomers or oligomers. Post-digestion, the products can be quantified using LC–MS, HPLC, chemical, or other methods.
Quantification of colloidal chitin using enzyme cocktails from a bacterial isolate
We evaluated the assay design for quantifying colloidal chitin using an enzyme cocktail obtained from the chitin-degrading Psychromonas sp. bacterium Psy6C06, which encodes 13 chitinases [22]. To confirm chitinase activity, the cocktail was incubated for 72 h with a 2 g/l colloidal chitin sample in equal volumes. The resulting monomer and oligomer were analyzed by LC–MS, detecting both monomeric GlcNAc and oligomers of various chain lengths. Notably, the primary degradation products observed were monomeric GlcNAc and dimeric chitobiose, consistent with previous characterizations of the chitinases secreted by Psy6C06 [22] (Fig. 2A). To assess the time required for the cocktail to completely hydrolyze samples containing up to 2 g/l of colloidal chitin, we measured the time-resolved formation of reducing sugar ends using the DNS reagent (Fig. 2B). Within 72 h, complete hydrolysis was achieved only in samples with 500 mg/l colloidal chitin or less, as evidenced by a stable signal. Consequently, all subsequent experiments were standardized to a 72-h hydrolysis period, with samples known or suspected to contain more than 500 mg/l colloidal chitin diluted prior to digestion.
Figure 2.

Activity of chitin enzyme cocktail. (A) GlcNAc oligomers (Degree of polymerization, DP 1–6) formed after 72 h digestion of 2 g/l colloidal chitin by the enzyme cocktail, measured using LC–MS. Error bars represent the standard deviation of the mean of three replicates. (B) Samples with varying concentrations of colloidal chitin were digested with equal volumes of enzyme cocktail. Liberation of monomer and oligomer is measured every 24 h for 3 days using a DNS-reducing sugar assay (with an OD540 signal). Experiments were performed in triplicate. Error bars represent the standard deviation from the mean.
Enzyme cocktails often comprise multiple hydrolytic enzymes that can degrade not only the target polysaccharide but also other polysaccharides present in a sample. Consequently, if an alternative polysaccharide is non-specifically degraded into monomer and oligomer, colorimetric assays like the DNS assay, which reacts with various reducing sugar ends, may lead to an overestimation of the target polysaccharide concentration. In contrast, techniques such as LC–MS or HPLC can effectively distinguish between different monomer and oligomer after sample digestion, making these degradation products valuable for specific readouts of the target polysaccharide degradation. As previously demonstrated [15, 28], this distinction is particularly beneficial when the enzyme digestion generates known, specific oligomers from the target polysaccharide, allowing for the identification of a specific polysaccharide’s oligomers even amidst a mixture of multiple polysaccharides. Here, the enzyme cocktails from Psy6C06 primarily yield GlcNAc and chitobiose as the major degradation products, both of which serve as effective readouts for quantifying chitin. However, in cases where it is uncertain whether other GlcNAc-containing polysaccharides are present in a sample that might undergo non-specific hydrolysis, quantifying chitin based on chitobiose provides a viable alternative. This is because chitobiose is a degradation product specific to chitin because direct GlcNAc–GlcNAc linkages are generally uncommon in polysaccharides. We compared the use of chitobiose measured by LC–MS as a readout against two other readouts: GlcNAc measured with LC–MS and total reducing sugar ends measured with the DNS reagent. We defined the limit of detection (LOD) as the lowest concentration yielding a signal above the background mean plus 5 SDs. We obtained an LOD of 15 mg/l colloidal chitin when using chitobiose as a readout, compared to 500 mg/l with GlcNAc (Fig. 3A–C), and 62.5 mg/l when using DNS. The mean coefficient of variation across all concentrations was 8% for chitobiose and 10% for GlcNAc as readouts, and 2.6% for DNS, indicating high reproducibility of the measurements for each method. These results show that GlcNAc is unsuitable as a readout since its LOD equals the maximum chitin concentration able to be used for this assay. In contrast, chitobiose improves chitin quantification specificity and offers the highest sensitivity among the methods tested. These LODs also match or exceed detection limits of previously published methods [14, 18, 19] which are in the range of 10–100 mg/l.
Figure 3.

Assay sensitivity. Decreasing concentrations of colloidal chitin are applied to the enzyme cocktail and digested for 72 h. (A) Detection of total reducing sugar ends with the DNS reagent. (B) Detection of GlcNAc by LC–MS. (C) Detection of dimeric chitobiose by LC–MS. A linear regression of signal intensity per chitin concentration is shown.
Measuring colloidal chitin dynamics in bacterial cultures
Quantifying the dynamics of chitin degradation is important for investigating bacterial cultures and the role of marine communities in biogeochemical carbon cycling, as it enables researchers to correlate changes in population dynamics with chitin degradation rates. Using the above enzyme cocktail derived from degrader Psy6C06, we monitored the time-course consumption of colloidal chitin by the chitin-degrading Vibrio splendidus Vib1A01 [29, 30]. During growth of Vib1A01, we periodically sampled aliquots, centrifuged them, and subjected the pellet to brief boiling to denature any chitinases derived from the organism. This denatured pellet was then incubated with the enzyme cocktail at a 1:1 ratio for 72 h. To ensure that other components in the Vib1A01 biomass were not non-specifically hydrolyzed by the enzyme digest, we digested biomass from a Vib1A01 culture grown on 20 mM GlcNAc instead of chitin. This test confirmed the absence of any detectable background signal using the DNS reagent (data not shown). Our results show a gradual decrease in colloidal chitin that corresponded with the growth of Vib1A01 (Fig. 4). This finding highlights the method’s effectiveness in quantifying chitin degradation in bacterial cultures, which has broader implications for researchers investigating chitin dynamics in various biological systems.
Figure 4.
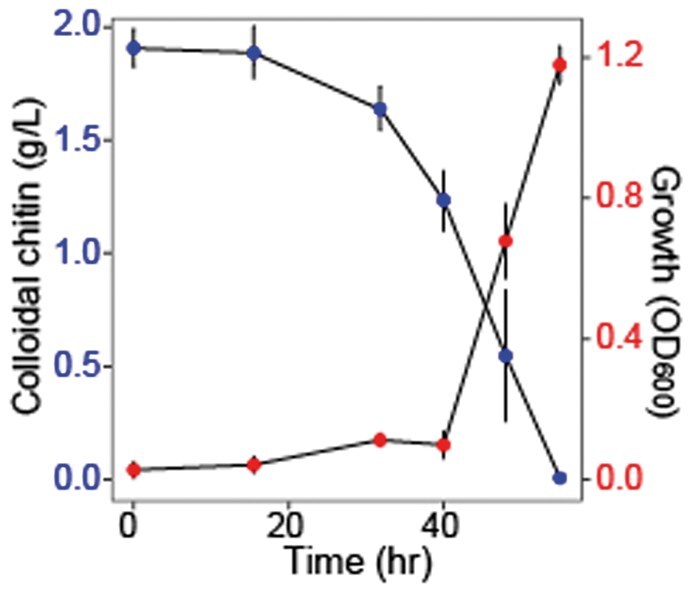
Chitin concentrations during bacterial growth. OD600 of chitin degrader Vib1A01 when growing on chitin as a sole carbon source (Red, increasing line). Colloidal chitin concentration at each of the measured timepoints (Blue, decreasing line) was measured using DNS reagent. Error bars represent the standard deviation of the mean of three biological replicates.
Laminarin quantification using enzyme cocktails from environmental communities
When degrading microbes are unavailable or cannot be isolated from the environment, an alternative is to collect enzyme cocktails from complex environmental microbial communities. By growing these communities on the polysaccharide of interest as a sole carbon source, specific degraders will be selected, and their secreted enzymes can be concentrated into a cocktail. We tested this approach for quantifying laminarin, an algal storage polysaccharide with a β-(1-3)-glucose backbone and single β-(1-6)-glucose side branches. Seawater collected from the North Sea near the shore of Cuxhaven (53°53′04.3″N 8°37′57.1″E) was used to inoculate a medium containing laminarin as the sole carbon source, thereby inducing and concentrating laminarinases withing the generated enzyme cocktail. To assess the activity of this cocktail, we digested 5 mM of a β-(1-3)-glucose pentamer, which represents the laminarin backbone, for 4 h. This enabled quantification of laminarin degradation, as the pentamer, unlike the full-length polysaccharide, fits within the mass spectrometer's typical measurable range. We measured the formation of smaller oligomers using LC–MS, which revealed a mixture of monomers and smaller oligomers (Fig. 5A), indicating the presence of multiple laminarinases with varying activities. Further, we determined the time required for the complete digestion of 2 mM laminarin pentamer (equivalent to 1.6 g/l) using LC–MS, observing a stable signal before 21 h (Fig. 5B). Consequently, we used 24 h as an appropriate digestion time for laminarin concentrations of up to 1 g/l. To corroborate that the DNS reagent could also be employed to quantify laminarin, offering a more widely accessible measurement method beyond LC–MS, we used it to detect laminarin concentrations between 1 and 0.03 g/l after a 24-h digestion period, achieving a LOD of 30 mg/l (Fig. 5C). These results underscore the potential of environmental microbial communities as a valuable source of enzyme cocktails for quantifying various polysaccharides.
Figure 5.

Laminarin quantification with seawater community enzymes: (A) Mass spectrometry measurement of glucose oligomers (Degree of polymerization, DP1–4) after 4-h digestion of a laminarin pentamer by a laminarinase enzyme cocktail expressed by a seawater microbial community. (B) Intensity of laminarin pentamer was measured with LC–MS during time-course digestion with an enzyme cocktail, starting from an initial 2 mM concentration. (C) Digestion of different laminarin concentrations by an enzyme cocktail, quantified with DNS reagent and a readout of OD540. The LOD is 30 mg/l, and a linear regression is shown for points above this limit. Error bars represent the standard deviation of the mean of three biological replicates.
Discussion
In this study, we demonstrate that microbial enzyme cocktails can be sourced from both complex microbial communities and individual isolates to quantify polysaccharides, specifically using colloidal chitin and laminarin as case studies. Unlike other enzyme-based techniques for polysaccharide quantification, our approach eliminates the need for identifying and recombinantly expressing specific hydrolytic enzymes. Instead, we collect these enzymes from cultures of bacteria that are actively degrading the target polysaccharide. By concentrating all secreted enzymes into single cocktails, we also retain potential non-catalytic proteins that may enhance the activities of hydrolytic enzymes [31]. Furthermore, we show that enzyme cocktails can be derived from complex microbial communities, thus circumventing the need to isolate specific polysaccharide-degrading microbes.
This protocol is effective for the quantification of laminarin and colloidal chitin; however, it may need optimization for other polysaccharides. For instance, some polysaccharides may be substantially degraded by membrane-bound or even intracellular enzymes [32]. In such cases, an additional step involving the harvesting and disrupting of the cell pellet may be necessary to extract these fractions. Additionally, certain hydrolytic enzymes can be degraded by microbes following polysaccharide hydrolysis [33], making it crucial to select the correct timepoint for enzyme collection. Moreover, some hydrolytic enzymes bind tightly to polysaccharide surfaces, necessitating complete degradation of the polysaccharide before their release. This is illustrated by our previous work with Psy6C06 chitinases, which were shown to bind to the chitin surface [26]. However, we demonstrate in the current study that they can still be harvested once chitin degradation is complete. It is also important to note that not all polysaccharides are easily degraded in laboratory settings, which may limit the broader applicability of this method.
Another key limitation of enzyme cocktails is the potential presence of hydrolytic enzymes that degrade non-target polysaccharides in samples, which may inflate readings from nonspecific hydrolysis. This issue can be mitigated by implementing appropriate controls to eliminate background interference. For example, we demonstrated that the Psy6C06 enzyme cocktail does not degrade polysaccharides in the Vib1A01 bacterial biomass, thereby ensuring that any unknown polysaccharides present do not distort colloidal chitin readouts. However, this task becomes more complex in raw environmental samples with unknown polysaccharide compositions. LC–MS can help address this by selectively monitoring specific monosaccharide and oligosaccharide, such as chitobiose, which provide a reliable readout for chitin degradation due to the uncommon GlcNAc–GlcNAc linkages. Nonetheless, differentiating between polysaccharides with similar monosaccharide compositions, such as glucans, remains challenging. In the case of glucans, glycogen features a glucose backbone with α(1→4) linkages, whereas laminarin contains α(1→3) linkages; but complete hydrolysis leads to glucose monomers in both cases. As a partial solution, mass spectrometry may be used to identify specific oligomers from incomplete hydrolysis to learn the nature of distinct glucans. Consequently, enzyme cocktails may not be effective in these cases, necessitating the use of recombinant enzymes specifically designed to degrade the target polysaccharide.
We envision the primary application of this approach as a method for measuring polysaccharides in controlled environments where the dominant polysaccharide is known or when nonspecific hydrolysis can be excluded. For example, we applied this protocol to track the degradation of colloidal chitin over time by a chitin-degrading marine isolate. This approach addresses a critical need for quantifying colloidal chitin in a high throughput manner, filling a methodological gap for this abundant marine polysaccharide [22, 34–36]. Such applications provide a precise tool for studying microbial polysaccharide degradation, thereby advancing our understanding of the roles microbes play in biopolymer turnover, microbial ecology, biotechnology, and biogeochemical cycles.
Contributor Information
Sammy Pontrelli, Institute of Molecular Systems Biology, ETH Zürich, Zürich, Switzerland; Department of Biology, KU Leuven, Leuven, Belgium; VIB-KU Leuven Center for Microbiology, Leuven, Belgium.
Uwe Sauer, Institute of Molecular Systems Biology, ETH Zürich, Zürich, Switzerland.
Author contributions
Sammy Pontrelli (Conceptualization [lead], Formal analysis [lead], Investigation [lead], Methodology [equal]), Uwe Sauer (Conceptualization [supporting], Funding acquisition [lead], Project administration [equal], Methodology [equal], Resources [lead], Supervision [lead])
Conflict of interest statement. We report no conflict of interest
Funding
We greatly acknowledge financial support from the Simons Foundation through the Principles of Microbial Ecosystems (PriME) collaboration (grant 542395).
Data availability
The data underlying this article will be shared on reasonable request to the corresponding author.
References
- 1. Suzuki E, Suzuki R. Variation of storage polysaccharides in phototrophic microorganisms. J Appl Glycosci 2013;60:21–7. [Google Scholar]
- 2. Lerouxel O, Cavalier DM, Liepman AH. et al. Biosynthesis of plant cell wall polysaccharides–a complex process. Curr Opin Plant Biol 2006;9:621–30. [DOI] [PubMed] [Google Scholar]
- 3. Raszka A, Chorvatova M, Wanner J. The role and significance of extracellular polymers in activated sludge. Part I: literature review. Acta Hydrochim Hydrobiol 2006;34:411–24. [Google Scholar]
- 4. Cerqueira FM, Photenhauer AL, Pollet RM. et al. Starch digestion by gut bacteria: crowdsourcing for carbs. Trends Microbiol 2020;28:95–108. [DOI] [PubMed] [Google Scholar]
- 5. Arnosti C, Wietz M, Brinkhoff T. et al. The biogeochemistry of marine polysaccharides: sources, inventories, and bacterial drivers of the carbohydrate cycle. Ann Rev Mar Sci 2021;13:81–108. [DOI] [PubMed] [Google Scholar]
- 6. Enke TN, Datta MS, Schwartzman J. et al. Modular assembly of polysaccharide-degrading marine microbial communities. Curr Biol 2019;29:1528–35.e6. [DOI] [PubMed] [Google Scholar]
- 7. Decamp A, Michelo O, Rabbat C. et al. A new, quick, and simple protocol to evaluate microalgae polysaccharide composition. Mar Drugs 2021;19:101. [DOI] [PMC free article] [PubMed] [Google Scholar]
- 8. Schiavone M, Vax A, Formosa C. et al. A combined chemical and enzymatic method to determine quantitatively the polysaccharide components in the cell wall of yeasts. FEMS Yeast Res 2014;14:933–47. [DOI] [PubMed] [Google Scholar]
- 9. Rühmann B, Schmid J, Sieber V. High throughput exopolysaccharide screening platform: from strain cultivation to monosaccharide composition and carbohydrate fingerprinting in one day. Carbohydr Polym 2015;122:212–20. [DOI] [PubMed] [Google Scholar]
- 10. Lin P, Guo L. Spatial and vertical variability of dissolved carbohydrate species in the northern Gulf of Mexico following the Deepwater Horizon oil spill, 2010–2011. Mar Chem 2015;174:13–25. [Google Scholar]
- 11. Cao X, Mulholland MR, Helms JR. et al. A major step in opening the black box of high-molecular-weight dissolved organic nitrogen by isotopic labeling of Synechococcus and multibond two-dimensional NMR. Anal Chem 2017;89:11990–8. [DOI] [PubMed] [Google Scholar]
- 12. Peter MG. Applications and environmental aspects of chitin and chitosan. J Macromol Sci A 1995;32:629–40. [Google Scholar]
- 13. Keyhani NO, Roseman S. Physiological aspects of chitin catabolism in marine bacteria11This paper is publication 521 from the McCollum-Pratt Institute. Biochim Biophys Acta 1999;1473:108–22. [DOI] [PubMed] [Google Scholar]
- 14. Yan X, Evenocheck HM. Chitosan analysis using acid hydrolysis and HPLC/UV. Carbohydr Polym 2012;87:1774–8. [Google Scholar]
- 15. Becker S, Scheffel A, Polz MF. et al. Accurate quantification of laminarin in marine organic matter with enzymes from marine microbes. Appl Environ Microbiol 2017;83:e03389-16. [DOI] [PMC free article] [PubMed] [Google Scholar]
- 16. Steinke N, Vidal‐Melgosa S, Schultz‐Johansen M. et al. Biocatalytic quantification of α‐glucan in marine particulate organic matter. MicrobiologyOpen 2022;11:e1289. [DOI] [PMC free article] [PubMed] [Google Scholar]
- 17. Sun Y, Li L, Zhang Y. et al. An enzyme-pHBH method for specific quantification of porphyran. Int J Biol Macromol 2024;257:128530. [DOI] [PubMed] [Google Scholar]
- 18. Dikeman CL, Bauer LL, Flickinger EA. et al. Effects of stage of maturity and cooking on the chemical composition of select mushroom varieties. J Agric Food Chem 2005;53:1130–8. [DOI] [PubMed] [Google Scholar]
- 19. Sharma S, Hooda V., Preety. Purification and analytical application of Vigna mungo chitinase for determination of total fungal load of stored cereals. Appl Biochem Biotechnol 2018;186:12–26. [DOI] [PubMed] [Google Scholar]
- 20. Buck-Wiese H, Andskog MA, Nguyen NP. et al. Fucoid brown algae inject fucoidan carbon into the ocean. Proc Natl Acad Sci USA 2023;120:e2210561119. [DOI] [PMC free article] [PubMed] [Google Scholar]
- 21. Sichert A, Corzett CH, Schechter MS. et al. Verrucomicrobia use hundreds of enzymes to digest the algal polysaccharide fucoidan. Nat Microbiol 2020;5:1026–39. [DOI] [PubMed] [Google Scholar]
- 22. Pontrelli S, Szabo R, Pollak S. et al. Metabolic cross-feeding structures the assembly of polysaccharide degrading communities. Sci Adv 2022;8:eabk3076. [DOI] [PMC free article] [PubMed] [Google Scholar]
- 23. Unfried F, Becker S, Robb CS. et al. Adaptive mechanisms that provide competitive advantages to marine bacteroidetes during microalgal blooms. ISME J 2018;12:2894–906. [DOI] [PMC free article] [PubMed] [Google Scholar]
- 24. Ebrahimi A, Schwartzman J, Cordero OX. Cooperation and spatial self-organization determine rate and efficiency of particulate organic matter degradation in marine bacteria. Proc Natl Acad Sci USA 2019;116:23309–16. [DOI] [PMC free article] [PubMed] [Google Scholar]
- 25. Enke TN, Leventhal GE, Metzger M. et al. Microscale ecology regulates particulate organic matter turnover in model marine microbial communities. Nat Commun 2018;9:2743. [DOI] [PMC free article] [PubMed] [Google Scholar]
- 26. Pontrelli S, Guessous G, Trouillon J et al. Competition strategies driving resource partitioning in chitin degrading communities. bioRxiv, 2024. 10.1101/2024.11.07.622309 [DOI]
- 27. Pontrelli S, Sauer U. Salt-tolerant metabolomics for exometabolomic measurements of marine bacterial isolates. Anal Chem 2021;93:7164–71. [DOI] [PubMed] [Google Scholar]
- 28. Deng Y, Chen LX, Zhu BJ. et al. A quantitative method for polysaccharides based on endo-enzymatic released specific oligosaccharides: a case of Lentinus edodes. Int J Biol Macromol 2022;205:15–22. [DOI] [PubMed] [Google Scholar]
- 29. Iffland-Stettner A, Okano H, Gralka M. et al. A genome-scale metabolic model of marine heterotroph Vibrio splendidus strain 1A01. mSystems 2023;8:e00377-22. [DOI] [PMC free article] [PubMed] [Google Scholar]
- 30. Amarnath K, Narla AV, Pontrelli S. et al. Stress-induced metabolic exchanges between complementary bacterial types underly a dynamic mechanism of inter-species stress resistance. Nat Commun 2023;14:3165. [DOI] [PMC free article] [PubMed] [Google Scholar]
- 31. Vaaje-Kolstad G, Horn SJ, van Aalten DMF. et al. The non-catalytic chitin-binding protein CBP21 from Serratia marcescens is essential for chitin degradation. J Biol Chem 2005;280:28492–7. [DOI] [PubMed] [Google Scholar]
- 32. Reintjes G, Arnosti C, Fuchs BM. et al. An alternative polysaccharide uptake mechanism of marine bacteria. ISME J 2017;11:1640–50. [DOI] [PMC free article] [PubMed] [Google Scholar]
- 33. Pontrelli S, Villi KB, Sichert A et al. Extracellular polymeric substance degradation shapes microbial community diversity. bioRxiv, 2025. 10.1101/2025.01.22.634264. [DOI] [Google Scholar]
- 34. Szabo RE, Pontrelli S, Grilli J. et al. Historical contingencies and phage induction diversify bacterioplankton communities at the microscale. Proc Natl Acad Sci USA 2022;119:e2117748119. [DOI] [PMC free article] [PubMed] [Google Scholar]
- 35. Shen CR, Chen YS, Yang CJ. et al. Colloid chitin azure is a dispersible, low-cost substrate for chitinase measurements in a sensitive, fast, reproducible assay. J Biomol Screen 2010;15:213–7. [DOI] [PubMed] [Google Scholar]
- 36. Salas-Ovilla R, Gálvez-López D, Vázquez-Ovando A. et al. Isolation and identification of marine strains of Stenotrophomona maltophilia with high chitinolytic activity. PeerJ 2019;7:e6102. [DOI] [PMC free article] [PubMed] [Google Scholar]
Associated Data
This section collects any data citations, data availability statements, or supplementary materials included in this article.
Data Availability Statement
The data underlying this article will be shared on reasonable request to the corresponding author.