Abstract
The S14 (spot 14) gene encodes a protein that is predominantly expressed in lipogenic tissues, such as the liver, white and brown adipose tissues and the lactating mammary glands. Accumulated evidence suggests that S14 could play an important role in the induction of lipogenic enzymes. In humans, the S14 locus resides in the chromosome region 11q13, which is frequently amplified in breast tumours, and as a result, it has been suggested that this protein could play a role in the metabolism and growth of these kinds of tumours. In the present study, we have examined the effects of S14 overexpression in MCF-7 human breast cancer cells. We found that S14 causes (i) an inhibition of cell proliferation and of anchorage-independent growth, (ii) a marked reduction in the number of viable cells and (iii) the induction of differentiation and cell death of these cells. The inhibition of cell growth was associated with a decrease in the expression of cyclin D1 and a reduction of cyclin D1 promoter activity. Increased expression of S14 also caused the accumulation of cytochrome c in the cytosol and loss of mitochondrial membrane potential. These findings suggest that S14 may function as an important modulator of tumorigenesis in human breast by decreasing cell growth and inducing cell death and differentiation.
Keywords: apoptosis, breast cancer, lipid accumulation, MCF-7, proliferation, spot 14
Abbreviations: BrdUrd, bromodeoxyuridine; CMV, cytomegalovirus; 15dPG-J2, 15-deoxy-Δ-12,14-prostaglandin J2; FAS, fatty acid synthase; FBS, fetal bovine serum; MS14, S14-transfected MCF-7 cells; MTT, 3-(4,5-dimethylthiazol-2-yl)-2,5-diphenyl-2H-tetrazolium bromide; S14, spot 14; TMRE, tetramethylrhodamine methyl ester perchlorate
INTRODUCTION
The S14 (spot 14) gene encodes a small acidic protein (first described as a thyroid-hormone-regulated gene [1]) that is predominantly expressed in tissues producing lipids such as the liver, white and brown adipose tissues and the lactating mammary glands [2]. Very early after cloning of this sequence, the expression of S14 in lipogenic tissues, together with its regulation by hormones and physiological manoeuvres that altered lipogenesis in experimental animals, generated a clear correlation between the expression of this gene and lipogenesis [3–6]. Experiments with S14 knockout mice also implicated this protein in lipid metabolism, being essential in the lactating mammary gland, although not for the induction of lipogenesis in the liver by thyroid hormone [7,8].
Despite its close correlation with lipogenic processes, the specific function of the S14 protein remains unclear. Recently, it has been suggested that S14 binds non-esterified fatty acids and in this way could facilitate the activity of fatty acid synthase [8]. This observation is in agreement with the initial idea of S14 being a cytosolic protein [9]. Alternatively, the observation that the S14 protein is present in the nucleus of hepatic cells [10] has opened up the possibility that this protein could play a role in the expression of lipogenic enzymes. In fact, the transfection of hepatocytes with S14 antisense oligonucleotides led to reduced triacylglycerol formation and an attenuated expression of genes involved in the lipogenic pathway, such as malic enzyme, ATP citrate lyase and FAS (fatty acid synthase) [11].
In human breast carcinoma cells, the expression of lipogenic enzymes is frequently increased and associated with a poor prognosis [12,13]. FAS is implicated in tumorigenesis through its role in membrane lipid synthesis and cell proliferation and has been shown to be induced in breast carcinoma cells by HER 2 activation and progestins [14,15]. Inhibition of FAS activity is cytotoxic in breast tumour cells and induces programmed cell death [16,17]. On the other hand, it is well known that induction of differentiation is one potent mechanism by which some cancer therapeutic and chemopreventive agents work [18]. One of the markers of functional differentiation of mammary tissue is the induction of lipid droplets. These lipid droplets are composed mainly of triacylglycerols and constitute an important component of milk. An accumulation of lipid droplets has been observed in many breast cancer cell lines after treatment with diverse agents that also induce growth arrest, including retinoic acid, vitamin D3, 15dPG-J2 (15-deoxy-Δ-12,14-prostaglandin J2) and antibiotics [19–24].
The human S14 gene is located on the long arm of chromosome 11 (11q13.5), a region implicated in human obesity [25,26]. It is also known that this region is amplified in several aggressive breast cancers, and this amplification predicts a poor prognosis [27,28]. In addition, it has been suggested that S14 could play a role in breast cancer cell lipogenesis, where its expression is induced by progestins in parallel with lipogenic enzymes [29,30]. Hence, an implication of S14 protein in breast tumour development has been proposed [25]. However, such a role in breast cancer is yet to be proven directly. In the present study, we found that stable overexpression of S14 inhibits the growth of MCF-7 breast cancer cells. We further demonstrate that S14 is able to inhibit anchorage-independent growth in soft agar and induce apoptosis of these cells. Lastly, we have found that known differentiating agents of breast cancer cells, such as retinoic acid, vitamin D3 and 15dPG-J2 induced the endogenous expression of the human S14 gene in MCF-7 cells.
EXPERIMENTAL
Cell culture and transfection
MCF-7 cells were propagated and maintained in RPMI 1640 medium (Life Technologies, Basel, Switzerland) containing 10% (v/v) FBS (fetal bovine serum) at 5% CO2 and 37 °C in saturated humidity. For the selection of S14 stably transfected cells, MCF-7 cells were plated at a density of 1×10⁵ cells/60 mm dish and transfected 24 h later with CMVS14 expression vector driven by the CMV (cytomegalovirus) promoter using Transfast (Innogenetics, Madison, WI, U.S.A.), according to the manufacturer's instructions. The CMVS14 expression vector was constructed by cloning a 461 bp EcoRI cDNA fragment containing the entire coding region of the human S14 gene into the mammalian expression vector pCDNA3. Empty vector was also transfected into cells to serve as a control. After 12 h of transfection, the medium was replaced and the cells were incubated for 24 h, after which they were subcultured at 1:15 dilution with the addition of geneticin (1 mg/ml). The growth medium was renewed every 3 days, and fresh geneticin was added until colonies appeared. Individual clones were then isolated and expanded to confirm the expression of S14 by Western-blot and immunofluorescence analyses. Parental cells and cells transfected with the empty vector were analysed as controls. No significant differences were observed between either cell line and, therefore, only the data obtained with MB (vector-transfected MCF-7 cells) are shown. Experimental cultures were usually grown in 10% resin–charcoal stripped FBS for the indicated times.
For transient transfection experiments, MCF-7 cells were seeded on to 12-well plates, grown in regular medium (RPMI 1640 medium containing 10% FBS) for 24 h, and transfected with a construct containing 1720 bp of the human promoter of the cyclin D1 gene [31] cloned in the pXP2luc vector. MCF-7 cells were transfected with this construct, and with the CMVβgal vector for transfection efficiency, using Lipofectamine™ (Promega, Madison, WI, U.S.A.) according to the manufacturer's instructions. Typically, cells received 2 μg of luciferase reporter plasmid and were harvested 24 h after growing in experimental media for the determination of luciferase and β-galactosidase (for determination of transfection efficiency) activities.
Antibodies
The E132 polyclonal antibody specific for S14 was obtained by injecting rabbits with a peptide corresponding to the amino acids 49–146 fused to the glutathione S-transferase protein. Mouse monoclonal antibody directed to cytochrome c and rabbit polyclonal anti-cyclin D1 were obtained from Pharmingen (San Diego, CA, U.S.A.) and Santa Cruz Biotechnology (Heidelberg, Germany) respectively. The E132 antibody was tested for specificity by preincubating it for 45 min with the peptide used to immunize the rabbits. The preincubation completely inhibited S14 staining by the E132 antibody.
Western-blot analysis
Equal amounts of the total cellular protein were separated by SDS/PAGE (12% polyacrylamide). After electrophoresis, proteins were transferred on to BioTrace PVDF membranes (GelmanSciences, Ann Arbor, MI, U.S.A.). Blots were blocked with 5% (w/v) dry milk (anti-cyclin D1) or 3% (w/v) BSA (anti-cytochrome c and E132) in PBS containing 0.5% (v/v) Tween 20 for 60 min and probed with the appropriate antibodies for 12 h at 4 °C. After washing, membranes were incubated with peroxidase-conjugated secondary antibodies and specific proteins were detected with the ECL® (enhanced chemiluminescence) system (Amersham Biosciences, Piscataway, NJ, U.S.A.).
Confocal microscopy
Cells were plated on glass coverslips in 24-well cell-culture plates and grown in regular medium for 24 h before switching to a medium containing 10% (v/v) stripped serum for the specified times. The cells were then washed and fixed for 10 min with methanol at −20 °C. After a 1 h incubation at room temperature (22 °C) with the primary antibody, cells were washed with PBS and incubated with an Alexa 488-labelled (Molecular Probes, Leiden, The Netherlands) secondary antibody for 45 min at 37 °C. Subcellular localization was determined using a TCS SP2 laser scanning spectral confocal microscope (Leica Mycrosystems, Mannheim, Germany). The images were obtained using a series of 0.5 μm (depth) spaced cell fluorescent slices (Z-axis).
Proliferation assay
To monitor proliferation, cells were seeded, in triplicate, on to 96-well plates at a density of 7000 cells/well. After 24 h of growth in regular medium the cells were switched to a medium containing 10% stripped serum and incubated for a further 24 h. Radiolabelled [3H]thymidine (0.5 μCi) was then added and the cells were grown for an additional 8 h. [3H]Thymidine incorporation was assessed in a Wallac 1450 MicroBeta liquid-scintillation counter. Proliferation was also measured by BrdUrd (bromodeoxyuridine) staining. Cells were seeded on glass coverslips in 24-well cell-culture plates and grown for 24 h in 10% stripped serum. During the last 6 or 20 h of culture, 25 μg/ml BrdUrd (Sigma) was added. BrdUrd-labelled cells were identified with an anti-BrdUrd monoclonal antibody (Sigma).
Cell viability
Cell viability was measured using the MTT [3-(4,5-dimethylthiazol-2-yl)-2,5-diphenyl-2H-tetrazolium bromide] assay (Roche Diagnostic, Basel, Switzerland), based on the ability of viable cells to reduce yellow MTT to blue formazan. Briefly, cells were cultured in 96-well microtitre plates for various periods of time, then cells were incubated with MTT (0.5 mg/ml; 4 h) and subsequently solubilized in 5% DMSO/5 mM HCl for at least 2 h in the dark. The extent of reduction of MTT was quantified by measuring the absorbance at 550 nm according to the manufacturer's instructions. Cell viability was also assessed by propidium iodide (1 μg/ml) staining followed by FACS analysis.
Clonogenic survival determination
For the evaluation of colony-forming ability, cells were seeded in specified number in 60 mm dishes in regular medium. After 24 h of culture, the medium was replaced by the experimental medium and cells were grown for 14 days and then stained with 0.5% Crystal Violet in methanol.
Soft agar colony assays
Anchorage-independent growth was determined by first suspending 10000 cells in 0.35% agar in a tissue culture medium containing 10% stripped serum in 60 mm plates over a bottom layer of 0.5% agar in the medium. The cells were allowed to grow at 37 °C with refeeding twice a week. After 3 weeks, the dishes were examined by microscopy for the appearance of colonies, after staining with Crystal Violet.
Nile Red staining
Nile Red staining was performed essentially as described in [32]. Briefly, cells were seeded in a six-well plate, grown for 72 h in a medium containing 10% stripped serum, washed with TD buffer (20 mM Tris/HCl, pH 7.4, 1 mMNa2HPO4, 140 mM NaCl and 5 mM KCl), and directly stained with 1 ml of 0.1 μg/ml final concentration of the fluorescent stain Nile Red (Sigma) in TD for 5 min. Sample observation was carried out immediately after its preparation. Nile Red-stained cells were then examined with a Zeiss Axiophot microscope.
Determination of apoptotic cells
To calculate the extent of cell death, cells were grown in regular medium for 24 h and then switched to a medium containing 10% stripped serum for 6 h, and phosphatidylserine exposure on the surface of apoptotic cells was detected by flow cytometry after staining with annexin V-FITC (Bender MedSystems, Vienna, Austria). Flow cytometry analysis was performed on an FACScan cytometer using the Cell Quest software (Becton Dickinson, Cowley, Oxford, U.K.).
Analysis of the mitochondrial transmembrane potential (ΔΨm)
Variations in the ΔΨm in vivo during apoptosis were studied using TMRE (tetramethylrhodamine methyl ester perchlorate; Molecular Probes). TMRE is a cationic, membrane-permeant dye that accumulates in the negatively charged mitochondrial matrix in response to ΔΨm. MCF-7 cells were grown for 24 h in a medium containing 10% stripped serum; afterwards, they were incubated for 30–45 min at 37 °C in the presence of 50 nM TMRE, as indicated, followed by analysis in an FACScan flow cytometer.
Measurement of cytochrome c release
For the analysis of cytochrome c release, cells were grown for 48 h in serum-stripped medium, trypsinized, washed with TD buffer and resuspended in 30 μl of lysis buffer (PBS containing 80 mM KCl, 250 mM sucrose, 1 mM dithiothreitol, protease inhibitors and 500 μg/ml digitonin). Cells were incubated in the lysis buffer for 8 min at 4 °C and collected after centrifugation at 10000 g for 5 min. The supernatant was respun for a further 5 min at 10000 g. After washing, the first pellet was resuspended in PBS and sonicated to obtain the mitochondrial fraction. Both the second supernatant, representing the cytosol including the light-membrane fraction, and the mitochondrial fraction were loaded on to a 12% polyacrylamide gel, and cytochrome c release was analysed by immunoblotting. In order to visualize cytochrome c in cells that had been labelled with 20 nM Mitotracker Red CMXRos (Molecular Probes), MCF-7 cells were grown on glass coverslips and immunofluorescence analysis was performed as described above.
Statistical analysis
The data shown are the means±S.D. for at least three independent experiments. Statistical comparisons for significance between cells with different treatments were performed using Student's t test. ANOVA was used to analyse the data of Figure 6(B).
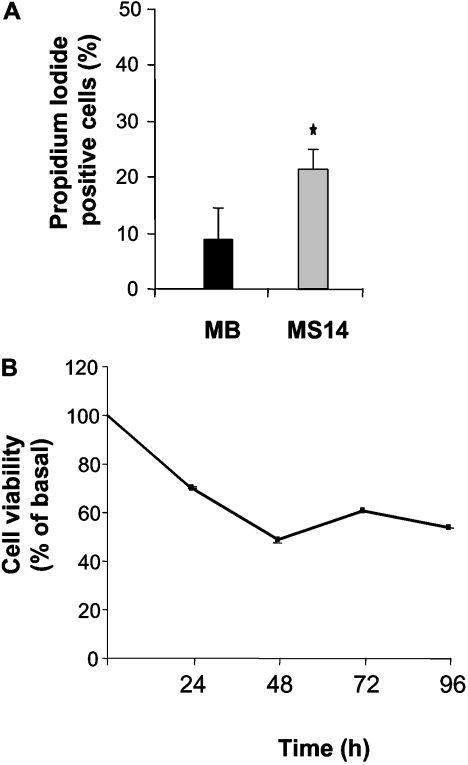
Figure 6. Effects of S14 overexpression on the cell viability of MCF-7 cells.
MB and MS14 cells were incubated in serum-stripped medium for the indicated time periods, and cell viability was determined by propidium iodide staining, *P<0.05 (A), or by the MTT assay, P≤0.01 (B) as indicated in the Experimental section.
RESULTS
Effect of S14 overexpression on MCF-7 cell growth and differentiation
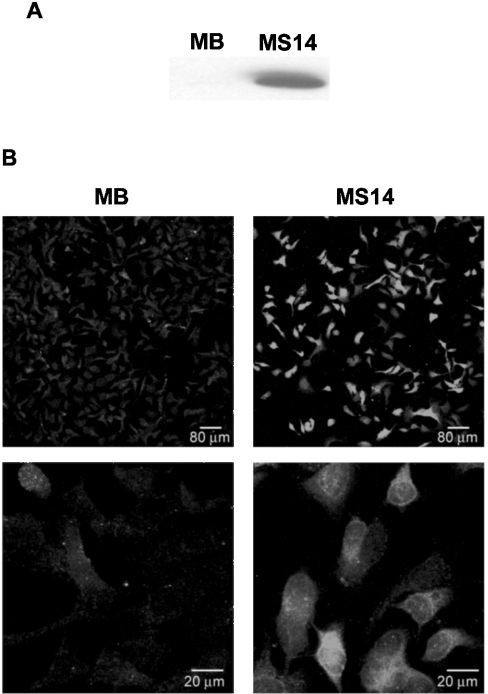
To assess directly the possible effects of the S14 protein on mammary tumour cells, we generated stably transfected human MCF-7 breast cancer cell lines. The complete human S14 cDNA, cloned into a CMV-driven expression vector, was transfected into MCF-7 cells, and different geneticin-resistant clones were tested for S14 expression using the E132 polyclonal antibody. MCF-7 cells stably transfected with the pCDNA3 vector alone were used as controls. For the rest of the experiments, we chose to use clones MB and MS14 (S14-transfected MCF-7 cells). As can be seen in Figure 1(A), clone MS14 showed very high levels of S14 protein when compared with MB cells. The differences in the amount of S14 protein between clones MB and MS14 could also be observed by immunofluorescence analysis (Figure 1B). In clone MB, a weak and diffuse signal could be observed throughout the cell body in contrast with a much stronger signal detected in clone MS14, which is localized mainly in the cytoplasm, albeit there was also some signal in the nucleus.
Figure 1. Stable overexpression of S14 in MCF-7 human breast cancer cells.
(A) Western-blot analysis of S14 was performed with 20 μg of total cellular proteins extracted from MB and MS14 cells. S14 protein was detected by incubation with the E132 polyclonal antibody as described in the Experimental section. A representative Western blot is shown. (B) Immunofluorescence analysis of S14 subcellular localization. Confocal images were taken at a ×20 and ×63 magnification.
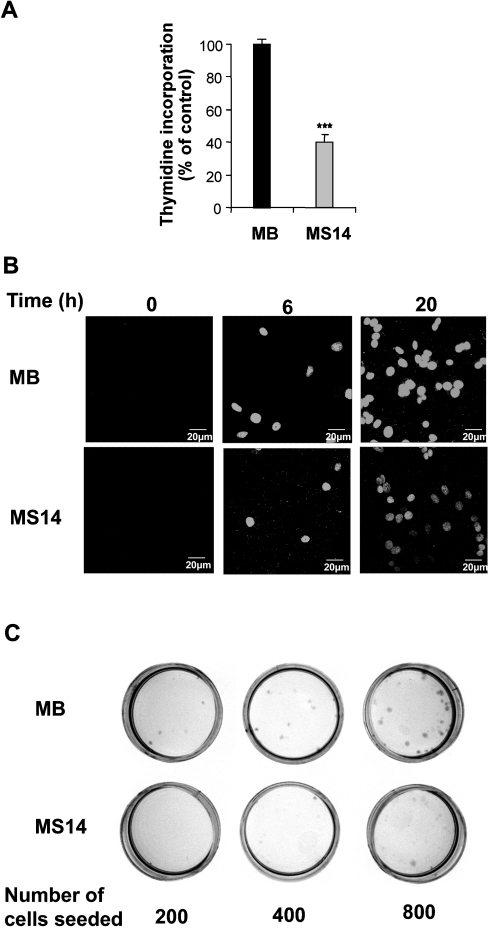
We first examined the effects of S14 overexpression on MCF-7 cell growth by monitoring cell proliferation in a [3H]thymidine incorporation assay. Growing MS14 cells in experimental medium for 8 h resulted in a 60±5% inhibition of thymidine incorporation, when compared with control MB cells (Figure 2A). This growth inhibitory effect was further confirmed by BrdUrd incorporation (Figure 2B). In line with the results obtained using [3H]thymidine incorporation, a decrease of approx. 50±11% in the number of positive cells was detected after 20 h of growing in experimental medium. Next, we performed colony-forming assays and, as shown in Figure 2(C), overexpression of S14 significantly diminished colony formation relative to vector-transfected control cells. Thus S14 appears to function as a growth suppressive factor of breast cancer cells.
Figure 2. Effects of S14 overexpression on the growth properties of MCF-7 cells.
(A) MB and MS14 cells were grown as described in the Experimental section and the incorporation of [3H]thymidine was determined. Results are the means for three determinations from three different experiments. ***P<0.001. (B) MB and MS14 cells were grown as described in the Experimental section and immunostained with an anti-BrdUrd antibody. The images were obtained using a laser-scanning confocal microscope. (C) Representative colony-forming assay in MB and MS14 cells. Experiments were repeated three times on duplicate samples.
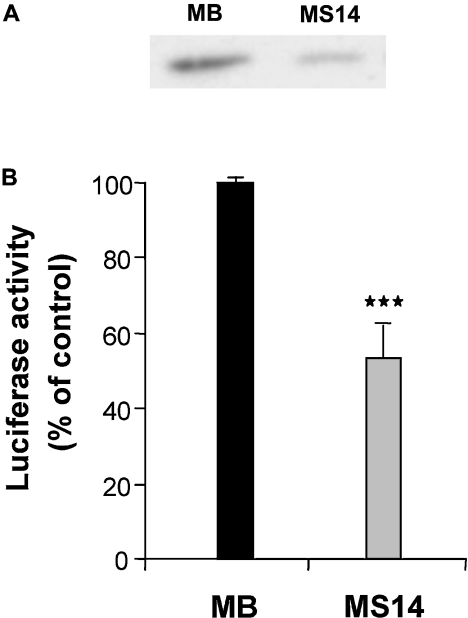
Cyclin D1 is overexpressed in more than 30% of human breast cancers and mammary gland-targeted expression of cyclin D1 is sufficient for the induction of mammary tumorigenesis [33]. Hence, we next performed Western-blot analysis to determine whether overexpression of S14 alters the cellular levels of cyclin D1. We found that MS14 cells displayed a marked reduction in the cyclin D1 protein (Figure 3A). To examine whether the decreased levels of cyclin D1 in S14-overexpressing cells might be due to an inhibition of the transcription of the cyclin D1 gene, we examined the effects of S14 on the transcriptional activity of the cyclin D1 promoter in transient transfection experiments using a cyclin D1 reporter containing 1720 bp of the human cyclin D1 promoter region. After transfection of this reporter into MB or MS14 cells, we observed a significant decrease in the activity of the cyclin D1 promoter in cells overexpressing S14 when compared with control MB cells (Figure 3B).
Figure 3. Effect of S14 on cyclin D1 expression.
(A) Western-blot analysis of cyclin D1 was performed with 20 μg of total cellular proteins extracted from MB and MS14 cells. Cyclin D1 protein was detected by incubation with an anti-cyclin D1 polyclonal antibody as described in the Experimental section. A representative Western blot is shown. (B) Transient transfection of a cyclin D1 promoter construct was performed as indicated in the Experimental section. Results shown are the average of at least three different experiments performed in triplicate. ***P<0.001.
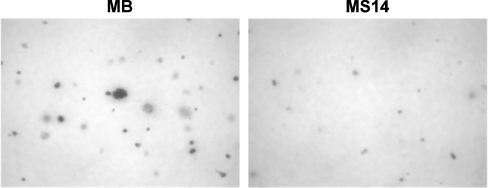
The ability of cancer cells to grow without adhering to extracellular matrix proteins (anchorage-independent growth) correlates closely with their ability to form malignant tumours. Anchorage-independent growth presumably allows the cells to invade and metastasize, characteristics that distinguish malignant from benign tumours. Thus, to assess the effect of S14 overexpression on anchorage-independent growth of MCF-7 cells, we seeded MB and MS14 cells in a medium containing 0.35% agar and counted the colonies 21 days later. As shown in Figure 4, we observed a significant reduction in the number and size of the colonies of S14-expressing MCF-7 cells compared with vector-transfected cells (37±7 and 27±3 colonies/mm2 respectively; P≤0.01). Hence, S14 expression partially inhibited the anchorage-independent growth of MCF-7 cells.
Figure 4. Anchorage-independent growth of MB and MS14 cells in soft agar.
Representative microphotographs (×4 magnification) of clones are shown.
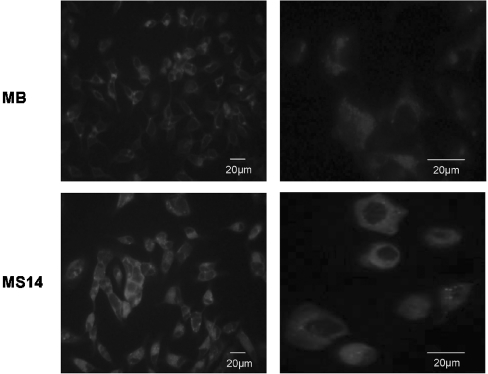
We then examined the formation of lipid droplets as a indicator of breast cancer cell differentiation. As shown in Figure 5, control MB cells expressed only minimal detectable lipid vacuoles. In contrast, most of the MS14 cells underwent a morphological change where they became filled with neutral lipid that stained with Nile Red, suggesting that S14 overexpression promoted MCF-7 cell differentiation.
Figure 5. Nile Red staining of lipid droplets.
Fluorescence microphotographs taken at ×40 (left panels) and ×100 (right panels) fold magnification of MB and MS14 cells stained with Nile Red
Effect of S14 overexpression on MCF-7 cell death
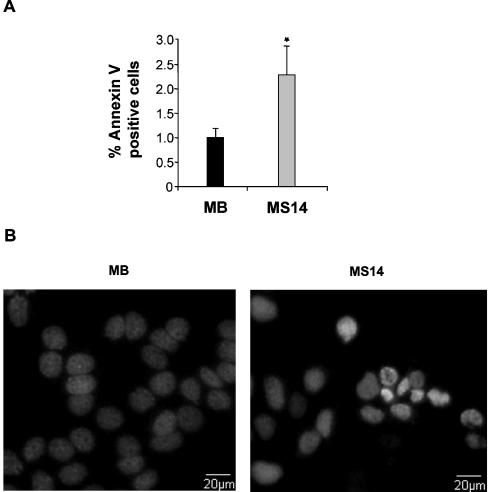
Having demonstrated that S14 overexpression in MCF-7 cells resulted in a reduction in cell growth and an induction of differentiation, we next asked whether overexpressing S14 could also cause cell death in MCF-7 cells. A significant increase in the number of dead cells measured by propidium iodide staining and subsequent flow cytometry analysis was detected in the MS14 cell line 24 h after growing the cells in experimental medium (Figure 6A). By using the MTT assay, we further confirmed the loss of cell viability of MS14 cells in comparison with MB cells (Figure 6B). Analysis of an early marker of apoptosis, annexin V staining, indicated that 2.2% of the MS14 cell population was induced to undergo apoptosis in comparison with the 1.0% found in control MB cells (Figure 7A). To confirm that S14 overexpression induces apoptosis in MCF-7 cells, Hoechst staining was also performed, and typical morphological features of apoptotic nuclei, such as DNA condensation and nuclear shrinkage, were observed in MS14 cells (Figure 7B).
Figure 7. Effect of S14 overexpression on apoptosis of MCF-7 cells.
(A) MB and MS14 cells were grown in serum-stripped medium for 6 h; afterwards, the number of apoptotic cells was determined by annexin V-FITC staining and FACS analysis. Results of three independent experiments are shown. *P<0.05. (B) Hoechst staining showing chromatin condensation in MS14 cells.
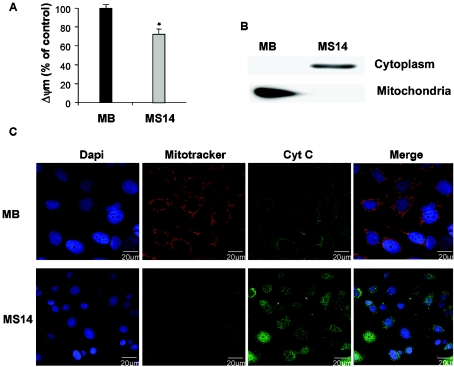
There is increasing evidence that a decrease in the ΔΨm is associated with mitochondrial dysfunction, and an altered mitochondrial function is linked to apoptosis and loss of cell viability. Hence, we next examined the effect of S14 overexpression on the ΔΨm of MCF-7 cells. We measured ΔΨm using the fluorescent probe TMRE and monitored using flow cytometry. As shown in Figure 8(A), the mitochondrial fluorescence decays and is very low in the MS14 line, compared with the MB clone, after 24 h of growth in serum-stripped medium.
Figure 8. Effects of S14 overexpression on ΔΨm and cytochrome c release in MCF-7 cells.
(A) MB and MS14 cells were cultured in serum-stripped medium for 24 h; 30 min before harvesting, cells were treated with 50 nM TMRE and analysed by flow cytometry. Results shown are the average fluorescence intensities in percentage. *P<0.05. (B) Representative Western-blot analysis of cytochrome c release. Cytoplasmic and mitochondrial extracts were obtained as described in the Experimental section. (C) Subcellular distribution of cytochrome c. MB and MS14 cells were grown on glass coverslips, as indicated in the Experimental section, and incubated with 20 nM MitoTracker Red CMXRos for 45 min. After fixing, immunofluorescence analysis was performed with a specific anti-cytochrome c antibody (green) and fluorescence was visualized by confocal microscopy. Representative results of three independent experiments are shown.
Mitochondrial factors, including cytochrome c, are released following the induction of apoptosis. Immunoblot analysis of cytosolic extracts prepared from control MB and MS14 cells demonstrated an increase in the presence of cytosolic cytochrome c in cells overexpressing the S14 protein (Figure 8B). To further confirm these results, we performed confocal microscopy studies using specific anti-cytochrome c antibodies. As can be seen in Figure 8(C), the anti-cytochrome c antibody revealed a diffuse extramitochondrial localization of cytochrome c in the majority of the MS14 cells, whereas in all MB cells, cytochrome c had a punctuate distribution and co-localized with the mitochondrial marker Mitotracker Red CMXRos.
Induction of S14 expression by several antitumorigenic agents
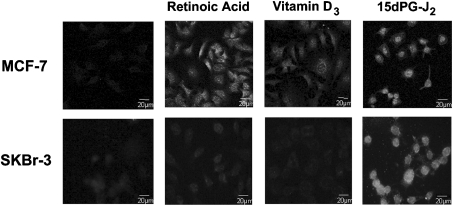
Many different studies have shown that activation of different members of the nuclear receptor superfamily, including retinoic acid receptor, vitamin D3 receptor and peroxisome proliferator-activated receptors is involved in the regulation of cell growth, differentiation and apoptosis of breast cancer cells. We next evaluated the effects of well-characterized ligands of these receptors, all-trans retinoic acid, vitamin D3 and 15dPG-J2, on the endogenous expression of S14 in parental MCF-7 and SKBr-3 (another human mammary cancer epithelial cell line) cells that have not been transfected with pCDNA3 or pCDNAS14. S14 expression markedly increased in MCF-7 cells 24 h after treatment with 100 μM all-trans retinoic acid, 100 μM vitamin D3 and 10 μM 15dPG-J2 (Figure 9). Interestingly, after treatment with retinoic acid or vitamin D3, the S14 protein is localized in both the nucleus and the cytosol; however, when the stimulus was 15dPG-J2, the S14 signal was detected primarily in the nucleus. In SKBr-3 cells, S14 protein levels were clearly induced after treatment with 15dPG-J2; however, no significant increase could be observed when the cells were grown in the presence of either retinoic acid or vitamin D3.
Figure 9. Regulation of endogenous S14 protein levels in MCF-7 and SKBr-3 cells.
Cells were grown on glass coverslips in serum-free medium and treated or not for 24 h with all-trans retinoic acid (1 μM), vitamin D3 (1 μM) or 15dPG-J2 (10 μM). After fixing, immunofluorescence analysis was performed with the E132 polyclonal antibody and fluorescence was visualized by confocal microscopy.
Effect of S14 overexpression on the MS14′ clone
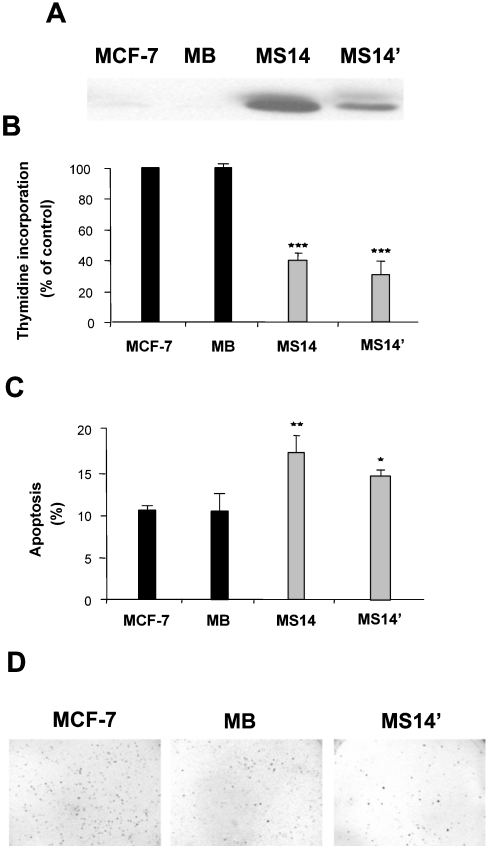
To dismiss the possibility that the anti-growth properties exhibited by the MS14 cells could be secondary to a cytotoxic effect due to the high levels of S14 protein present in this clone, we next studied another clone (MS14′) having a lower level of expression of this protein (Figure 10A). The MS14′ clone also inhibited [3H]thymidine incorporation, increased the apoptotic population, and reduced anchorage-independent growth (Figures 10B–10D) in a manner similar to that of MS14 cells.
Figure 10. Growth properties of the MS14′ clone.
(A) Western-blot analysis of S14 was performed with 20 μg of total cellular proteins extracted from MCF-7, MB, MS14 and MS14′ cells. S14 protein was detected by incubation with the E132 polyclonal antibody as described in the Experimental section. A representative Western blot is shown. Incorporation of [3H]thymidine (B), analysis of apoptosis (C) and anchorage-independent growth (D) were determined, as described in the Experimental section. *P<0.05; **P<0.01; ***P<0.001.
Effect of S14 overexpression on T47D cells
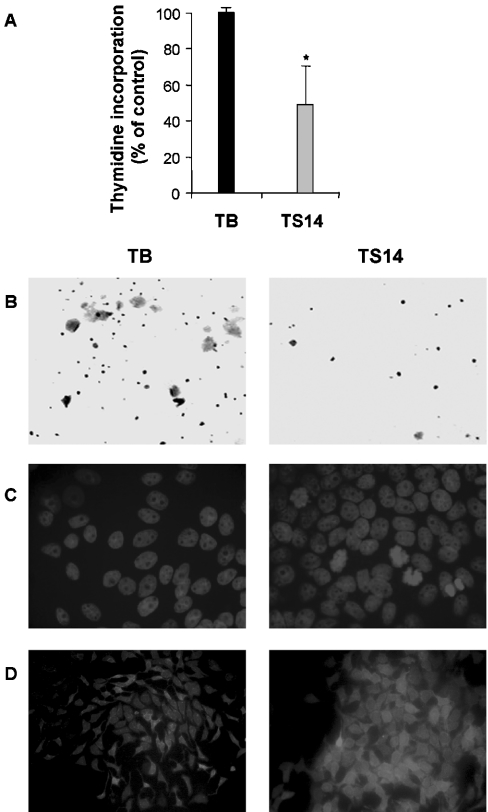
Finally, we examined whether the effect of S14 overexpression was similar in other breast cancer cells. To this end, we generated stably transfected human T47D cells overexpressing S14 (TS14) and vector-transfected cells (TB), used as controls. Consistent with its effect on MCF-7 cells, overexpression of S14 caused a significant decrease in proliferation and growth in soft agar (Figures 11A and 11B), and induced the number of cells with chromatin condensation and the accumulation of lipid droplets (Figures 11C and 11D).
Figure 11. Effect of S14 overexpression on the human mammary epithelial cell line T47D (TS14).
T47D cells were grown under the same conditions as MCF-7 cells and incorporation of 3H-thymidine (A), analysis of anchorage-independent growth (B), Hoechst staining (C) and Nile Red staining (D) were determined, as described in the Experimental section. TB, vector-transfected cells.
DISCUSSION
The results presented in this paper provide novel information on the role of S14 protein in the control of human breast cancer cell growth. In this study, we showed that induced expression of S14 inhibited in vitro growth of MCF-7 cancer cells, which was associated with the down-regulation of cyclin D1 protein levels and expression. In addition, S14 induced differentiation and cell death of MCF-7 cells.
Lipid metabolism seems to be an important factor to be considered when the outcome of human breast cancer is evaluated. High levels of expression of FAS in human breast cancer are related to a poor prognosis and inhibitors of this enzyme caused breast cancer cell death in vitro [12,13,16,17]. On the other hand, it is well known that, in breast cancer, many anti-tumour drugs act through induction of the differentiation and accumulation of lipid droplets [34].
A previous work has shown that the mRNA for S14 is expressed in several breast cancer cell lines, including MDA-MB-134, MDA-MB-453, T47D and MCF-7 [25]. Since the expression of this protein is related to lipogenesis in normal tissues [2,6,7,11] and because S14 appears to regulate the expression of lipogenic enzymes, such as FAS, acetyl-CoA carboxylase and ATP citrate lyase, in tissues like the liver [11], it has been suggested that an increase in the expression of this protein could provide an explanation for the increased lipid synthesis in breast tumour cells and, therefore, play a role in tumour cell development [25]. Nevertheless, the precise role of S14 in breast cancer tumorigenesis is still unknown. The results presented here clearly demonstrate that MCF-7 stable cell lines that constitutively overexpressed S14 proliferated much more slowly than control stable cell lines. This antiproliferative effect does not seem to represent a non-specific cytotoxic action of S14 due to the high levels of this protein in MS14 cells, since similar expression levels are observed after retinoic acid or 15dPG-J2 treatment of parental MCF-7 cells (Figure 9). This inhibition of growth was associated with a decrease in the levels of the G1 cell-cycle control protein, cyclin D1. Furthermore, our results with the cyclin D1 promoter suggest that S14 could inhibit the transcriptional activity of the human cyclin D1 promoter, although we cannot discard an indirect effect due to the reduced proliferation rates in MS14 cells. Thus S14 appears to decrease the levels of cyclin D1 protein by inhibiting de novo transcription of cyclin D1. Deregulated cyclin D1 expression triggers autonomous growth under serum-free conditions and overrides antimitogenic signals in tumour cells, strongly implicating cyclin D1 in tumorigenesis [35,36]. In line with these observations, the cyclin D1 gene is also frequently amplified and overexpressed in breast tumours [37]. All these results suggest that inhibition of cyclin D1 expression may be relevant for the antiproliferative action of S14 in MCF-7 cells.
Sweeney et al. [38] have recently shown that epidermal growth factor and neuregulin 1, two very potent inducers of proliferation and survival of human breast cancer cells, reduce the expression of S14 in MDA-MB-361 cells. Using microarray analysis, these authors have shown that activation of the ErbB family of receptor tyrosine kinases with different ligands lead to the regulation of a number of genes that play a role in the survival, growth, progression or invasiveness of breast cancer cells. Transcripts encoding cyclins D1 and D3, E2F transcription factor, jun B protooncogen or egr1 (early growth response protein 1) were stimulated in response to the growth factors. On the other hand, putative tumour suppressor genes, such as the transcription factor AP2, the homeobox protein Cdx2, amphiphysin II and CGM2 were suppressed by growth factor stimulation, along with the S14 gene. These results further support the notion that S14 could act as a negative regulator of human breast cancer cell growth.
S14 overexpression also induced differentiation of MCF-7 cells, as measured by the accumulation of lipid droplets. These results are in concurrence with numerous data from the literature showing that many antitumour drugs act through the induction of differentiation and accumulation of lipid droplets [24,34]. Besides, we also show that ligands of three nuclear receptors, which have been previously shown to promote terminal differentiation and inhibition of growth of breast tumour cells, considerably increase the expression of the human endogenous S14 gene to levels similar to those observed in MS14 cells. Nuclear hormone receptors, which comprise among others the receptors for steroids and thyroid hormones, retinoids, vitamin D3 and peroxisome proliferators, are members of a large family of ligand-inducible transcription factors that regulates a plethora of (patho)physiological processes (reviewed in [39]). Regarding their actions on breast cancer cells, nuclear receptors comprise two principal categories: those that stimulate growth and those that interfere negatively with cell proliferation. Oestrogen and androgen receptors are predominantly growth-stimulatory receptors. In contrast, ligands of retinoic acid receptors, vitamin D receptor and peroxisome proliferator-activated receptors have pronounced antiproliferative potential, which is usually linked to the capacity to induce differentiation and/or cell death (reviewed in [40]). A large body of evidence indicates that all-trans retinoic acid, vitamin D3 and 15dPG-J2 exhibit significant antiproliferative and differentiation-promoting activities towards several malignant cell types, including breast cancer [41–43]. Then, our results raise the possibility that the S14 gene could play a role as a mediator of the actions of these factors on breast cancer cells.
In conclusion, these observations suggest that S14 may be involved in the regulation of breast cancer cell growth and development, and this gene could represent a molecular target for chemoprevention of breast cancer.
Acknowledgments
This work was supported by the Dirección General de Enseñanza Superior e Investigación Científica through grants BMC2001-2342, SAF2004-06263-C02-01, and CAM GR/SAL/0033/2004 (to A.P.-C.) and grants PM99-0057, SAF2003-02962 and SAF2004-06263-C02-02 (to A.S.), and by the FIS (Fondo de Investigación Sanitaria) through grant 03C03/10 (to A.P.-C.). J.S.-R. is supported by the Agencia Española de Cooperación Internacional and by the research project 03C03/10.
References
- 1.Liaw C. W., Towle H. C. Characterization of a thyroid hormone-responsive gene from rat. J. Biol. Chem. 1984;259:7253–7260. [PubMed] [Google Scholar]
- 2.Jump D. B., Oppenheimer J. H. High basal expression and 3,5,3′-triiodothyronine regulation of messenger ribonucleic acid S14 in lipogenic tissues. Endocrinology. 1984;117:2259–2266. doi: 10.1210/endo-117-6-2259. [DOI] [PubMed] [Google Scholar]
- 3.Sudo Y., Goto Y., Mariash C. N. Location of a glucose-dependent response region in the rat S14 promoter. Endocrinology. 1993;133:1221–1229. doi: 10.1210/endo.133.3.8365364. [DOI] [PubMed] [Google Scholar]
- 4.Kinlaw W. B., Perez-Castillo A. M., Fish L. H., Mariash C. N., Schwartz H. L., Oppenheimer J. H. Interaction of dietary carbohydrate and glucagon in regulation of rat hepatic messenger ribonucleic acid S14 expression: role of circadian factors and 3′,5′-cyclic adenosine monophosphate. Mol. Endocrinol. 1987;1:609–613. doi: 10.1210/mend-1-9-609. [DOI] [PubMed] [Google Scholar]
- 5.Freake H. C., Oppenheimer J. H. Stimulation of S14 mRNA and lipogenesis in brown fat by hypothyroidism, cold exposure, and cafeteria feeding: evidence supporting a general role for S14 in lipogenesis and lipogenesis in the maintenance of thermogenesis. Proc. Natl. Acad. Sci. U.S.A. 1987;84:3070–3074. doi: 10.1073/pnas.84.9.3070. [DOI] [PMC free article] [PubMed] [Google Scholar]
- 6.Perez-Castillo A., Schwartz H. L., Oppenheimer J. H. Rat hepatic mRNA-S14 and lipogenic enzymes during weaning: role of S14 in lipogenesis. Am. J. Physiol. 1987;253:E536–E542. doi: 10.1152/ajpendo.1987.253.5.E536. [DOI] [PubMed] [Google Scholar]
- 7.Zhu Q., Mariash A., Margosian M. R., Gopinath S., Fareed M. T., Anderson G. W., Mariash C. N. Spot 14 gene deletion increases hepatic de novo lipogenesis. Endocrinology. 2001;142:4363–4370. doi: 10.1210/endo.142.10.8431. [DOI] [PubMed] [Google Scholar]
- 8.Anderson G., Qihong Z., Mucha G., Salama S., Metkowski J., Mariash A. The Spot 14 related proteins regulate de novo lipogenesis and resistance to diet induced obesity. The Endocrine Society's 86th Annual Meeting, New Orleans, LA, abstract no. OR 34-2; 2004. pp. 122–123. [Google Scholar]
- 9.Oppenheimer J. H., Kinlaw W. B., Wong N. C., Schwartz H. L., Mariash C. N. Regulation of gene S-14 by triiodothyronine in liver. Horm. Metab. Res. Suppl. 1987;17:1–5. [PubMed] [Google Scholar]
- 10.Kinlaw W. B., Tron P., Friedmann A. S. Nuclear localization and hepatic zonation of rat ‘spot 14’ protein: immunohistochemical investigation employing anti-fusion protein antibodies. Endocrinology. 1992;131:3120–3122. doi: 10.1210/endo.131.6.1446647. [DOI] [PubMed] [Google Scholar]
- 11.Kinlaw W. B., Church J. L., Harmon J., Mariash C. N. Direct evidence for a role of the ‘spot 14’ protein in the regulation of lipid synthesis. J. Biol. Chem. 1995;270:16615–16618. doi: 10.1074/jbc.270.28.16615. [DOI] [PubMed] [Google Scholar]
- 12.Alo P. L., Visca P., Marci A., Mangoni A., Botti C., Di Tondo U. Expression of fatty acid synthase (FAS) as a predictor of recurrence in stage I breast carcinoma patients. Cancer. 1996;77:474–482. doi: 10.1002/(SICI)1097-0142(19960201)77:3<474::AID-CNCR8>3.0.CO;2-K. [DOI] [PubMed] [Google Scholar]
- 13.Milgraum L. Z., Witters L. A., Pasternack G. R., Kuhajda F. P. Enzymes of the fatty acid synthesis pathway are highly expressed in in situ breast carcinoma. Clin. Cancer Res. 1997;3:2115–2120. [PubMed] [Google Scholar]
- 14.Joyeux C., Rochefort H., Chalbos D. Progestin increases gene transcription and messenger ribonucleic acid stability of fatty acid synthetase in breast cancer cells. Mol. Endocrinol. 1989;3:681–686. doi: 10.1210/mend-3-4-681. [DOI] [PubMed] [Google Scholar]
- 15.Kumar-Sinha C., Ignatoski K. W., Lippman M. E., Ethier S. P., Chinnaiyan A. M. Transcriptome analysis of HER2 reveals a molecular connection to fatty acid synthesis. Cancer Res. 2003;63:132–139. [PubMed] [Google Scholar]
- 16.Kuhajda F. P., Jenner K., Wood F. D., Hennigar R. A., Jacobs L. B., Dick J. D., Pasternack G. R. Fatty acid synthesis: a potential selective target for antineoplastic therapy. Proc. Natl. Acad. Sci. U.S.A. 1994;91:6379–6383. doi: 10.1073/pnas.91.14.6379. [DOI] [PMC free article] [PubMed] [Google Scholar]
- 17.Pizer E. S., Thupari J., Han W. F., Pinn M. L., Chrest F. J., Frehywot G. L., Townsend C. A., Kuhajda F. P. Malonyl-coenzyme-A is a potential mediator of cytotoxicity induced by fatty-acid synthase inhibition in human breast cancer cells and xenografts. Cancer Res. 2000;60:213–218. [PubMed] [Google Scholar]
- 18.Sartorelli A. C. The 1985 Walter Hubert lecture. Malignant cell differentiation as a potential therapeutic approach. Br. J. Cancer. 1985;52:293–302. doi: 10.1038/bjc.1985.193. [DOI] [PMC free article] [PubMed] [Google Scholar]
- 19.You H., Yu W., Sanders B. G., Kline K. RRR-alpha-tocopheryl succinate induces MDA-MB-435 and MCF-7 human breast cancer cells to undergo differentiation. Cell Growth Differ. 2001;12:471–480. [PubMed] [Google Scholar]
- 20.Byers S., Pishvaian M., Crockett C., Peer C., Tozeren A., Sporn M., Anzano M., Lechleider R. Retinoids increase cell-cell adhesion strength, beta-catenin protein stability, and localization to the cell membrane in a breast cancer cell line: a role for serine kinase activity. Endocrinology. 1996;137:3265–3273. doi: 10.1210/endo.137.8.8754749. [DOI] [PubMed] [Google Scholar]
- 21.Lazzaro G., Agadir A., Qing W., Poria M., Mehta R. R., Moriarty R. M., Das Gupta T. K., Zhang X. K., Mehta R. G. Induction of differentiation by 1alpha-hydroxyvitamin D(5) in T47D human breast cancer cells and its interaction with vitamin D receptors. Eur. J. Cancer. 2000;36:780–786. doi: 10.1016/s0959-8049(00)00016-2. [DOI] [PubMed] [Google Scholar]
- 22.Mueller E., Sarraf P., Tontonoz P., Evans R. M., Martin K. J., Zhang M., Fletcher C., Singer S., Spiegelman B. M. Terminal differentiation of human breast cancer through PPAR gamma. Mol. Cell. 1998;1:465–470. doi: 10.1016/s1097-2765(00)80047-7. [DOI] [PubMed] [Google Scholar]
- 23.Pignatelli M., Cortes-Canteli M., Lai C., Santos A., Perez-Castillo A. The peroxisome proliferator-activated receptor gamma is an inhibitor of ErbBs activity in human breast cancer cells. J. Cell Sci. 2001;114:4117–4126. doi: 10.1242/jcs.114.22.4117. [DOI] [PubMed] [Google Scholar]
- 24.Munster P. N., Srethapakdi M., Moasser M. M., Rosen N. Inhibition of heat shock protein 90 function by ansamycins causes the morphological and functional differentiation of breast cancer cells. Cancer Res. 2001;61:2945–2952. [PubMed] [Google Scholar]
- 25.Moncur J. T., Park J. P., Memoli V. A., Mohandas T. K., Kinlaw W. B. The ‘Spot 14’ gene resides on the telomeric end of the 11q13 amplicon and is expressed in lipogenic breast cancers: implications for control of tumor metabolism. Proc. Natl. Acad. Sci. U.S.A. 1998;95:6989–6994. doi: 10.1073/pnas.95.12.6989. [DOI] [PMC free article] [PubMed] [Google Scholar]
- 26.Perusse L., Chagnon Y. C., Dionne F. T., Bouchard C. The human obesity gene map: the 1996 update. Obes. Res. 1997;5:49–61. doi: 10.1002/j.1550-8528.1997.tb00283.x. [DOI] [PubMed] [Google Scholar]
- 27.Schuuring E., Verhoeven E., van Tinteren H., Peterse J. L., Nunnink B., Thunnissen F. B., Devilee P., Cornelisse C. J., van de Vijver M. J., Mooi W. J., et al. Amplification of genes within the chromosome 11q13 region is indicative of poor prognosis in patients with operable breast cancer. Cancer Res. 1992;52:5229–5234. [PubMed] [Google Scholar]
- 28.Champeme M. H., Bieche I., Lizard S., Lidereau R. 11q13 amplification in local recurrence of human primary breast cancer. Genes Chromosomes Cancer. 1995;12:128–133. doi: 10.1002/gcc.2870120207. [DOI] [PubMed] [Google Scholar]
- 29.Heemers H., Vanderhoydonc F., Heyns W., Verhoeven G., Swinnen J. V. Progestins and androgens increase expression of Spot 14 in T47-D breast tumor cells. Biochem. Biophys. Res. Commun. 2000;269:209–212. doi: 10.1006/bbrc.2000.2262. [DOI] [PubMed] [Google Scholar]
- 30.Martel P., Nunlist E., Bingham C., Kinlaw W. Sterol response element-binding protein 1c (SREBP-1c) is required for the induction of s14 and fatty acid synthase (FAS) gene expression by progestin in human breast cancer cells, and is a major determinant of the lipogenic tumor phenotype; The Endocrine Society's 86th Annual Meeting, New Orleans, LA, abstract no. P1-277; 2004. p. 221. [Google Scholar]
- 31.Herber B., Truss M., Beato M., Muller R. Inducible regulatory elements in the human cyclin D1 promoter. Oncogene. 1994;9:1295–1304. [PubMed] [Google Scholar]
- 32.Greenspan P., Mayer E. P., Fowler S. D. Nile red: a selective fluorescent stain for intracellular lipid droplets. J. Cell Biol. 1985;100:965–973. doi: 10.1083/jcb.100.3.965. [DOI] [PMC free article] [PubMed] [Google Scholar]
- 33.Wang T. C., Cardiff R. D., Zukerberg L., Lees E., Arnold A., Schmidt E. V. Mammary hyperplasia and carcinoma in MMTV-cyclin D1 transgenic mice. Nature (London) 1994;369:669–671. doi: 10.1038/369669a0. [DOI] [PubMed] [Google Scholar]
- 34.Cohen L. A., Amin S., Marks P. A., Rifkind R. A., Desai D., Richon V. M. Chemoprevention of carcinogen-induced mammary tumorigenesis by the hybrid polar cytodifferentiation agent, suberanilohydroxamic acid (SAHA) Anticancer Res. 1999;19:4999–5005. [PubMed] [Google Scholar]
- 35.Martinez L. A., Chen Y., Pavone A., Fischer S. M., Conti C. J. Deregulated expression of cyclin D1 overrides antimitogenic signals. Oncogene. 2000;19:315–322. doi: 10.1038/sj.onc.1203301. [DOI] [PubMed] [Google Scholar]
- 36.Zwijsen R. M., Klompmaker R., Wientjens E. B., Kristel P. M., van der Burg B., Michalides R. J. Cyclin D1 triggers autonomous growth of breast cancer cells by governing cell cycle exit. Mol. Cell. Biol. 1996;16:2554–2560. doi: 10.1128/mcb.16.6.2554. [DOI] [PMC free article] [PubMed] [Google Scholar]
- 37.Bartkova J., Lukas J., Muller H., Lutzhoft D., Strauss M., Bartek J. Cyclin D1 protein expression and function in human breast cancer. Int. J. Cancer. 1994;57:353–361. doi: 10.1002/ijc.2910570311. [DOI] [PubMed] [Google Scholar]
- 38.Sweeney C., Fambrough D., Huard C., Diamonti A. J., Lander E. S., Cantley L. C., Carraway K. L., III Growth factor-specific signaling pathway stimulation and gene expression mediated by ErbB receptors. J. Biol. Chem. 2001;276:22685–22698. doi: 10.1074/jbc.M100602200. [DOI] [PubMed] [Google Scholar]
- 39.Aranda A., Pascual A. Nuclear hormone receptors and gene expression. Physiol. Rev. 2001;81:1269–1304. doi: 10.1152/physrev.2001.81.3.1269. [DOI] [PubMed] [Google Scholar]
- 40.Altucci L., Gronemeyer H. Nuclear receptors in cell life and death. Trends Endocrinol. Metab. 2001;12:460–468. doi: 10.1016/s1043-2760(01)00502-1. [DOI] [PubMed] [Google Scholar]
- 41.Freemantle S. J., Spinella M. J., Dmitrovsky E. Retinoids in cancer therapy and chemoprevention: promise meets resistance. Oncogene. 2003;22:7305–7315. doi: 10.1038/sj.onc.1206936. [DOI] [PubMed] [Google Scholar]
- 42.Koeffler H. P. Peroxisome proliferator-activated receptor gamma and cancers. Clin. Cancer Res. 2003;9:1–9. [PubMed] [Google Scholar]
- 43.Lin R., White J. H. The pleiotropic actions of vitamin D. Bioessays. 2004;26:21–28. doi: 10.1002/bies.10368. [DOI] [PubMed] [Google Scholar]


