

Abstract
The hydrophobic modification method, which is commonly used to improve the corrosion resistance of cement-based materials, is reported to have drawbacks, including increased porosity and larger pore diameters in concrete. In this paper, a new method using coral sand as an internal curing material was proposed to optimize the pore structure of hydrophobic modified mortar. The interfacial transition zone of the mortar was analyzed to assess the varying impacts of coral sand and river sand on the pore structure within hydrophobically modified cement mortar. Due to the low surface energy of the modifier, a superhydrophobic coral sand mortar with a water contact angle of 152.2° was successfully prepared. Nuclear magnetic resonance technology was used to observe pore distribution of samples at different curing ages. This facilitated the clarification of how coral sand influences the pore structure across different wetting conditions. The proposed method is expected to refine the pore structure of superhydrophobic mortar, further improve corrosion resistance, and guide the use of durable superhydrophobic concrete in the future.
Keywords: Coral sand, Cement mortar, Pore distribution, Cumulative water absorption, Corrosion resistance
Subject terms: Civil engineering, Infrared spectroscopy
Introduction
The advancement of infrastructure in coastal regions relies heavily on concrete structures1. Marine setting harbors a significant amount of corrosive ions, with water serving as their transportation vehicle. This allows the ions to infiltrate the concrete alongside seawater, leading to steel reinforcement corrosion, concrete cracking, and spalling, ultimately affecting the service life of the structure. Hydrophobic treatment of concrete creates a barrier on its surface, effectively hindering the entry of corrosive ions carried by water and corroding the steel reinforcement2. However, hydrophobic modification methods have a detrimental effect on pore structure of concrete3, leading to an increase in pore numbers and enlargement of pore diameters4. These changes reduce the compactness5 and decrease compressive strengthof concrete6,7. Hence, there is a need to improve the pore structure of concrete under hydrophobic conditions.
Scholars have explored approaches to adjusting the concrete pore distribution. Investigations reveal that internal curing materials can store water internally and slowly release it during the hardening process of concrete8, enhancing the hydration reaction of concrete9, and thereby optimizing its pore structure10. Therefore, the introduction of internal curing materials into concrete is an effective approach to optimizing its pore structure. Coral aggregates, due to their excellent water absorption properties, can be utilized as internal curing materials in concrete11. Researchers have found that coral sand possesses the ability to optimize the pore structure of concrete12. Recent research primarily focuses on the effect of coral sand on pore structure of ordinary concrete. Given difference in wettability between ordinary concrete and hydrophobic concrete, it is essential to assess the contribution of coral sand on pore structure of concrete under hydrophobic conditions.
In order to explore the effect of coral sand on hydrophobic mortar, this study conducted an investigation of its impact on the pore structure. The interfacial transition zone of mortar was examined using scanning electron microscopy (SEM) to evaluate the impacts of coral sand and river sand on the pore structure of hydrophobic modified concrete. The active component of the hydrophobic modifier is the solid content, consisting of stearic acid with low surface energy functional groups. Modified solutions with different stearic acid contents were prepared to modify coral sand mortar. Using Fourier-transform infrared spectroscopy (FT-IR), the optimal modification parameters for stearic acid in mortar were determined through water contact angle experiments. Compressive strength of mortar at different curing ages was assessed. Pore distribution in samples at varying curing ages was examined using nuclear magnetic resonance (NMR) technology. The corrosion resistance of mortar was evaluated. Notably, the use of coral sand as an internal curing material in hydrophobic mortar offers a novel approach compared to traditional methods, particularly in its ability to enhance pore structure while also improving water absorption properties. This study is expected to provide experimental evidence for optimization of pore structure in marine corrosion-resistant concrete.
Experiments
Materials
The mortar consisted of Portland cement (P.O 42.5), water, river sand and coral sand. Portland cement was produced by Shandong Bohao Building Materials Co., Ltd. Coral sand purchased from Jiande Shenmeng Environmental Protection Materials Co., Ltd. The river sand purchased from Jinan Qingtian Chemical Technology Co., Ltd. The particle accumulation curves of river sand and coral sand applied in test are shown in Fig. 1. Waterborne stearic acid emulsion (the content of stearic acid is 30 wt%) was acquired from Jining Fanghe Chemical Co., Ltd.
Fig. 1.

Particle accumulation curve of river sand and coral sand.
Sample fabrication
The active ingredient in the waterborne stearic acid emulsion is stearic acid, accounting for 30%. Coral mortars with the stearic acid content of 0%, 0.3%, 0.6%, 0.9%, and 1.2% were prepared (denoted as CM0, CM0.3, CM0.6, CM0.9, CM1.2, respectively). The content of stearic acid was calculated based on the ratio of stearic acid in the emulsion to the mass of fine aggregate. The water-to-cement ratio of the prepared cement mortar was 0.45:1. The optimal dosage of stearic acid in river sand mortar has been studied by the research team13. Based on the above-mentioned research and the experimental studies conducted in this paper, coral sand mortar with a stearic acid content of 0.9% has the best hydrophobic effect. In order to compare core sand mortar with river sand mortar, the river sand mortar with a content of 0.9% stearic acid (denoted as RM0.9) was prepared. The process for preparing hydrophobic modified mortar is depicted in Fig. 2. Firstly, the waterborne stearic acid emulsion was mixed evenly with water to prepare modified solutions with different concentrations of stearic acid. Cement and fine aggregates were mixed evenly, and the modified liquid is added. Fresh mortar was mixed for 5 min. The fresh mortar was poured into the molds. After curing, sandpaper was used to polish the surface of the mortar to remove surface impurities and achieve roughness.
Fig. 2.

Preparation process diagram of hydrophobic modified cement mortar.
Characterizations
To verify the hydrophobic performance of the mortar, an optical contact angle measuring instrument was employed to evaluate the water contact angle. Chemical functional group changes in the mortar caused by stearic acid were assessed by FT-IR spectroscopy. Moreover, TGA technology was chosen for thermogravimetric analysis because it accurately measures the mass change of materials during heating and provides information on the thermal stability of the materials. The mass loss of CM0, CM0.3, CM0.6, CM0.9, CM1.2, and RM0.9 samples were obtained through thermogravimetric analysis (TGA). To explore the microstructure of the mortar, SEM was employed for observation.
NMR experiment
NMR technology was chosen to measure porosity because it provides high-precision pore size distribution information and allows for non-destructive analysis. The relaxation spectra of the mortar were detected using the NMR analyzer to calculate the pore distribution of the mortar. The fresh mortar sample used in the experiment was poured into a cylindrical mold (inner diameter 50 mm, height 100 mm) and cured in a curing box. The T2 measurement data of cement mortar was collected with curing ages of 3, 7, 14, and 28 days. The mortar blocks were taken out 1 day before data collection and soaked in a vacuum saturation device for 24 h. The relaxation time indicates the distribution of pore sizes within concrete14,15. A high T2 value indicates a large pore radius. The peak position reflects the pore size, peak area is proportional to the number of pores16. For cement-based materials, the pore radius is able to be calculated as17:
 |
1 |
where  is pore radius.
  is a constant conversion coefficient (μm/ms). The value of
  used in this test is 0.008 μm/ms according to experience. Through a relaxation curve, the pore size distribution of the internal pores of the specimen can be inverted.
Compressive test
The testing was performed in accordance with the GB/T 50,081-2019 standard18. CM0, CM0.3, CM0.6, CM0.9, CM1.2, and RM0.9 samples were prepared and cured. The test was conducted using samples with curing ages of 3, 7, 14, and 28 days.
Cumulative water absorption test
CM0, CM0.3, CM0.6, CM0.9, CM1.2, and RM0.9 sample test blocks with dimensions of 70.7 × 70.7 × 70.7 mm3 were prepared. The test block shall be weighed for the first time after 28 days of curing. Before weighing, the sample should be thoroughly dried. First, the test blocks were weighed once. Then, the blocks were immersed in water. During the soaking period, the blocks were taken out of the water and weighed every hour in the first 6 h. After 6 h, the blocks were taken out and weighed every 12 h. The cumulative water absorption rate can be calculated using the following formula:
 |
2 |
where  is the mass of the mortar specimen before immersion,
  is the mass of the mortar specimen after immersion, and
  is the cumulative water absorption.
Corrosion resistance test
The electrochemical workstation was used to conduct electrochemical tests to assess the corrosion resistance of cement mortar. Electrochemical measurements of CM0, CM0.3, CM0.6, CM0.9, CM1.2, and RM0.9 samples were performed using a three electrode system. The mortar specimens were prepared as a pillar-like shape. The height of the mortar specimens were 30 mm, and the diameter were 20 mm. When mixing fresh mortar, an iron nail was inserted into the center of the mortar specimen. Before testing, the samples were soaked in a 3.5% NaCl solution for 24 h. Then, the samples were dried for electrochemical detection. The polarization resistance ( ) of cement mortar samples can be calculated by Stern-Geary equation19:
 |
3 |
where  is the polarization resistance of the mortar specimens.
  is the corrosion current density.
  is the Tafel slope in the anode branch.
  is the Tafel slope in the cathode branch.
Results and discussion
The influence of stearic acid on the wettability of mortar
Different concentrations of stearic acid can lead to changes in wettability of mortar. Figure 3 examines impact of stearic acid concentration on wettability of coral sand mortar samples. The inclusion amounts of stearic acid were 0%, 0.3%, 0.6%, 0.9%, and 1.2%, corresponding to CM0, CM0.3, CM0.6, CM0.9, and CM1.2 samples. The time of water contact angle measurement was recorded when water droplets first made contact with the mortar surface. The water contact angle of the mortar was 5.5° when the coral sand mortar did not contain stearic acid. This is because unmodified coral sand cement mortar is hydrophilic. Due to capillary action or pores, water is easily absorbed into the interior of the structure. Water contact angle of mortar specimen initially rose and then experienced a modest reduction with the rise in stearic acid content. Notably, the water contact angle reached 152.2° when the stearic acid concentration was 0.9%. At this point, water contact angle was the highest value among all the groups. The water contact angle of coral sand mortar was 148.3°, showing a downward trend as the content of stearic acid increased to 1.2%. This occurs as the excessive accumulation of stearic acid disturbs both the microstructure and nanostructure of the surface20 and the exposure of hydrophilic groups in stearic acid21. The mechanism diagram of excessive stearic acid leading to the exposure of hydrophilic groups is shown in Fig. 4. The measurement of the water contact angle reveals that a 0.9% concentration of stearic acid allows coral sand mortar to attain superhydrophobicity.
Fig. 3.
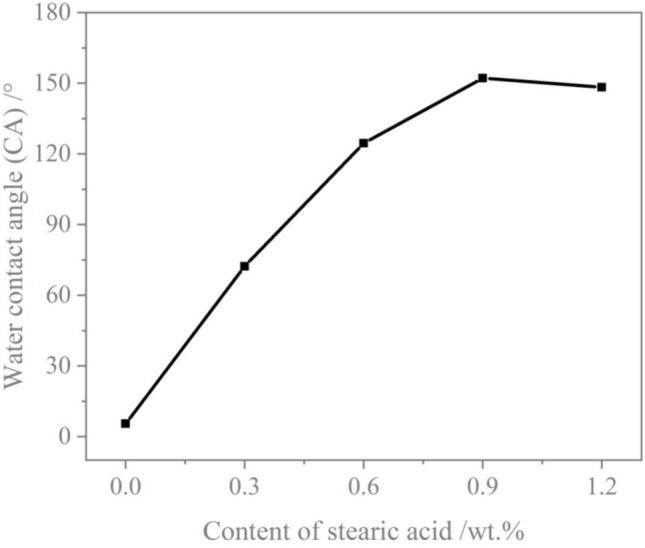
The influence of content of stearic acid on the wettability of coral sand cement mortar samples.
Fig. 4.

The mechanism diagram of excessive stearic acid leading to the exposure of hydrophilic groups.
The river sand cement mortar with a content of 0.9% stearic acid was also prepared, corresponding to the RM0.9 sample as the control group. Figure 5 shows the photos and water contact angles of water droplets on CM0, CM0.3, CM0.6, CM0.9, CM1.2, and RM0.9. Stearic acid can effectively establish a hydrophobic barrier in mortar. The samples modified with stearic acid were not easily wetted. The RM0.9 sample exhibited spherical-shaped water droplets, standing at a water contact angle of 151.8°, which was very similar to CM0.9. A modification solution with a content of 0.9% stearic acid achieved superhydrophobicity of coral mortar and river mortar.
Fig. 5.

Photos and water contact angles of water droplets on the surfaces of mortar containing different contents of stearic acid: (a) CM0, (b) CM0.3, (c) CM0.6, (d) CM0.9, (e) CM1.2, and (f) RM0.9.
X-ray diffraction analysis
Figure 6 shows X-ray diffraction (XRD) patterns of CM0, CM0.3, CM0.6, CM0.9, CM1.2, and RM0.9. As observed in Fig. 6a, the primary components of the samples consist of hydrated calcium silicate (C–S–H), calcium carbonate (CaCO3), quartz, ettringite (AFt), calcium hydroxide (Ca(OH)2). The chemical composition of coral sand mortar with different stearic acid contents was the same, and the modified coral sand mortar was the same as the unmodified coral sand mortar. After modifying the coral sand cement mortar with stearic acid, no diffraction peaks disappeared, nor did any new diffraction peaks appear in the XRD spectrum. Only changes in intensity were observed. As the concentration of stearic acid increased, a slight reduction was observed in the peak value of cement hydration products within coral sand mortar. This indicates that the crystal structure of coral sand mortar modified with stearic acid has not changed, but the degree of cement hydration has changed. Figure 6b shows the XRD pattern of RM0.9. The figure reveals that in the mortar made with river sand, the diffraction peak of quartz appears more pronounced, whereas the diffraction peak of CaCO3 appears less prominent compared to the mortar crafted from coral sand. This observation is attributed to the fact that coral sand primarily consists of CaCO322. A higher concentration of quartz was observed in river sand compared to coral sand. Moreover, the chemical composition of the modified river sand mortar was found to be identical to that of the modified coral sand mortar. XRD analysis revealed that the crystal structure of the mortar remained unaltered, irrespective of whether river sand or coral sand was incorporated into the preparation of the hydrophobically modified mortar.
Fig. 6.

X-ray diffraction (XRD) spectra of (a) coral sand mortar with different contents of stearic acid and (b) superhydrophobically modified river sand mortar.
Chemical functional group analysis
To examine the variations in functional groups of the samples prior to and after treatment with a low surface energy modifier, CM0, CM0.9, and RM0.9 were analyzed using FT-IR. Figure 7 demonstrates FT-IR spectra of CM0, CM0.9, and RM0.9. The absorption band at 874 cm−1 was ascribed to the bending vibration of carbonate groups23. Vibration band with a peak of 1423 cm−1 corresponding to the asymmetric tensile vibration of carbonates24. Asymmetric stretching peak of Si–O was at 1002 cm−1, demonstrating the presence of C-S–H in mortar25. The stretching vibration peak of the hydrophilic functional group –OH in Ca(OH)2 was around 3341 cm−1. The stretching vibration peak corresponding to the hydrophilic functional group –OH in Ca(OH)2 was observed around 3341 cm−1 26, which was due to the presence of crystalline water in the hydration product27. The functional group of –OH indicated that stearic acid branched on mortar via chemical reactions involving functional groups,rather than simply being physically coated3. The FT-IR spectra of stearic acid-modified coral sand mortar and river sand mortar exhibited enhanced peaks at 2918 and 2850 cm−1, attributable to stretching vibrations of the hydrophobic functional groups −CH2 and −CH328,29. The FT-IR test results indicate that stearic acid introduces low surface energy functional groups into coral sand mortar and river sand mortar via chemical modification, thereby converting the hydrophilic mortar into superhydrophobic mortar.
Fig. 7.
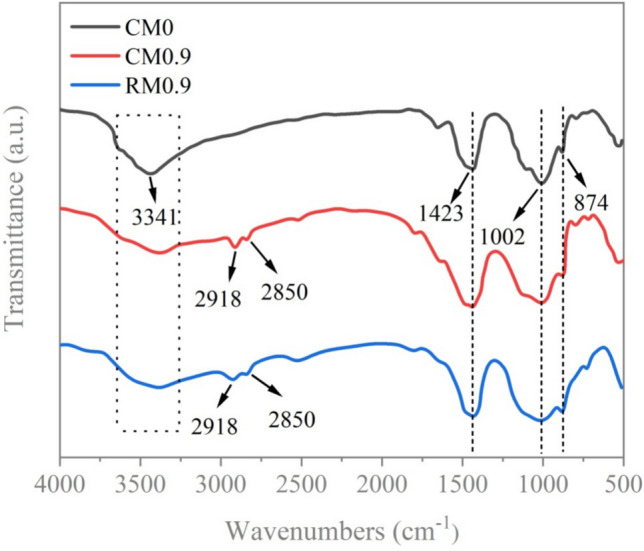
Fourier transform infrared spectroscopy (FT-IR) spectra of coral sand mortar and river sand mortar under the hydrophobic modification effect of stearic acid.
Morphological analysis
In order to observe the surface morphology of the sample, SEM was utilized to detect the mortar. Figure 8 shows the SEM images of CM0, CM0.3, CM0.6, CM0.9, CM1.2, and RM0.9 at the magnification of 3000 times. Although the stearic acid content in mortar was different, each sample contained a lot of hydration products, including acicular AFt crystal, flaky Ca(OH)2 and C–S–H. For coral sand mortar, the structure of CM0 was relatively dense with fewer pores. A high proportion of C–S–H was observed in hydration products (Fig. 8a). With increasing stearic acid content, the pore count in the mortar increased, and the pore size progressively expanded. Consequently, the compaction of the mortar decreased (Fig. 8b-c). At a stearic acid concentration of 0.9%, larger pores can be clearly observed. Needle shaped AFt growth around the pores, which increased the roughness of the mortar (Fig. 8d). According to reports, a rough surface texture is among the key factors contributing to hydrophobicity30–32. As the content of stearic acid continued to increase, the structural density continued to decrease (Fig. 8e). The pore size in the mortar grew continuously, causing the structure to loosen, which in turn negatively impacted the mechanical properties of the mortar. Moreover, there was a large amount of AFt in the structure to form sufficient roughness. This was beneficial for the formation of hydrophobicity in mortar. The incorporation of a hydrophobic modifier can suppress cement hydration and result in structural loosening4. There were large pores in RM0.9, filled with a large amount of needle shaped AFt (Fig. 8f). Meanwhile, a looser structure was observed in the image of RM0.9 compared to CM0.9.
Fig. 8.

Scanning electron microscope (SEM) images of mortar with different contents of stearic acid: (a) CM0, (b) CM0.3, (c) CM0.6, (d) CM0.9, (e) CM1.2, and (f) RM0.9 at the magnification of 3000 times.
In order to further observe the differences in the intrinsic microstructure between superhydrophobic river sand mortar and superhydrophobic coral sand mortar under 0.9% stearic acid modification conditions, SEM was used to detect CM0.9 and RM0.9 at a magnification of 20,000 times. As shown in Fig. 9. The detection of RM0.9 sample revealed cracks between river sand and cement hydration products. The explanation for this observation is that the internal free water in the mortar tends to aggregate near the aggregates, thereby increasing the water cement ratio around the aggregates, resulting in weak adhesion between cement matrix and aggregates33. In addition, the smooth surface texture of the river sand further reduces the compaction and bonding strength of the interface transition zone34. Therefore, there were obvious cracks between cement hydration products and river sand. However, observation of coral sand mortar mixed with 0.9% stearic acid revealed no significant cracks at the interface between cement hydration products and coral sand particles. This is because the internal curing effect of coral aggregates made interface transition zone dense35. This study suggests that coral sand with a porous structure served as an internal storage for curing water in superhydrophobic structures, optimizing the interface between coral sand and cement hydration products.
Fig. 9.

SEM images of the interface transition zone of (a) superhydrophobic river sand mortar and (b) superhydrophobic coral sand mortar at a magnification of 20,000 times.
Thermogravimetric analysis
Due to the ability to quantify hydration products, TGA is employed to assess the hydration degree at different stages of cement36. Samples CM0, CM0.3, CM0.6, CM0.9, CM1.2, and RM0.9 were prepared to measure weight loss of hydration products. Figure 10 presents TGA curve of mortar samples, illustrating weight lossacross the temperature spectrum from 30–1000 °C. There were three stages. Initial stage was 30–250 °C. The quality loss in this stage was primarily attributed todehydration of physically bound water in AFt and C–S–H3. The second stage was from 400–500 °C. The quality loss in this stage was primarily attributed tothe dehydration and decomposition of Ca(OH)2 to produce calcium oxide37. The third stage was from 550–800 °C. The quality loss in this stage was primarily attributed to the decomposition and decarbonization of CaCO338.
Fig. 10.

Thermogravimetric analysis (TGA) results of mortar with different contents of stearic acid.
Table 1 presents mass loss of CM0, CM0.3, CM0.6, CM0.9, CM1.2, and RM0.9 samples at different temperature ranges. Within the range of 30–250 °C, weight loss of CM0 was 8.08%. With the increase in stearic acid content, the mass loss in this range decreased. The weight loss rate of CM1.2 was 5.01%, which was 38.00% lower than that of CM0. This suggests that stearic acid inhibits the hydration of cement in coral sand mortar, leading to a decrease in generation of C–S–H and AFt. For mortar modified with the same content of stearic acid, the quality loss of RM0.9 was 4.70%, The quality loss of CM0.9 was 5.06%. The weight loss rate of RM0.9 was 7.66% lower than that of CM0.9. The quality loss at this stage indicates the existence of the inhibitory effect of stearic acid on cement hydration in mortar. Furthermore, the inhibition level of stearic acid on the hydration of coral sand mortar was milder compared to that of river sand mortar. Generally speaking, weight loss of Ca(OH)2 within the temperature range of 400–500 °C is also linked to the hydration process of cement. The weight loss of coral sand mortar slightly diminished in this temperature interval with an increase in stearic acid content. Nonetheless, stearic acid has the capability to react with Ca(OH)2, consequently forming calcium stearate39. Consequently, in this study, the extent of cement hydration cannot be assessed through weight loss of Ca(OH)2. Decarburization weight loss rate of CaCO3 in coral sand mortar samples did not show significant changes from 550–800 °C. However, compared with river sand mortar, it was found that the weight loss rate of coral sand mortar increased significantly at this stage. This is because CaCO3 is the main component of coral sand.
Table 1.
Effect of different contents of stearic acid on mass loss of cement mortar at different temperature ranges.
| Sample | Weight loss (%) | ||
|---|---|---|---|
| 30–250 °C | 400–500 °C | 550–800 °C | |
| CM0 | 8.08 | 1.47 | 18.06 |
| CM0.3 | 7.35 | 1.47 | 17.98 |
| CM0.6 | 6.42 | 1.46 | 18.03 |
| CM0.9 | 5.06 | 1.41 | 17.96 |
| CM1.2 | 5.01 | 1.40 | 17.94 |
| RM0.9 | 4.70 | 1.45 | 7.03 |
Analysis of the pore structure of hardened cement mortar by low-field NMR
Figure 11 displays T2 spectra of samples CM0, CM0.3, CM0.6, CM0.9, CM1.2, and RM0.9. Transverse relaxation time in the T2 spectra is related to pore size by a proportional relationship40,41. For coral sand mortar, as the curing period of the mortar lengthened, second peak of CM0 shifted to the right. The reason for this phenomenon is the porosity of coral sand, which leads to high connectivity of internal pores in hardened mortar. External water can readily infiltrate and occupy large pores, resulting in an increase in relaxation time. The trend of secondary peak of coral sand mortar modified with stearic acid was different from CM0. As the maintenance age increases, the relaxation time corresponding to the Secondary peak of CM0.3, CM0.6, CM0.9, and CM1.2 decreased. The reason lies in the reduced water absorption capacity of hydrophobically modified coral sand mortar when compared to unmodified coral sand mortar. As the stearic acid content increased, external water increasingly found it challenging to infiltrate the interior of the mortar to fill large pores. The main peak variation trend of coral sand mortar with varying stearic acid contents across different curing ages remained consistent. With longer curing periods, the main peak shifted leftward, relaxation time decreased, and larger pores were progressively filled and refined. The evaporated water that did not participate in the reaction moved towards smaller pores. Evaporated water continuously undergoes hydration reactions with the bonding substances in cement mortar, transforming into chemically bound water42. When cured for 28 days, as the proportion of stearic acid rose, the relaxation time corresponding to the main peak of the coral mortar sample increased. This suggests that raising the level of stearic acid can boost the capillary water content in coral mortar. Meanwhile, higher concentrations of stearic acid led to a greater proportion of secondary peaks in the overall spectrum. It results in more large pores in coral sand mortar. The increase and enlargement of pores can lead to a decrease in the compactness of mortar. In addition, as the curing duration extended, relaxation time corresponding to main peak of RM0.9 decreased. This is consistent with coral mortar. The main peak shifted towards left because of hydration of cement, and Ca(OH)2 crystal, AFt crystal and C–S–H were produced and filled with pores. However, between 14 and 28 days, the variation in the peak value of RM0.9 was minimal, which differs from the spectra of various coral sand mortar samples. In early period of curing, considering the porosity of coral sand, water was stored in pores and did not engage in hydration reactions. Post-curing, portions of the capillary and gel water evaporate to mortar surface43. Therefore, hydration reaction of each group of coral mortar samples continued after 14 days of curing. This resulted in continual alterations to the T2 spectra distribution of coral sand mortar. The T2 spectra associated with the primary peak experienced an increase from 14 to 28 days, with larger pores being polished and subdivided into smaller pores.
Fig. 11.

T2 distribution of hardened cement mortar samples at different curing ages: (a) CM0, (b) CM0.3, (c) CM0.6, (d) CM0.9, (e) CM1.2, and (f) RM0.9.
According to formula (1), the distribution of apertures was calculated from the relaxation time distribution. The pores in the mortar are categorized into four types based on their pore size: harmless pores (r < 20 nm), less harmful pores (20–50 nm), harmful pores (50–200 nm), and multiple-hazard pores (r > 200 nm). Figure 12 illustrates the the distribution of pore types in six groups of mortar. The pore size distribution remained continuous across all six mortar groups. For coral sand mortar, an increase in stearic acid content led to a decline in the percentage of harmless pores and a simultaneous increase in the percentage of multiple-hazard pores. Specifically, the proportion of harmless pores in the pore distribution of coral sand mortar decreased from 77.17 to 54.01% as the amount of stearic acid rose from 0 to 1.2%. The proportion of multiple-hazard pores in pores distribution increased from 8.17 to 22.77%. For cement mortar modified with 0.9% stearic acid content, the harmless pores, less harmful pores, harmful pores, and multiple-hazard pores in pore distribution of CM0.9 were 61.16%, 8.62%, 13.44%, and 16.78%, respectively. The proportions of these four types of pores in the pore distribution of RM0.9 were 52.86%, 7.71%, 14.72%, and 24.71%, respectively. In the pore size distribution, the proportion of harmless pores in CM0.9 was 8.30% higher than that in RM0.9. The proportion of multiple-hazard pores in CM0.9 was 7.93% lower than that in RM0.9. Compared to RM0.9, there were more harmless pores and less harmful pores in CM0.9, whereas there were fewer harmful pores and multiple-hazard pores in CM0.9. Based on the microstructural analysis, river sand, with its smooth surface, exhibits poor bonding between the cement and sand particles, which promotes the formation of cracks at the interface, leading to an increase in harmful pores. In contrast, coral sand, with its porous and rough surface structure, facilitates a stronger bond between the cement hydration products and the sand particles, resulting in a denser interface and a reduction in the formation of harmful pores44. Excessive harmful pores and multiple-hazard pores can lead to a decrease in the compactness of the structure. This adversely affects the strength of cement mortar.
Fig. 12.

Proportion of each pore structure type in mortar with different contents of stearic acid at the curing age of 28 days.
Compressive strength
Figure 13 presents the compressive strengths of CM0, CM0.3, CM0.6, CM0.9, CM1.2, and RM0.9 after curing for 3, 7, 14 and 28 days. For coral sand mortar, compressive strength showed a decreasing trend as the level of stearic acid was raised. This is because the waterproofing of coral sand mortar was improved Due to the impact of stearic acid modification. The air waterproof layer formed around the pores inside the structure made it increasingly difficult for water to enter the interior of the mortar, resulting in a decrease in the curing effect and compressive strength of mortar. Specifically, after 28 days of curing, compressive strength of CM0.3, CM0.6, CM0.9, CM1.2 were 5.79%, 11.34%, 15.96%, and 22.29% lower than that of CM0, respectively. The presence of stearic acid diminished the compressive strength of mortar. The cause of this phenomenon is the increase in large pores in the mortar due to modification effect of stearic acid. The density of the mortar structure decreased, resulting in lower compressive strength. Concurrently, the rapid rise in the early strength of coral sand mortar samples was noted. And the growth rate of strength slowed down in the later stage of the curing period. Previous study have shown that the early strength development of coral sand mortar was faster than that of river sand mortar45. Test results of compressive strength reveal that under hydrophobic conditions, coral sand mortar also has good early strength development. The compressive strength of coral sand mortar is adversely affected by the inclusion of stearic acid. Meanwhile, coral aggregates have low compressive strength and high brittleness46. However, after a 28-day curing period, the compressive strength of RM0.9 reached 24.52 MPa. The compressive strength of CM0.9 was 26.78 MPa. The compressive strength of RM0.9 was 8.43% lower than that of CM0.9. This is because under superhydrophobic conditions, the internal curing effect reduces the large pores in coral sand mortar, resulting in CM0.9 being more compact than RM0.9. Stearic acid modification improves hydrophobicity but reduces compressive strength due to increased large pores and lower density. In practical applications, hydrophobicity is crucial for exterior coatings or pool waterproofing, where compressive strength is less critical. However, for structural components or pavement materials, both properties need to be balanced. The choice of modification depends on whether hydrophobicity or compressive strength is prioritized.
Fig. 13.

Compressive strength of mortar with different contents of stearic acid after 3, 7, 14, 28 days of curing.
Cumulative water absorption
The cumulative water absorption rate is used as one of the important indicators for predicting the durability of cement mortar47,48. Figure 14 illustrates the cumulative water absorption of CM0, CM0.3, CM0.6, CM0.9, CM1.2, and RM0.9. Within the first 6 h, water absorption rates of all coral sand mortar and RM0.9 exhibited a rapid increase. Subsequently, the absorption rates of samples gradually slowed and stabilized after 84 h. The cumulative water absorptions for CM0, CM0.3, CM0.6, CM0.9, and CM1.2 were 2.77%, 1.90%, 1.41%, 1.02%, and 1.08%, respectively, by 102 h. The water absorption of CM0.3, CM0.6, CM0.9, and CM1.2 decreased by 31.38%, 49.07%, 63.01%, and 60.92% compared to CM0.It is worth noting that the cumulative water absorption pattern of RM0.9 was similar to that of coral sand mortar. By 102 h, the cumulative water absorption of RM0.9 was 1.12%. CM0.9 demonstrates a cumulative water absorption 8.93% lower than that of RM0.9. During the lifespan of structure, the unsaturated internal structure of the mortar allows water to penetrate49. Incorporating stearic acid as a hydrophobic modifier into mortar can reduce capillary suction and enhance its water repellency. For coral sand mortar, water absorption of mortar sample showed a slight decrease with an increase in stearic acid content within a specific range. When the amount of stearic acid exceeded a certain limit, it cannot continue to promote a decrease in water absorption. This is because the pore distribution has a certain influence on the range of changes in the cumulative water absorption of mortar incorporating compounds with reduced surface energy3. Cumulative water absorption of RM0.9 was modestly higher compared to CM0.9, which helps confirm this point. The cumulative water absorption test reveals that despite the existence of pores, mortar can still become hydrophobic. This effect is due to the low surface energy exhibited by the C–H functional groups within stearic acid, creating a waterproof layer in the mortar that resists water infiltration. As the content of stearic acid rises within a defined range, the impermeability of the cement mortar increases. The variation trend in the water contact angle corroborates this outcome. However, excessive large pores can lead to an increase in cumulative water absorption.
Fig. 14.
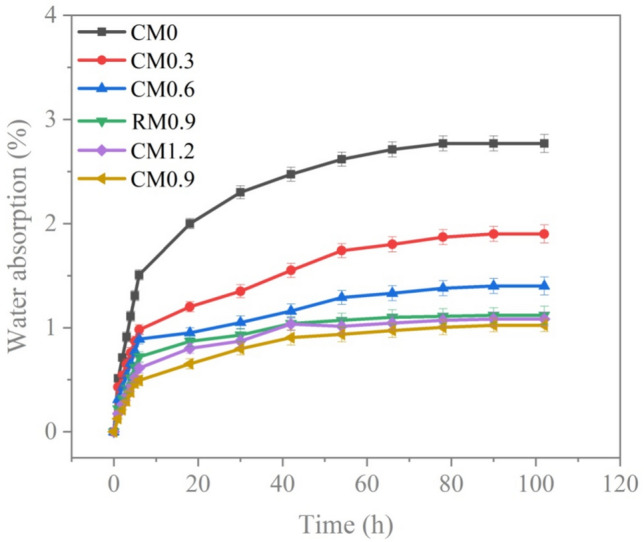
Cumulative water absorption of mortar with different contents of stearic acid.
Corrosion resistance property
The potential-dynamic polarization curves of CM0, CM0.3, CM0.6, CM0.9, CM1.2, and RM0.9 are presented in Fig. 15. The corrosion potential ( ) of CM0 was the smallest, while that of CM0.9 was the highest, indicating its superior corrosion resistance compared to the others. High
  represents good corrosion resistance. CM0.9 is the set of mortar samples with the best corrosion resistance.
Fig. 15.

The potential-dynamic polarization curves of mortar with different contents of stearic acid.
Table 2 shows the relevant Tafel constants of CM0, CM0.3, CM0.6, CM0.9, CM1.2, and RM0.9. For coral sand mortar, with more stearic acid added, the value of  went up, and the value of
  went down. This trend is further confirmed by the presence of higher
  and lower
  values on the potential polarization curve. Improved corrosion resistance is demonstrated by the presence of higher
  and lower
  values on potential polarization curve50. However, when the content of stearic acid increased to 1.2%, the
  of mortar showed a slight downward trend and the
  showed a slight upward trend. Meanwhile, the
  of CM0.9 is higher than that of RM0.9, and the
  of CM0.9 is lower than that of RM0.9. Polarization resistance (
 ) is also an important indicator for evaluating the corrosion resistance performance of materials. High
  indicates good corrosion resistance19. The
  of CM0, CM0.3, CM0.6, CM0.9, CM1.2, and RM0.9 were 1.19 × 10⁴, 1.64 × 10⁵, 2.93 × 10⁵, 1.16 × 10⁶, 3.56 × 10⁵, 3.54 × 10⁵, respectively. The
  of CM0.9 is the highest. Stearic acid can improve the corrosion resistance of mortar within a certain range, but excessive amounts of stearic acid cannot continue to be beneficial for further improving the corrosion resistance of coral sand mortar. The coral sand mortar exhibited the highest corrosion resistance at a stearic acid content of 0.9%. Additionally, CM0.9 demonstrated superior corrosion resistance compared to RM0.9. The
  of CM0.9 is − 0.079 V, while the
  of RM0.9 is − 0.127 V. The
  of CM0.9 was 0.048 V higher than that of RM0.9. The
  of CM0.9 was one order of magnitude higher than that of RM0.9. This is due to the optimized pore structure in CM0.9 compared to RM0.9, where the structure is more compact. Therefore, the cumulative water absorption of CM0.9 is less than that of RM0.9, and its corrosion resistance is superior to that of RM0.9. The superior corrosion resistance of coral sand cement mortar is also related to its relatively dense pore structure and good cement-aggregate bond strength. The rough surface of coral sand improves the interface bonding, reduces crack formation, and thus enhances its corrosion resistance. The hydrophobic modification effect of stearic acid can reduce the corrosion caused by corrosive ions entering the mortar with water. However, corrosion resistance is to some extent affected by pore distribution. Excessive large pores can reduce the corrosion resistance of mortar.
Table 2.
Effect of different contents of stearic acid on Corrosion potential ( ), corrosion current density (
 ) and polarization resistance (
 ).
).
| Sample |
 , (V) , (V) |
 , (A/cm2) , (A/cm2) |
RP, (kΩ cm2) |
|---|---|---|---|
| CM0 | − 0.295 | 3.21 × 10⁻⁵ | 1.19 × 10⁴ |
| CM0.3 | − 0.223 | 1.44 × 10⁻⁵ | 1.64 × 10⁵ |
| CM0.6 | − 0.180 | 8.85 × 10⁻⁶ | 2.93 × 10⁵ |
| CM0.9 | − 0.079 | 1.54 × 10⁻⁶ | 1.16 × 10⁶ |
| CM1.2 | − 0.122 | 5.85 × 10⁻⁶ | 3.56 × 10⁵ |
| RM0.9 | − 0.127 | 5.35 × 10⁻⁶ | 3.54 × 10⁵ |
Conclusions
A method for optimizing the pore structure of hydrophobic mortar based on the substitution of coral sand for river sand was proposed. The observation of the microstructure revealed that the superhydrophobic river sand mortar exhibited visible cracks between the river sand and the cement hydration products, whereas the superhydrophobic coral sand mortar showed no obvious cracks between the coral sand particles and the cement hydration products. In the pore size distribution, proportion of harmless pores in superhydrophobic coral sand mortar was 8.30% higher than that in superhydrophobic river sand mortar. The proportion of multiple-hazard pores in superhydrophobic coral sand mortar was 7.93% lower than that in superhydrophobic river sand mortar. The pore structure of superhydrophobic coral sand mortar was denser than that of superhydrophobic river sand mortar. The cumulative water absorption of superhydrophobic coral sand mortar was 8.93% lower than that of superhydrophobic river sand mortar. The corrosion potential of superhydrophobic coral sand mortar was 0.048 V greater than that of superhydrophobic river sand mortar. Its polarization resistance was also one order of magnitude higher, indicating superior corrosion resistance compared to the superhydrophobic river sand mortar. The proposed method has important applications in offshore construction projects, especially in the construction of offshore platforms. The coral sand-optimized superhydrophobic mortar can significantly improve corrosion resistance, thereby extending its service life.
Author contributions
Yayun Zhao conducted the experiments and data analysis under the advising of Qing Wang; Qing Wang, Yayun Zhao, Xu Zheng and Rui Zhang wrote, reviewed and edited the manuscript.
Data availability
Some or all data that support the findings of this study are available from the corresponding author upon reasonable request.
Declarations
Competing interests
The authors declare no competing interests.
Footnotes
Publisher’s note
Springer Nature remains neutral with regard to jurisdictional claims in published maps and institutional affiliations.
References
- 1.Devda, P. & Muhammad, S. Feasibility studies on marine sand from off-shore dredging for plastering applications. Mater. Struct.57, 77 (2024). [Google Scholar]
- 2.Esmeryan, K. D. & Fedchenko, Y. I. Superhydrophobic soot as a mechanically robust, heat insulating and anti-corrosion protective coating for concrete surfaces. Colloids Surf. A Physicochem. Eng. Aspects672, 131723 (2023). [Google Scholar]
- 3.Song, Q. et al. Properties of water-repellent concrete mortar containing superhydrophobic oyster shell powder. Constr. Build. Mater.337, 127423 (2022). [Google Scholar]
- 4.Raja, A. J., Sun, Z., Ji, Y. & Yang, J. The influence of water-repellent admixtures on the hydration process, water absorption, and mechanical properties of cement paste: An NMR study combined with additional methods. J. Mater. Civ. Eng.34(10), 04022267 (2022). [Google Scholar]
- 5.Shi, Z. et al. Utilization of super-hydrophobic steel slag in mortar to improve water repellency and corrosion resistance. J. Clean. Prod.341, 130783 (2022). [Google Scholar]
- 6.Nie, S. et al. Study of salt resistance and mechanical strength of robust and non-fluorinated superhydrophobic cement. Mater. Lett.339, 134017 (2023). [Google Scholar]
- 7.Wang, N., Wang, Q., Xu, S. & Lei, L. Green fabrication of mechanically stable superhydrophobic concrete with anti-corrosion property. J. Clean. Prod.312, 127836 (2021). [Google Scholar]
- 8.Yang, Z. et al. Efficient utilization of coral waste for internal curing material to prepare eco-friendly marine geopolymer concrete. J. Environ. Manag.368, 122173 (2024). [DOI] [PubMed] [Google Scholar]
- 9.Gereziher Atsbha, T. & Zhutovsky, S. Investigating the effect of hybrid curing on mechanical and durability properties of normal-strength concrete. Constr. Build. Mater.369, 130536 (2023). [Google Scholar]
- 10.Ogawa, Y., Suzuki, S. & Kawai, K. Impact of air exposure post-steam curing on the internal curing efficiency of porous ceramic roof-tile waste fine aggregate in steam-cured fly ash concrete. Mater. Lett.366, 136576 (2024). [Google Scholar]
- 11.Su, W. et al. Internal curing of fine coral aggregate in cement mortars with low water-to-cement ratio: Difference in freshwater and seawater. Cem. Concr. Compos.150, 105572 (2024). [Google Scholar]
- 12.Yang, Z. et al. Efficient utilization of coral waste for internal curing material to prepare eco-friendly marine geopolymer concrete. J. Environ. Manag.368, 122173 (2024). [DOI] [PubMed] [Google Scholar]
- 13.Lei, L., Wang, Q., Xu, S., Wang, N. & Zheng, X. Fabrication of superhydrophobic concrete used in marine environment with anti-corrosion and stable mechanical properties. Constr. Build. Mater.251, 118946 (2020). [Google Scholar]
- 14.Chen, S., Lu, P., Bie, Y., Wang, L. & Guo, L. Mechanical properties and micro mechanism of alkali-activated tannery sludge/fly ash composite cement-based recycled concrete. Constr. Build. Mater.391, 131813 (2023). [Google Scholar]
- 15.Kojima, K., Kim, J., Kitagaki, R. & Hama, Y. Study of microstructural changes in blast-furnace cement hardened by repeated dry and wet curing at high temperatures. Constr. Build. Mater.403, 132861 (2023). [Google Scholar]
- 16.Jiang, Z. et al. Effect of NaCl solution wet-dry cycles on pore structure and oxygen diffusivity of axial tensile fatigue damaged concrete. J. Build. Eng.86, 108881 (2024). [Google Scholar]
- 17.Wei, Y. et al. Effect of fly ash on mechanical properties and microstructure of cellulose fiber-reinforced concrete under sulfate dry–wet cycle attack. Constr. Build. Mater.302, 124207 (2021). [Google Scholar]
- 18.Wu, Z., Yu, H., Ma, H., Da, B. & Tan, Y. Rebar corrosion behavior of coral aggregate seawater concrete by electrochemical techniques. Anti-Corros. Methods Mater.67(1), 59–72 (2020). [Google Scholar]
- 19.Li, X., Wang, Q., Lei, L., Shi, Z. & Zhang, M. Amphiphobic concrete with good oil stain resistance and anti-corrosion properties used in marine environment. Constr. Build. Mater.299, 123945 (2021). [Google Scholar]
- 20.Gurav, A. B. et al. Superhydrophobic surface decorated with vertical ZnO nanorods modified by stearic acid. Ceram. Int.40(5), 7151–7160 (2014). [Google Scholar]
- 21.Cao, Z. et al. Chemical surface modification of calcium carbonate particles with stearic acid using different treating methods. Appl. Surf. Sci.378, 320–329 (2016). [Google Scholar]
- 22.Wang, L. et al. Mechanical properties and microscopic mechanism of coral sand-cement mortar. Adv. Mater. Sci. Eng.2020(3), 1–11 (2020). [Google Scholar]
- 23.Tkalcec, E., Popovic, J., Orlic, S., Milardovic, S. & Ivankovic, H. Hydrothermal synthesis and thermal evolution of carbonate-fluorhydroxyapatite scaffold from cuttlefish bones. Mater. Sci. Eng. C Mater. Biol. Appl.42, 578–586 (2014). [DOI] [PubMed] [Google Scholar]
- 24.Wongsa, A., Boonserm, K., Waisurasingha, C., Sata, V. & Chindaprasirt, P. Use of municipal solid waste incinerator (MSWI) bottom ash in high calcium fly ash geopolymer matrix. J. Clean. Prod.148, 49–59 (2017). [Google Scholar]
- 25.Xu, S., Wang, Q., Wang, N., Qu, L. & Song, Q. Study of corrosion property and mechanical strength of eco-friendly fabricated superhydrophobic concrete. J. Clean. Prod.323, 129267 (2021). [Google Scholar]
- 26.She, W. et al. Superhydrophobic concrete with enhanced mechanical robustness: Nanohybrid composites, strengthen mechanism and durability evaluation. Constr. Build. Mater.247, 118563 (2020). [Google Scholar]
- 27.He, M. et al. Synergistic effects of ultrafine particles and graphene oxide on hydration mechanism and mechanical property of dune sand-incorporated cementitious composites. Constr. Build. Mater.262, 120817 (2020). [Google Scholar]
- 28.Xu, S., Wang, Q., Wang, N., Zheng, X. & Lei, L. Environmentally-friendly fabrication of a recyclable oil-water separation material using copper mesh for immiscible oil/water mixtures. Colloids Surf. A Physicochem. Eng. Aspects583, 124010 (2019). [Google Scholar]
- 29.Mao, J. et al. Study of mortar layer property of superhydrophobic metakaolin based cement mortar. J. Build. Eng.45, 117179 (2022). [Google Scholar]
- 30.Xu, S., Wang, Q., Wang, N. & Zheng, X. Fabrication of superhydrophobic green surfaces with good self-cleaning, chemical stability and anti-corrosion properties. J. Mater. Sci.54(19), 13006–13016 (2019). [Google Scholar]
- 31.Wang, N., Wang, Q., Xu, S. & Luan, J. Flexible films with wrinkled micro-nano hierarchical structures having stable superhydrophobicity under external loading. J. Mater. Sci.55(22), 9623–9637 (2020). [Google Scholar]
- 32.Xu, S., Wang, Q. & Wang, N. Fabrication of pre-wetting induced superamphiphobic meshes for on-demand oil-water separation of light or heavy oil-water mixtures. Colloids Surf. A Physicochem. Eng. Aspects602, 125095 (2020). [Google Scholar]
- 33.Scrivener, K. L. The interfacial transition zone (ITZ) between cement paste and aggregate in concrete. Interface Sci.12, 411–421 (2004). [Google Scholar]
- 34.Dang, J., Xiao, J. & Duan, Z. Effect of pore structure and morphological characteristics of recycled fine aggregates from clay bricks on mechanical properties of concrete. Constr. Build. Mater.358, 129455 (2022). [Google Scholar]
- 35.Zhang, B., Zhu, H., Li, F., Dong, Z. & Zhang, P. Compressive stress-strain behavior of seawater coral aggregate concrete incorporating eco-efficient alkali-activated slag materials. Constr. Build. Mater.299, 123886 (2021). [Google Scholar]
- 36.Li, C. & Jiang, L. Utilization of limestone powder as an activator for early-age strength improvement of slag concrete. Constr. Build. Mater.253, 119257 (2020). [Google Scholar]
- 37.Qiao, C., Suraneni, P., Nathalene Wei Ying, T., Choudhary, A. & Weiss, J. Chloride binding of cement pastes with fly ash exposed to CaCl2 solutions at 5 and 23 °C. Cem. Concr. Compos.97, 43–53 (2019). [Google Scholar]
- 38.Ramachandran, D., Uthaman, S. & Vishwakarma, V. Studies of carbonation process in nanoparticles modified fly ash concrete. Constr. Build. Mater.252, 119127 (2020). [Google Scholar]
- 39.Song, W., Wang, Q., Qu, L., Li, X. & Xu, S. Study of water absorption and corrosion resistance of the mortar with waste marble powder. Constr. Build. Mater.345, 128235 (2022). [Google Scholar]
- 40.Weng, L., Wu, Z., Zhang, S., Liu, Q. & Chu, Z. Real-time characterization of the grouting diffusion process in fractured sandstone based on the low-field nuclear magnetic resonance technique. Int. J. Rock Mech. Min. Sci.152, 105060 (2022). [Google Scholar]
- 41.Gorce, J.-P. & Milestone, N. B. Probing the microstructure and water phases in composite cement blends. Cem. Concr. Res.37(3), 310–318 (2007). [Google Scholar]
- 42.Hu, Z., Wyrzykowski, M., Scrivener, K. & Lura, P. A novel method to predict internal relative humidity in cementitious materials by 1 H NMR. Cem. Concr. Res.104, 80–93 (2018). [Google Scholar]
- 43.Zhang, X., Wei, K., Li, D., Zhou, Y. & Liang, W. Characterization of mechanical properties and microstructure of silica mortar and coral mortar based on nuclear magnetic resonance technology. Mater. Today Commun.33, 104909 (2022). [Google Scholar]
- 44.Li-Ping, G. et al. High ductility cementitious composites incorporating seawater and coral sand (SCS-HDCC) for offshore engineering: Microstructure, mechanical performance and sustainability. Cem. Concr. Compos.147, 105414 (2024). [Google Scholar]
- 45.Liang, B., Rao, L., Zheng, Y. & Aguiar, J. Statistics and analysis of the relationship between strength and age of coral concrete. Adv. Civ. Eng.2022, 9234594 (2022). [Google Scholar]
- 46.Wang, J. et al. Experimental study of one-dimensional compression creep in crushed dry coral sand. Can. Geotech. J.57(12), 1854–1869 (2020). [Google Scholar]
- 47.Dias, W. P. S. Reduction of concrete sorptivity with age through carbonation. Cem. Concr. Res.30, 1255–1261 (2000). [Google Scholar]
- 48.Martys, N. S. & Ferraris, C. F. Capillary transport in mortars and concrete. Cem. Concr. Res.27(5), 747–760 (1997). [Google Scholar]
- 49.Qu, Z. Y. & Yu, Q. L. Synthesizing super-hydrophobic ground granulated blast furnace slag to enhance the transport property of lightweight aggregate concrete. Constr. Build. Mater.191, 176–186 (2018). [Google Scholar]
- 50.Qu, L., Wang, Q., Xu, S., Wang, N. & Shi, Z. Chloride corrosion resistance of double-layer anticorrosive coating in simulated concrete pore solution. Constr. Build. Mater.295, 123682 (2021). [Google Scholar]
Associated Data
This section collects any data citations, data availability statements, or supplementary materials included in this article.
Data Availability Statement
Some or all data that support the findings of this study are available from the corresponding author upon reasonable request.