

Abstract
Contaminants in drinking water, such as lead, nitrate, and arsenic, have been linked to negative physical health outcomes. We know less, however, about whether such pollutants also predict mental health problems and, if so, the conditions under which such effects are strongest. In this longitudinal study, we examined whether drinking water contaminants interact with negative family environments (parental psychological control) to predict changes in depressive symptoms in 110 adolescents—a developmental period when symptoms often first emerge. We found that for adolescents in psychologically controlling families, levels of drinking water contaminants prospectively predicted depressive symptoms 2 years later; this effect was not present in adolescents in non-controlling families. Importantly, these associations were not accounted for by family- or community-level socioeconomic resources, demographic features, or by the adolescents’ stress exposure. These findings highlight the interplay of physical and psychological environments in influencing depressive symptoms in adolescents.
Keywords: depressive symptoms, environmental contamination, family relationships, lead, psychological health, water quality
1 ∣. INTRODUCTION
Hundreds of millions of individuals worldwide consume drinking water that has high levels of chemical contaminants, including lead, arsenic, and nitrate (Fujino et al., 2004; Nordstrom, 2002; Skerfving, Löfmark, Lundh, Mikoczy, & Strömberg, 2015). Recent water crises in the United States, including widespread lead poisoning in Flint, Michigan (Hanna-Attisha, LaChance, Sadler, & Champney Schnepp, 2016), have spurred public interest in assessing the adverse effects of poor water quality. Indeed, in 2015 alone, nearly 21 million Americans were served by community water systems that violated quality standards (Allair, Wu, & Lall, 2018); importantly, however, insidious effects of exposure can occur even at levels of contaminants that fall within accepted guidelines (Taylor, Schniering, Lanphear, & Jones, 2010).
Drinking contaminated water has been linked to problems in nearly all organs and systems in the body (Brinkle, Khan, & Kraemer, 2009). For example, arsenic exposure is associated with a variety of cancers (Zierold, Knobeloch, & Anderson, 2004), lead exposure is related to intellectual impairments, and nitrate exposure is linked to fetal loss and birth defects even at levels well below regulation cutoffs (Manassaram, Backer, & Moll, 2005). While these associations of water contamination with physical health are well-documented, a growing body of research suggests that exposure to these contaminants also adversely affects mental health.
To date, most research examining the relation between water contamination and symptoms of difficulties in mental health has focused on associations between lead exposure and subsequent Attention Deficit and Hyperactivity Disorder (ADHD); investigators in this area have found that both pre- and post-natal exposure to lead predict elevated risk for symptoms of ADHD (Goodlad, Marcus, & Fulton, 2013; Neugebauer et al., 2015; Tuthill, 1996). It is not yet known, however, whether water contaminants also predict depression—one of the most common types of mental illness and the leading cause of years lost to disability worldwide (World Health Organization, 2009). Importantly, there is some empirical support for this possibility. In rodent models, exposure to arsenic during gestation or early life has been found to be related to subsequent depressive-like processes, including alterations in patterns of hypothalamic–pituitary–adrenal (HPA)–axis and dopamine function (Chadravanshi et al., 2014; Martinez, Kolb, Bell, Savage, & Allan, 2008); moreover, these difficulties are attenuated with antidepressant treatment (Tyler, Solomon, Ulibarri, & Allan, 2014). Similarly, cross-sectional research in humans has documented a stronger history of depression in adults who were exposed to arsenic-contaminated drinking water in the United States (Zierold et al., 2004), and a higher incidence of psychiatric symptoms in residents of a Mongolian village with arsenic-contaminated water than in individuals in a nearby arsenic-free village (Fujino et al., 2004). Additionally, higher levels of patella bone lead in elderly men is associated with elevated psychiatric symptoms (Rhodes, Spiro, Aro, & Hu, 2003). Finally, adults with depression have higher levels of plasma nitrate than do matched participants without depression (García et al., 2011), although it is not clear that these nitrate levels are from sources exogenous to the participants.
Although a specific biological cascade for associations between water contaminants and depressive symptoms is not yet known (and almost certainly varies by contaminant), one plausible pathway may be through effects on immune system processes. For example, lead, arsenic, and nitrate all affect inflammatory processes by contributing to higher levels of proinflammatory cytokines (Ahmed et al., 2011), through shifts between Th 1 and Th 2 cytokine responses (Usyugova, Zeman, Dhanwada, & Beltz, 2002), and by promoting autoimmune disease processes (Mishra, 2009). Significantly, these same inflammatory processes are implicated in depression. For example, individuals with chronic inflammatory diseases experience depression at much higher rates than do individuals with non-inflammatory diseases (Katon et al., 2007); moreover, levels of proinflammatory cytokines are robustly positively associated with depressive symptoms in children, adolescents, and adults (e.g., Dowlati et al., 2010). In these ways, it is possible that contaminants in water contribute to a proinflammatory milieu that fosters depressive symptoms.
Researchers have not yet examined the temporal nature of the association between exposure to water contaminants and depressive symptoms. Given that the incidence of Major Depressive Disorder (MDD) rises precipitously during adolescence (Lewinsohn, Rohde, Seeley, Klein, & Gotlib, 2000; Twenge & Nolen-Hoeksema, 2002) and that toxic effects of water contaminants on physical health appear to be magnified when exposure occurs during youth (Taylor et al., 2010; Tolins, Rachirawat, & Landrigan, 2014), examining associations between water contaminants and symptoms of MDD in adolescents will be particularly important both in capturing the directional nature of these associations and in examining associations during a developmental period in which there may be greater sensitivity to environmental inputs.
Although it is possible that exposure to water contaminants alone will increase adolescents’ risk for depressive symptoms, the multicausality of pediatric depressive symptoms makes it likely that such physical exposures will interact with other salient risk processes in this population. Indeed, Trentacosta, Davis-Kean, Mitchell, Hyde, and Dolinoy (2016) have called for further work into the factors that moderate associations between environmental contaminants and child developmental outcomes. In this context, the climate of family relationships, such as the degree of psychological control parents exert over adolescents, is a characteristic of the environment that has been implicated consistently in the onset and maintenance of depression in youth. Here, psychological control, which reflects parents’ erratic emotional behaviors, guilt induction, love-withdrawal, or personal attacks directed toward their child, may be a particularly aversive parenting dimension during the adolescent period, given that this developmental stage is typically characterized by increasing autonomy (Barber, 1996). In these ways, psychological control and other dimensions of relationships with parents have been found both to contribute directly to (Yap, Pilkinton, Ryan, & Jorm, 2013) and to moderate depressive symptoms, either by intensifying (Feinberg, Button, Neiderhiser, Reiss, & Hetherington, 2007) or by buffering (Manczak, Donenberg, & Emerson, 2018) other risk processes. Furthermore, social environments are increasingly being recognized as moderating the effects of exposure to different environments on physical health outcomes in youth. For example, in several studies, negative social environments have been found to interact with levels of environmental pollutants to predict childhood asthma (Chen, Schreier, Strunk, & Brauer, 2008), including creating a “double exposure” whereby negative social environments intensify the effects of air pollution on asthma (Clougherty et al., 2007). One study has now documented similar patterns for mental health; the effects of exposure to lead on symptoms of ADHD in children was moderated by family composition, such that lead increased symptom risk to a greater extent in children from single-parent families than in children from two-parent families (Choi, Kwon, Lim, Lim, & Ha, 2016). (It is worth noting, as well, that aversive parental relationships promote the same proinflammatory processes that are theorized to underlie associations between contaminants and depressive symptoms; e.g., Miller & Chen, 2010.)
Given these findings, we examined in this study whether contaminants in drinking water, alone or in interaction with negative family environments, predicted the subsequent development of depressive symptoms in youth. Using publicly available data on community water system quality, we tested whether water contaminants interacted with parental psychological control to predict changes in depressive symptoms over a 2-year period. We hypothesized that, above and beyond the contributions of demographic, community-level, and stress-exposure characteristics, adolescents from more negative family environments who were also exposed to higher levels of water contaminants, broadly, and to lead, arsenic, and nitrate, specifically, would show the steepest increase in depressive symptoms over a 2-year period.
2 ∣. METHODS AND MATERIALS
2.1 ∣. Study overview
As part of a larger study of early life stress and adolescent depression, English-speaking adolescents in the early stages of puberty (Tanner Stage 3 or below, as rated by self-report; Morris & Udry, 1980) in the San Francisco Bay Area were recruited through advertisements on Craigslist and parent listservs. During a baseline assessment, participants completed an interview about life stress, reported on parental psychological control in their primary caregiver, and completed a questionnaire about their current depressive symptoms. Approximately, 2 years later (when adolescents were 11–15 years old), participants returned to the laboratory and reported on their depressive symptoms. Using publicly available community water system reports compiled by the California Environmental Protection Agency (CalEPA), we mapped participants’ home addresses to information on average water quality per census tract from the most recent compliance cycle, which spanned the years 2005–2013. Census tract designations—used for determining water quality—utilized participants’ mailing addresses obtained at the follow-up visit.
2.2 ∣. Participants
Only participants with complete data for primary analyses were included in the current study. Two hundred and thirteen adolescents (ages 9–13) were enrolled at baseline, however, 48 participants did not complete the parental psychological control measure (primarily because this measure was added after data collection had already started), 42 did not return for the follow-up session or did not complete the depressive symptom measure at follow-up, and 13 did not provide key demographic variable or baseline information; these participants were excluded from the current sample. Participants with full data were significantly more likely to be male (51% vs. 35%; t = 2.37, p = 0.019) and to have fewer stressful life events (2.41 vs. 3.20; t = 2.19, p = 0.030) compared to those with missing data; otherwise, there were no statistically significant differences between participants with full data and those with missing data.
The final sample was composed of 54 girls and 56 boys. Racial and ethnic composition reflected the local community: 68% of families identified as White, 8% identified as Black or African American, 9% identified as Hispanic, 28% identified as Asian American, and 4% identified as Native American, and 5% Native Hawaiian/Pacific Islander (participants were able to endorse multiple identifications). The overwhelming majority of participants (95%) referenced their mother as their primary caregiver. Seventy-six percent of participating caregivers were married or partnered, 16% were divorced, and 7% were single; only two families reported that a second parental figure was not involved in the adolescent's life. Family income ranged from less than $5,000 to more than $150,0000; average income was in the $75,000–$100,000 range.
Participation of human subjects in this study was approved and overseen by the Stanford University Institutional Review Board. At each time point, written informed consent was obtained from the adolescent's parent and written informed assent was obtained from the adolescent.
2.3 ∣. Measures
2.3.1 ∣. Water quality
Contamination in drinking water was assessed using data compiled by the CalEPA (“Cal Enviro Screen”; OEHHA, 2017). Thirteen contaminants (1,2,3-trichloropropane; arsenic; cadmium; dibromochloropropane; hexavalent chromium; lead; nitrate; perchlorate; combined radium 226 and 228; total trihalomethanes; tetrachloroethylene; trichloroethylene; and uranium) were assessed within each drinking water system within the state of California over the 2005–2013 compliance cycle. Levels that fell below the detection limit for each contaminant were assigned a 0. Time-weighted average concentrations of each contaminant were calculated per system, which were mapped onto census tracts. Tracts were then ranked and weighted by population to obtain a percentile for each contaminant per tract. The composite water contamination metric was computed by summing the percentiles for the 13 contaminants and then re-ranking tracts for a composite percentile ranking. Participants’ home mailing addresses were used to determine their census tract and water quality values; for one family who provided a post office box for their mailing address, the census tract for their PO box was used. Participants in our sample accessed drinking water from systems that ranged from the 1st to the 95th percentile of average contaminant exposure in the state of California (M = 32.35, SD = 23.52). We examined percentile rankings separately for lead, nitrate, and arsenic, as we hypothesized that these contaminants would drive associations with depressive symptoms. No families were above the EPA's Maximum Contaminant Level cutoff of 15 ug/L lead nor above the cutoff of 10 ug/L for arsenic; however, 20 families (18.2% of the sample) were above the cutoff of 10 mg/L for nitrate in water.
2.3.2 ∣. Parental psychological control
The extent to which parents engage in erratic emotional behaviors, guilt induction, love-withdrawal, or personal attacks directed toward their child was assessed using 11 items from the Psychological Control Scale (Barber, 1996), rated on a scale from 1 (“almost never”) to 5 (“very often”). Sample items include “my parent is less friendly with me when I do not see things her/his way,” and “my parent tells me I should be ashamed of myself when I misbehave” (a = 0.74, current sample). This set of items and rating anchors are adapted from the original PCS (which uses a 3-point scale and 16 items), but have been found to have good internal consistency and inter-rater agreement in other samples of adolescents (e.g., Liew, Kwok, Chang, Chang, & Yeh, 2014).
2.3.3 ∣. Depressive symptoms
Consistent with prior work examining the association between ADHD symptoms and lead (Choi et al., 2016), and to utilize the full range of our data, we examined depressive symptoms rather than depression diagnosis. At baseline and follow up, adolescent participants completed the short form of the Children's Depression Inventory (CDI-S; Kovacs, 1992), which assesses current depressive symptomatology through 10 items. Sample items include “I feel like crying” and “Things bother me,” which are rated as 0 = “once in a while”, 1 = “many days”, and 2 = “every day” (α = 0.73, baseline; α = 0.80, follow up). The CDI has well-documented reliability and validity (Smucker, Craighead, & Craighead, 1986) and the short form has been shown to be as sensitive as the full version (Allgaier et al., 2012.) Depressive symptoms at follow-up were the focus of analyses in order to both focus on a period of development when symptoms traditionally increase and to overcome the possibility of mood-dependent bias affecting both baseline depressive symptom and parental psychological control ratings.
2.3.4 ∣. Neighborhood poverty
Given that poorer communities are often disproportionately affected by environmental pollutants (O'Neill et al., 2003), it is possible that water contaminants are proxy variables that reflect less resourced communities and that depressive symptoms, family negativity, and community water contamination all are more likely to occur for children who are exposed to more difficult living conditions, broadly. To address the possibility that study findings might be accounted for by low socioeconomic status, we included in our analyses participants’ family income levels and the percentile ranking of neighborhood poverty relative to households in the state of California (based on census track data). Average poverty level per census tract was derived as part of the Cal EnviroScreen by computing the percentage of the population within a tract who lived below 2× the federal poverty level using the 2011–2015 American Community Survey (United Census Bureau, 2015). These values were then ranked to determine the percentile ranking of that tract within the state of California. Twice the poverty level was used by the CalEPA as a cutoff because the cost of living in California is higher than the national average and because methods for assessing poverty at the federal level have not changed since the 1980s, despite increases in cost of living (OEHHA, 2017).
2.3.5 ∣. Stressful life events
We posited that family conflict would be a particularly aversive and potent form of social environment, given that it is a potentially chronic source of negativity. To test the unique potency of family negativity versus other sources of stress, we also included in our models adolescents’ lifetime exposure to specific stressful events based on responses to a semi-structured interview administered during the baseline assessment. During the baseline assessment, adolescents completed a structured interview about their lifetime exposure to acutely stressful experiences, using a version of the Traumatic Events Screening Inventory for Children (Ford & Rogers, 1997) modified for this study that assessed over 30 types of experiences (e.g., parental divorce, major illness, etc.). Using a modified version of the UCLA Life Stress Interview coding system (Rudolph & Hammen, 1999), a panel of three coders rated the objective severity of each stressor from a scale of 1–5 with half-point increments where 1 = non-event or no-impact and 5 = extremely severe impact, with information about the adolescents’ reactions or behaviors during the interview masked prior to rating (ICC = 0.99). For more information about the assessment of life stress in this sample, please see King et al., 2017. The number of events rated at a 2.5 or higher, the criterion for a “severe” stressor commonly used by other psychological researchers (Miller & Chen, 2010) was then summed to reflect a participant's exposure to stress across their lifetime. This approach overcomes problems with adding all events or the severity of all events, which may be influenced by reporting biases in adolescents who endorse many events that are not objectively very stressful.
2.3.6 ∣. Demographic features
Information on participants’ sex, ethnic minority status, and family income level gathered during the baseline assessment, along with age at follow-up, were also assessed and included as covariates in subsequent analyses.
2.4 ∣. Data analytic plan
All continuous independent variables were centered prior to analyses to assist interpretability. Interaction terms were calculated by multiplying centered variables of parental psychological control and water contaminants. To test the effect of exposure to aggregated drinking water contaminants in interaction with family negative environments on the prediction of depressive symptoms, we conducted hierarchical linear regressions in SPSSv25 predicting depressive symptoms at Time 2 in which adolescents’ age, adolescent's sex, ethnicity, parent's sex, family income level, community poverty, life stress, and depressive symptoms at baseline were entered at Step 1, independent contributions of water contaminants and parental psychological control were entered at Step 2, and an interactive effect between contaminants and psychological control was entered at Step 3. This provides a conservative test of the additive and interactive effects of water contaminants and family environment, as shared variance would be attributed to earlier steps in the model. We probed significant interactive effects using simple slope tests for one standard deviation above and below the mean of psychological control. We then repeated these tests to consider lead, nitrate, and arsenic levels separately, as these contaminants have been previously identified as relating to depression-relevant processes in cross-sectional work. Finally, we repeated analyses without any covariates (except for baseline depressive symptoms) in order to examine the generalizability of our findings.
3 ∣. RESULTS
Descriptive statistics are presented in Table 1. An examination of models with the composite water contaminant metric indicated that the addition of parent psychological control and water contaminants significantly improved the model (R2 = 0.26; ΔR2= 0.06, p = 0.026), such that there was a significant independent effect of psychological control on subsequent depressive symptoms (B = 0.13, SE = 0.05, p = 0.011; see Table 2). Including an interactive effect between contaminants and psychological control further improved the model (R2 = 0.31; ΔR2 = 0.05, p = 0.008) and indicated that as parental psychological control increased, the association between water contaminants and depressive symptoms strengthened (see Figure 1). Simple slope tests at 1 SD above (“higher”) and below (“lower”) the mean revealed an association between contaminants and depressive symptoms for adolescents who experienced higher levels of parent psychological control (B = 0.05, SE = 0.02, t = 2.80, p = 0.006), but not for adolescents who experienced lower levels of psychological control (B = −0.01, SE = 0.01, t = −0.82, p = 0.412). Put differently, for adolescents in families at 1 SD above the mean of control, there was a 1.2-point increase in depressive symptoms (above and beyond the effects of all covariates) for each 1 SD increase in water contaminants.
TABLE 1.
Descriptive statistics for study sample
| Mean | SD | Observed range | |
|---|---|---|---|
| Psychological control (baseline) | 20.62 | 5.52 | 12–42 |
| Depressive symptoms (follow up) | 2.47 | 2.75 | 0–13 |
| Depressive symptoms (baseline) | 2.29 | 2.44 | 0–11 |
| Contaminant composite (% ranking) | 32.35 | 23.52 | 1.00–95.00 |
| Lead (ug/L) | 0.19 | 0.48 | 0.00–2.94 |
| Lead % ranking | 36.99 | 43.47 | 0.00–99.13 |
| Nitrate (mg/L) | 5.04 | 4.66 | 1.41–24.94 |
| Nitrate % ranking | 40.92 | 28.23 | 6.50–97.35 |
| Arsenic (ug/L) | 0.14 | 0.41 | 0.00–3.03 |
| Arsenic % ranking | 16.03 | 18.06 | 0.00–93.26 |
| Age in years (follow up) | 13.15 | 1.06 | 11.00–15.52 |
| Age in years (baseline) | 11.29 | 1.04 | 9.19–13.72 |
| Family income category | 8.60 [$75,000–100,000] | 1.93 | 1–11 |
| Poverty (% ranking) | 24.36 | 22.71 | 0.00–99.00 |
| Number stressful events (baseline) | 2.41 | 2.29 | 0–11 |
| Distribution | |||
| Child sex | N = 54 (49%) female | N = 56 (51%) male | |
| Parent sex | N = 104 (95%) female | N = 6 (5%) male | |
| Minority status | N = 62 (56%) white | N = 48 (44%) racial/ethnic minority | |
TABLE 2.
Hierarchical linear regression models of water contaminants interacting with parental psychological control to predict subsequent depressive symptoms
| Model including water contaminant composite | |||||
|---|---|---|---|---|---|
| Model | R 2 | ΔR2 | p | ||
| Step 1 | 0.20 | 0.20 | 0.003 | ||
| Step 2 | 0.26 | 0.06 | 0.026 | ||
| Step 3 | 0.31 | 0.05 | 0.008 | ||
| Predictor variable | B | SE | t | p | sr 2 |
| Step 3 | |||||
| Intercept | 3.45 | 0.44 | 7.81 | <0.001 | |
| Adolescent sex | −1.62 | 0.57 | −2.85 | 0.005 | 0.06 |
| Minority status | 0.08 | 0.51 | 0.15 | 0.883 | 0.00 |
| Age | 0.95 | 0.26 | 3.69 | <0.001 | 0.10 |
| Income | 0.27 | 0.13 | 1.42 | 0.044 | 0.03 |
| Dep Sx Baseline | 0.15 | 0.11 | 1.42 | 0.160 | 0.01 |
| Parent sex | −0.98 | 1.09 | 0.90 | 0.372 | 0.01 |
| Poverty | 0.01 | 0.01 | 0.770 | 0.443 | 0.00 |
| Stressful events | 0.11 | 0.11 | 1.01 | 0.314 | 0.01 |
| Psychological control | 0.17 | 0.05 | 3.35 | 0.001 | 0.08 |
| Contaminant composite | 0.02 | 0.01 | 1.55 | 0.123 | 0.02 |
| Contaminants × control | 0.01 | 0.00 | 2.72 | 0.008 | 0.05 |
| Model including lead | |||||
| Model | R 2 | ΔR2 | p | ||
| Step 1 | 0.20 | 0.20 | 0.003 | ||
| Step 2 | 0.25 | 0.05 | 0.040 | ||
| Step 3 | 0.29 | 0.04 | 0.024 | ||
| Predictor variable | B | SE | t | p | sr 2 |
| Final model (step 3) | |||||
| Intercept | 3.46 | 0.45 | 7.76 | <0.001 | |
| Adolescent sex | −1.73 | 0.57 | −3.03 | 0.003 | 0.07 |
| Minority status | 0.05 | 0.50 | 0.10 | 0.921 | 0.00 |
| Age | 0.91 | 0.26 | 3.48 | 0.001 | 0.09 |
| Income | 0.27 | 0.14 | 2.03 | 0.045 | 0.03 |
| Dep Sx baseline | 0.17 | 0.11 | 1.53 | 0.129 | 0.02 |
| Parent sex | 0.70 | 0.01 | −0.65 | 0.52 | 0.00 |
| Poverty | 0.01 | 0.01 | 0.61 | 0.544 | 0.00 |
| Stressful events | 0.16 | 0.11 | 1.37 | 0.17 | 0.01 |
| Psychological control | 0.14 | 0.05 | 2.81 | 0.006 | 0.06 |
| Lead | 0.01 | 0.01 | 0.82 | 0.413 | 0.00 |
| Lead × control | 0.00 | 0.00 | 2.29 | 0.024 | 0.04 |
| Model including nitrate | |||||
| Model | R 2 | ΔR2 | p | ||
| Step 1 | 0.20 | 0.20 | <0.003 | ||
| Step 2 | 0.30 | 0.10 | 0.001 | ||
| Step 3 | 0.33 | 0.03 | 0.044 | ||
| Predictor variable | B | SE | t | p | sr 2 |
| Final model (step 3) | |||||
| Intercept | 3.26 | 0.44 | 7.50 | <0.001 | |
| Adolescent sex | −1.37 | 0.57 | −2.41 | 0.018 | 0.05 |
| Minority status | 0.13 | 0.50 | 0.27 | 0.792 | 0.00 |
| Age | 0.90 | 0.25 | 3.56 | 0.001 | 0.11 |
| Income | 0.23 | 0.13 | 1.77 | 0.067 | 0.03 |
| Dep Sx baseline | 0.16 | 0.11 | 1.54 | 0.284 | 0.02 |
| Parent sex | −1.40 | 1.05 | −1.34 | 0.184 | 0.02 |
| Poverty | 0.01 | 0.01 | 0.82 | 0.414 | 0.01 |
| Stressful events | 0.10 | 0.11 | 0.89 | 0.378 | 0.01 |
| Psychological control | 0.16 | 0.05 | 3.17 | 0.002 | 0.09 |
| Nitrate | 0.02 | 0.01 | 2.82 | 0.006 | 0.08 |
| Nitrate × control | 0.00 | 0.00 | 2.04 | 0.044 | 0.04 |
| Model including arsenic | |||||
| Model | R 2 | ΔR2 | P | ||
| Step 1 | 0.20 | 0.20 | 0.003 | ||
| Step 2 | 0.29 | 0.09 | 0.003 | ||
| Step 3 | 0.29 | 0.01 | 0.381 | ||
| Predictor variable | B | SE | t | p | sr 2 |
| Final Model (step 3) | |||||
| Intercept | 3.50 | 0.45 | 7.85 | <0.001 | |
| Adolescent sex | −1.71 | 0.57 | −3.01 | 0.003 | 0.08 |
| Minority status | −0.14 | 0.52 | −0.27 | 0.788 | 0.00 |
| Age | 0.77 | 0.26 | 2.93 | 0.004 | 0.08 |
| Income | 0.29 | 0.13 | 2.16 | 0.033 | 0.02 |
| Dep Sx baseline | 0.20 | 0.11 | 1.78 | 0.079 | 0.05 |
| Parent sex | −1.07 | 1.08 | −0.99 | 0.323 | 0.01 |
| Poverty | 0.00 | 0.01 | 0.17 | 0.864 | 0.00 |
| Stressful events | 0.09 | 0.12 | 0.79 | 0.431 | 0.01 |
| Psychological control | 0.16 | 0.05 | 3.01 | 0.003 | 0.07 |
| Arsenic | 0.03 | 0.01 | 2.29 | 0.024 | 0.05 |
| Arsenic × control | 0.00 | 0.00 | 0.88 | 0.381 | 0.01 |
Note: All regression coefficients are presented for the full models (with all predictors entered) and with continuous variables centered. Water contaminant values index percentile in rankings relative to the state of California for each marker. Adolescent and parent sex was coded where 0 = female and 1 = male. Minority status was coded where 0 = white and 1 = racial/ethnic minority. sr2 = semipartial r2.
FIGURE 1.
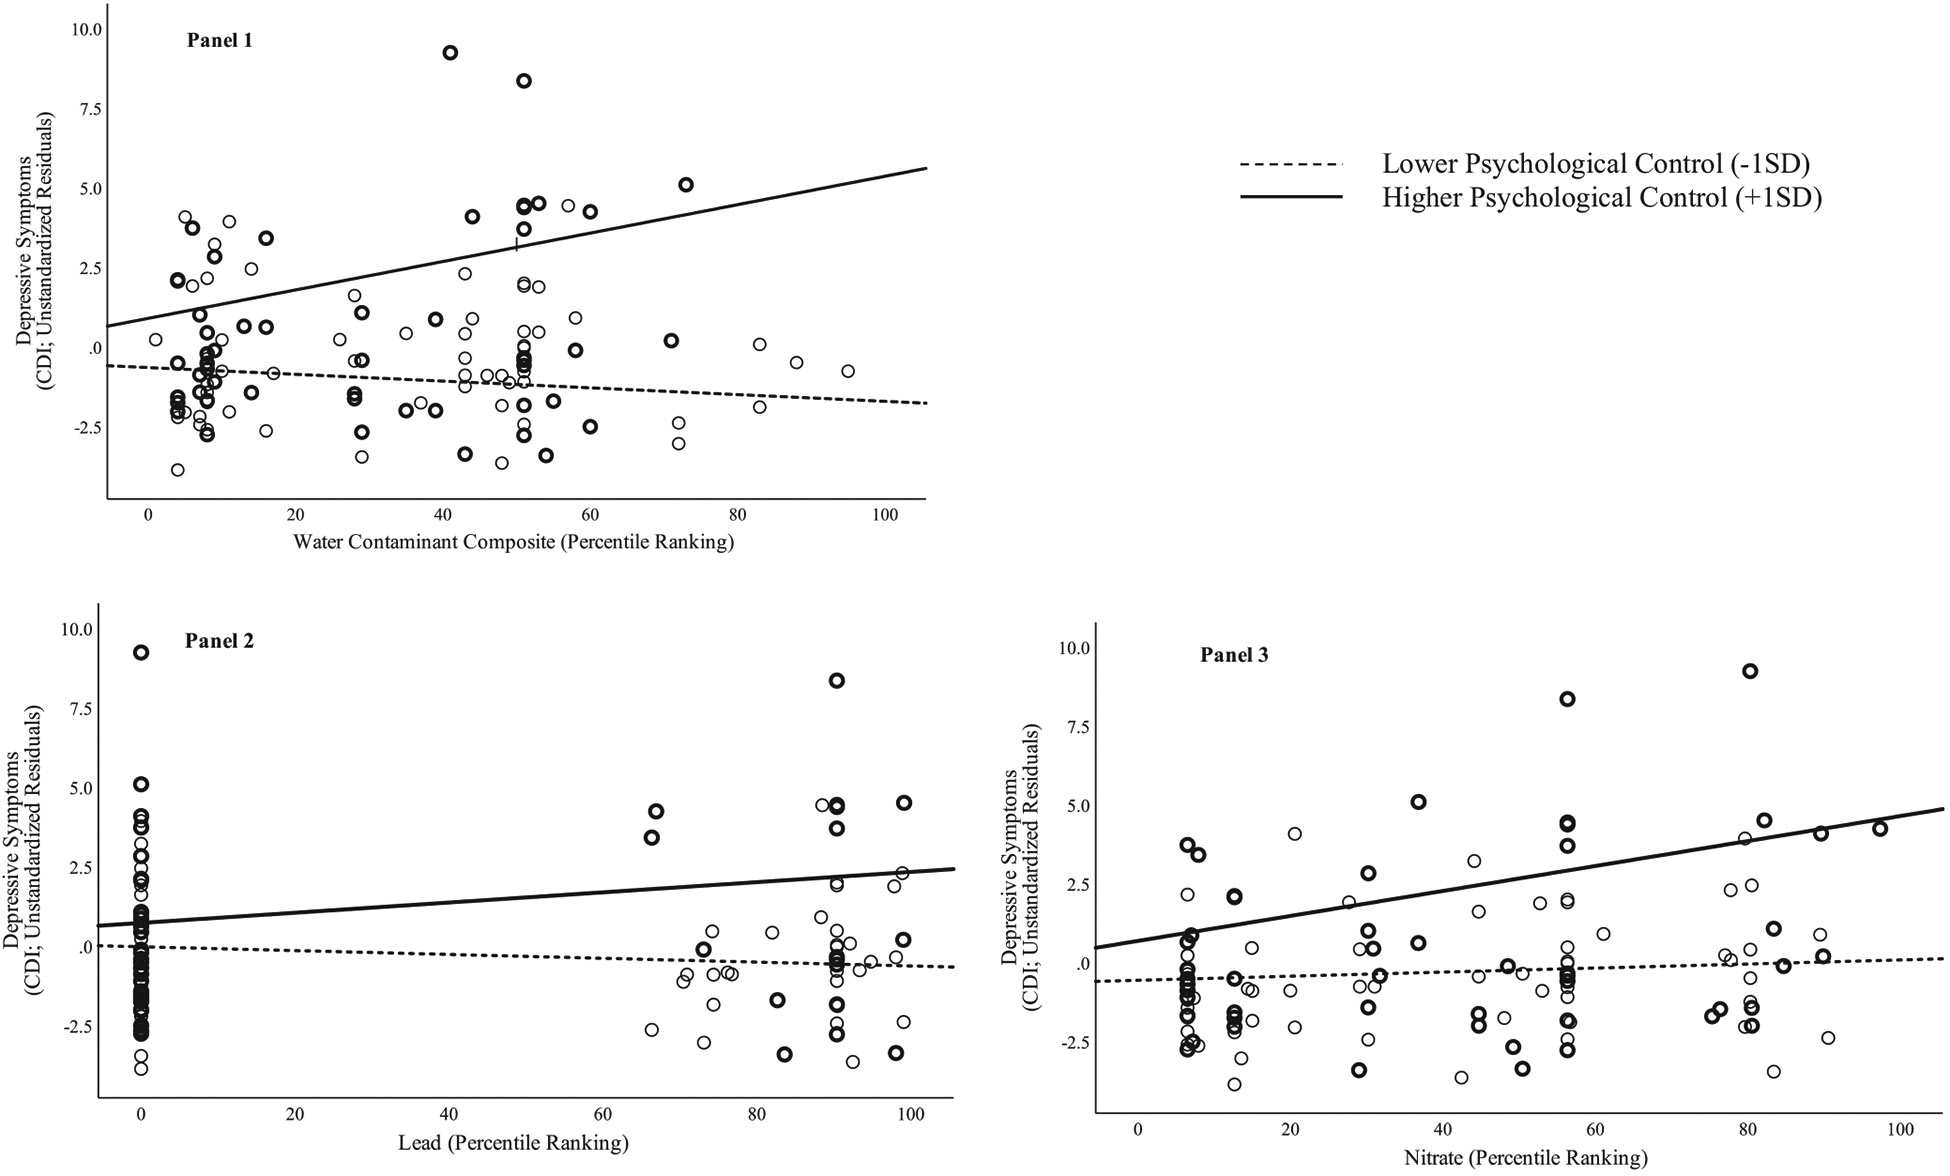
Interactions between psychological control and composite water contaminants (Panel 1), lead (Panel 2), and nitrate (Panel 3) predicting the residuals of depressive symptoms (removing effects of covariates) 2 years later
Given that prior research has specifically implicated lead, nitrate, and arsenic in psychological difficulties, we next examined these three contaminants individually. The results for lead were similar to those for the contaminant composite: there was a significant interaction of control and lead (B = 0.002, SE = 0.00, t = 1.64, p = 0.024), such that levels of lead predicted higher levels of depressive symptoms for adolescents at 1 SD above the mean of psychological control (B = 0.02, SE = 0.01, t = 2.13, p = 0.036), but were not associated with depressive symptoms at 1 SD below the mean of control (B = −0.01, SE = 0.01, t = −1.13, p = 0.263).
Models including nitrate also yielded a significant interactive effect of nitrate and psychological control (B = 0.00, SE = 0.00, t = 2.04, p = 0.044). As with both the composite and lead analyses, simple slopes tests revealed that higher levels of nitrate predicted higher levels of depressive symptoms at follow-up for adolescents in families with higher psychological control (B = 0.04, SE = 0.01, t = 3.37, p = 0.001), but were not associated with depressive symptoms for adolescents in families with lower psychological control (B = 0.01, SE = 0.01, t = 0.40, p = 0.693).
Finally, there was not a significant interaction of arsenic and psychological control in predicting depressive symptoms (B = 0.00, SE = 0.00, t = 0.88, p = 0.381). Instead, arsenic predicted levels of depressive symptoms in adolescents at follow-up (B = 0.03, SE = 0.01, t = 2.29, p = 0.024) regardless of the quality of the family environment. Psychological control also independently predicted higher levels of depressive symptoms (B = 0.16, SE = 0.05, t = 3.01, p = 0.003).
Examining these models without any covariates (with the exception of baseline CDI scores, in order to model change) yielded the same pattern of significant results.
4 ∣. DISCUSSION
Exposure to water containing chemical contaminants has been documented to adversely affect the physical health of individuals across the world; the current findings indicate that such exposures may contribute to difficulties in mental health as well—even at levels below the EPA's maximum allowable contaminant cutoffs. Specifically, we found support for the hypothesis that family psychological control exacerbated the negative effects of contaminants in drinking water to confer a “double hit” for the subsequent increase in depressive symptoms in adolescents; however, if children came from a family that was lower in control, they did not appear to experience negative consequences of contaminant exposure. In addition to aggregate exposure across all contaminants, these patterns held for lead and nitrate examined individually; in contrast, exposure to arsenic increased symptoms regardless of family context. These findings were significant above and beyond contributions of demographic features, family socioeconomic circumstances, neighborhood socioeconomic circumstances, and adolescents’ experiences with stressful life events, highlighting the unique predictive value of water contaminants and parental psychological control.
While we do not yet fully understand the precise cascades that account for these effects, there are several possible explanations for these findings. As we noted above, both environmental pollutants (Ahmed et al., 2011) and the quality of family relationships (Miller & Chen, 2010) have been found to affect immune functioning, including levels of chronic inflammation and stimulated cytokine production; in turn, aberrations in inflammatory responses have been linked to depression in adolescents and adults (O'Neill et al., 2003). Through additive effects on shared immune processes, negative social experiences and contaminants may promote levels of inflammation that lead to the emergence of depressive symptoms. Other possible pathways include activation and dysregulation of the HPA-axis and other autonomic nervous system components that have been previously linked to depression, social experiences, and contamination (e.g., Chadravanshi et al., 2014). Future work will benefit from directly measuring inflammatory and other peripheral markers as potential mediators of these associations. Such measurement may also clarify why arsenic exerted a direct, but not interactive, effect on depressive symptoms; it is possible that even relatively low levels of arsenic are sufficient to clinically elevate these theorized mediators. An additional possible pathway for associations is that contaminants like lead, nitrate, and arsenic have neurotoxic effects on brain development and functioning (Choi et al., 2016; Manassaram et al., 2005) that may increase the risk of depression in children. Consistent with a diathesis-stress model, this liability or vulnerability may be triggered in the context of an emotionally negative family environment. Longitudinal neuroimaging studies have the potential to test this formulation.
It is not clear in this study whether the associations between exposure to contaminants and depression reflect biological changes that are caused by recent exposure or, alternatively, that are due to a history of exposure during gestation or earlier life combined with water system quality that is stable over time. Timing of exposure is likely to be important regarding contaminants, parenting, and life stressors; it will be important in future research to examine this feature. Similarly, we were unable to determine individuals’ precise exposure to these contaminants, including how long they had lived in a geographic area with a particular water system, the extent to which they drank water from these systems in their home or consumed water through brushing teeth or cooking foods with tap water, or about levels of contaminants prior to the most recent (2005–2013) compliance cycle. It is also worth noting that exposure to lead, arsenic, and nitrate can come from sources other than water (e.g., Manassaram et al., 2005). For example, drinking water is estimated to contribute to 3%–21% of adult nitrate intake; food sources like preserved meats contribute as well. Although lead is most commonly absorbed through paint and soil exposure, water is also a common source of lead. Finally, although drinking water is the largest source for arsenic consumption, exposure can also occur through cosmetics, soil, and food (Chung, Yu, & Hong, 2014). In this context, however, we should note that these sources of error would likely lead to underestimates of the strength of the associations between contaminants and depression. Thus, we think that these results provide exciting initial conceptual demonstrations of associations, but emphasize that future work will benefit from more precise assessments of exposure and of person-level absorption amounts assayed directly from biological specimens. In addition, parents are exposed to the same drinking water contaminants as are their offspring; thus, it is possible that parents’ controlling behaviors are influenced by these same contaminant processes. Future work that measures more precisely exposure for both parents and children will be important in clarifying the nature of the associations in this model.
We should highlight several additional limitations of this study. First, we used a community, rather than a clinical, sample, and assessed severity of depressive symptoms instead of a diagnosis of depression as the outcome variable. A cut-off of 3 has been identified as a clinically significant threshold for the CDI-S; our average score was 2.29 (baseline) and 2.47 (follow-up), suggesting that on average, symptoms were below clinical threshold. Levels of psychological control were also somewhat lower than has been studied in other research (Liew et al., 2014), and the levels of contaminants in drinking water were generally below clinical thresholds. Thus, we are likely examining a somewhat restricted range for many of our primary variables (with the exception of nitrate, for which 20% of families were served by water systems that exceeding the EPA's maximum contaminant level). Although this approach is consistent with prior research examining the relation between ADHD symptoms and lead (Choi et al., 2016), it does limit our ability to quantify the clinical significance of our findings. Nevertheless, the fact that we found such associations longitudinally in a sample of relatively healthy adolescents suggests that water contaminants and more controlling approaches to parenting are insidious contributors to depressive processes across a range of functioning. Future research would benefit from examining similar patterns in higher-risk samples. For example, it is possible that at very high levels, the toxicity of these contaminants confers risk regardless of family context, or that associations would be stronger for individuals with clinical diagnoses of depression.
An additional limitation is that we assessed perceived psychological control only with respect to the adolescents’ primary caregiver (overwhelmingly, their mother); unfortunately, we did not have adolescents’ ratings of psychological control in their other parent or other measures of family negativity. Consequently, we were not able to assess other possible sources of influence from a second parental figure, who may buffer or exacerbate a negative family climate, or dimensions of family conflict other than those involving psychological control. Given that only two families in the current study reported that the child did not have a second parent-figure, it is likely that most adolescents are exposed to multiple forms and sources of parenting. It will be important for future studies to consider multiple types and dimensions of social relationships to test more thoroughly the possible unique potency of parental psychological control for moderating associations between water contaminants and depressive symptoms.
This is the first study to document significant prospective associations between levels of water contaminants—including lead, nitrate, and arsenic—in the drinking water systems of families and depressive symptoms in adolescents. Furthermore, our results highlight the potential for social environments to modulate what are theorized to be biological effects of physical environments on mental health. Identifying associations between drinking water contamination and the development of psychopathology symptoms offers new perspectives on the global issues of both contaminated water systems and depression, while reaffirming the importance of family environments for mental health in youth.
Research Highlights.
Findings indicate that chemical contaminants in drinking water are associated with increased risk for depressive symptoms in adolescents in a major US metropolitan area.
In addition to a composite of 13 chemicals, levels of lead, nitrate, and arsenic in water each related to increased depressive symptoms over 2 years.
Psychologically controlling family environments moderated the association between several contaminants and depressive symptoms, in line with a “double hit” risk model.
This study is the first to identify prospective associations between water contaminants and depressive symptoms and to elucidate interactions of contaminants with family characteristics.
ACKNOWLEDGEMENTS
This research was supported by the National Institute of Mental Health Grants R37-MH101495 to IHG, MH019938 to Alan Schatzberg (funding EMM), and MH019908 to Allan L. Reiss (funding JGM) and the Stanford University Precision Health and Integrated Diagnostics Center (PHIND). We thank Julia Gillette for her help with compiling data. We are grateful to all of the participants and research staff who made this work possible.
Funding information
National Institute of Mental Health, Grant/Award Number: R37-MH101495, T32-MH019908 and T32-MH019938; Stanford University Precision Health and Integrated Diagnostics Center
Footnotes
CONFLICT OF INTEREST
Drs Manczak, Miller, and Gotlib report no biomedical financial interests or potential conflict of interest.
DATA AVAILABILITY STATEMENT
The data that support the findings of this study are available on request from the corresponding author. The data are not publicly available due to privacy or ethical restrictions.
REFERENCES
- Ahmed S, Khoda S, Rekha R, Gardener R, Ameer S, Moore S, … Raqib R (2011). Arsenic-associated oxidative stress, inflammation, and immune disruption in human placenta and cord blood. Environmental Health Perspectives, 119(2), 258–264. 10.1289/ehp [DOI] [PMC free article] [PubMed] [Google Scholar]
- Allaire M, Wu H, & Lall U (2018). National trends in drinking water quality violations. Proceedings of the National Academy of Sciences of the United States of America, 115(9), 2078–2083. 10.1073/pnas.1719805115 [DOI] [PMC free article] [PubMed] [Google Scholar]
- Allgaier A-K, Frühe B, Pietsch K, Saravo B, Baethmann M, & Schulte-Körne G (2012). Is the Children’s Depression Inventory Short version a valid screening tool in pediatric care? A comparison to its full-length version. Journal of Psychosomatic Research, 73(5), 369–374. 10.1016/j.jpsychores.2012.08.016 [DOI] [PubMed] [Google Scholar]
- Barber BK (1996). Parental psychological control: Revisiting a neglected construct. Child Development, 67(6), 3296–3319. [PubMed] [Google Scholar]
- Brinkel J, Khan M, & Kraemer A (2009). A systematic review of arsenic exposure and its social and mental health effects with special reference to Bangladesh. International Journal of Environmental Research and Public Health, 6(5), 1609–1619. 10.3390/ijerph6051609 [DOI] [PMC free article] [PubMed] [Google Scholar]
- Chandravanshi LP, Shukla RK, Sultana S, Pant AB, & Khanna VK (2014). Early life arsenic exposure and brain dopaminergic alterations in rats. International Journal of Developmental Neuroscience, 38, 91–104. 10.1016/j.ijdevneu.2014.08.009 [DOI] [PubMed] [Google Scholar]
- Chen E, Schreier HMC, Strunk RC, & Brauer M (2008). Chronic traffic-related air pollution and stress interact to predict biologic and clinical outcomes in asthma. Environmental Health Perspectives, 116(7), 970–975. 10.1289/ehp.11076 [DOI] [PMC free article] [PubMed] [Google Scholar]
- Choi W-J, Kwon H-J, Lim MH, Lim J-A, & Ha M (2016). Blood lead, parental marital status and the risk of attention-deficit/hyperactivity disorder in elementary school children: A longitudinal study. Psychiatry Research, 236(C), 42–46. 10.1016/j.psychres.2016.01.002 [DOI] [PubMed] [Google Scholar]
- Chung JY, Yu SD, & Hong YS (2014). Environmental source of arsenic exposure. Journal of Preventive Medicine and Public Health, 47(5), 253. [DOI] [PMC free article] [PubMed] [Google Scholar]
- Clougherty JE, Levy JI, Kubzansky LD, Ryan PB, Suglia SF, Canner MJ, & Wright RJ (2007). Synergistic effects of traffic-related air pollution and exposure to violence on urban asthma etiology. Environmental Health Perspectives, 115(8), 1140–1146. 10.1289/ehp.9863 [DOI] [PMC free article] [PubMed] [Google Scholar]
- Dowlati Y, Herrmann N, Swardfager W, Liu H, Sham L, Reim EK, & Lanctôt KL (2010). A meta-analysis of cytokines in major depression. Biological Psychiatry, 67(5), 446–457. 10.1016/j.biopsych.2009.09.033 [DOI] [PubMed] [Google Scholar]
- Feinberg ME, Button TMM, Neiderhiser JM, Reiss D, & Hetherington EM (2007). Parenting and adolescent antisocial behavior and depression: Evidence of genotype x parenting environment interaction. Archives of General Psychiatry, 64(4), 457–465. 10.1001/archpsyc.64.4.457 [DOI] [PubMed] [Google Scholar]
- Ford JD, & Rogers K (1997). Traumatic events screening inventory. Hanover, NH: US Department of Veteran's Affairs, National Center for PTSD. [Google Scholar]
- Fujino Y, Guo X, Liu J, You L, Miyatake M, & Yoshimura T (2004). Mental health burden amongst inhabitants of an arsenic-affected area in Inner Mongolia. China. Social Science & Medicine, 59(9), 1969–1973. 10.1016/j.socscimed.2004.02.031 [DOI] [PubMed] [Google Scholar]
- García RG, Zarruk JG, Barrera C, Pinzón A, Trillos E, Arenas WD, … López-Jaramillo P (2011). Plasma nitrate levels and flow-mediated vasodilation in untreated major depression. Psychosomatic Medicine, 73(4), 344–349. 10.1097/PSY.0b013e31821566cf [DOI] [PubMed] [Google Scholar]
- Goodlad JK, Marcus DK, & Fulton JJ (2013). Lead and Attention-Deficit/Hyperactivity Disorder (ADHD) symptoms: A meta-analysis. Clinical Psychology Review, 33(3), 417–425. 10.1016/j.cpr.2013.01.009 [DOI] [PubMed] [Google Scholar]
- Hanna-Attisha M, LaChance J, Sadler RC, & Champney Schnepp A (2016). Elevated blood lead levels in children associated with the Flint drinking water crisis: A spatial analysis of risk and public health response. American Journal of Public Health, 106(2), 283–290. 10.2105/AJPH.2015.303003 [DOI] [PMC free article] [PubMed] [Google Scholar]
- Katon W, Lozano P, Russo J, McCauley E, Richardson L, & Bush T (2007). The prevalence of DSM-IV anxiety and depressive disorders in youth with asthma compared with controls. Journal of Adolescent Health, 41(5), 455–463. Retrieved from http://www.sciencedirect.com/science/article/pii/S1054139X07002443 [DOI] [PMC free article] [PubMed] [Google Scholar]
- King LS, Colich NL, LeMoult J, Humphreys KL, Ordaz SJ, Price AN, & Gotlib IH (2017). The impact of the severity of early life stress on diurnal cortisol: The role of puberty. Psychoneuroendocrinology, 77, 68–74. 10.1016/j.psyneuen.2016.11.024 [DOI] [PMC free article] [PubMed] [Google Scholar]
- Kovacs M. (1992). Children's depression inventory. North Tonawanda, NY: Multi-Health System. [Google Scholar]
- Lewinsohn PM, Rohde P, Seeley JR, Klein DN, & Gotlib IH (2000). Natural course of adolescent major depressive disorder in a community sample: Predictors of recurrence in young adults. American Journal of Psychiatry, 157, 1584–1591. [DOI] [PubMed] [Google Scholar]
- Liew J, Kwok O, Chang YP, Chang BW, & Yeh YC (2014). Parental autonomy support predicts academic achievement through emotion-related self-regulation and adaptive skills in Chinese American adolescents. Asian American Journal of Psychology, 5(3), 214–222. 10.1037/a0034787 [DOI] [Google Scholar]
- Manassaram DM, Backer LC, & Moll DM (2005). A review of nitrates in drinking water: Maternal exposure and adverse reproductive and developmental outcomes. Environmental Health Perspectives, 114(3), 320–327. 10.1289/ehp.8407 [DOI] [PMC free article] [PubMed] [Google Scholar]
- Manczak EM, Donenberg GR, & Emerson E (2018). Can mother–daughter communication buffer adolescent risk for mental health problems associated with maternal depressive symptoms? Journal of Clinical Child and Adolescent Psychology, 47(Suppl. 1), S509–S519. 10.1080/15374416.2018.1443458 [DOI] [PMC free article] [PubMed] [Google Scholar]
- Martinez EJ, Kolb BL, Bell A, Savage DD, & Allan AM (2008). Moderate perinatal arsenic exposure alters neuroendocrine markers associated with depression and increases depressive-like behaviors in adult mouse offspring. Neurotoxicology, 29(4), 647–655. 10.1016/j.neuro.2008.05.004 [DOI] [PMC free article] [PubMed] [Google Scholar]
- Miller GE, & Chen E (2010). Harsh family climate in early life presages the emergence of a proinflammatory phenotype in adolescence. Psychological Science, 21(6), 848–856. 10.1177/0956797610370161 [DOI] [PMC free article] [PubMed] [Google Scholar]
- Mishra KP (2009). Lead exposure and its impact on immune system: A review. Toxicology in Vitro, 23(6), 969–972. 10.1016/j.tiv.2009.06.014 [DOI] [PubMed] [Google Scholar]
- Morris NM, & Udry JR (1980). Validation of a self-administered instrument to assess stage of adolescent development. Journal of Youth and Adolescence, 9(3), 271–280. [DOI] [PubMed] [Google Scholar]
- Neugebauer J, Wittsiepe J, Kasper-Sonnenberg M, Schöneck N, Schölmerich A, & Wilhelm M (2015). The influence of low level pre- and perinatal exposure to PCDD/Fs, PCBs, and lead on attention performance and attention-related behavior among German school-aged children: Results from the Duisburg Birth Cohort Study. International Journal of Hygiene and Environmental Health, 218(1), 153–162. 10.1016/j.ijheh.2014.09.005 [DOI] [PubMed] [Google Scholar]
- Nordstrom DK (2002). Worldwide occurrences of arsenic in ground water. Science, 296(5576), 2143–2145. 10.1126/science.1072375 [DOI] [PubMed] [Google Scholar]
- OEHHA. (2017). Update to the California Communities Environmental Health Screening Tool, CalEnviroScreen 3.0 (pp. 1–166). Retrieved from https://oehha.ca.gov/media/downloads/calenviroscreen/report/ces3report.pdf [Google Scholar]
- O'Neill MS, Jerrett M, Kawachi I, Levy JI, Cohen AJ, Gouveia N, … Schwartz J (2003). Health, wealth, and air pollution: Advancing theory and methods. Environmental Health Perspectives, 111(16), 1861–1870. 10.1289/ehp.6334 [DOI] [PMC free article] [PubMed] [Google Scholar]
- Rhodes D, Spiro A III, Aro A, & Hu H (2003). Relationship of bone and blood lead levels to psychiatric symptoms: The Normative Aging study. Journal of Occupational and Environmental Medicine, 45(11), 1144–1151. 10.1097/01.jom.0000094995.23808.7b [DOI] [PubMed] [Google Scholar]
- Rudolph KD, & Hammen C (1999). Age and gender as determinants of stress exposure, generation, and reactions in youngsters: A transactional perspective. Child Development, 70(3), 660–677. 10.1111/1467-8624.00048 [DOI] [PubMed] [Google Scholar]
- Skerfving S, Löfmark L, Lundh T, Mikoczy Z, & Strömberg U (2015). Late effects of low blood lead concentrations in children on school performance and cognitive functions. Neurotoxicology, 49, 114–120. 10.1016/j.neuro.2015.05.009 [DOI] [PubMed] [Google Scholar]
- Smucker MR, Craighead WE, & Craighead LW (1986). Normative and reliability data for the Children’s Depression Inventory. Journal of Abnormal Child Psychology, 14, 25–39. [DOI] [PubMed] [Google Scholar]
- Taylor MP, Schniering CA, Lanphear BP, & Jones AL (2010). Lessons learned on lead poisoning in children: One-hundred years on from Turner's declaration. Journal of Paediatrics and Child Health, 47(12), 849–856. 10.1111/j.1440-1754.2010.01777.x [DOI] [PubMed] [Google Scholar]
- Tolins M, Rachirawat M, & Landrigan P (2014). The developmental neurotoxicity of arsenic: Cognitive and behavioral consequences of early life exposure. Annals of Global Health, 80(4), 303–314. 10.1016/j.aogh.2014.09.005 [DOI] [PubMed] [Google Scholar]
- Trentacosta CJ, Davis-Kean P, Mitchell C, Hyde L, & Dolinoy D (2016). Environmental contaminants and child development. Child Development Perspectives., 10(4), 228–233. [Google Scholar]
- Tuthill RW (1996). Hair lead levels related to children's classroom attention-deficit behavior. Archives of Environmental Health, 51(3), 214–220. 10.1080/00039896.1996.9936018 [DOI] [PubMed] [Google Scholar]
- Twenge JM, & Nolen-Hoeksema S (2002). Age, gender, race, socioeconomic status, and birth cohort difference on the children's depression inventory: A meta-analysis. Journal of Abnormal Psychology, 111(4), 578–588. 10.1037//0021-843X.111.4.578 [DOI] [PubMed] [Google Scholar]
- Tyler CR, Solomon BR, Ulibarri AL, & Allan AM (2014). Fluoxetine treatment ameliorates depression induced by perinatal arsenic exposure via a neurogenic mechanism. Neurotoxicology, 44, 98–109. 10.1016/j.neuro.2014.06.006 [DOI] [PMC free article] [PubMed] [Google Scholar]
- United Census Bureau. (2015). American Community Survey (ACS). Retrieved from http://www.census.gov/acs/www
- Usyugova I, Zeman C, Dhanwada K, & Beltz L (2002). Nitrates/nitrites alter human lymphocyte proliferation and cytokine production. Archives of Environmental Contamination and Toxicology, 43, 270–276. 10.1007/s00244-002-0214-7 [DOI] [PubMed] [Google Scholar]
- World Health Organization. (2009). Global health risks: Mortality and burden of disease attributable to selected major risks. Geneva: World Health Organization. [Google Scholar]
- Yap MBH, Pilkington PD, Ryan SM, & Jorm AF (2013). Parental factors associated with depression and anxiety in young people_ A systematic review and meta-analysis. Journal of Affective Disorders, 156(C), 8–23. 10.1016/j.jad.2013.11.007 [DOI] [PubMed] [Google Scholar]
- Zierold KM, Knobeloch L, & Anderson H (2004). Prevalence of chronic diseases in adults exposed to arsenic-contaminated drinking water. American Journal of Public Health, 94(11), 1936–1937. 10.2105/AJPH.94.11.1936 [DOI] [PMC free article] [PubMed] [Google Scholar]
Associated Data
This section collects any data citations, data availability statements, or supplementary materials included in this article.
Data Availability Statement
The data that support the findings of this study are available on request from the corresponding author. The data are not publicly available due to privacy or ethical restrictions.