

Abstract
Aim
To evaluate the efficacy and safety of a triple fixed‐dose combination (FDC) therapy of dapagliflozin + glimepiride + metformin hydrochloride extended‐release (DAPA + GLIM + MET ER) tablets in Indian patients with type 2 diabetes mellitus (T2DM) inadequately controlled by combination of GLIM + MET.
Materials and Methods
A phase III, randomized, open‐label, active‐controlled study was conducted for a maximum 30 weeks (primary treatment [16 weeks]; uptitration [12 weeks] and follow‐up [2 weeks]). Eligible patients were randomized in a 1:1 ratio to receive either the FDC of DAPA + GLIM + MET ER or the FDC of GLIM + MET prolonged‐release (PR) once‐daily. The primary efficacy endpoint was a change in glycated haemoglobin (HbA1c) from baseline to week 16.
Results
The mean reduction in HbA1c from baseline to week 16 was significantly greater with the FDC of DAPA + GLIM + MET ER compared to the FDC of GLIM + MET PR (−1.98% ± 1.01% vs. −1.64% ± 0.86%, p = 0.0047). The mean reduction in HbA1c from baseline to week 12 was significantly greater with the FDC of DAPA + GLIM + MET ER versus dual FDC (p < 0.0001). The proportion of patients achieving HbA1c <7.0% was significantly greater with the FDC of DAPA + GLIM + MET ER versus dual FDC at week 12 (19.1% vs. 6.5%; p = 0.0002) and week 16 (52.6% vs. 36.7%; p = 0.0015). A significant decrease in HbA1c, fasting and post‐prandial blood glucose from baseline to weeks 12, 16, and 28 was observed in both arms. The incidence of TEAEs was similar across both arms.
Conclusion
This study demonstrated that the FDC of DAPA + GLIM + MET ER tablets once daily was significantly better than dual FDC in achieving glycaemic control in patients with poorly controlled T2DM. Both treatments were well‐tolerated.
Trial Registration
CTRI/2022/03/041424, registered on 28 March 2022.
Keywords: dapagliflozin, fixed‐dose combination, glycaemic profile, metformin, SGLT2 inhibitor, type 2 diabetes
1. INTRODUCTION
The alarming increase in the burden of type 2 diabetes mellitus (T2DM), augmented by an increase in the comorbid metabolic cluster of disorders, highlights the need for tailored interference that could target multiple mechanisms simultaneously. 1 In this direction, combination therapies of different classes of anti‐glycaemic agents have emerged with complementary mechanisms of action, reduced doses of each component associated with minimal side effects. Therefore, to achieve a target treatment goal, the American Diabetes Association (ADA)/European Association for the Study of Diabetes (EASD) guidelines recommend/suggest combinations of two (dual) or three (triple) anti‐glycaemic agents, inclusive of metformin (MET) (exception: with MET contradiction) for three‐month intervals. 2
The American Association of Clinical Endocrinologists (AACE)/American College of Endocrinology guideline recommends initiating dual and triple therapy in individuals with HbA1c levels of 7.5%–9.0% and >9.0%, respectively. 3 , 4
The population with T2DM in India experiences high cardiovascular and renal morbidity and mortality. 5 Diabetes‐associated complications in India are rising. The prevalence of cardiovascular complications is significantly higher in Southeast Asia (42.5%) compared to global estimates (32.2%). Furthermore, chronic kidney disease is prevalent in 30–50% of T2DM Indian patients. 6 , 7
In contrast to polypharmacy, combination therapies offer simplified treatment regimens that reduce pill burden and improve treatment compliance, thereby enhancing therapeutic benefits. 8 India has one of the highest out‐of‐pocket expenditures in the world, with low insurance coverage. 9 As per the International Diabetes Federation, T2DM‐related health expenditure in India was USD 8.5 billion in 2021, which is projected to rise to USD 10.3 billion by 2030. 10 There is a pharmacoeconomic need to provide affordable treatment for the management of patients with T2DM and modernize the use of generic treatments. This sets the rationale for the use of fixed‐dose combination (FDC) of multiple agents in T2DM management.
The efficacy of the dual combination of first‐line MET and glimepiride (GLIM [sulfonylurea]) is utilized in newly diagnosed and long‐standing diabetes. 11 With the increasing realization of the cardiorenal benefits of the SGLT2i class of drugs, especially among T2DM patients, 12 , 13 a triple FDC of dapagliflozin (DAPA) + GLIM + MET hydrochloride extended‐release (ER) could achieve targeted glycaemic control and prevent long‐term complications and their associated morbidity. 14 DAPA, investigated as an add‐on therapy to MET + sulfonylureas, is proven to be clinically effective in the management of T2DM. 11 , 12 , 13 , 14 , 15 , 16 , 17 However, there are no clinical trials or real‐world evidence that directly compares and demonstrates the efficacy and safety of the triple FDC of DAPA + GLIM + MET ER with dual therapy. This randomized open‐label study aimed to evaluate the efficacy and safety of this novel triple FDC of DAPA + GLIM + MET ER tablets in T2DM patients compared to the dual FDC of GLIM + MET PR tablets.
2. MATERIALS AND METHODS
2.1. Study design
A phase III, randomized, parallel‐group, open‐label, active‐controlled study (CTRI/2022/03/041424) was conducted across 18 study sites in India to evaluate the efficacy and safety of the FDC of DAPA + GLIM + MET ER tablets compared to the FDC of GLIM + MET PR tablets in T2DM patients. All patients in the study were provided written informed consent before their screening procedure. The study obtained approval from the individual ethics committee of the respective institutions and was approved by the Drug Controller General of India. The study was designed and conducted in accordance with the Declaration of Helsinki (2013) 18 and ethical principles of Good Clinical Practice as defined by the International Council for Harmonization of Technical Requirements for Pharmaceuticals for Human Use, 19 New Drugs and Clinical Trial Rules 2019, 20 and Indian Council of Medical Research Ethical guidelines 2017. 21 The list of participating sites and ethics committee is provided in the Table S1.
2.2. Sample size calculation
To detect a treatment difference of 0.3% reduction in HbA1c between the FDC of DAPA + GLIM + MET ER and the FDC of GLIM + MET PR, with assumed standard deviation (SD) of 1.0%, 80% power and two‐sided alpha error of 5% and 10% dropout, approximately 392 patients were required to be randomized in 1:1 ratio (196 patients per treatment arm).
The eligibility of all the patients was assessed during a 2‐week screening period. Patients of either gender, between 18 to 65 years (both inclusive) of age, diagnosed with T2DM, HbA1c ≥8.0% to ≤11%, body mass index ≤45.0 kg/m2 and on a stable total daily dose of GLIM 1 mg and MET sustained release/PR/ER 1000 mg along with diet and exercise control for at least 8 weeks before screening were included in the study.
Patients with any type 1 diabetes or secondary forms of diabetes, fasting blood glucose (FBG) ≥270 mg/dL, on‐weight loss medications, with significant renal or hepatic impairment, uncontrolled hypertension (≥160/100 mm Hg), symptomatic diarrhoea, heart failure (New York Heart Association class III or IV), severe urinary tract infections, end‐stage renal disease, and pregnant or lactating women were excluded from the study.
Eligible patients were randomized in a 1:1 ratio to receive either the FDC of DAPA + GLIM + MET ER (10 mg + 1 mg + 1000 mg) tablets (GemerDapa™XR and OXRAMET®‐G XR) once daily, manufactured and marketed by Sun Pharma Laboratories Limited or the FDC of GLIM + MET PR (1 mg + 1000 mg) tablets (Gemer® DS 1) once‐daily, manufactured and marketed by Sun Pharma Laboratories Limited for a duration of 16 weeks (primary treatment period). The randomization schedule was generated centre‐wise by the sponsor using Statistical Analysis System (SAS)® version 9.4. A random permuted block size of four with a disclosed seed number was considered to maintain an equal distribution of patients across arms.
After completion of the primary treatment period of 16 weeks, patients with HbA1c ≤7.0% were subjected to end‐of‐treatment assessments at week 16 and 2 weeks after treatment, and safety follow‐up was done at week 18 (end of study) (Figure 1).
FIGURE 1.

Study design. D, day; DAPA, dapagliflozin; EOS, end of study; EOS, end of study; EOT, end of treatment; ER, extended‐release; FDC, fixed‐dose combination; GLIM, glimepiride; HbA1c, glycated haemoglobin; MET, metformin; OD, once‐daily; PR, prolonged release; SR, sustained release; V, Visit; Wk, week. *For patients achieving HbA1c ≤7.0% at the end of week 16, EOT assessments were carried out at week 16 and EOS at week 18. **For patients achieving HbA1c >7.0% and entering the uptitration period, EOT assessments were carried out at week 28 and EOS at week 30.
After completion of the primary treatment period, patients with HbA1c levels >7.0% received an up‐titrated dose from week 17 to week 28 (uptitration period). In this uptitration period, the patients received an up‐titrated dose of GLIM (2 mg) in the FDC of DAPA + GLIM + MET ER (10 mg + 2 mg + 1000 mg) tablets (GemerDapa™XR and OXRAMET®‐G XR) once‐daily or the FDC of GLIM + MET PR (2 mg + 1000 mg) tablets (Gemer® DS 2, manufactured and marketed by Sun Pharma Laboratories Limited) once‐daily as per their assigned treatment arm. Patients who required an uptitration dose were followed up for safety assessments at week 30 (end of study) (Figure 1).
2.3. Study endpoints
The primary endpoint was the mean change in HbA1c from baseline to week 16.
Secondary endpoints included mean change in HbA1c from baseline to weeks 12 and 28, mean change in postprandial blood glucose (PPBG) and FBG, body weight from baseline to weeks 12, 16, and 28, the proportion of patients achieving HbA1c level <7.0% at weeks 12, 16, and 28 and proportion of patients requiring rescue medications at weeks 16 and 28.
Safety analysis was done until 18 weeks for the primary treatment period and until 30 weeks for the uptitration period. The safety outcome measures included the incidence, nature, and cause of adverse events (AEs), serious adverse events (SAEs), treatment‐emergent adverse events (TEAEs), and any event of hypoglycaemia.
The criteria of hypoglycaemia were followed as per the ADA guidelines 2024. 22
2.4. Statistical analysis
The demographic and baseline data were summarized with descriptive statistics. Continuous data were presented as mean, SD or median (range), minimum and maximum and categorical data were presented as count (%).
The criterion for declaring statistical significance was p < 0.05 for all secondary efficacy endpoints with no attempt to control the family‐wise type 1 error rate.
The population considered for efficacy analysis for the primary treatment period included all randomized patients and those who received at least one dose of the assigned product and returned for at least one evaluation visit after the baseline visit. The population considered for the efficacy analysis for the uptitration period included all patients who were subjected to uptitrated doses of drugs. Efficacy analysis population for both periods included patients requiring rescue medication.
Mean actual and mean change from baseline to Week 16 in HbA1c were summarized with n, mean, SD, median, interquartile range, minimum, and maximum. In this study, the data did not follow a normal distribution, hence the data was rank transformed and an Analysis of Covariance (Rank ANCOVA) Model was used to test for a difference between the FDC of DAPA + GLIM + MET ER and the FDC of GLIM + MET PR. The model had the ranked data for change in HbA1c as the dependent variable, treatment as a fixed effect and baseline HbA1c as a covariate.
For secondary efficacy endpoints, ‘mean change in PPBG, FBG and body weight’, the Rank ANCOVA model (as the data followed non normal distribution) was used, the model was similar to the primary endpoint analysis; the proportion of patients achieving HbA1c <7.0% was summarized using count (%), and the Chi‐square test was used to test for a difference between the FDC of DAPA + GLIM + MET ER and the FDC of GLIM + MET PR. All the analyses were performed at a two‐sided 5% level of significance using the SAS version 9.4.
The p‐values for the uptitration period should be interpreted with caution because the population for the uptitration period was not a randomized population.
Safety analysis for the primary treatment period was performed on all randomized patients who received at least one dose of the study medication. Safety analysis for the uptitration period was performed on all patients who were subjected to uptitrated doses of drugs. The safety analysis population for both periods included patients requiring rescue medication.
The incidence of TEAEs was summarized with count (%) by preferred term, system organ class, severity and outcome, relationship, and action taken with study medication using Medical Dictionary for Regulatory Activities version 24.0. The relatedness of the study medication was based on Investigator's judgement. The number of hypoglycaemia events was also summarized as count (%).
The missing data was identified and categorized at the time of data review, before data base lock. For the primary endpoint, there was no data which was missing not at random or missing completely at random. The data of patients who were lost to follow‐up, were categorized as missing at random.
For the secondary endpoints or safety assessments, there was no data which was missing not at random. The data for laboratory assessments which was not assessed due to technical glitches or inadequate sample was categorized as missing completely at random. The data of patients which were lost to follow‐up, were categorized as missing at random.
3. RESULTS
3.1. Patient disposition
The study, conducted across 18 sites in India, screened 440 patients, of whom 395 eligible patients were randomized to the FDC of DAPA + GLIM + MET ER (n = 195) and the FDC of GLIM + MET PR (n = 200). The first patient's first visit in this study was on 04/APR/2022, and the last patient's last visit was on 30/DEC/2022. The disposition of patients is explained further in Figure 2.
FIGURE 2.
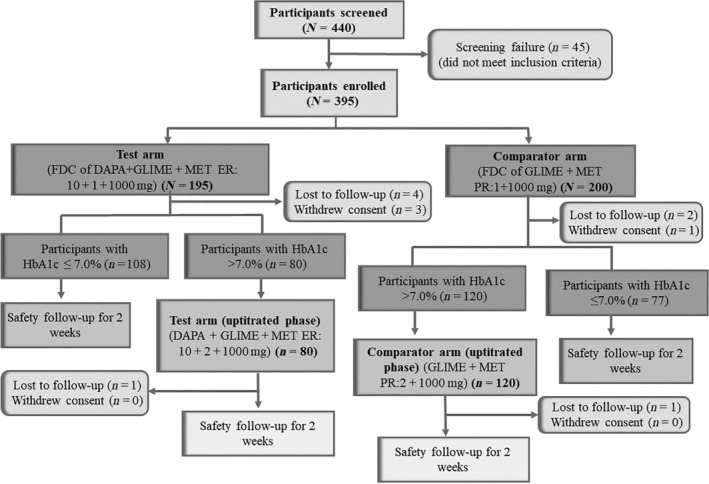
Patient disposition (CONSORT). DAPA, dapagliflozin; EOS, end of study; EOT, end of treatment; ER, extended‐release; FDC, fixed‐dose combination; GLIM, glimepiride; HbA1c, Glycated Haemoglobin; MET, metformin; PR, prolonged release. Post primary treatment period of 16 weeks, for patients with HbA1c level ≤7%, EOT assessments were performed at end of week 16 and were monitored for safety at week 18 (EOS). Post primary treatment period of 16 week, patients with HbA1c level >7% entered the uptitration period (week 17 to week 28). Patients who required uptitration were followed up for safety assessments at week 30 (EOS).
3.2. Patients' demographics and baseline characteristics
The demographics and baseline characteristics were similar and balanced in both treatment arms. The mean age was 47.48 ± 10.02 years, and the mean body mass index was 25.90 ± 3.94 kg/m2. Gender distribution was similar in both treatment arms (Table 1).
TABLE 1.
Demographic and baseline characteristics.
| Statistic summary | Treatment period (D1 to Week 16) | Uptitration period (Week 17 to Week 28) | ||||
|---|---|---|---|---|---|---|
| DAPA + GLIM + MET ER (N = 195) | GLIM + MET PR (N = 200) | DAPA + GLIM + MET ER versus GLIM + MET PR (p‐value) a | DAPA + GLIM + MET ER (N = 80) | GLIM + MET PR (N = 120) | DAPA + GLIM + MET ER versus GLIM + MET PR (p‐value) a | |
| Male, n (%) b | 105 (53.8%) | 102 (51.0%) | 0.5712 | 43 (53.8%) | 65 (54.2%) | 0.9538 |
| Female, n (%) b | 90 (46.2%) | 98 (49.0%) | 37 (46.3%) | 55 (45.8%) | ||
| Age c , years | 48.04 ± 10.07 | 46.93 ± 9.96 | 0.2732 | 50.46 ± 9.12 | 48.39 ± 9.55 | 0.1277 |
| Height c , cm | 161.0 ± 8.91 | 160.5 ± 8.24 | 0.5548 | 160.2 ± 8.71 | 159.9 ± 8.68 | 0.8296 |
| Weight c , kg | 66.63 ± 11.29 | 67.08 ± 10.29 | 0.6791 | 67.16 ± 11.63 | 68.09 ± 10.67 | 0.5601 |
| BMI c , kg/m2 | 25.74 ± 3.94 | 26.06 ± 3.95 | 0.4157 | 26.18 ± 4.13 | 26.58 ± 3.95 | 0.4913 |
| HbA1c c , % | 9.07 ± 0.88 | 8.96 ± 0.75 | 0.4516 | 9.31 ± 0.92 | 9.12 ± 0.79 | 0.1904 |
| FBG c , mg/dL | 171.5 ± 33.23 | 166.6 ± 33.08 | 0.2766 | 171.2 ± 35.25 | 167.5 ± 33.01 | 0.5477 |
| PPBG c , mg/dL | 252.9 ± 52.77 | 246.6 ± 47.48 | 0.2844 | 258.7 ± 61.84 | 246.0 ± 49.65 | 0.2085 |
Abbreviations: BMI, body mass index; DAPA, dapagliflozin; FBG, fasting blood glucose; GLIM, glimepiride; HbA1c, glycated haemoglobin; MET ER, metformin hydrochloride extended‐release; PPBG, postprandial blood glucose; SD, standard deviation.
p‐values were computed using the Chi‐square test for categorical data (presented as count, %) and two sample t‐test for continuous data (presented as mean ± SD).
n (%): n stands for number of patients and percentages were computed using N provided in the column header.
Data presented as mean ± SD. Baseline p‐value is based on Mann–Whitney test.
3.3. Primary efficacy endpoint
At the baseline, mean HbA1c was approximately 9% in each treatment arm. From baseline to week 16, there was a significant reduction in HbA1c (mean ± SD) with the FDC of DAPA + GLIM + MET ER (−1.98% ± 1.01%) as compared to the FDC of GLIM/MET PR (−1.64% ± 0.86%); p = 0.0047 in favour of the FDC of DAPA + GLIM + MET ER (Figure 3A and Table 2A).
FIGURE 3.

Change in HbA1c (%) from baseline to weeks 12 and 16. DAPA, dapagliflozin; ER extended release; FDC, fixed‐dose combination; GLIM, glimepiride; HbA1c, glycated haemoglobin; MET, metformin; PR, prolonged release. Rank ANCOVA model for change in HbA1c as the dependent variable, treatment, and treatment‐by‐visit interaction as fixed effects, and baseline HbA1c as a covariate.
TABLE 2A.
Mean change from baseline in HbA1c, fasting blood glucose, postprandial blood glucose, body weight, and proportion of patients achieving HbA1c <7% in the treatment period.
| Efficacy parameters | DAPA + GLIM + MET ER (N = 195) | GLIM + MET PR (N = 200) | DAPA + GLIM + MET ER versus GLIM + MET PR (p‐value) a |
|---|---|---|---|
| HbA1c, % (mmol/mol) | |||
| Baseline b HbA1c (actual values), mean ± SD | 9.07 ± 0.88 | 8.96 ± 0.75 | 0.4516 |
| Change in HbA1c at week 12 c , mean ± SD | −1.37 ± 0.93 | −1.01 ± 0.79 | <0.0001 |
| Change in HbA1c at week 16 c , mean ± SD | −1.98 ± 1.01 | −1.64 ± 0.86 | 0.0047 |
| p‐value (within‐group comparison from baseline to week 16) d | <0.0001 | <0.0001 | – |
| FBG, mg/dL | |||
| Baseline b FBG (actual values), mean ± SD | 171.5 ± 33.23 | 166.6 ± 33.08 | 0.2766 |
| Change in FBG at week 12 c , mean ± SD | −36.4 ± 36.95 | −28.5 ± 28.62 | 0.0109 |
| Change in FBG at week 16 c , mean ± SD | −45.3 ± 37.30 | −39.4 ± 35.34 | 0.1559 |
| p‐value (within‐group comparison from baseline to week 16) d | <0.0001 | <0.0001 | – |
| PPBG, mg/dL | |||
| Baseline b PPBG (actual values), mean ± SD | 252.9 ± 52.77 | 246.6 ± 47.48 | 0.2844 |
| Change in PPBG at week 12 c , mean ± SD | −53.8 ± 53.31 | −41.3 ± 49.61 | 0.0077 |
| Change in PPBG at week 16 c , mean ± SD | −71.7 ± 56.83 | −60.9 ± 57.90 | 0.2859 |
| p‐value (within‐group comparison from baseline to week 16) d | <0.0001 | <0.0001 | – |
| Proportion of patients with HbA1c <7% (53 mmol/mol) | |||
| At week 12, n (%) | 37 (19.1%) | 13 (6.5%) | 0.0002 |
| At week 16, n (%) | 101 (52.6%) | 73 (36.7%) | 0.0015 |
| Body weight, kg | |||
| Baseline b body weight, (actual values), mean ± SD | 66.63 ± 11.28 | 67.02 ± 10.22 | 0.6950 |
| Change in body weight at week 12 c , mean ± SD | −0.12 ± 1.32 | −0.25 ± 1.49 | 0.4009 |
| Change in body weight at week 16 c , mean ± SD | −0.31 ± 1.75 | −0.18 ± 1.78 | 0.5473 |
| p‐value (within‐group comparison from baseline to week 16) d | 0.0018 | 0.0328 | – |
Abbreviations: CI, confidence interval; DAPA, dapagliflozin; FBG, fasting blood glucose; GLIM, glimepiride; HbA1c, glycated haemoglobin; MET ER, metformin hydrochloride extended‐release; LS, least squares; SD, standard deviation.
p‐value for between‐group comparison: Rank ANCOVA model.
The randomization visit assessment result was considered as the baseline value. Baseline p‐values were based on the Mann–Whitney test.
Change was calculated from the baseline. Change from baseline = post‐dose values − baseline values.
p‐value for within‐group comparison: Wilcoxon signed rank test.
Thus, Figure 3A and Table 2A show that the FDC of DAPA + GLIM + MET ER demonstrated superior efficacy compared to the FDC of GLIM + MET PR for HbA1c reduction.
Both arms showed a significant reduction in HbA1c from baseline to week 16 (p < 0.0001 for each treatment arm).
3.4. Secondary efficacy endpoint
3.4.1. Change in HbA1c (%) from baseline to week 12 and week 28
The reduction in HbA1c (mean ± SD) from baseline to week 12 was statistically significant with the FDC of DAPA + GLIM + MET ER as compared to the FDC of GLIM + MET PR (−1.37% ± 0.93% vs. −1.01% ± 0.79%; p < 0.0001). This demonstrated the superior efficacy of the FDC of DAPA + GLIM + MET ER even at week 12 (Figure 3B). In the uptitration period, reduction in HbA1c (mean ± SD) from baseline to week 28 was comparable between the FDC of DAPA + GLIM + MET ER and the FDC of GLIM + MET PR (−2.08 ± 1.06% vs. −1.80% ± 1.07%, p = 0.4943) (Figure 3B and Table 2B). However, due to better glycaemic control with the FDC of DAPA + GLIM + MET ER, a significantly smaller number of patients required dose uptitration in the FDC of DAPA + GLIM + MET ER (n = 80) compared to the FDC of GLIM + MET PR (n = 120). Both arms showed a significant reduction in HbA1c from baseline at weeks 12 and 28 (p < 0.0001 for each treatment arm).
TABLE 2B.
Mean change from baseline in HbA1c, fasting blood glucose, postprandial blood glucose, body weight, and proportion of patients achieving HbA1c <7% in the Uptitration period.
| Efficacy parameters | DAPA + GLIM + MET ER (N = 79) | GLIM + MET PR (N = 119) | DAPA + GLIM + MET ER versus GLIM + MET PR (p‐value) a |
|---|---|---|---|
| HbA1c, % | |||
| Baseline b HbA1c (actual values), mean ± SD | 9.30 ± 0.91 | 9.11 ± 0.78 | 0.1973 |
| Change in HbA1c at week 28 c , mean ± SD | −2.08 ± 1.06 | −1.80 ± 1.07 | 0.4943 |
| p‐value (within‐group comparison from baseline to week 28) d | <0.0001 | <0.0001 | ‐ |
| FBG, mg/dL | |||
| Baseline b FBG (actual values), mean ± SD | 172.0 ± 34.74 | 168.1 ± 32.44 | 0.5134 |
| Change in FBG at week 28 c , mean ± SD | −41.6 ± 49.68 | −43.7 ± 40.27 | 0.6777 |
| p‐value (within‐group comparison from baseline to week 28) d | <0.0001 | <0.0001 | – |
| PPBG, mg/dL | |||
| Baseline b PPBG (actual values), mean ± SD | 258.1 ± 61.94 | 246.5 ± 49.51 | 0.2848 |
| Change in PPBG at week 28 c , mean ± SD | −69.1 ± 81.13 | −65.7 ± 72.60 | 0.5642 |
| p‐value (within‐group comparison from baseline to week 28) d | <0.0001 | <0.0001 | – |
| Proportion of patients with HbA1c <7% | |||
| At week 28, n (%) | 32 (40.5%) | 47 (39.5%) | 0.8869 |
| Body weight, kg | |||
| Baseline b body weight, (actual values), mean ± SD | 67.18 ± 11.66 | 68.06 ± 10.64 | 0.6709 |
| Change in body weight at week 28 c , mean ± SD | −0.55 ± 1.59 | −0.49 ± 2.62 | 0.7165 |
| p‐value (within‐group comparison from baseline to week 28) d | 0.0030 | 0.0337 | – |
Abbreviations: CI, confidence interval; DAPA, dapagliflozin; FBG, fasting blood glucose; GLIM, glimepiride; HbA1c, glycated haemoglobin; MET ER, metformin hydrochloride extended‐release; LS, least squares; SD, standard deviation.
p‐value for between‐group comparison: Rank ANCOVA model.
The randomization visit assessment result was considered as the baseline value. Baseline p‐values were based on the Mann–Whitney test.
Change was calculated from the baseline. Change from baseline = post‐dose values – baseline values.
p‐value for within‐group comparison: Wilcoxon signed rank test.
3.4.2. Change in FBG (mg/dL) from baseline to weeks 12, 16 and 28
The reduction in FBG (mean ± SD) from baseline to week 12 was statistically significant with the FDC of DAPA + GLIM + MET ER (−36.4 ± 36.95 mg/dL) as compared to the FDC of GLIM + MET PR (−28.5 ± 28.62 mg/dL); p = 0.0109. The reduction in FBG (mean ± SD) from baseline to week 16 was comparable between the FDC of DAPA + GLIM + MET ER and the FDC of GLIM + MET PR (−45.3 ± 37.30 mg/dL vs. −39.4 ± 35.34 mg/dL, p = 0.1559). During the up‐titration period, the mean reduction in FBG (mean ± SD) from baseline to week 28 was comparable between the FDC of DAPA + GLIM + MET ER and the FDC of GLIM + MET PR (−41.6 ± 49.68 mg/dL vs. −43.7 ± 40.27 mg/dL, p = 0.6777).
Statistically significant reduction (p < 0.0001) was observed within each arm from baseline to weeks 12, 16 and 28 (Tables 2A and 2B).
3.4.3. Change in PPBG (mg/dL) from baseline up to week 16 and 28
Reduction in PPBG (mean ± SD) level from baseline to week 12 was statistically significant with the FDC of DAPA + GLIM + MET ER (−53.8 ± 53.31 mg/dL) and the FDC of GLIM + MET PR (−41.3 ± 49.61 mg/dL); p = 0.0077. Reduction in PPBG (mean ± SD) level from baseline to week 16 was comparable between the FDC of the DAPA + GLIM + MET ER arm (−71.7 ± 56.83 mg/dL) and the FDC of the GLIM + MET PR arm (−60.9 ± 57.90 mg/dL); p = 0.2859 (Table 2A). Reduction in PPBG (mean ± SD) level from baseline to week 28 was comparable between the FDC of the DAPA + GLIM + MET ER arm (−69.1 ± 81.13 mg/dL) and the FDC of the GLIM + MET PR arm (−65.7 ± 72.60 mg/dL), p = 0.5642. Statistically significant reduction (p < 0.0001) was observed within each arm from baseline to weeks 12, 16 and 28 (Tables 2A and 2B).
3.4.4. Proportion of patients achieving HbA1c <7.0% at different week intervals
At week 12, the proportion of patients who achieved HbA1c <7.0% was significantly greater in the FDC of DAPA + GLIM + MET ER against those in the FDC of GLIM + MET PR (19.1% vs. 6.5%; p = 0.0002 in favour of the FDC of DAPA + GLIM + MET ER) (Table 2A and Figure 4).
FIGURE 4.
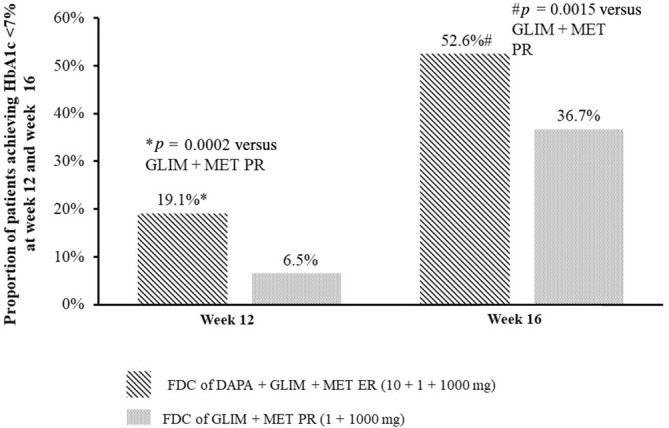
Proportion of patients achieving HbA1c <7.0% at week 12 and week 16. DAPA, dapagliflozin; ER, extended release; FDC, fixed‐dose combination; GLIM, glimepiride; HbA1c, glycated haemoglobin; MET, metformin; PR, prolonged release. p‐value was estimated using Chi‐square test for between‐group comparison. Percentage was computed using total number of subjects in each visit.
At week 16, the proportion of patients who achieved HbA1c <7.0% was significantly greater in the FDC of DAPA + GLIM + MET ER against those in the FDC of GLIM/MET PR (52.6% vs. 36.7%; p = 0.0015; in favour of the FDC of DAPA + GLIM + MET ER) (Table 2A and Figure 4).
At week 28, the proportion of patients achieving HbA1c <7.0% at week 28 was not significant between both arms (40.5% vs. 39.5%; p = 0.8869) (Table 2B).
3.4.5. Change in body weight (kg) from baseline up to weeks 16 and 28
At week 16, the change in body weight (kg) from baseline was comparable between the FDC of the DAPA + GLIM + MET ER arm versus the FDC of the GLIM + MET PR arm (−0.31 ± 1.75 kg vs. −0.18 ± 1.78 kg, p = 0.5473) (Table 2A). In the uptitration period, the change in body weight (mean ± SD) from baseline to week 28 was comparable between the FDC of DAPA + GLIM + MET ER and FDC of GLIM + MET PR (−0.55 ± 1.59 kg vs. −0.49 ± 2.62 kg, p = 0.7165) (Table 2B).
3.5. Safety
During the primary treatment period (till week 18), a total of 32 TEAEs were reported in 17 patients, which accounted for 4.3% of the study population. All these events were mild and did not lead to drug discontinuation or dose modification during the study period. Of all the TEAEs, 15 events occurred in nine (4.6%) patients in the FDC of DAPA + GLIM + MET ER, while 17 events were observed in eight (4.0%) patients in the FDC of GLIM + MET PR. The most commonly reported TEAEs in these patients were headache, vomiting, and pyrexia (Table 3). The occurrence of pyrexia and arthralgia was probably/likely related to study medication, while the remaining TEAEs were unlikely to be related to the medication. One event of mild hypoglycaemia without any symptoms (based on FBG) was reported in the FDC of DAPA + GLIM + MET ER, which did not require active management. Notably, four (2%) patients in the FDC of DAPA + GLIM + MET ER and two (1%) patients in the FDC of GLIM + MET PR arm required rescue medication in the primary treatment period.
TABLE 3.
Summary of treatment‐emergent adverse events by system organ class and preferred term.
| System organ class | Treatment period (D1 to Week 16) | |||
|---|---|---|---|---|
| Preferred term | FDC of DAPA + GLIM + MET ER (N = 195) | FDC of GLIM + MET PR (N = 200) | ||
| n (%) | E | n (%) | E | |
| Total TEAEs | 9 (4.6) | 15 | 8 (4.0) | 17 |
| Gastrointestinal disorders | 2 (1.0) | 3 | 3 (1.5) | 5 |
| Abdominal distension | 0 | 0 | 1 (0.5) | 1 |
| Diarrhoea | 1 (0.5) | 1 | 0 | 0 |
| Nausea | 0 | 0 | 1 (0.5) | 1 |
| Vomiting | 2 (1.0) | 2 | 3 (1.5) | 3 |
| General disorders and administration site conditions | 4 (2.1) | 5 | 2 (1.0) | 3 |
| Asthenia | 2 (1.0) | 2 | 1 (0.5) | 1 |
| Pyrexia | 3 (1.5) | 3 | 2 (1.0) | 2 |
| Infections and infestations | 1 (0.5) | 1 | 2 (1.0) | 2 |
| Nasopharyngitis | 1 (0.5) | 1 | 2 (1.0) | 2 |
| Metabolism and nutrition disorders | 1 (0.5) | 1 | 0 | 0 |
| Hypoglycemia | 1 (0.5) | 1 | 0 | 0 |
| Musculoskeletal and connective tissue disorders | 0 | 0 | 1 (0.5) | 1 |
| Arthralgia | 0 | 0 | 1 (0.5) | 1 |
| Nervous system disorders | 3 (1.5) | 3 | 3 (1.5) | 3 |
| Dizziness | 0 | 0 | 1 (0.5) | 1 |
| Headache | 3 (1.5) | 3 | 2 (1.0) | 2 |
| Psychiatric disorders | 0 | 0 | 1 (0.5) | 1 |
| Anxiety | 0 | 0 | 1 (0.5) | 1 |
| Respiratory, thoracic and mediastinal disorders | 1 (0.5) | 1 | 2 (1.0) | 2 |
| Cough | 1 (0.5) | 1 | 2 (1.0) | 2 |
| Skin and subcutaneous tissue disorders | 1 (0.5) | 1 | 0 | 0 |
| Rash | 1 (0.5) | 0 | 0 | 0 |
| System organ class | Uptitration period (Week 17–28) | |||
|---|---|---|---|---|
| Preferred term | FDC of DAPA + GLIM + MET ER (N = 80) | FDC of GLIM + MET PR (N = 120) | ||
| n (%) | E | n (%) | E | |
| Total TEAEs | 3 (3.8) | 3 | 4 (3.3) | 6 |
| Gastrointestinal disorders | 2 (2.5) | 2 | 4 (3.3) | 5 |
| Constipation | 0 | 1 (0.8) | 1 | |
| Diarrhoea | 1 (1.3) | 1 | 0 | 0 |
| Gastritis | 1 (1.3) | 1 | 0 | |
| Hyperchlorhydria | 0 | 2 (1.7) | 2 | |
| Vomiting | 0 | 2 (1.7) | 2 | |
| General disorders and administration site conditions | 1 (1.3) | 1 | 0 | |
| Pyrexia | 1 (1.3) | 1 | 0 | |
| Nervous system disorders | 0 | 1 (0.8) | 1 | |
| Headache | 0 | 1 (0.8) | 1 | |
Note: Adverse events were classified into system organ classes and preferred terms using the Medical Dictionary for Regulatory Activities version 24.0. Percentages were computed using N provided in the column header.
Abbreviations: E, number of events; FDC, fixed dose combination; n, number of subjects; TEAE, treatment emergent adverse event.
During the uptitration period, three (3.8%) patients reported three TEAEs in the FDC of the DAPA + GLIM + MET ER arm, while four (3.3%) patients reported six TEAEs in the FDC of the GLIM + MET PR arm (Table 3). These events were also mild, not likely attributable to the study medications, and did not lead to study medication discontinuation or require any dose adjustments. No patients required rescue medication during the uptitration period.
During the study, no SAEs, deaths, or severe or life‐threatening TEAEs were reported.
4. DISCUSSION
With an increasing inclination towards combination therapies involving multiple anti‐glycaemic agents, this study has demonstrated improved efficacy of a triple FDC DAPA + GLIM + MET ER over FDC of GLIM + MET PR. The HbA1c levels >7% significantly increase the risk of micro‐ and macrovascular complications, as demonstrated in the UKPDS 35 (United Kingdom Prospective Diabetes Study and Diabetes Control and Complication) Trial. 23 Therefore, optimal glycaemic control is important for preventing and effectively managing diabetes and its associated complications. The ADA 2024 suggests immediate treatment intensification for adults not meeting individualized treatment goals. The ADA and Research Society for Study of Diabetes in India guidelines recommend combination therapy, 22 , 24 if HbA1c >1.5% above target.
The EASD guidelines recommend using a triple combination therapy, considering its benefit–risk profile. 3 Triple FDC of SGLT2i + Sulfonylurea + MET, with a complementary mechanism of action, can be an effective, well‐tolerated, simple treatment regimen to achieve targeted HbA1c.
The current study is the first to evaluate the efficacy and safety of this novel triple FDC of DAPA + GLIM + MET ER tablets in patients with poorly controlled T2DM with dual therapy. The study met its primary objective of the superiority of the FDC of DAPA + GLIM + MET ER over the FDC of GLIM + MET PR tablets in terms of HbA1c reduction from baseline to week 16. The reduction in HbA1c was also significantly greater in triple FDC compared to dual FDC at week 12.
In both arms, there was a significant decrease in HbA1c, FBG as well as PPBG from baseline to weeks 12, 16, and 28. The proportion of patients achieving HbA1c <7% at weeks 12 and 16 was significantly higher in the FDC of the DAPA + GLIM + MET ER arm compared to the FDC of the GLIM + MET PR arm. Reduction in body weight of <1 kg in both arms at weeks 16 and 28 can be attributed to a lower baseline body weight of ~67 kg. At the end of uptitration phase (week 28) of this study, reduction in HbA1c levels was comparable between both arms as few patients from the triple FDC arm required uptitration compared to the dual FDC arm.
The use of SGLT2i, GLIM and MET has been previously evaluated in many studies. In a phase III study by Matthaei et al., 17 the addition of DAPA to MET and sulfonylurea (N = 108) achieved a greater reduction in adjusted mean HbA1c (−0.86%) versus the addition of placebo to MET and sulfonylurea (−0.17%) at week 24. More patients achieved a therapeutic glycaemic response (HbA1c <7.0%) with DAPA, MET, sulfonylurea arm versus Placebo, MET, sulfonylurea arm (31.8% vs. 11.1%, p < 0.0001) at week 24.
A phase 3 study conducted by Ji et al., 25 at the end of 18 weeks, HbA1c levels were reduced by 0.97% and 1.06% by canagliflozin 100 and canagliflozin 300 mg, respectively, as add‐on therapy to MET and sulfonylurea compared to 0.47% in placebo as add‐on therapy to MET and sulfonylurea, p < 0.001 for canagliflozin doses.
In an observational study by Puli and Vanjari, 26 at the end of 12 weeks, HbA1c was reduced by 0.87 ± 0.115 mg/dL (p < 0.0001) by empagliflozin when added to MET and sulfonylurea. The mean changes of FBG from baseline to week 12 is −26 mg/dL.
The current study results were consistent with the results of the studies mentioned above, which evaluated the addition of SGLT2i to GLIM and MET in patients with poorly controlled T2DM. These studies demonstrated that the therapeutic combination of SGLT2i, GLIM, and MET provided meaningful glycaemic control without increasing the risk of hypoglycaemia.
Proportions of patients who achieved HbA1c <7.0% in our study were higher than the previously published study by Matthaei et al. 17
Polypharmacy and poor or non‐adherence to the treatment regimen is suggested to be one of the factors for suboptimal glucose control. 27 It is reported that each 10% increase in oral anti‐diabetic agent adherence was associated with a decrease in HbA1c of 0.1%, which implied an association between glycaemic control and oral anti‐diabetic therapy adherence. 28
The use of the FDC of DAPA + GLIM + MET ER having complementary mechanism is a rational approach which can offer better glycaemic control, the benefit of weight loss with less risk of hypoglycaemia along with the potential for cardiorenal protection, 11 , 12 , 13 , 14 , 15 , 16 , 17 while minimizing pill burden. Also, the use of triple FDC in a single pill formulation and once‐daily administration can provide greater convenience to patients leading to improved adherence and cost‐effectiveness. 21 The incidence of TEAEs was similar across both treatment arms. The common AEs reported in these patients were headache, vomiting, and pyrexia, which is in line with the known safety profile of each drug. 29 , 30 , 31 Previously published studies reported some adverse drug reactions (gastrointestinal, respiratory, cardiovascular complications and urinary tract and genital infections) in add‐on therapy of SGLT2i to GLIM, MET. 17 , 25 , 26 However, the current study did not find any such association.
The results of this study show promising outcomes with the FDC of DAPA + GLIM + MET ER, which could help optimize treatment strategies for patients with poorly controlled T2DM.
5. LIMITATIONS
The study has certain limitations. It was conducted only in the Indian population, and ethnic variations, lifestyle, genetics, and environmental factors could potentially affect the findings in other populations. The major limitation of the study was that it was not a double‐blind study. However, the efficacy endpoints assessed were mean changes in HbA1c, FBG, and PPBG (laboratory‐based objective endpoints) and did not lead to subjective bias. Considering all these points, an open‐label design was selected for the study.
Another limitation was the shorter treatment duration of 16 weeks and the uptitration duration of 12 weeks. Duration was considered appropriate to evaluate HbA1c reduction; however, a long‐term, prospective, real‐world study is required to assess the safety and tolerability of this novel triple FDC of DAPA + GLIM + MET ER.
6. CONCLUSION
This is the first study that demonstrated that triple FDC of DAPA + GLIM + MET ER achieved better HbA1c reduction, and a greater proportion of patients achieved glycaemic target of HbA1c <7% at week 16 in comparison to dual FDC in patients with poorly controlled T2DM. Thus, the FDC of DAPA + GLIM + MET ER tablets can provide effective glycaemic control without increased risk of hypoglycaemia and weight gain with potential for cardiorenal benefits and can be considered as an effective treatment option in patients with poorly controlled T2DM.
AUTHOR CONTRIBUTIONS
Rakesh Sahay, Dinesh Gangwani, Manish Singh, Sandeep Gupta, Narendra Kale, Manoj Srivastava, Prakash Kurmi, Jayesh Ambaliya, Nilesh Lomte, Sandip Gofne, Saurabh Agarwal, Priyanka Kashid, Vikas Agarwal, Pradeep Rai, Surendra Sharma, L. Sreenivasa Murthy were involved in the conduct of the study. Piyush Patel, Lalit Lakhwani, Suyog Mehta and Sadhna Joglekar were involved in designing the study. Shruti Saha, Mandodari Rajurkar, Dipak Patil, and Pravin Ghadge were involved in data interpretation. Mandodari Rajurkar and Dipak Patil were involved in manuscript writing and finalizing. All authors have read and approved the final manuscript.
FUNDING INFORMATION
Sponsorship for this study and its publication, was funded by Sun Pharma Laboratories Limited, Mumbai, India.
CONFLICT OF INTEREST STATEMENT
Authors, Rakesh Sahay, Dinesh Gangwani, Manish Singh, Sandeep Gupta, Narendra Kale, Manoj Srivastava, Prakash Kurmi, Jayesh Ambaliya, Nilesh Lomte, Sandip Gofne, Saurabh Agarwal, Priyanka Kashid, Vikas Agarwal, Pradeep Rai, Surendra Sharma, L. Sreenivasa Murthy were the study investigators and they received a grant from sponsor for conducting the study at their respective sites and declare no conflict of interests. Mandodari Rajurkar, Shruti Saha, Dipak Patil, Pravin Ghadge and Suyog Mehta are full‐time employees of Sun Pharma Laboratories Ltd. Dr. Piyush Patel and Dr. Lalit Lakhwani were full‐time employees of Sun Pharma Laboratories Ltd. during the conduct of the study. Dr. Sadhna J. Joglekar was a full‐time employee of Sun Pharmaceutical Industries Ltd. during conduct of the study.
PEER REVIEW
The peer review history for this article is available at https://www.webofscience.com/api/gateway/wos/peer-review/10.1111/dom.16218.
Supporting information
Table S1. Supporting information.
ACKNOWLEDGEMENTS
We thank the participants who volunteered for the study and teams at all participating sites. We thank the clinical operations team and clinical data management team of Sun Pharma Laboratories Limited, Mumbai. We also thank Knowledge Isotopes for assistance in writing this manuscript. We thank Neeraj Markandeywar of Sun Pharma Laboratories Limited, Mumbai, India for reviewing and editing this manuscript.
Sahay R, Gangwani D, Singh M, et al. Fixed dose combination of dapagliflozin, glimepiride and extended‐release metformin tablets in patients with type 2 diabetes poorly controlled by metformin and glimepiride: A phase III, open label, randomized clinical study in India. Diabetes Obes Metab. 2025;27(4):2193‐2205. doi: 10.1111/dom.16218
Poster presentation of the study design was done at the Diabetes India Conference 2022, Indore, India between 14th and 16th April 2023. Poster presentations of the full study results and four subgroup analysis results were done at the Research Society for the Study of Diabetes in India 2023, Mumbai, India on 16th November 2023.
DATA AVAILABILITY STATEMENT
The datasets generated during and/or analysed during the current study are available from the corresponding author on reasonable request.
REFERENCES
- 1. Muralidharan S. Diabetes and current Indian scenario: a narrative review. J Diabetol. 2024;15:12‐17. [Google Scholar]
- 2. Garber AJ, Abrahamson MJ, Barzilay JI, Blonde L, Bloomgarden ZT, Bush MA. Consensus statement by the American Association of Clinical Endocrinologists and American College of endocrinology on the comprehensive type 2 diabetes management algorithm‐2016 executive summary. Endocr Pract. 2016;22:84‐113. [DOI] [PubMed] [Google Scholar]
- 3. Inzucchi SE, Bergenstal RM, Buse JB, et al. Management of hyperglycemia in type 2 diabetes: a patient‐centered approach: position statement of the American Diabetes Association (ADA) and the European Association for the Study of diabetes (EASD). Diabetes Care. 2012;35:1364‐1379. [DOI] [PMC free article] [PubMed] [Google Scholar]
- 4. Raghavan S, Vassy JL, Ho YL, et al. Diabetes mellitus–related all‐cause and cardiovascular mortality in a national cohort of adults. J Am Heart Assoc. 2019;8:e011295. [DOI] [PMC free article] [PubMed] [Google Scholar]
- 5. Einarson TR, Acs A, Ludwig C, Panton UH. Prevalence of cardiovascular disease in type 2 diabetes: a systematic literature review of scientific evidence from across the world in 2007–2017. Cardiovasc Diabetol. 2018;17:1‐9. [DOI] [PMC free article] [PubMed] [Google Scholar]
- 6. Rajput R, Kumar KM, Seshadri K, et al. Prevalence of chronic kidney disease (CKD) in type 2 diabetes mellitus patients: START‐India study. J Diab Metabol. 2017;08:8. [Google Scholar]
- 7. Anand S, Shivashankar R, Ali MK, et al. Prevalence of chronic kidney disease in two major Indian cities and projections for associated cardiovascular disease. Kidney Int. 2015;88:178‐185. [DOI] [PMC free article] [PubMed] [Google Scholar]
- 8. Min SH, Yoon JH, Moon SJ, Hahn S, Cho YM. Combination of sodium‐glucose cotransporter 2 inhibitor and dipeptidyl peptidase‐4 inhibitor in type 2 diabetes: a systematic review with meta‐analysis. Sci Rep. 2018;8:4466. [DOI] [PMC free article] [PubMed] [Google Scholar]
- 9. National Health Systems Resource Centre . National Health Accounts Estimates for India (2016–17). Ministry of Health and Family Welfare, Government of India; 2019. [Google Scholar]
- 10. IDF India . Diabetes Report 2000–2045. 2021. Accessed November 07, 2024. https://diabetesatlas.org/data/en/country/93/in.html
- 11. Kim HS, Kim DM, Cha BS, et al. Efficacy of glimepiride/metformin fixed‐dose combination vs metformin uptitration in type 2 diabetic patients inadequately controlled on low‐dose metformin monotherapy: a randomized, open label, parallel group, multicenter study in Korea. J Diabetes Investig. 2014;5:701‐708. [DOI] [PMC free article] [PubMed] [Google Scholar]
- 12. Wiviott SD, Raz I, Bonaca MP, et al. DECLARE–TIMI 58 investigators. dapagliflozin and cardiovascular outcomes in type 2 diabetes. N Engl J Med. 2019;380:347‐357. [DOI] [PubMed] [Google Scholar]
- 13. Kalra S. Sodium glucose co‐transporter‐2 (SGLT2) inhibitors: a review of their basic and clinical pharmacology. Diabetes Ther. 2014;5:355‐366. [DOI] [PMC free article] [PubMed] [Google Scholar]
- 14. Inzucchi SE. Is it time to change the type 2 diabetes treatment paradigm? No! Metformin should remain the foundation therapy for type 2 diabetes. Diabetes Care. 2017;40:1128‐1132. [DOI] [PubMed] [Google Scholar]
- 15. Korytkowski MT. Sulfonylurea treatment of type 2 diabetes mellitus: focus on glimepiride. Pharmacotherapy. 2004;24:606‐620. [DOI] [PubMed] [Google Scholar]
- 16. Rosenstock J, Kahn SE, Johansen OE, et al. Effect of linagliptin vs glimepiride on major adverse cardiovascular outcomes in patients with type 2 diabetes: the CAROLINA randomized clinical trial. JAMA. 2019;322:1155‐1166. [DOI] [PMC free article] [PubMed] [Google Scholar]
- 17. Matthaei S, Bowering K, Rohwedder K, Grohl A, Parikh S, Study 05 Group . Dapagliflozin improves glycemic control and reduces body weight as add‐on therapy to metformin plus sulfonylurea: a 24‐week randomized, double‐blind clinical trial. Diabetes Care. 2015;38(3):365‐372. doi: 10.2337/dc14-0666 [DOI] [PubMed] [Google Scholar]
- 18. World Medical Association . World medical association declaration of Helsinki: ethical principles for medical research involving human subjects. JAMA. 2013;310:2191‐2194. [DOI] [PubMed] [Google Scholar]
- 19. International Council for Harmonisation of Technical Requirements for Pharmaceuticals for Human Use (ICH) . The International Council for Harmonisation of Technical Requirements for Pharmaceuticals for Human Use (ICH). Guidelines for Good Clinical Practice E6(R2); Step 4 version dated 9 November 2016 and applicable amendments. ICH; 2016. [Google Scholar]
- 20. Ministry of Health and Family Welfare, India . New drugs and clinical trials rules, 2019. 2024. Accessed October 24, 2024. https://cdsco.gov.in/opencms/opencms/system/modules/CDSCO.WEB/elements/download_file_division.jsp?num_id=OTg4OA==
- 21. National Ethical Guidelines for Biomedical and Health Research Involving Human Participants. 2017. Accessed October 24, 2024. https://www.icmr.nic.in/guidelines/ICMR_Ethical_Guidelines_2017.pdf
- 22. American Diabetes Association Professional Practice Committee . 9. Pharmacologic approaches to glycemic treatment: standards of Care in Diabetes—2024. Diabetes Care. 2024;47:S158‐S178. [DOI] [PMC free article] [PubMed] [Google Scholar]
- 23. Stratton IM, Adler AI, Neil HA, et al. Association of glycaemia with macrovascular and microvascular complications of type 2 diabetes (UKPDS 35): prospective observational study. BMJ. 2000;321:405‐412. [DOI] [PMC free article] [PubMed] [Google Scholar]
- 24. Chawla R, Madhu SV, Makkar BM, Ghosh S, Saboo B, Kalra S. RSSDI‐ESI clinical practice recommendations for the management of type 2 diabetes mellitus 2020. Indian J Endocrinol Metab. 2020;24:1‐122. [DOI] [PMC free article] [PubMed] [Google Scholar]
- 25. Ji L, Han P, Liu Y, et al. Canagliflozin in Asian patients with type 2 diabetes on metformin alone or metformin in combination with sulphonylurea. Diabetes Obes Metab. 2015;17:23‐31. [DOI] [PubMed] [Google Scholar]
- 26. Puli K, Vanjari NK. A 12‐week prospective clinical evidence of empagliflozin efficacy in uncontrolled type 2 diabetes mellitus treated with metformin and a sulfonylurea. Int J Basic Clin Pharmacol. 2019;8:2639‐2644. [Google Scholar]
- 27. Arya DS, Chowdhury S, Chawla R, et al. Clinical benefits of fixed dose combinations translated to improved patient compliance. J Assoc Physicians India. 2019;67:58‐64. [PubMed] [Google Scholar]
- 28. Rozenfeld Y, Hunt JS, Plauschinat C, Wong KS. Oral antidiabetic medication adherence and glycemic control in managed care. Am J Manag Care. 2008;14:71‐75. [PubMed] [Google Scholar]
- 29. Prescribing information of AMARYL® (Glimepiride) Tablets. Bridgewater, NJ: Sanofi‐Aventis U.S. LLC 2018.
- 30. Prescribing Information of FARXIGA® (Dapagliflozin) tablets, for oral use. Wilmington, DE: AstraZeneca Pharmaceuticals LP 2020.
- 31. Prescribing information of GLUCOPHAGE® (Metformin Hydrochloride) tablets, for oral use GLUCOPHAGE® XR (Metformin Hydrochloride) extended‐release tablets, for oral use. Princeton, NJ: Bristol‐Myers Squibb Company 2018.
Associated Data
This section collects any data citations, data availability statements, or supplementary materials included in this article.
Supplementary Materials
Table S1. Supporting information.
Data Availability Statement
The datasets generated during and/or analysed during the current study are available from the corresponding author on reasonable request.