

Abstract
Despite significant advancements in building technologies, a critical gap exists in understanding how Solar Heat Gain and the Cooling Effect of Ventilation (CEV) interact in high-rise residential buildings. These two factors, which are crucial for achieving thermal comfort, operate in opposing directions: Solar Heat Gain leads to heat retention and an increase in indoor temperature, while CEV promotes cooling and reduces indoor temperature. This contradiction creates a complex thermal dynamic that is not well-understood, particularly in the context of high-rise bedrooms with varying window configurations. This study addresses this gap by investigating the seasonal interplay between Window Opening Area (WOA), Solar Heat Gain, and CEV, explicitly focusing on their seasonal variability and the impact of different glazing configurations (double- and triple-glazed windows). This research is conducted in Dongguan, China, and employs field measurements from seven high-rise bedrooms in winter and summer. The study uses advanced instruments such as pyranometers and anemometers to capture precise data on solar radiation, indoor temperature, and airflow, enabling a detailed analysis of the thermal effects of WOA and glazing configurations. The results reveal distinct seasonal behaviours of Solar Heat Gain and CEV. Solar Heat Gain dominates in winter, with heat retention critical for indoor comfort. Smaller WOAs enhance net heat gain, especially in triple-glazed configurations, where Solar Heat Gain values for a 0.32 m2 WOA reached 281–387 W, yielding a positive Net Thermal Effect of up to + 204 W. Conversely, larger WOAs during winter facilitated minimal cooling through ventilation, reducing Net thermal effect and compromising warmth. In summer, the emphasis shifts to ventilation cooling, with CEV becoming the primary driver of thermal comfort. For a fully open WOA (1.3 m2), double-glazed rooms demonstrated significant cooling, with CEV values reaching 1327 W, resulting in negative Net thermal effect values of − 41 to − 60 W. Triple glazing, while reducing Solar Heat Gain to 1001 W offered less effective natural cooling, with CEV peaking at 1179 W. Regression analysis underscores the strong positive correlation between WOA, Solar Heat Gain, and CEV, with double-glazed systems exhibiting higher sensitivity to WOA changes. The Net thermal effect analysis highlights the necessity of adjusting WOAs seasonally—smaller openings in winter maximise heat retention, while larger openings in summer optimise ventilation cooling. This study bridges critical knowledge gaps in thermal comfort optimisation for high-rise residential buildings, emphasising the dynamic balance required between glazing types and seasonal WOA adjustments. The findings provide actionable insights for architects and engineers, supporting adaptive design strategies that balance solar heat gain and ventilation cooling, aligning with sustainability goals and energy-efficient urban living.
Keywords: Thermal performance, Window opening area (WOA), Solar heat gain, Cooling effect of ventilation (CEV), Double glazing, Triple glazing, Net thermal effect, Seasonal thermal dynamics
Subject terms: Engineering, Civil engineering, Environmental sciences, Environmental impact
Introduction
The concept of thermal comfort in high-rise residential environments is increasingly critical in addressing the challenges of modern urbanization1–3. With the proliferation of high-density living spaces4,5, particularly in rapidly urbanising regions such as South China, ensuring adequate thermal performance in buildings has emerged as a pivotal concern6. Urbanization in subtropical regions has significantly accelerated over the past few decades, leading to rapid increases in high-rise residential developments1,3. This trend has brought thermal comfort to the forefront of architectural and engineering challenges7–9. Thermal comfort, as defined by Standard 55, refers to “the condition of mind that expresses satisfaction with the thermal environment10–12.” It is essential in ensuring the well-being and productivity of occupants13,14, particularly in high-density living spaces, where the interplay of heat gain, ventilation, and energy efficiency becomes increasingly complex15.
Dongguan, a city in South China characterized by its hot and humid subtropical climate16,17, serves as an ideal setting to examine these challenges. The region experiences prolonged periods of high temperatures and intense solar radiation, which exacerbate heat gain in buildings18. The built environment in Dongguan, much like other rapidly urbanizing cities, has seen a proliferation of high-rise residential buildings1,6. In these buildings, fenestration systems—specifically windows—play a pivotal role in determining the thermal performance of indoor spaces13,19. Window configurations, including glazing types and opening areas, significantly influence both Solar Heat Gain6,20 and the cooling effect of ventilation (CEV)13,21, critical parameters for maintaining thermal comfort in subtropical climates.
The importance of window design in high-rise residential buildings cannot be overstated7,20. Glazing systems are the primary interface between indoor and outdoor environments, mediating solar radiation, heat transfer, and natural ventilation22–24. Recent advancements in glazing technologies, such as double and triple glazing7,25, have shown promise in enhancing thermal insulation and reducing energy consumption19,25. Double glazing, commonly used in subtropical regions, provides moderate insulation while allowing sufficient natural light23. Although more commonly utilized in colder climates, triple glazing has garnered attention for its superior insulation properties15. However, the application of triple glazing in subtropical climates remains controversial due to concerns about cost, the risk of indoor overheating, and reduced daylight transmittance15,26.
Previous studies have extensively explored the thermal performance of glazing systems under controlled conditions27,28. The ability of double and triple glazing to reduce U-values, which represent the rate of heat transfer through a material22,25. Lower U-values indicate better insulation, leading to reduced energy loads for cooling and heating8. Studies have also highlighted the significance of the solar heat gain coefficient (SHGC), a measure of the fraction of solar radiation admitted through a window21,25. While these parameters are well-understood, their dynamic interaction with window opening area (WOA) in real-world scenarios, particularly in subtropical high-rise buildings, has not been adequately addressed.
Despite significant advancements in building technologies and increasing attention to sustainable building design, key gaps remain in understanding the complex thermal dynamics within high-rise residential buildings, particularly regarding the interplay between Solar Heat Gain6 and CEV29. These factors are essential for achieving thermal comfort and function in opposing directions, with solar radiation contributing to heat retention and elevated indoor temperatures20, while CEV facilitates cooling and temperature reduction21. The interaction between these forces is not sufficiently explored, especially in high-rise bedroom environments, where window configurations and glazing types (such as double- and triple-glazed windows) introduce additional complexities. Most existing studies have not adequately accounted for how varying WOA influences this dynamic across different seasons, limiting our ability to optimize thermal comfort and energy efficiency. Furthermore, the seasonal variability in Solar Heat Gain and CEV, and their dependence on both glazing configurations and WOA, is under-researched, particularly when it comes to understanding the trade-off between achieving warmth in colder months and cooling in the summer. While seasonal studies provide partial insights, few investigations have quantitatively assessed how these parameters interact across a full seasonal spectrum, especially in regions with diverse climatic conditions. This gap in the literature leaves a significant challenge for designing effective window systems and HVAC strategies tailored to the thermal comfort needs of high-rise residents in various climates. This study aims to fill this void by exploring the seasonal interaction between WOA, Solar Heat Gain, and CEV, emphasizing the need for a nuanced approach to glazing configurations and ventilation strategies that can simultaneously address energy demands and occupant comfort.
Moreover, the interaction between glazing type, WOA, and environmental factors is further complicated by user behaviour. Occupants’ preferences for natural ventilation, shading, and air conditioning significantly influence the overall energy performance and thermal comfort of buildings30,31. While adaptive thermal comfort models have been developed to account for these factors32–34, their application in high-rise residential settings remains limited. Most existing studies focus on office buildings or low-rise dwellings32,35, leaving a significant research gap in understanding the unique challenges posed by high-rise residential environments.
The Yunyuetai residential project in Dongguan was selected as the case study site for this investigation. The project comprises multiple high-rise buildings equipped with double- and triple-glazed windows, providing an ideal setting for comparative analysis. Field measurements were conducted during distinct seasonal periods to capture the variability in thermal performance across different climatic conditions. Key parameters measured included solar radiation, indoor and outdoor temperatures, relative humidity, and ventilation rates. Advanced monitoring equipment, such as pyranometers and temperature-humidity loggers, was deployed to ensure the accuracy and reliability of data collection.
Based on the gaps identified previously and the project selected, here are three research questions that the study aims to address:
How do different WOA influence the seasonal interaction between Solar Heat Gain and CEV in high-rise residential bedrooms?
How can the seasonal variability of Solar Heat Gain and CEV affect the Net Thermal Effect in high-rise bedrooms, and how can this variability be managed to optimize thermal comfort across winter and summer?
How can WOA and glazing configuration be optimized to balance energy efficiency and thermal comfort in high-rise residential buildings?
The findings of this study are expected to contribute to the growing body of knowledge on adaptive thermal comfort in high-rise residential buildings. Specifically, the research attempts to provide actionable insights into optimising window design for subtropical climates, balancing the dual objectives of energy efficiency and occupant comfort. By addressing the interplay of glazing type, WOA, and seasonal variability, this study seeks to inform the development of more sustainable and resilient building practices in rapidly urbanizing regions.
This investigation represents a critical step toward bridging the knowledge gap in fenestration performance for subtropical high-rise residential buildings. By combining empirical field data with advanced analytical techniques, the study advances the understanding of thermal comfort dynamics and offers practical recommendations for improving building design in similar climatic contexts.
Method
Statement: This study confirms that all methods were carried out per relevant guidelines and regulations. Beibu Gulf University’s institutional and licensing committee approved all experimental protocols. Informed consent was obtained from all subjects and legal guardian(s).
This study’s methodological framework involved meticulously controlled field measurements across seven bedrooms in the Yunyuetai project. These rooms, equipped with varying glazing configurations, provided a robust basis for analysing WOA’s influence on Solar Heat Gain and CEV across winter and summer conditions. By employing advanced instruments such as pyranometers and temperature sensors, the research ensured high accuracy in capturing the thermal interactions associated with different WOA settings. Regression analysis and heatmaps were utilised to elucidate the relationships between variables, offering quantitative insights into their implications for thermal performance.
Location and climatic conditions
This case study is in Humen Town, Dongguan, China (Fig. 1). The base is located in the subtropical region of South China, experiencing a hot and humid climate throughout the year. The average temperature ranges from 14.8 to 29 °C, with daily highs reaching 35 °C during summer16. The relative humidity is generally high, averaging between 71 and 82% from January to April. The city receives ample solar radiation, contributing to significant heat gain in urban areas36. During the summer, high temperatures and humidity create uncomfortable living conditions, necessitating the examination of building materials and designs to enhance thermal comfort, mainly focusing on glazing systems that impact indoor thermal environments22,32,37.
Fig. 1.

Map of the project site. {Software information and data source: Map generated using ArcGIS version 10.8 (https://www.esri.com/en-us/arcgis/products/arcgis-desktop). The map was clipped from a publicly available China administrative boundary dataset.
(Source: iGISMap, https://www.igismap.com/download-china-administrative-boundary-gis-data-for-national-province-and-more/).}
Buildings and respondents
The Yunyuetai residential project was selected for this study, specifically referring to the two buildings highlighted within the red rectangular frame in Fig. 2. It is situated in Humen town, Dongguan, and this residential complex consists of two distinct blocks: the northern and southern plots. The selection of residential high-rise buildings equipped with two or three layers of glass meets China’s national definition of high-rise structures, with heights ranging from 27 to 100 m and 7 to 30 storeys. The buildings had been fully constructed and operational for over one year, ensuring stable thermal performance and eliminating the influence of recent construction activities. Additionally, due to the complex’s proximity to the highway and the broader downturn in China’s real estate market36,38,39, 82% of units on this floor have remained unsold, making them ideal for occupancy-free monitoring.
Fig. 2.

The Yunyuetai residential project in Dongguan.
Although the use of triple glazing may seem unconventional for a region with hot and humid summers23,27, it is important to clarify the specific context of the study location, situated adjacent to the highly trafficked Guangzhou-Shenzhen Expressway, as shown on the left side of Fig. 2. This area experiences significant vehicular noise, particularly from heavy traffic. For example, noise levels measured in the bedroom on the 10th floor of a residential building facing the highway average around 75–80 dB during peak traffic hours, which is well above the recommended levels for a comfortable living environment (approximately 35–40 dB for bedrooms).
In response, the developer installed triple-glazed windows on the bedroom walls facing the highway to provide enhanced sound insulation and improve the marketability of the residential units. Compared to single-glazed or double-glazed windows, triple-glazing significantly reduces external noise transmission40. Noise reduction measurements show that triple-glazed windows can reduce noise by approximately 40–45 dB, whereas double-glazing typically reduces it by about 30–35 dB41,42. This difference is significant in high-frequency sounds, such as traffic noise, which triple-glazing blocks more effectively.
Therefore, the decision to incorporate triple glazing was driven by the need for thermal insulation and the desire to mitigate the disruptive effects of noise pollution. This addition helps create a more peaceful living environment for residents, making the units more attractive to potential buyers, especially those sensitive to noise.
This strategic use of multilayer glazing aligns with the developer’s aim to offer high-quality residential units in an otherwise challenging acoustic environment. It also plays a crucial role in enhancing the competitiveness of properties near the expressway by providing residents with a quieter, more comfortable living experience.
The selected apartments for testing on the north and south sides are consistently sized at 95 square meters and have the same master bedroom plan. Figures 3, 4 and 5 illustrate the site plan, where the red-highlighted area represents a specific building, and the right-side diagram shows the corresponding floor plan. The images were created using AutoCAD version 2024. Each plan presents the distribution of double- and triple-glazed windows in 1# Block, 2# Block, and 3# Block, respectively.
Fig. 3.

Distribution of double- and triple-glazed windows rooms in 1# Block. {Technical notes: Image generated using AutoCAD version 2024 (https://www.autodesk.com/products/autocad/overview). Additional symbols and legends were added to the images.}
Fig. 4.

Distribution of double- and triple-glazed windows rooms in 2# Block. {Technical notes: Image generated using AutoCAD version 2024 (https://www.autodesk.com/products/autocad/overview). Additional symbols and legends were added to the images.}
Fig. 5.

Distribution of double- and triple-glazed windows rooms in 3# Block. {Technical notes: Image generated using AutoCAD version 2024 (https://www.autodesk.com/products/autocad/overview). Additional symbols and legends were added to the images.}
The rooms chosen for comparative analysis are two units equivalent in area and floor level, except for the layers of glazing of each symmetrical household (Fig. 6), ensuring uniformity in the testing conditions. To conduct scientifically rigorous and convincing measurements and evaluations of indoor thermal comfort, the middle floors of each building were selected for testing to minimise the potential extremes often associated with the top and bottom floors. For a northern residential building with 19 floors, the 10th floor was chosen; for a 17-story building, the 8th floor was selected. Table 1 illustrates the coding of seven selected master bedrooms.
Fig. 6.

Symmetrical household plan for fieldwork measurement. {Technical notes: Image generated using AutoCAD version 2024 (https://www.autodesk.com/products/autocad/overview). Additional symbols and legends were added to the images.}
Table 1.
Room coding of target bedrooms.
| No. | Room coding | Location | Layers of glazing | Number | Storey |
|---|---|---|---|---|---|
| 1 & 2 | 1# 2layers room | 1# Block | 2 | 2 | 10th |
| 3 | 1# 3layers room | 1# Block | 3 | 1 | 10th |
| 4 | 2# 2layers room | 2# Block | 2 | 1 | 10th |
| 5 | 2# 3layers room | 2# Block | 3 | 1 | 10th |
| 6 | 3# 2layers room | 3# Block | 2 | 1 | 8th |
| 7 | 3# 3layers room | 3# Block | 3 | 1 | 8th |
Before commencing the fieldwork, an inventory study was conducted to document the design and characteristics of fourteen bedrooms in three blocks of selected residential projects. Table 2 outlines the other basic scenarios of practical environments of the Yunxiwan Project regarding their glazing types and attributes, respectively.
Table 2.
Comparison of single, double, and triple glazing performance in the project.
| Attribute | Single glazing | Double glazing | Triple glazing |
|---|---|---|---|
| Installation position | Common areas with lower insulation needs (such as hallways, stairwells, and storage rooms) | Living rooms, kitchens, balconies, and non-noise-sensitive areas | Bedrooms facing directly onto highways and high-noise environments |
| Glass thickness※ | 6 mm | 5 mm + 5 mm | 5 mm + 5 mm + 5 mm |
| Air/gas layer thickness※ | N/A | 6 mm (filled with argon) | 6 mm + 6 mm (filled with argon) |
| Glass U-value※ | 5.5 W/m2 K | 1.2 W/m2 K | 0.8 W/m2 K |
| Sound insulation※ | 20 dB | 32 dB | 38 dB |
| Visible light transmittance (VT%)※ | 80% | 65% | 55% |
| Cost (transfer to RM)※ | RM 195 per square meter | RM 585 per square meter | RM 1280 per square meter |
| Weight※ | 15 kg per square meter | 25 kg per square meter | 37.5 kg per square meter |
| Durability※ | 30 years | 20 years | 30 years |
| Maintenance Requirements※ | Once every 5 years | Once every 5 years | Once every 10 years |
| Additional Features | Basic glazing, no special coatings or fillings | Low-emissivity coatings, tinting options | Low-emissivity coatings, inert gas fills, enhanced sound insulation |
※Data provided by the manufacturer.
In addition to the glazing property, Table 3 compares the performance parameters of different window configurations, highlighting their thermal, optical, and functional characteristics.
Table 3.
Comparison of double-glazed and triple-glazed window performance and specifications in the project.
| Parameter | Double-glazed window | Triple-glazed window |
|---|---|---|
| Window U-value (W/m2 K)※ | 4.2 | 3.3 |
| SHGC※ | 0.67 | 0.55 |
| Visible light transmittance (Tvis) ※ | 0.75 | 0.71 |
| Layer configuration※ | 5-6-5 | 5-6-5-6-5 |
| Gas fill type※ | Argon | Argon |
| Opening mechanism※ | Sliding | Sliding |
| Shading device type | None | None |
※Data provided by the manufacturer.
Impact of WOA on solar heat gain and CEV
This session is divided into four key sections: Temperature measurement, analysis of the impact of WOA on Solar Heat Gain, evaluation of WOA’s effect on CEV, and a combined analysis of Solar Heat Gain and CEV to determine their overall influence on indoor thermal comfort.
Temperature measurement method
Data collection was conducted during two distinct seasons in 2024, representing the winter and summer periods. The Weather by Month was provided by https://weatherandclimate.com/china/guangdong/dongguan (“Appendix” section). The winter data collection occurred between January and February 2024, while the summer data was collected between July and August 2024. The first phase of data collection was conducted from 1st January to 28th February, and the second phase from 1st July to 31st August. Measurements were taken daily for 24 h. All instruments were positioned at a height of 1.1 m above the floor level, following ISO 7726:20217,18. The air temperature was recorded and uploaded consistently through the Technology Cloud Platform (built by instrument)43–45 for 120 days. This approach ensured a consistent data flow from the seven bedrooms over the 120-day collection period during the winter and summer seasons.
The DECEMTHMH 1 tester was chosen for indoor temperature collection due to its high sensitivity (± 0.1 °C accuracy) and fast response time (≤ 1s) in temperature measurements. Its advanced sensor technology ensures precise (resolution of 0.01 °C) and real-time temperature detection, making it ideal for monitoring subtle thermal variations within indoor environments. The device provides a broad operational scope suitable for various climatic conditions with a temperature measurement range of − 40 to 125 °C. These characteristics ensure reliable and consistent temperature data, making it a valuable instrument for this study.
Measuring the impact of WOA on solar heat gain
To measure the impact of WOA on solar heat gain, the process involves monitoring how much heat enters a room through windows due to solar radiation24,46,47 and tracking the resulting changes in indoor temperature48–50. The size of the window opening affects the amount of sunlight entering the room and how it interacts with indoor surfaces29,51, ultimately influencing the thermal conditions of the space45.
For this assessment, pyranometers and temperature sensors are the selected instruments. A pyranometer measures the solar radiation entering bedrooms47,52. TBQ-2-B pyranometers comply with World Meteorological Organization (WMO) specifications, are suitable for various harsh environments and are widely used in environmental monitoring, so it was selected for the current research. Use this device to quantify how much solar energy is transmitted through the window under different opening configurations (fully closed, 25%, 50%, 75% open, and closed), as Fig. 7 depicts the sliding mechanism employed in the double-glazed and triple-glazed window systems.
Fig. 7.
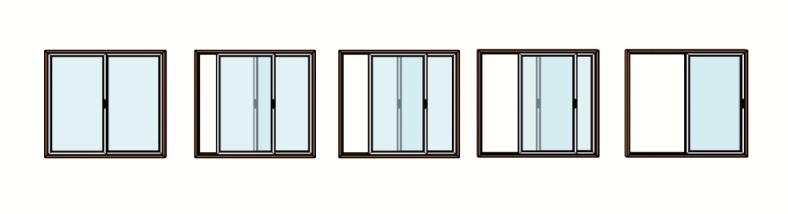
Sliding mechanism with different opening configurations in the double-glazed and triple-glazed window systems: fully closed, 25% open, 50% open, 75% open, and fully open.
To ensure accurate solar radiation measurements, two pyranometers are used: one positioned outside the building at a distance of 0.5 m from the window to capture direct solar radiation (Soutside). Another was placed inside the room, 0.2 m from the window, to validate how much solar energy enters the space, including effects like re-radiation from the glass. This setup captures the distinct effects of solar radiation through the window’s glass and open portions, enabling precise calculation of the total solar heat gain into the room. For each configuration, the instruments record data continuously for 30 min, ensuring the system reaches thermal stability before readings are considered valid. Measurements are taken at 5-min intervals within this 30-min period to capture variations and ensure an accurate average is calculated for each configuration.
The experiment begins by taking measurements with the sliding window fully closed to establish baseline conditions—this shows how much solar radiation enters the room through the glass alone. Next, sliding windows are opened to 25%, 50%, and 75% gradually to assess the effect of partial openness on solar heat gain. Finally, the window is fully opened, and solar radiation is measured again to observe how a larger WOA affects the amount of sunlight entering the room. A 10-min waiting period is maintained between each configuration change to allow the thermal environment to stabilise, ensuring consistent and comparable readings. Typically, larger WOAs allow more direct sunlight, producing higher solar heat gain, particularly during peak sun hours6,25. However, a partially open window may still let in indirect or diffuse sunlight, contributing to heat gain even without full exposure to direct sunlight28.
Technically, calculating solar heat gain through a window involves contributions from the solar radiation transmitted through the glass and the radiation entering through the open sections of the window53,54. Solar Heat Gain through windows systems is calculated following the standard procedure outlined in ASHRAE-201310,55,56 and ANSI/NFRC 200-201757. The total Solar Heat Gain (Qtotal) is described by the following Eq. (1):
 |
1 |
where Qtotal is the total solar heat gain (Watts, W). SHGC is the Solar Heat Gain Coefficient, representing the proportion of solar radiation transmitted through the window into the indoor space (range: 0 to 1). A is the window area (unit: square meters, m2). I refer to the incident solar radiation intensity (unit: Watts per square meter, W/m2).
This formula quantifies the total solar heat gain based on the transmissivity and window area that allows sunlight to enter the room. Once the data has been collected, the relationship between WOA and Solar Heat Gain can be analysed by linear regression19,24. By comparing solar radiation data for fully closed, partially open, and fully open windows, it becomes clear how increasing the WOA affects the amount of sunlight and heat entering bedrooms6. The temperature data is then correlated with the pyranometer readings to determine how solar heat gain influences the room’s temperature under different window configurations.
Measuring the impact of WOA on CEV
Assessing the cooling effects of ventilation and the impact of various WOAs on airflow and temperature reduction requires quantifying how different WOAs facilitate the entry of fresh air and the expulsion of hot air, leading to a cooler space13,24. Existing research shows that larger WOA improves airflow, enhancing the cooling effect29. However, detailed measurements and analysis of this relationship, especially in subtropical and tropical regions, remain necessary.
For this session, the key instruments to assess ventilation’s cooling effects include anemometers and temperature sensors. Anemometers are deployed to measure air velocity and the amount of airflow entering and exiting the room through windows58,59. TA641A anemometers, which measure wind speed and direction accurately, were confirmed for monitoring current thermal parameters. Temperature sensors track changes in room temperature over time, showing how effectively the ventilation cools the space21.
Anemometers were placed directly at the opening window’s centre, positioned at the mid-height of the window, and approximately 20 cm away from the window to avoid boundary layer effects while still capturing representative airflow. The air velocity was measured at regular intervals, every 10 min, for at least 30 min after adjusting the window opening to capture airflow dynamics over time.
As for window opening configurations, start by measuring the indoor environment with the window fully closed to establish baseline conditions for temperature. Then, open the window gradually and take readings with the same instruments to observe changes in air velocity and temperature. Finally, fully open the window and repeat the measurements. Temperature sensors will capture how fast the room cools as air flows through the window. Once the data is collected, it is essential to analyse the correlation between air velocity and the decrease in temperature.
To calculate the CEV based on different WOA configurations, this study used the formula Eq. (2), which considers airflow, air mass, and temperature change. This cooling effect of ventilation was calculated using the mass flow rate of air and temperature difference, following the approach described by the Handbook of energy systems in green buildings60.
 |
2 |
where CEV represents the cooling capacity resulting from natural ventilation, m is the mass flow rate of air (kg/s), which depends on the airflow through the window. Cp is the specific heat capacity of air (approximately 1005 J/kg K). ΔT is the temperature difference (°C) between the air entering and inside the room.
Specifically, following ASHRAE Handbook - Fundamentals55,56 and CIBSE Guide A: Environmental Design61–63, breaking down the above Eq. (2) (CEV = m⋅cp⋅ΔT), (1) Mass flow rate (m) used following Eq. (3):
 |
3 |
where ρ is the air density (about 1.225 kg/m3), v is the air velocity (measured by an anemometer in m/s). Awindow is the window opening area (in m2) based on the WOA configuration.
(2) ΔT in Eq. (2) refers to the temperature change inside the room, measured by the temperature sensor as the airflow cools the space. It is calculated as Eq. (4), the same source as Eq. (3):
 |
4 |
where Troom is the temperature inside the room (after cooling, °C). Toutside is the outdoor air temperature (entering through the window, °C).
Combined analysis: effect of WOA on both solar heat gain and CEV
A combined analysis is required to fully understand the interaction between solar Heat Gain and CEV as influenced by different WOA29. This involves simultaneously measuring both factors to determine how they balance each other and affect the overall indoor thermal environment23,64. The goal is to assess how WOA affects the amount of solar heat entering the room and the room’s ability to cool through ventilation, ultimately quantifying the net thermal effect on indoor comfort65.
For each WOA configuration, solar radiation and air velocity data were recorded alongside temperature readings to track how the room responds to changes in sunlight and ventilation. Fully closed windows provide a baseline for solar heat gain, allowing minimal or no ventilation57. Partially open windows introduce some ventilation, while fully open windows maximise airflow, allowing a direct comparison of how these variables influence both heat gain and cooling29.
After the data is collected, a key part of the analysis involves calculating the Net Thermal Effect on the room. This requires comparing the Solar Heat Gain (as measured by the pyranometer and reflected in the temperature rise) against CEV (as indicated by the temperature drop and air velocity measured by the anemometer). The net result will show whether the room experiences a net heat gain or a net cooling effect for each window configuration53,66. Larger WOA may introduce more solar radiation into the room, which could increase heat gain, but they also allow for more excellent ventilation, which can remove some of the accumulated heat29,67. The balance between these two factors will vary depending on how much sunlight enters, the outdoor air temperature, and the effectiveness of air circulation68,69. To calculate the net thermal effect, Eq. (5) represents the Net Thermal Effect as the difference between Solar Heat Gain and CEV. This study derives the formula for calculating the Net Thermal Effect based on standard methods in building energy efficiency analysis24,45,67. By determining the difference between Solar Heat Gain and CEV, the formula helps assess buildings’ thermal load and energy efficiency under various external environmental conditions.
 |
5 |
where Solar Heat Input is the total solar heat gain (measured in watts or as a temperature rise in degrees Celsius), representing the amount of heat introduced into the room through solar radiation. CEV is the cooling effect of ventilation (measured similarly in watts or as a temperature drop in degrees Celsius), representing the reduction in room temperature due to airflow and natural ventilation.
The interpretation of results regarding the Net Thermal Effect reveals two distinct outcomes based on the balance between solar heat gain and ventilation cooling. A positive Net Thermal Effect indicates a net heat gain where the contribution of solar heat gain surpasses the cooling effect of ventilation, resulting in a warmer indoor environment53. Conversely, a negative Net Thermal Effect signifies a net cooling effect, with ventilation cooling exceeding solar heat gain, leading to a cooler indoor space8. This formula (Eq. 5) facilitates a clear comparison of various WOA configurations and their respective impacts on indoor thermal comfort by quantifying the interplay between solar heat entry and ventilation cooling.
Time of day is another critical factor influencing the balance between solar heat gain and CEV13,29. Solar radiation is typically most substantial during midday when the sun is at its highest, increasing heat gain70. Ventilation, however, might be more effective during the more fabulous morning or evening hours when outdoor temperatures are lower71. Therefore, it is important to conduct measurements at different times throughout the day to observe how the balance between solar heat gain and ventilation cooling shifts depending on the sun’s angle and intensity6,53.
Data collected at various times will provide insights into the diurnal variation in solar heat gain and ventilation efficiency. In the morning, lower solar radiation levels may result in minimal heat gain, and ventilation may be sufficient to maintain a cooler indoor environment70. By contrast, when solar radiation peaks in the afternoon, even a fully open window might not provide enough ventilation to offset the increase in heat entering bedrooms71. The evening presents a reversal, where lower solar intensity may reduce heat gain, allowing ventilation to play a more dominant role in cooling the space49.
Once the measurements have been recorded for each WOA configuration, the data analysis will identify trends showing how increasing the window opening area affects heat gain and cooling. Each configuration’s net heat gain or loss was plotted over time, showing how effectively larger WOA mitigate solar heat gain through ventilation. Additionally, by comparing the cooling rate (temperature drop) at different air velocities, it is possible to quantify how much cooling ventilation provides concerning the solar heat entering the room.
This combined analysis comprehensively explains how window opening size affects solar heat gain and ventilation cooling. By examining the simultaneous influence of these two factors, it becomes possible to optimise window configurations to achieve a balance that enhances indoor thermal comfort, especially in naturally ventilated spaces where mechanical cooling is not used. Additionally, all equipment and instruments applied in this study are listed in Table 4. The experimental setup photo is shown in Fig. 8, and the experimental flowchart for the effect of WOA on Solar Heat Gain and CEV is presented in Fig. 9.
Table 4.
Equipment and measured parameters of this study.
| Instrument | Test content | Valid range | Accuracy | Set location |
|---|---|---|---|---|
| DECEMTHMH 1 temperature sensor | Air temperature (Ta) | − 25 to 60 °C | ± 0.5 °C |
(1) Placed at about 1.1 m above the floor. This height approximates the breathing zone of a seated or standing person. (2) It is located towards the centre of the room to capture a more generalised reading of its conditions. (3) Away from direct sunlight |
| TBQ-2-B pyranometers | Solar radiation (Soutside and Sinside) | 0 to 2000 W/m2 | ± 2% | (1) Indoor pyranometer placed outside 0.2 m from the window to avoid shading effects. (2) An outdoor pyranometer is placed 1.5 m from the window to capture the effects of indoor solar radiation. |
| TA641A anemometer | Air velocity (v) | 0.1 to 30 m/s | ± 0.1 m/s or 1% of reading | Positioned at the pane’s mid-width to capture airflow dynamics while avoiding boundary layer effects. |
Fig. 8.

The instrumentation used for data collection, includes temperature sensors, pyranometers, and anemometers.
Fig. 9.
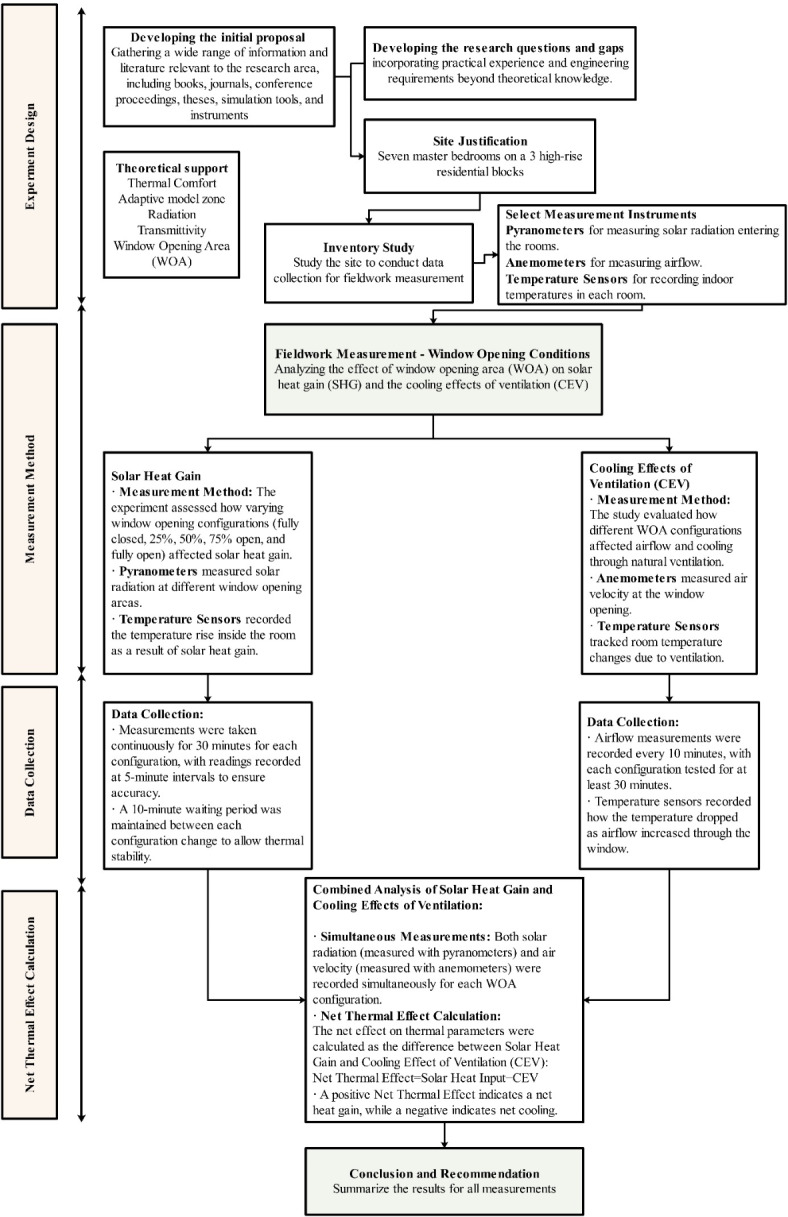
Experimental design and data collection process.
Results
WOA, Solar Heat Gain, and CEV in each master bedroom were recorded as per instrument measurement. The scatter plots and heatmaps provide the relationships between Solar Heat Gain, CEV, and WOA across different seasons and glazing types. Figure 10 presents the regression analysis of Solar Heat Gain and CEV concerning WOA for January and February, with the upper part showing the relationship for Solar Heat Gain and the lower part illustrating the CEV. Figure 11 complements this by providing a heatmap that compares Solar Heat Gain (upper) and CEV (down) with the WOA across different glazing types for the same two months. Moving to the warmer months, Fig. 12 shows a similar regression analysis for Solar Heat Gain and CEV in July and August, again distinguishing the upper and lower sections for Solar Heat Gain and CEV. Finally, Fig. 13 presents a heatmap comparing Solar Heat Gain (upper) and CEV (down) with the WOA for various glazing types in July and August. These figures provide insights into how different window configurations and opening areas impact thermal comfort and ventilation in different seasons.
Fig. 10.

Regression of (i) Solar Heat Gain (W) versus WOA (upper) and (ii) CEV (W) versus WOA (down) for January and February.
Fig. 11.

Heatmap comparing (i) Solar Heat Gain (upper) and (ii) CEV (down) against WOA for different glazing types for January and February.
Fig. 12.

Regression of (i) Solar Heat Gain (W) versus WOA (upper) and (ii) CEV (W) versus WOA (down) in July and August.
Fig. 13.

Heatmap comparing (i) Solar Heat Gain (upper) and (ii) CEV (down) against WOA for different glazing types for July and August.
The scatter plots show a positive linear relationship between WOA, Solar Heat Gain, and CEV for each glazing type. As WOA increases, Solar Heat Gain and CEV increase significantly, but the increase rates differ between double and triple glazing. In all cases, double glazing has steeper slopes than triple glazing, indicating a higher rate of solar heat gain and a larger cooling effect as the window opening area increases.
For winter (January and February), the Solar Heat Gain and CEV regression lines for double glazing are consistently higher than those for triple glazing, showing that double glazing allows more solar radiation and airflow, increasing the heat gain and cooling effect. The heatmaps reinforce this, depicting higher values of Solar Heat Gain and CEV as the WOA expands, with double-glazing rooms consistently registering higher values than triple-glazing rooms.
In the summer (July and August), the scatter plots and regression lines reveal a similar trend: double glazing shows higher Solar Heat Gain and CEV values than triple glazing at all WOA levels. This suggests that double glazing permits more sunlight and heat to enter during the warmer months, requiring a more significant cooling effect to maintain indoor comfort. The heatmaps for summer emphasise this, with higher intensity colours in double-glazing configurations as the WOA increases, demonstrating the higher Solar Heat Gain and cooling loads associated with these window types.
The effects of WOA on solar heat gain for double- and triple-layer glazing types
The regression models showed a significant and strong positive linear relationship between the WOA and both Solar Heat Gain and CEV, as presented in Table 5.
Table 5.
Regression analysis results for solar heat gain and CEV based on WOA for different glazing types in January and February.
| Location and glazing types | Variable | Regression coefficient (β1) | P-value | R-squared |
|---|---|---|---|---|
| 1# Double glazing room | Solar heat gain | 451.76 | 0.0003 | 0.995 |
| CEV | 868.12 | 0.0002 | 0.998 | |
| 1# Triple glazing room | Solar heat gain | 348.91 | 0.0004 | 0.994 |
| CEV | 665.63 | 0.0002 | 0.997 | |
| 2# Double glazing room | Solar heat gain | 476.54 | 0.0001 | 0.996 |
| CEV | 908.92 | 0.0001 | 0.998 | |
| 2# Triple glazing room | Solar heat gain | 375.18 | 0.0003 | 0.995 |
| CEV | 707.92 | 0.0002 | 0.997 | |
| 3# Double glazing room | Solar heat gain | 496.54 | 0.0001 | 0.997 |
| CEV | 946.61 | 0.0001 | 0.999 | |
| 3# Triple glazing room | Solar heat gain | 386.47 | 0.0002 | 0.996 |
| CEV | 736.28 | 0.0002 | 0.998 |
For Solar Heat Gain, the positive regression coefficients in all rooms showed that higher WOA values led to more solar heat gain, regardless of the glazing type. Similarly, the relationship between WOA and CEV showed that greater WOA resulted in higher cooling energy requirements.
The very low p values and high R-squared values reinforced that WOA significantly influenced both Solar Heat Gain and CEV, with triple glazing performing better than double glazing in mitigating these effects.
In addition to January and February, the regression analysis for July and August showed a significant positive relationship between WOA and Solar Heat Gain and CEV across double and triple-glazing types, as elaborated in Table 6. Double glazing consistently exhibited higher Solar Heat Gain and CEV coefficients than triple glazing, indicating that larger WOAs lead to more solar heat gain and increased cooling energy requirements in double-glazed rooms. Room 3# showed the highest WOA sensitivity for Solar Heat Gain (726.85) and CEV (972.47) in double glazing. In contrast, with lower Solar Heat Gain and CEV values, triple glazing demonstrated better performance in reducing both solar heat gain and cooling energy demands, making it a more practical option for minimising these effects.
Table 6.
Regression analysis results for solar heat gain and CEV based on WOA for different glazing types for July and August.
| Location and glazing types | Variable | Regression coefficient (β1) | P-value | R-squared |
|---|---|---|---|---|
| 1# Double glazing room | Solar heat gain | 634.48 | 0.0004 | 0.995 |
| CEV | 876.27 | 0.0003 | 0.997 | |
| 1# Triple glazing room | Solar heat gain | 518.46 | 0.0005 | 0.993 |
| CEV | 712.45 | 0.0003 | 0.996 | |
| 2# Double glazing room | Solar heat gain | 699.08 | 0.0002 | 0.996 |
| CEV | 933.84 | 0.0002 | 0.997 | |
| 2# Triple glazing room | Solar heat gain | 564.08 | 0.0004 | 0.995 |
| CEV | 752.97 | 0.0003 | 0.996 | |
| 3# Double glazing room | Solar heat gain | 726.85 | 0.0001 | 0.998 |
| CEV | 972.47 | 0.0001 | 0.998 | |
| 3# Triple glazing room | Solar heat gain | 576.92 | 0.0003 | 0.996 |
| CEV | 791.88 | 0.0002 | 0.997 |
Differences in solar heat gain and CEV concerning WOA for double- and triple-layer glazing
The relationship between WOA and Solar Heat Gain, as well as WOA and CEV, was investigated through statistical regression models, with the results showing a clear, statistically significant relationship in all glazing configurations. For the double-glazing system, the p values associated with Solar Heat Gain ranged from 0.0001 to 0.0003, while for CEV, the p values were between 0.0001 and 0.0002. In the triple-glazing system, the p values for Solar Heat Gain ranged from 0.0002 to 0.0004; for CEV, they were between 0.0002 and 0.0003. All p values are well below the threshold of 0.05, confirming the strong statistical significance of the relationship between WOA, Solar Heat Gain, and CEV across both glazing systems.
For double-glazing, the increase in WOA leads to a substantial rise in Solar Heat Gain, as larger window areas allow more solar radiation to penetrate the interior. For instance, in the room coding 1# Double Glazing Room, with a WOA of 1.3 m2, Solar Heat Gain reached 781 W in January and February. As the WOA decreased to 0.32 m2, Solar Heat Gain dropped to 333 W. The regression analysis for this relationship yielded a β1 value of 451.76, indicating that for every additional square meter of window opening, Solar Heat Gain increased by approximately 451.76 W. This linear relationship was consistent across all locations and months, with Solar Heat Gain values for double-glazing reaching 1279 W for a 1.3 m2 WOA in the summer months of July and August, compared to 593 W for a WOA of 0.32 m2. The R-squared values for double-glazing systems concerning Solar Heat Gain consistently ranged from 0.995 to 0.998, reflecting the strength of the linear relationship between WOA and Solar Heat Gain.
Triple glazing, with its lower U-value indicating better thermal resistance, demonstrated a similar but less pronounced relationship between WOA and Solar Heat Gain. In room coding 1# Triple Glazing Room, Solar Heat Gain for a WOA of 1.3 m2 was 603 W in January and February, while for a WOA of 0.32 m2, Solar Heat Gain decreased to 281 W. The β1 value of 348.91 for Solar Heat Gain in a room coding 1# Triple Glazing Room shows that each additional square meter of window opening increased 348.91 W in Solar Heat Gain. This trend was consistent across months, with Solar Heat Gain values reaching 1001 W for a 1.3 m2 WOA in the summer and 463 W for a WOA of 0.32 m2. The lower β1 values for triple-glazing compared to double-glazing highlight the reduced impact of WOA on Solar Heat Gain due to the triple layer’s enhanced capacity to block solar radiation. The R-squared values for triple-glazing systems, ranging from 0.993 to 0.996, still indicate a strong linear relationship between WOA and Solar Heat Gain, but the rate of increase in Solar Heat Gain with larger WOA is dampened in the triple-glazing systems.
Regarding CEV, the relationship with WOA follows a trend opposite to that observed for Solar Heat Gain. As the WOA increases, the cooling effect due to ventilation improves significantly, as larger window openings allow more effective air exchange. For the double-glazed room in Location 1, the CEV reached 1103 W for a WOA of 1.3 m2 in January and February. As the WOA decreased to 0.32 m2, the CEV dropped to 291 W, with the regression analysis yielding a β1 value 868.12. This suggests that for every additional square meter of window opening, the cooling effect improved by 868.12 W. The same pattern was observed across all double-glazing configurations, with the highest CEV values occurring in the summer months, reaching 1327 W for a 1.3 m2 WOA, compared to 431 W for a 0.32 m2 WOA. The high R-squared values for CEV in double-glazing systems (ranging from 0.997 to 0.999) further underscore the strong correlation between WOA and ventilation effectiveness.
For triple-glazing systems, while the general trend of increasing CEV with larger WOA remained, the magnitude of the effect was slightly reduced compared to double-glazing. In Location 1, for example, CEV for a WOA of 1.3 m2 was 983 W in January and February, decreasing to 233 W for a WOA of 0.32 m2. The corresponding β1 value for CEV in triple-glazing was 665.63, indicating a more negligible improvement in the cooling effect than in double-glazing. However, in the summer months, CEV values for triple-glazing reached 1179 W for a WOA of 1.3 m2, compared to 329 W for a WOA of 0.32 m2. The R-squared values for CEV in triple-glazing systems ranged from 0.996 to 0.998, indicating that while the triple-glazing systems still show a strong linear relationship between WOA and CEV, the increase in CEV with larger window openings is slightly lower than in double-glazing systems due to the insulating properties of the triple layer, which also slightly hinders the natural exchange of air.
The comparison between Solar Heat Gain and CEV for both glazing types demonstrates the dual influence of WOA on thermal load and cooling efficiency29. Double-glazing systems exhibit a steeper rise in Solar Heat Gain with larger WOA, but they also benefit more from enhanced ventilation than triple-glazing. On the other hand, while triple-glazing reduces the overall Solar Heat Gain, it also somewhat limits the CEV, particularly at smaller WOA values. These findings are critical for optimising the balance between heat gain and natural cooling in building design, particularly in regions where solar radiation and ventilation significantly determine indoor comfort and energy efficiency.
In conclusion, the analysis of the differences in Solar Heat Gain and CEV concerning WOA for both double- and triple-glazing systems indicates that WOA plays a crucial role in heat gain and cooling effects. The statistical analysis demonstrates significant relationships for both Solar Heat Gain and CEV, with low p values and high R-squared values supporting the robustness of the findings. While more susceptible to heat gain, double-glazing systems offer superior ventilation performance compared to triple-glazing. Conversely, with their enhanced insulation, triple-glazing systems mitigate solar heat gain more effectively but provide slightly lower cooling efficiency through natural ventilation. These results underscore the importance of carefully considering WOA with glazing type to achieve optimal thermal performance and energy efficiency in buildings.
The relationship between WOA, solar heat gain, and CEV
The relationship between WOA, Solar Heat Gain, and the CEV is pivotal in managing a building’s thermal environment, particularly in different glazing configurations. Larger WOAs allow more solar radiation to enter through windows, thereby increasing Solar Heat Gain. However, WOA also plays a vital role in natural ventilation, directly influencing the efficiency of CEV, as more air can flow through larger openings, thereby enhancing cooling effects53,70.
For double-glazed systems, Solar Heat Gain tends to rise significantly with increasing WOA due to the higher transmissivity of double-layer glazing. In winter (January-February), a WOA of 1.3 m2 in a double-glazed room resulted in a Solar Heat Gain of 781 W, while reducing the WOA to 0.32 m2 brought Solar Heat Gain down to 333 W. The increase in Solar Heat Gain corresponds with the larger surface area exposed to direct sunlight, which magnifies the heat entering the room. This effect is especially pronounced in climates with high solar insolation, where windows with higher WOA can significantly increase indoor temperature if not appropriately managed. The regression analysis for double-glazing systems yielded a regression coefficient (β1) of 451.76, showing a strong linear correlation between WOA and Solar Heat Gain.
In contrast, triple-glazing systems—owing to their additional insulation and lower transmissivity—show a more moderated increase in Solar Heat Gain as WOA expands. For a WOA of 1.3 m2, Solar Heat Gain in triple-glazed rooms was recorded at 603 W, compared to 281 W for a WOA of 0.32 m2. The β1 for Solar Heat Gain in triple-glazing was 348.91, reflecting a dampened effect of WOA on Solar Heat Gain. The additional glass layers in triple-glazing systems act as barriers, reducing the amount of solar radiation entering the building, thus lowering the overall Solar Heat Gain even as WOA increases.
WOA affects Solar Heat Gain and is critical in the CEV, as larger window openings facilitate better air exchange. In naturally ventilated spaces, an increase in WOA leads to a greater airflow volume, thereby improving cooling performance. For example, in a double-glazed room with a WOA of 1.3 m2, the CEV reached 1103 W, while reducing the WOA to 0.32 m2 reduced the CEV to 291 W. This significant drop demonstrates how effectively natural ventilation can mitigate heat buildup, provided that the window opening is sufficiently large to allow adequate airflow. The regression coefficient for CEV in double-glazing systems was 868.12, indicating a substantial influence of WOA on natural cooling.
Similarly, in triple-glazing systems, the impact of WOA on CEV was also noticeable, although slightly less pronounced. For a WOA of 1.3 m2, the CEV was 983 W, dropping to 233 W when the WOA was reduced to 0.32 m2. The β1 for CEV in triple-glazing was 665.63, reflecting the lower ventilation efficiency compared to double-glazing systems, as the insulation properties of triple-glazing can also reduce airflow and natural cooling (Howard-Reed et al., 2002).
Calculating net thermal effect
This section analyses the Net Thermal Effect associated with various WOA configurations in different room types and glazing options. The focus is on calculating the Net Thermal Effect during both summer and winter. By examining the interplay between solar heat gain and cooling effects from ventilation, this analysis aims to identify optimal WOA settings that enhance indoor thermal comfort throughout the year. The data is organised in a tabular format (Table 7), detailing the performance of double and triple-glazing rooms under different WOA scenarios. Each configuration is evaluated for its net heat gain in summer and winter, highlighting the overall effects on indoor temperatures.
Table 7.
Net thermal effect for each room, glazing type, and WOA configuration across summer and winter.
| Room & glazing type | WOA | Net thermal effect (Summer) (W) | Effect (Summer) | Net thermal effect (Winter) (W) | Effect (Winter) |
|---|---|---|---|---|---|
| 1# Double glazing room | 1.3 (100%) | − 60 | Net cooling | − 40 | Net cooling |
| 0.97 (75%) | 969 | Net heat gain | + 57 | Net heat gain | |
| 0.65 (50%) | 781 | Net heat gain | + 128 | Net heat gain | |
| 0.32 (25%) | 509 | Net heat gain | + 164 | Net heat gain | |
| 0 | 313 | Net heat gain | + 269 | Net heat gain | |
| 1# Triple glazing room | 1.3 (100%) | − 206 | Net cooling | − 130 | Net cooling |
| 0.97 (75%) | 743 | Net cooling | − 35 | Net cooling | |
| 0.65 (50%) | 587 | Net heat gain | + 52 | Net heat gain | |
| 0.32 (25%) | 419 | Net heat gain | + 111 | Net heat gain | |
| 0 | 231 | Net heat gain | + 204 | Net heat gain | |
| 2# Double glazing room | 1.3 (100%) | − 41 | Net cooling | − 39 | Net cooling |
| 0.97 (75%) | 1019 | Net heat gain | + 53 | Net heat gain | |
| 0.65 (50%) | 823 | Net heat gain | + 139 | Net heat gain | |
| 0.32 (25%) | 569 | Net heat gain | + 126 | Net heat gain | |
| 0 | 341 | Net heat gain | + 292 | Net heat gain | |
| 2# Triple glazing room | 1.3 (100%) | − 176 | Net cooling | − 147 | Net cooling |
| 0.97 (75%) | 783 | Net cooling | − 24 | Net cooling | |
| 0.65 (50%) | 627 | Net heat gain | + 63 | Net heat gain | |
| 0.32 (25%) | 451 | Net heat gain | + 127 | Net heat gain | |
| 0 | 263 | Net heat gain | + 232 | Net heat gain | |
| 3# Double glazing room | 1.3 (100%) | − 48 | Net cooling | − 43 | Net cooling |
| 0.97 (75%) | 1063 | Net heat gain | + 46 | Net heat gain | |
| 0.65 (50%) | 847 | Net heat gain | + 145 | Net heat gain | |
| 0.32 (25%) | 593 | Net heat gain | + 157 | Net heat gain | |
| 0 | 349 | Net heat gain | + 296 | Net heat gain | |
| 3# Triple glazing room | 1.3 (100%) | − 178 | Net cooling | − 160 | Net cooling |
| 0.97 (75%) | 813 | Net cooling | − 27 | Net cooling | |
| 0.65 (50%) | 631 | Net heat gain | + 50 | Net heat gain | |
| 0.32 (25%) | 463 | Net heat gain | + 126 | Net heat gain | |
| 0 | 271 | Net heat gain | + 235 | Net heat gain |
Based on the Net Thermal Effect analysis, practical conclusions regarding adjustments to WOA for optimising indoor thermal comfort in winter and summer can be drawn.
In winter, particularly in double-glazed rooms, a small WOA (0.32 or closed) is recommended, as it maximises net heat gain, achieving values of 164–269 W. Keeping windows closed or only minimally open reduces ventilation-driven cooling and enhances heat retention from solar gain, thereby maintaining warmth. For triple-glazed rooms, a similar approach is advisable, with minimal WOA (0.32 or closed) yielding net heat gains of approximately 111–204 W. Triple glazing further improves heat retention, allowing for windows to be closed or set to a WOA of 25%, thus facilitating solar heat gain while minimising unwanted cooling. Overall, smaller WOAs (0 to 0.32) are preferable in winter across all room types, as they effectively retain solar heat and limit cooling through ventilation. While triple-glazing offers a slight advantage in heat retention, double-glazed rooms also benefit from reduced ventilation during this season.
In summer, the recommendations shift towards maximising cooling. A larger WOA (1.3 or 0.97) for double-glazed rooms is optimal, resulting in a net cooling effect of up to − 41 W or − 39 W, particularly at peak temperatures. Fully opening windows to the maximum WOA (1.3) promotes ventilation cooling and offsets high solar gain, effectively preventing overheating. In triple-glazed rooms, the maximum WOA (1.3 or 0.97) achieves significant cooling, yielding net cooling effects of up to − 178 W or − 66 W. During hot summer, fully or mostly open windows enhance cooling through ventilation without compromising thermal comfort. Thus, larger WOAs (1.3 or 0.97) are ideal for summer, as they enhance ventilation cooling and help maintain comfortable indoor temperatures. Triple glazing is particularly effective at balancing solar heat gain, allowing for high WOA even in sunny conditions to prevent excessive indoor heat.
In summary, smaller WOA settings (ideally 0.32 or closed) should be used to increase indoor temperatures for winter, as this approach enhances solar heat retention, especially in triple-glazed rooms. Conversely, larger WOA (ideally 1.3 or 0.97) should be employed in summer to effectively reduce indoor temperatures through maximised ventilation cooling, benefiting triple-glazed rooms in mitigating solar gain. These seasonal adjustments allow occupants to optimise thermal comfort while minimising reliance on mechanical systems, aligning with energy-efficient building practices.
Findings and discussion
The analysis of the effects of WOA on Solar Heat Gain and CEV demonstrates clear patterns that align with the glazing configurations and seasons. Regression analysis across double- and triple-glazed systems revealed a consistent and significant positive linear relationship between WOA, Solar Heat Gain, and CEV. A larger WOA allows more solar radiation to enter, increasing Solar Heat Gain and enhancing airflow, which drives natural cooling through ventilation. The slope of the regression lines varies significantly between double and triple-glazing, with double-glazing systems consistently showing steeper slopes due to their higher solar transmissivity and enhanced ventilation efficiency.
Based on the literature reviewed, the thermal performance of double and triple glazing varies significantly across different climatic zones. A study conducted in Slovenia explored the performance of both glazing systems in three distinct climatic regions: continental (Maribor), mountainous (Kredarica), and Mediterranean (Portorož)72. In areas with high solar gains, such as Portorož, triple glazing with low-emissivity coatings proved the most energy-efficient solution. It minimized heat loss during the winter while reducing the summer’s cooling demand. However, in colder climates like Maribor, triple glazing with multiple low-emissivity panes provided superior insulation against the cold, significantly reducing heating needs. Despite this, in regions with low solar gains, the insulating properties of triple glazing could lead to overheating in the summer, mainly if there is inadequate shading.
Another study examines the impact of double and triple glazing on energy savings, emphasizing a climate-responsive approach within the different climate classification73. A comparative analysis was conducted using numerical simulations of conjugate heat transfer in a transient state within a two-dimensional model. Initially, the thermal performance of both glazing types was assessed under extreme weather conditions, followed by an annual energy evaluation. The results indicated that triple glazing outperformed double glazing, reducing heat loss by 56.5% on the coldest day and limiting heat gain by 31.0% on the warmest day in Mérida, Yucatán. Additionally, triple glazing proved more effective in lowering total heat flux per unit area by 32.7% under extreme temperature and solar radiation conditions, particularly in south-facing façades on the coldest days and west-facing façades on the hottest days. While window orientation significantly influenced overheating, triple glazing achieved a 29% annual reduction in electricity consumption and CO₂ emissions compared to double glazing. These findings underscore triple glazing as a more sustainable and energy-efficient choice, though its feasibility must be weighed against cost and installation factors.
Besides that, a systematic review has conducted the comparative performance of double and triple-glazing technologies in China’s diverse climatic regions15, emphasizing the increasing demand for energy efficiency and thermal comfort. Employing the SWOT (strengths, weaknesses, opportunities, and threats) analysis, the research systematically evaluates the benefits and challenges of these glazing types across the severe cold, hot summer-cold winter, and hot-humid regions. Findings indicate that triple glazing is advantageous in northern cities due to its superior insulation, significantly reducing heat loss and improving indoor comfort during long, harsh winters. Conversely, double-glazing in hot summer-cold winter regions provides a balanced approach, optimizing insulation and solar heat gain to enhance seasonal energy efficiency. In hot-humid climates, double glazing with Low-E coatings is preferred for its ability to limit solar radiation while maintaining cost-effectiveness. Key challenges include condensation risks, cost trade-offs, and installation complexities, which impact large-scale implementation. By providing a strategic comparative analysis of glazing technologies, this study offers valuable insights into the climate-responsive selection of window systems, supporting sustainable building practices across China’s distinct regional conditions.
Building upon the insights from the comparative analysis of glazing systems across different climatic regions, it is essential to consider how additional design elements, such as shading devices28,74, can further enhance buildings’ energy efficiency and thermal comfort. In particular, integrating interior roller blinds with double-glazing systems has significantly influenced solar heat gain and heat loss75,76, offering a dynamic approach to optimizing indoor thermal conditions, as demonstrated in various case studies.
One study evaluated the impact of interior roller blinds on heat loss through the central part of double-glazed windows during the heating season in Central Europe75. The results showed that interior blinds could reduce heat loss by approximately 33%, while exterior blinds could reduce about 45%. The energy-saving effects were particularly significant when the gap between the blinds and the glass exceeded 20 millimetres.
Another study assessed the aesthetic and thermal applicability of high-glass spaces with interior roller blinds in a building at Najran University in Saudi Arabia’s hot and arid climate76. The research found that dark-coloured, double low-emissivity (low-E) glazing combined with interior roller blinds significantly reduced solar radiation penetration, resulting in an indoor-outdoor temperature difference of approximately 9.2 °C. The use of interior blinds also had a dynamic effect on the heat transfer coefficient (HTC), lowering it from 7.1 to 4.2 W/m2 K when fully closed. This demonstrates that interior roller blinds are key in controlling solar heat gain and enhancing indoor comfort.
Yet another study employs Computational Fluid Dynamics (CFD) simulations to model the conjugated heat transfer within the double-skin envelope, including the cooling pipes, Venetian blinds, and air cavity20. The numerical model used in this study has been validated against experimental data. The key finding is that the embedded cooling pipes significantly lower the temperature of the Venetian blinds and the surrounding air cavity. As a result, the heat transfer through the glass envelope is reduced, improving indoor thermal comfort. One of the significant advantages identified is that the cooling pipes, through the circulation of cooling water (which can be naturally sourced), remove about 60% of the solar radiation directly. This leads to a reduction in the solar energy transmittance of the window, which is reduced to only 13%. Additionally, the study suggests that relatively inexpensive glass can be used in pipe-embedded double glazing without significantly affecting performance, making this an economically viable option for improving energy efficiency.
These case studies indicate that integrating double-glazing and interior roller blinds effectively reduces heat loss and solar heat gain, improving building energy efficiency and indoor thermal comfort.
While integrating shading devices like interior roller blinds has shown considerable potential in enhancing thermal comfort and energy efficiency, as explored in previous studies, this research focuses on the direct impact of WOA and glazing types on Solar Heat Gain and CEV. By analysing the dynamic interaction between these factors, this study aims to provide a more tailored approach for optimizing indoor environmental quality across different seasons and building configurations.
For the winter months (January and February), the data highlights that those double-glazing systems exhibited higher Solar Heat Gain and CEV values than triple-glazing at all WOAs. For instance, in Room 1# with a WOA of 1.3 m2, the Solar Heat Gain and CEV for double glazing were 781 W and 1103 W, respectively, compared to 603 W and 983 W for triple glazing. The higher transmissivity of double-glazed systems allows more solar radiation to enter, increasing Solar Heat Gain and providing a more substantial natural heating effect, which is advantageous during colder months. However, the higher CEV in double glazing also indicates more excellent airflow, which can reduce heat retention. With its lower U-value, triple-glazing reduces Solar Heat Gain by approximately 20–30% compared to double-glazing, indicating better insulation. These findings suggest that double glazing offers superior ventilation efficiency but is less effective at minimising heat loss, making triple glazing a more thermally efficient choice in winter when heat retention is a priority.
In summer (July and August), the regression analysis and heatmaps reinforce the seasonal interplay between Solar Heat Gain, CEV, and WOA. Double-glazing systems again demonstrated higher Solar Heat Gain and CEV values than triple-glazing, with Room 3# showing the highest Solar Heat Gain at 1279 W and CEV at 1327 W for a WOA of 1.3 m2. Under the same conditions, Triple-glazing recorded Solar Heat Gain and CEV values of 1001 W and 1179 W, respectively. The results highlight the trade-off inherent in double glazing: while it allows more solar heat gain, which could lead to overheating in summer, it also facilitates better ventilation and cooling through higher CEV. Triple glazing mitigates solar heat gain more effectively due to its enhanced insulation, reducing the cooling load required to maintain comfortable indoor temperatures. However, its reduced airflow efficiency limits its capacity to provide natural cooling. This emphasises the importance of WOA management and glazing selection in achieving optimal summer thermal comfort.
The analysis of differences between Solar Heat Gain and CEV across glazing types underscores the dual influence of WOA on heat gain and ventilation efficiency8,24,70. Regression coefficients further quantify this relationship, showing that for every additional square meter of WOA, Solar Heat Gain increases by 451.76–726.85 W in double-glazing rooms and by 348.91–576.92 W in triple-glazing rooms. Similarly, CEV increases by 868.12–972.47 W in double glazing and 665.63 W to 791.88 W in triple glazing, highlighting the ventilation performance of double-glazed systems. Triple-glazing, while less effective at enhancing CEV, consistently achieves lower Solar Heat Gain, demonstrating its effectiveness in reducing solar heat gain. These findings highlight the critical need to balance WOA and glazing type based on the specific thermal requirements of the season and the building’s location.
The Net Thermal Effect analysis provides a comprehensive understanding of the overall thermal effects of WOA configurations21,69, revealing stark seasonal differences in optimal settings. In winter, smaller WOAs (e.g., 0.32 m2 or closed) maximise heat retention, yielding positive Net Thermal Effect values of up to + 269 W for double glazing and + 204 W for triple glazing in Room 1#. This highlights the advantage of reducing ventilation-driven cooling and prioritising solar heat gain during colder months. Conversely, in summer, larger WOA (e.g., 1.3 m2 or 0.97 m2) promote net cooling, with double glazing achieving Net Thermal Effect values of − 60 W and triple glazing achieving − 206 W in Room 1#. Fully or partially open windows enhance natural ventilation, offsetting higher Solar Heat Gain and preventing overheating. Triple-glazing’s ability to balance solar heat gain and cooling efficiency makes it particularly effective for maintaining thermal comfort in summer while minimising energy demand for cooling systems.
These findings highlight the dynamic interaction between WOA, Solar Heat Gain, and CEV across glazing types and seasons. While more sensitive to WOA changes, double-glazing makes it advantageous in summer for regions with strong ventilation needs. With its enhanced insulation, Triple-glazing consistently reduces Solar Heat Gain and improves heat retention, making it a more practical choice in winter. Adjusting WOA configurations dynamically, based on seasonal requirements, can optimise indoor thermal comfort while minimising reliance on mechanical systems, aligning with sustainable building practices and energy efficiency goals. These insights provide a foundation for architects and engineers to design glazing and ventilation systems tailored to specific climatic conditions and energy demands.
Conclusion
The study thoroughly investigated the relationship between WOA, Solar Heat Gain, and CEV within high-rise bedrooms equipped with double- and triple-glazed windows across distinct seasonal conditions. The findings emphasise the dual influence of WOA on thermal performance, revealing the complex interplay between heat gain and ventilation efficacy that varies significantly by glazing type and season.
In winter, the analysis demonstrated that smaller WOAs maximise heat retention, with triple-glazed systems outperforming double-glazed counterparts due to their superior insulation properties. Triple glazing reduced Solar Heat Gain by 20–30% compared to double glazing, emphasising its effectiveness in mitigating heat loss while maintaining sufficient solar radiation for passive heating. Despite these advantages, double-glazing systems showed higher CEV values, reflecting their enhanced ability to facilitate natural ventilation. This underscores a trade-off between insulation and ventilation performance, highlighting the need for targeted strategies to optimise thermal comfort during colder months.
Conversely, in summer, larger WOA was shown to enhance cooling through improved ventilation, with double glazing exhibiting higher Solar Heat Gain and CEV values. While this contributed to effective natural cooling, it also posed a risk of overheating due to greater solar heat penetration. Despite its slightly lower ventilation efficiency, triple-glazing effectively limited Solar Heat Gain, demonstrating its capacity to maintain indoor comfort under high solar radiation. The seasonal contrasts underscore the necessity of dynamic WOA management to balance the benefits of solar heat gain and ventilation cooling, especially in climates with significant seasonal variability.
The regression analysis provided quantitative insights, establishing strong linear relationships between WOA, Solar Heat Gain, and CEV for both glazing types. Double-glazing systems consistently exhibited steeper slopes in these relationships, reflecting their sensitivity to changes in WOA. This was particularly pronounced in summer, where larger WOAs significantly amplified heat gain and ventilation cooling. With its enhanced insulation, triple glazing moderated these effects, offering a more stable thermal performance across varying WOA configurations.
The Net Thermal Effect analysis highlighted optimal WOA settings for seasonal comfort. In winter, smaller WOAs (e.g., 0.32 m2 or closed) maximised net heat gain, leveraging solar radiation to offset heat loss, particularly in triple-glazed rooms. In summer, larger WOAs (e.g., 1.3 m2 or 0.97 m2) facilitated net cooling, with triple glazing effectively balancing Solar Heat Gain and CEV to minimise overheating. These results illustrate the dynamic potential of WOA adjustments to optimise indoor thermal conditions while reducing reliance on mechanical systems.
Despite the comprehensive approach employed, this study has several limitations that must be acknowledged. For external environmental factors, certain external factors, including urban heat islands, microclimatic variations, and localised airflow disruptions caused by adjacent buildings, were not explicitly considered. These factors are particularly relevant in densely populated urban areas, where environmental heterogeneity can significantly influence Solar Heat Gain and CEV.
Regarding geographic and climatic scope, this study focused exclusively on Dongguan, China, a subtropical region with distinct climatic characteristics. Consequently, the findings may not directly apply to regions with different climatic conditions, such as temperate or arid zones. The study’s scope excludes seasonal anomalies and extreme weather conditions, which could introduce additional variables.
The material configurations, including the Low-E coating and argon-filled cavities for triple-glazed windows, were assessed through real-world measurements, considering the material and structural properties. However, it is important to note that deviations in real-world conditions, such as seal degradation or imperfect installation, may reduce this study’s thermal and ventilation efficiencies. Additionally, a case with double glazing and shading devices (such as interior roller blinds) was not included in the project, which is a limitation of this study. Future research could consider incorporating such cases to provide a more comprehensive evaluation of window performance under varying conditions.
In terms of future research directions, building on the findings and limitations of this study, several avenues for future research emerge:
Future research should explore integrating advanced automated systems that dynamically adjust window opening areas based on real-time data inputs, such as solar radiation intensity, indoor air quality, and outdoor wind speeds. These systems could leverage machine learning algorithms to optimise energy efficiency while maintaining occupant comfort. Furthermore, testing such systems in various climatic conditions would validate their applicability across diverse settings.
Extending the scope of research to include long-term monitoring of Solar Heat Gain and CEV in real-world settings is crucial. This would involve deploying IoT-enabled sensors to capture temporal variations in building performance, providing a more nuanced understanding of the interplay between WOA, glazing type, and environmental factors over time. A broader investigation comparing glazing and WOA performance in different climatic zones (e.g., temperate, desert, and tropical regions) would provide actionable insights into the scalability of the findings. Additionally, incorporating mixed-method approaches—such as simulation studies combined with empirical fieldwork—could enhance the robustness of the results.
Exploring the synergies between adaptive WOA systems and renewable energy technologies, such as photovoltaic-integrated windows, could further improve the sustainability of high-rise residential buildings. Research could focus on how adaptive window strategies simultaneously impact energy generation and thermal regulation. Beyond glazing systems, future studies should examine the potential of advanced shading solutions, such as electrochromic or thermochromic materials, in conjunction with WOA optimisation. These technologies could dynamically regulate Solar Heat Gain while maintaining sufficient daylight penetration, enhancing energy efficiency and occupant well-being.
Appendix: Dongguan climate summary
Country: China.
City: Dongguan.
Longitude: 113.751799.
Latitude: 23.020673.
Elevation: 6.15 m (20.18 ft).
Annual high temperature: 18.37 °C (65.07 °F).
Annual low temperature: 9.63 °C (49.33 °F).
Average annual precipitation: 41.33 mm (1.63 in).
Warmest month: August (30.08 °C/86.14 °F).
Coldest month: January (1.85 °C/35.33 °F).
Wettest month: November (71.34 mm/2.81 in).
Driest month: February (7.26 mm/0.29 in).
Number of days with rainfall (≥ 1.0 mm): 45.3 days (12.41%).
Days with no rain: 319.7 days (87.59%).
Humidity: 61.25%.
Author contributions
Y.C.: Conceptualisation, Formal analysis, Investigation, Methodology, Validation, Visualization, Writing original draft. D.L.: Methodology, Project administration, Resources, Supervision, Validation, Review & editing. D.H.: Investigation, Supervision, Validation. Y.L.: Investigation. N.T.: Supervision. C.H.: Supervision.
Data availability
The datasets used and analysed during the current study are available from the corresponding author upon reasonable request.
Declarations
Competing interests
The authors declare no competing interests.
Footnotes
Publisher’s note
Springer Nature remains neutral with regard to jurisdictional claims in published maps and institutional affiliations.
References
- 1.Ahmed, N. M., Altamura, P., Giampaoletti, M., Hemeida, F. A. & Mohamed, A. F. A. Optimizing human thermal comfort and mitigating the urban heat Island effect on public open spaces in Rome, Italy through sustainable design strategies. Sci. Rep.14, 19931 (2024). [DOI] [PMC free article] [PubMed]
- 2.Aijazi, A., Parkinson, T., Zhang, H. & Schiavon, S. Passive and low-energy strategies to improve sleep thermal comfort and energy resilience during heat waves and cold snaps. Sci. Rep.14, 12568 (2024). [DOI] [PMC free article] [PubMed]
- 3.Ullah, S., Aldossary, A., Ullah, W. & Al-Ghamdi, S. G. Augmented human thermal discomfort in urban centers of the Arabian Peninsula. Sci. Rep.14, 3974 (2024). [DOI] [PMC free article] [PubMed]
- 4.Shukla, K. K. & Attada, R. CMIP6 models informed summer human thermal discomfort conditions in Indian regional hotspot. Sci. Rep.13, 12549 (2023). [DOI] [PMC free article] [PubMed]
- 5.Jing, W., Qin, Z., Mu, T., Ge, Z. & Dong, Y. Evaluating thermal comfort indices for outdoor spaces on a university campus. Sci. Rep.14, 21253 (2024). [DOI] [PMC free article] [PubMed]
- 6.Hwang, R. L., Fang, P. L. & Chen, W. A. Impact of solar radiation on indoor thermal comfort near highly glazed façades in a hot-humid subtropical climate: An experimental evaluation. Build. Environ.243, 110725 (2023). [Google Scholar]
- 7.Aste, N., Buzzetti, M., Pero, C. D. & Leonforte, F. Glazing’s techno-economic performance: A comparison of window features in office buildings in different climates. Energy Build.159, 123–135 (2018). [Google Scholar]
- 8.Abdul Mujeebu, M. & Ashraf, N. Energy-saving benefits of thermal insulation and glazing in code-compliant office building in cooling-dominated climates. Renew. Sustain. Energy Rev.199, 114532 (2024). [Google Scholar]
- 9.Aguilar, J. O. et al. Thermal performance of a room with a double glazing window using glazing available in Mexican market. Appl. Therm. Eng.119, 505–515 (2017). [Google Scholar]
- 10.Zakeri Shahvari, S. & Clark, J. D. Assessment and improvement of the 2019 ASHRAE handbook model for exhaust-to-intake dilution calculations for rooftop exhaust systems (ASHRAE 1823-RP). Sci. Technol. Built Environ.26, 552–566 (2020). [Google Scholar]
- 11.Bienvenido-Huertas, D., Sánchez-García, D., Tejedor, B. & Rubio-Bellido, C. Energy savings in buildings applying ASHRAE 55 and regional adaptive thermal comfort models. Urban Clim.55, 101892 (2024). [Google Scholar]
- 12.Cheung, T., Schiavon, S., Parkinson, T., Li, P. & Brager, G. Analysis of the accuracy on PMV–PPD model using the ASHRAE global thermal comfort database II. Build. Environ.153, 205–217 (2019). [Google Scholar]
- 13.Ahmed, T., Kumar, P. & Mottet, L. Natural ventilation in warm climates: The challenges of thermal comfort, heatwave resilience and indoor air quality. Renew. Sustain. Energy Rev.138, 110669 (2021). [Google Scholar]
- 14.Abass, P. J. & Muthulingam, S. Thermal energy storage performance of biaxial voided RCC roof slab integrated with macroencapsulated PCM for passive cooling of buildings. J. Energy Storage88, 111478 (2024). [Google Scholar]
- 15.Chen, Y., Taib, N., Sern, C. H. Y. & Kim, E. Triple glazing performance for human thermal comfort: Systematic literature review and bibliometric quantitative analysis. J. Adv. Res. Fluid Mech. Therm. Sci.124, 142–174 (2024). [Google Scholar]
- 16.Chen, Z. et al. Field investigation on thermal comfort of metro passengers in hot summer and warm winter zone of China: A case study in Guangzhou. Energy Build.320, 114633 (2024). [Google Scholar]
- 17.Chen, Y., Yin, X. & Lyu, C. Circular design strategies and economic sustainability of construction projects in China: The mediating role of organizational culture. Sci. Rep.14, 7890 (2024). [DOI] [PMC free article] [PubMed] [Google Scholar]
- 18.He, D. & Isa, M. H. M. Investigation of indoor thermal comfort of heritage buildings in hot summer and cold winter zone of China: A case study. Case Stud. Therm. Eng.53, 103820 (2024). [Google Scholar]
- 19.Chen, Y., Taib, N. & Kim, E. Effect of triple glass layers on the thermal performance of windows. J. Adv. Res. Fluid Mech. Therm. Sci.124, 183–197 (2024). [Google Scholar]
- 20.Shen, C. & Li, X. Solar heat gain reduction of double glazing window with cooling pipes embedded in Venetian blinds by utilizing natural cooling. Energy Build.112, 173–183 (2016). [Google Scholar]
- 21.Borghero, L., Clèries, E., Péan, T., Ortiz, J. & Salom, J. Comparing cooling strategies to assess thermal comfort resilience of residential buildings in Barcelona for present and future heatwaves. Build. Environ.231, 110043 (2023). [Google Scholar]
- 22.Bianco, L., Cascone, Y., Goia, F., Perino, M. & Serra, V. Responsive glazing systems: Characterisation methods, summer performance and implications on thermal comfort. Sol. Energy158, 819–836 (2017). [Google Scholar]
- 23.Aguilar, J. O., Xaman, J., Álvarez, G., Hernández-Pérez, I. & López-Mata, C. Thermal performance of a double pane window using glazing available on the Mexican market. Renew. Energy81, 785–794 (2015). [Google Scholar]
- 24.Ahmed, A. E., Suwaed, M. S., Shakir, A. M. & Ghareeb, A. The impact of window orientation, glazing, and window-to-wall ratio on the heating and cooling energy of an office building: The case of hot and semi-arid climate. J. Eng. Res.10.1016/j.jer.2023.10.034 (2023). [Google Scholar]
- 25.Wang, T. P. & Wang, L. B. The effects of transparent long-wave radiation through glass on time lag and decrement factor of Hollow double glazing. Energy Build.117, 33–43 (2016). [Google Scholar]
- 26.Liu, C. et al. Thermal performance testing of triple-glazing water flow window in cooing operation. Sol. Energy218, 108–116 (2021). [Google Scholar]
- 27.Azmi, N. A. & Ibrahim, S. H. A comprehensive review on thermal performance and envelope thermal design of mosque buildings. Build. Environ.185, 107305 (2020). [Google Scholar]
- 28.Sharbafian, M., Yeganeh, M. & Baradaran Motie, M. Evaluation of shading of green facades on visual comfort and thermal load of the buildings. Energy Build.317, 114303 (2024). [Google Scholar]
- 29.Kyritsi, E. & Michael, A. An assessment of the impact of natural ventilation strategies and window opening patterns in office buildings in the mediterranean basin. Build. Environ.175, 106384 (2020). [Google Scholar]
- 30.Albatayneh, A., Alterman, D., Page, A. & Moghtaderi, B. Thermal assessment of buildings based on occupants behavior and the adaptive thermal comfort approach. Energy Procedia115, 265–271 (2017). [Google Scholar]
- 31.Balvedi, B. F., Ghisi, E. & Lamberts, R. A review of occupant behaviour in residential buildings. Energy Build.174, 495–505 (2018). [Google Scholar]
- 32.Al-Atrash, F., Hellwig, R. T. & Wagner, A. The degree of adaptive thermal comfort in office workers in a hot-summer mediterranean climate. Energy Build.223, 110147 (2020). [Google Scholar]
- 33.Bienvenido-Huertas, D., Pulido-Arcas, J. A., Rubio-Bellido, C. & Pérez-Fargallo, A. Feasibility of adaptive thermal comfort for energy savings in cooling and heating: A study on Europe and the mediterranean basin. Urban Clim.36, 100807 (2021). [Google Scholar]
- 34.Carlucci, S., Bai, L., de Dear, R. & Yang, L. Review of adaptive thermal comfort models in built environmental regulatory documents. Build. Environ.137, 73–89 (2018). [Google Scholar]
- 35.Ávila-Delgado, J., Robador, M. D., Barrera-Vera, J. A. & Marrero, M. Glazing selection procedure for office building retrofitting in the mediterranean climate in Spain. J. Build. Eng.33, 101448 (2021). [Google Scholar]
- 36.Chan, F. K. S. et al. The cross-boundary of land degradation in Mongolia and China and achieving its neutrality—Challenges and opportunities. Ecol. Ind.151, 110311 (2023). [Google Scholar]
- 37.Rahman, M. A., Moser, A., Gold, A., Rötzer, T. & Pauleit, S. Vertical air temperature gradients under the shade of two contrasting urban tree species during different types of summer days. Sci. Total Environ.633, 100–111 (2018). [DOI] [PubMed] [Google Scholar]
- 38.Chen, H., Zhao, L. & Zhao, Z. Influencing factors of farmers’ willingness to withdraw from rural homesteads: A survey in Zhejiang, China. Land Use Policy68, 524–530 (2017). [Google Scholar]
- 39.Han, H. & Lai, S. K. National land use management in China: An analytical framework. J. Urban Manag.1, 3–38 (2012). [Google Scholar]
- 40.Tadeu, A. J. B. & Mateus, D. M. R. Sound transmission through single, double and triple glazing. Experimental evaluation. Appl. Acoust.62, 307–325 (2001). [Google Scholar]
- 41.Yang, W. & Jeon, J. Y. Design strategies and elements of Building envelope for urban acoustic environment. Build. Environ.182, 107121 (2020). [Google Scholar]
- 42.Zeng, F. et al. The effects of acoustic-light-thermal environment quality parameters on pedestrians’ overall comforts in residential districts. Sci. Rep.14, 19625 (2024). [DOI] [PMC free article] [PubMed]
- 43.Horne, J. et al. Building parameters linked with indoor transmission of SARS-CoV-2. Environ. Res.238, 117156 (2023). [DOI] [PubMed] [Google Scholar]
- 44.Wei, W., Wargocki, P., Zirngibl, J., Bendžalová, J. & Mandin, C. Review of parameters used to assess the quality of the indoor environment in green Building certification schemes for offices and hotels. Energy Build.209, 109683 (2020). [Google Scholar]
- 45.Zhao, H., Ji, W., Deng, S., Wang, Z. & Liu, S. A review of dynamic thermal comfort influenced by environmental parameters and human factors. Energy Build.318, 114467 (2024). [Google Scholar]
- 46.Alqaed, S., Mustafa, J. & Almehmadi, F. A. 12The effect of using phase change materials in a solar wall on the number of times of air conditioning per hour during day and night in different thicknesses of the solar wall. J. Build. Eng.51, 104227 (2022). [Google Scholar]
- 47.Bartko, M. & Durica, P. Solar and thermo-technical properties of glazing with external blinds: Experimental analysis in a pavilion laboratory. Transp. Res. Procedia74, 999–1006 (2023). [Google Scholar]
- 48.Abdelrahman, M. M. & Miller, C. Targeting occupant feedback using digital twins: Adaptive spatial–temporal thermal preference sampling to optimize personal comfort models. Build. Environ.218, 109090 (2022). [Google Scholar]
- 49.Abdollahzadeh, S. M., Heidari, S. & Einifar, A. Evaluating thermal comfort and neutral temperature in residential apartments in hot and dry climate: A case study in Shiraz, Iran. J. Build. Eng.76, 107161 (2023). [Google Scholar]
- 50.Chow, T., Lin, Z., Fong, K., Chan, L. & He, M. Thermal performance of natural airflow window in subtropical and temperate climate zones—A comparative study. Energy. Convers. Manag.50, 1884–1890 (2009). [Google Scholar]
- 51.Gao, T., Jelle, B. P., Ihara, T. & Gustavsen, A. Insulating glazing units with silica aerogel granules: The impact of particle size. Appl. Energy128, 27–34 (2014). [Google Scholar]
- 52.Alsukkar, M., Hu, M., Alkhater, M. & Su, Y. Daylighting performance assessment of a split louver with parametrically incremental slat angles: Effect of slat shapes and PV glass transmittance. Sol. Energy264, 112069 (2023). [Google Scholar]
- 53.Kalmár, F. & Kalmár, T. Thermal comfort aspects of solar gains during the heating season. Energies13, 1702 (2020). [Google Scholar]
- 54.Brito-Coimbra, S., Aelenei, D., Gloria Gomes, M. & Moret Rodrigues, A. Building façade retrofit with solar passive technologies: A literature review. Energies14, 1774 (2021). [Google Scholar]
- 55.Thevenard, D. & Shephard, M. W. Temperature trends for locations listed in the tables of climatic design conditions in the 2013 ASHRAE handbook-fundamentals. ASHRAE Transactions, 120, 133–146 (2014).
- 56.Thevenard, D. J. & Humphries, R. G. The calculation of climatic design conditions in the 2005 ASHRAE Handbook—Fundamentals. ASHRAE Transactions, 111(PART 1), 457–466 (2005).
- 57.Squadroni, F. et al. Analysis of condensation and ventilation phenomena for double skin façade units. J. Build. Phys.46, 1057–1090 (2022). [Google Scholar]
- 58.Acero, J. A., Kestel, P., Dang, H. T. & Norford, L. K. Impact of rainfall on air temperature, humidity and thermal comfort in tropical urban parks. Urban Clim.56, 102051 (2024). [Google Scholar]
- 59.Arıcı, M., Tükel, M., Yıldız, Ç., Li, D. & Karabay, H. Is the thermal transmittance of air-filled inclined multi-glazing windows similar to that of vertical ones? Energy Build.229, 110515 (2020). [Google Scholar]
- 60.Wang, R. & Zhai, X. Handbook of Energy Systems in Green Buildings 1885 (Springer, 2018). 10.1007/978-3-662-49120-1. [Google Scholar]
- 61.Bright, N. Beam and aircrete block floors—Thermal insulation performance. Concrete37, 40–41 (2003). [Google Scholar]
- 62.Sun, Y., Zeng, Y. & Liu, C. Impact of climate change on the natural ventilation potential: A case study in the UK. Planning Post Carbon Cities: 35th PLEA Conference on Passive and Low Energy Architecture, A Coruña, 1st-3rd September 2020: Proceedings, 3, 1839 (2020).
- 63.Chilton, A. et al. Noise, ventilation and overheating in residential developments. Proceedings of the Institute of Acoustics. 38, 48–56 (2016).
- 64.Akkurt, G. G. et al. Dynamic thermal and hygrometric simulation of historical buildings: Critical factors and possible solutions. Renew. Sustain. Energy Rev.118, 109509 (2020). [Google Scholar]
- 65.Al-Hafith, O., Satish, B. & de Wilde, P. Impact of the energy crisis on indoor temperatures and thermal comfort in UK houses during winter 2023. Energy Build.323, 114750 (2024). [Google Scholar]
- 66.Gueymard, C. A. & duPont, W. C. Spectral effects on the transmittance, solar heat gain, and performance rating of glazing systems. Sol. Energy83, 940–953 (2009). [Google Scholar]
- 67.Ghasaban, M. & Yeganeh, M. A designerly approach to a novel method for combining closed and semi-open spaces in a mid-rise office building envelope to improve energy efficiency and thermal comfort. Energy Build.322, 114619 (2024). [Google Scholar]
- 68.Ning, S., Jing, W. & Ge, Z. Sunlight perception and outdoor thermal comfort in college campuses: A new perspective. Sci. Rep.13, 16112 (2023). [DOI] [PMC free article] [PubMed]
- 69.Sun, Y., Wu, Y. & Wilson, R. A review of thermal and optical characterisation of complex window systems and their building performance prediction. Appl. Energy222, 729–747 (2018). [Google Scholar]
- 70.Colclough, S. & Salaris, C. Quantifying overheating in nZEB Irish residential buildings. An analysis of recorded interior temperatures of Irish newbuild and retrofit residential buildings against CIBSE, passive house and WHO overheating criteria and recorded occupant satisfaction. Energy Build.303, 113571 (2024). [Google Scholar]
- 71.Berger, J., Essah, E. & Blanusa, T. The impact of plants on the humidity of naturally-ventilated office indoor environments. J. Build. Eng.86, 108814 (2024). [Google Scholar]
- 72.Brdnik, A. P. Thermal performance optimization of double and triple glazing systems for Slovenian climate conditions. Sustainability13, 11857 (2021).
- 73.López Salazar, S. et al. Assessing different glazing types for energy savings and CO2 reduction in a tropical climate: A comparative study. J. Build. Eng.82, 108188 (2024). [Google Scholar]
- 74.Kirimtat, A. & Manioğlu, G. A simulation-based performance evaluation of new generation dynamic shading devices with multi-objective optimization. J. Build. Eng.90, 109322 (2024). [Google Scholar]
- 75.Oleskowicz-Popiel, C. & Sobczak, M. Effect of the roller blinds on heat losses through a double-glazing window during heating season in central Europe. Energy Build.73, 48–58 (2014). [Google Scholar]
- 76.Qahtan, A. M. Aesthetic and thermal suitability of highly glazed spaces with interior roller blinds in Najran University buildings, Saudi Arabia. Sustainability16, 2030 (2024). [Google Scholar]
Associated Data
This section collects any data citations, data availability statements, or supplementary materials included in this article.
Data Availability Statement
The datasets used and analysed during the current study are available from the corresponding author upon reasonable request.