

Abstract
Objectives:
Patients with Loeys-Dietz syndrome demonstrate a heightened risk of distal thoracic aortic events after valve-sparing aortic root replacement. This study assesses the clinical risks and hemodynamic consequences of a prophylactic aortic arch replacement strategy in Loeys-Dietz syndrome and characterizes smooth muscle cell phenotype in Loeys-Dietz syndrome aneurysmal and normal-sized downstream aorta.
Methods:
Patients with genetically confirmed Loeys-Dietz syndrome (n = 8) underwent prophylactic aortic arch replacement during valve-sparing aortic root replacement. Four-dimensional flow magnetic resonance imaging studies were performed in 4 patients with Loeys-Dietz syndrome (valve-sparing aortic root replacement + arch) and compared with patients with contemporary Marfan syndrome (valve-sparing aortic root replacement only, n = 5) and control patients (without aortopathy, n = 5). Aortic tissues from 4 patients with Loeys-Dietz syndrome and 2 organ donors were processed for anatomically segmented single-cell RNA sequencing and histologic assessment.
Results:
Patients with Loeys-Dietz syndrome valve-sparing aortic root replacement + arch had no deaths, major morbidity, or aortic events in a median of 2 years follow-up. Four-dimensional magnetic resonance imaging demonstrated altered flow parameters in patients with postoperative aortopathy relative to controls, but no clear deleterious changes due to arch replacement. Integrated analysis of aortic single-cell RNA sequencing data (>49,000 cells) identified a continuum of abnormal smooth muscle cell phenotypic modulation in Loeys-Dietz syndrome defined by reduced contractility and enriched extracellular matrix synthesis, adhesion receptors, and transforming growth factor-beta signaling. These modulated smooth muscle cells populated the Loeys-Dietz syndrome tunica media with gradually reduced density from the overtly aneurysmal root to the nondilated arch.
Conclusions:
Patients with Loeys-Dietz syndrome demonstrated excellent surgical outcomes without overt downstream flow or shear stress disturbances after concomitant valve-sparing aortic root replacement + arch operations. Abnormal smooth muscle cell–mediated aortic remodeling occurs within the normal diameter, clinically at-risk Loeys-Dietz syndrome arch segment. These initial clinical and pathophysiologic findings support concomitant arch replacement in Loeys-Dietz syndrome.
Keywords: aortic aneurysm, aortic arch, aortic root replacement, Loeys-Dietz syndrome, RNA sequencing, smooth muscle cell
Aortic root aneurysm in patients with Loeys-Dietz syndrome (LDS) presents a unique clinical challenge compared with other syndromic disorders such as Marfan syndrome (MFS) due to heightened risk of dissection at smaller aortic diameter as well as diffuse arterial aneurysm and tortuosity affecting cerebral, iliac, and visceral branch vessels.1,2 Consequently, patients with LDS require diligent surveillance to prevent catastrophic vascular events (dissection or rupture). Clinical LDS subtypes also have variable risk based on underlying mutations in transforming growth factor-beta (TGF-ß) signaling component genes3–6 (TGFBR1, TGFBR2, SMAD2, SMAD3, TGFB2, TGFB3), further complicating decisions regarding individual thresholds for prophylactic aneurysm repair.7 The characteristic thoracic aortic phenotype in LDS comprises aortic root dilatation (sparing the ascending aorta and arch) traditionally managed with prophylactic valve-sparing aortic root and ascending aorta replacement (VSARR). Multiple recent reports from major aortic referral centers have demonstrated that patients with LDS more frequently have distal aortic events (reoperation for arch aneurysm or type B dissection) after elective VSARR relative to nonsyndromic patients and patients with MFS.8,9 Our institutional experience with patients who have LDS has mirrored these observations, prompting a shift to offering prophylactic arch replacement to all patients with LDS undergoing VSARR (Figure 1).
FIGURE 1.
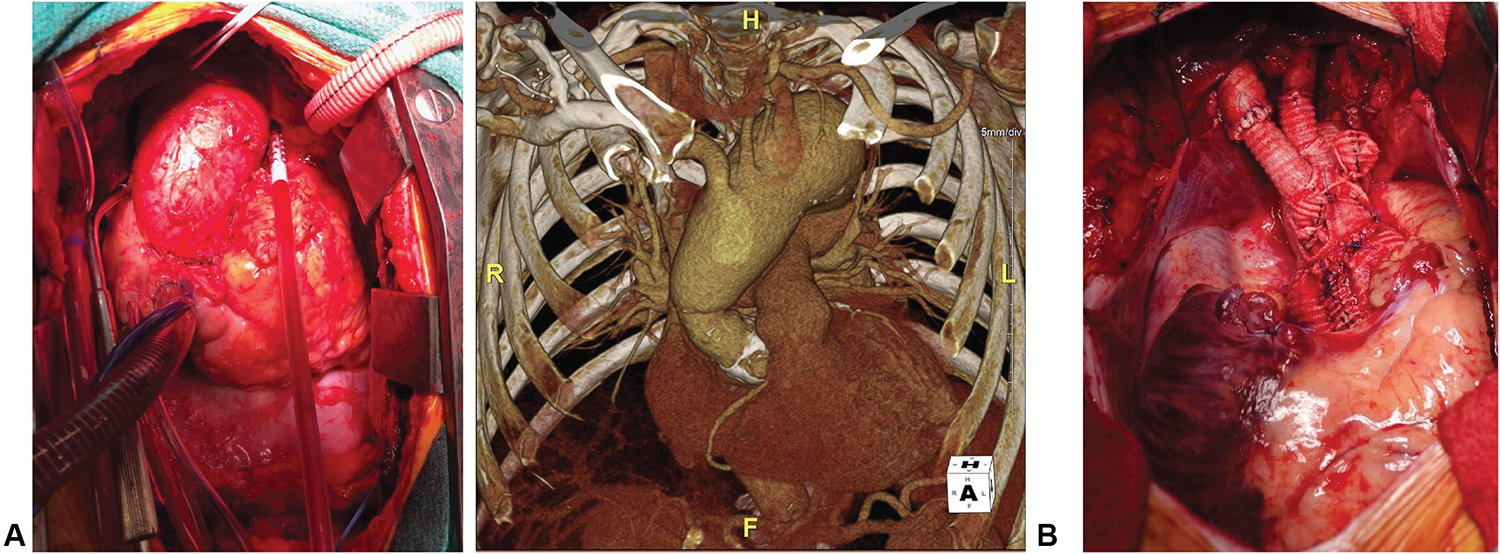
A, Spontaneous late arch aneurysm in patient with LDS. B, Concurrent VSARR and arch replacement.
Recognizing that the adoption of an aggressive arch replacement strategy to prevent future aortic events may increase the up-front surgical risk, we sought to investigate the short-term outcomes for the first clinical series of patients with LDS prospectively treated with VSARR and concomitant arch replacement, while simultaneously assessing the biomechanical significance of this approach and harnessing the power of deep cellular phenotyping within unique surgical LDS tissue specimens. To this end, recognizing that aortic replacement with graft material alters the biomechanical properties of the residual native aorta,10 we performed 4-dimensional (4D) flow magnetic resonance imaging (MRI) to determine whether this arch replacement strategy exposes the downstream aorta to abnormal, potentially deleterious flow hemodynamics. Furthermore, because pathophysiologic mechanisms driving aneurysm formation at the cellular level in LDS remain poorly understood, we enlisted single-cell RNA sequencing (scRNAseq) to enable granular investigation of disease-associated phenotype alterations specifically within smooth muscle cells (SMCs) from LDS human aortic surgical specimens. Our previous work with this technique identified a progressive SMC phenotypic modulation process toward a mixed proteolytic-synthetic state during MFS aortic root aneurysm development.11We hypothesized that similar SMC-mediated changes occur in LDS and that subclinical evidence of ongoing pathologic aortic remodeling would be detectable in the macroscopically normal (nonaneurysmal) LDS arch segment, thereby providing molecular evidence supporting an aggressive prophylactic arch replacement paradigm.
MATERIALS AND METHODS
Data Availability
All scRNAseq data (raw and processed) will be deposited into the Gene Expression Omnibus for public access.
Human Subjects
All experiments involving human subjects were prospectively approved by the Institutional Review Board (#23395 approved September 29, 2022). Patients with clinical LDS undergoing surgery for aortic root aneurysm were recruited for approved tissue-based studies and gave informed consent. Decisions surrounding surgical extent and postoperative imaging studies were strictly made on the basis of clinical indications and expert opinion. Donor aortic tissue was recovered at the time of abdominal organ preservation for transplant. Donors’ next of kin gave blanket research consent for organs and tissues not suitable for transplantation.
Operative Technique
Concomitant VSARR and aortic arch replacement (at least up to zone 2) was planned prospectively in all cases, and risks were discussed before informed consent. The right axillary artery was exposed, and a perfusion graft was anastomosed end-to-side. All cases were performed via median sternotomy with central venous cannulation. Upon initiation of cardiopulmonary bypass, cooling to a core temperature of 24 °C was commenced. VSARR was then undertaken using the Tirone David reimplantation procedure with Stanford modification12,13 (2-graft neosinus technique with a larger straight graft [32 or 34 mm, most commonly] plicated proximally to create a neo-annulus anastomosed to a downsized distal graft to create a neo-sinotubular junction). Proximal and distal graft sizes were selected on the basis of native valve anatomy, mechanism of aortic regurgitation, and surgeon experience. Once cooled, selective antegrade cerebral perfusion was delivered via the axillary graft and the aortic arch was resected. Prefabricated 4-branch (3 arch and perfusion limb) Hemashield grafts were used in all cases. The distal anastomosis was performed, the graft was deaired and clamped, and lower-body perfusion was delivered via a side-limb perfusion branch. The arch vessels were anastomosed to the branched arch graft. The proximal root replacement was completed, and the innominate artery was reimplanted to the graft after removal of the aortic crossclamp.
Four-Dimensional Flow Magnetic Resonance Imaging
Contrast-enhanced magnetic resonance angiography with time-resolved 3-dimensional phase contrast imaging (4D flow MRI)14 was performed in 4 patients with LDS after VSARR with arch replacement before hospital discharge and compared with 5 patients with MFS after classic VSARR. Five patients without aortopathy (postoperative mitral valve surgery) served as controls. MRI studies were acquired in the initial postoperative period, generally 1 to 2 weeks after surgery. 4D flow MRI datasets were evaluated qualitatively for the presence of abnormal secondary flow patterns, such as vortex formation, elevated turbulence, and retrograde flow using streamline and velocity vector field visualizations.15 For quantitative evaluation, flow velocities, wall shear stress, reverse flow, and regurgitant flow fraction were measured at the following 7 predefined cross-sectional locations along the thoracic aorta: (1) sinotubular junction, (2) distal ascending aorta, (3) between innominate artery and left common carotid artery, (4) between left common carotid and left subclavian artery, (5) distal to left subclavian artery, (6) descending aorta at the level of the pulmonary artery, and (7) cross-section with maximum velocity. Qualitative and quantitative 4D flow data analysis was performed using commercially available Cardio AI software (Arterys Inc).
Human Tissue Studies
Detailed methodology for all human tissue–based experiments (tissue handling, histology, enzymatic digestion, processing for scRNAseq, data integration, and pathway analysis) is presented in the Appendix E1.
Statistical Analysis
Analysis of 4D MRI data was performed in GraphPad Prism Version 9.3.1 (GraphPad Software). Mixed-effects models were fit for each of the outcomes. The right-hand sides of the models had fixed effects for patient groups and random effects for aortic segments, as well as interaction terms for these 2 factors. Geisser-Greenhouse correction was used to adjust for lack of sphericity. Tukey’s multiple comparisons test was then used to assess for significant differences between the groups at each aortic segment.
RESULTS
Operative Outcomes for Combined Aortic Root and Arch Replacement
Given the heightened risk of late distal aortic events, we offered prophylactic arch replacement to all genetically confirmed patients with LDS referred to our center for elective aortic root replacement, including n = 8 consecutive patients with verified genetic variants in TGFBR1 (n = 3), TGFBR2(n= 1), SMAD3 (n= 3), and TGFB2(n= 1)(Table 1). Mean age at the time of operation was 37.9 years (range, 19–57), and 87.5% of patients were male (n = 7). Aortic aneurysms predominantly affected the aortic root segment (mean 45.1 ± 8.9 mm), and the ascending aorta and arch segments tapered to normal dimensions (35.1 ± 7.8 mm and 28.7 ± 2.8 mm, respectively, Figure 2, A). All patients underwent uncomplicated first-time aortic root replacement (valve-sparing reimplantation in n = 7 cases, bioprosthetic composite valve-graft for irreparable bicuspid aortic valve in n = 1) by a single surgeon. Zone 2 aortic arch replacement (distal anastomosis between left carotid and left subclavian artery takeoff, Figure 2, B) was performed in all cases using the right axillary artery for selective antegrade cerebral perfusion under deep hypothermic circulatory arrest (core body temperature 24 °C). Arch replacements required a mean interval of 29.1 minutes (range, 21–42) of hypothermic body and spinal cord ischemia while completing the distal arch anastomosis and reestablishing distal perfusion. There were no postoperative deaths, prolonged intubations, strokes, renal failure, or permanent pacemaker implantation. One patient had a self-limited left vocal fold hypomobility. Median length of stay after surgery was 2 days in the intensive care unit (range, 1–5) and 6 total days in the hospital (range, 5–11). There were no deaths, aortic reoperations, or type B dissections in short-term follow-up (median, 2.00 years, range, 1.05–3.15 years).
TABLE 1.
Demographic and genotype data for patients with Loeys-Dietz syndrome included in valve-sparing aortic root and ascending aorta replacement + arch treatment strategy
| Age (y) | Sex | Genotype |
|---|---|---|
|
| ||
| 35 | F | TGFBR1 c.980 C > T, p.R487Q |
| 19 | M | TGFBR1 exon4 deletion |
| 57 | M | TGFBR1 c.1216 T > A, p.L406I, bicuspid aortic valve |
| 26 | M | TGFBR2 c.1151 A > G, p.N384S |
| 36 | M | SMAD3 c.1180 T > C, p.C394 R |
| 51 | M | SMAD3 c.277 C > T, pR93 * |
| 31 | M | SMAD3 c.308_309delinsCG, p.L103P |
| 48 | M | TGFB2 exon 5 c.979 C > T, p.R299 W |
Patients in bold underwent scRNAseq.
Denotes variant resulting in premature stop codon.
FIGURE 2.
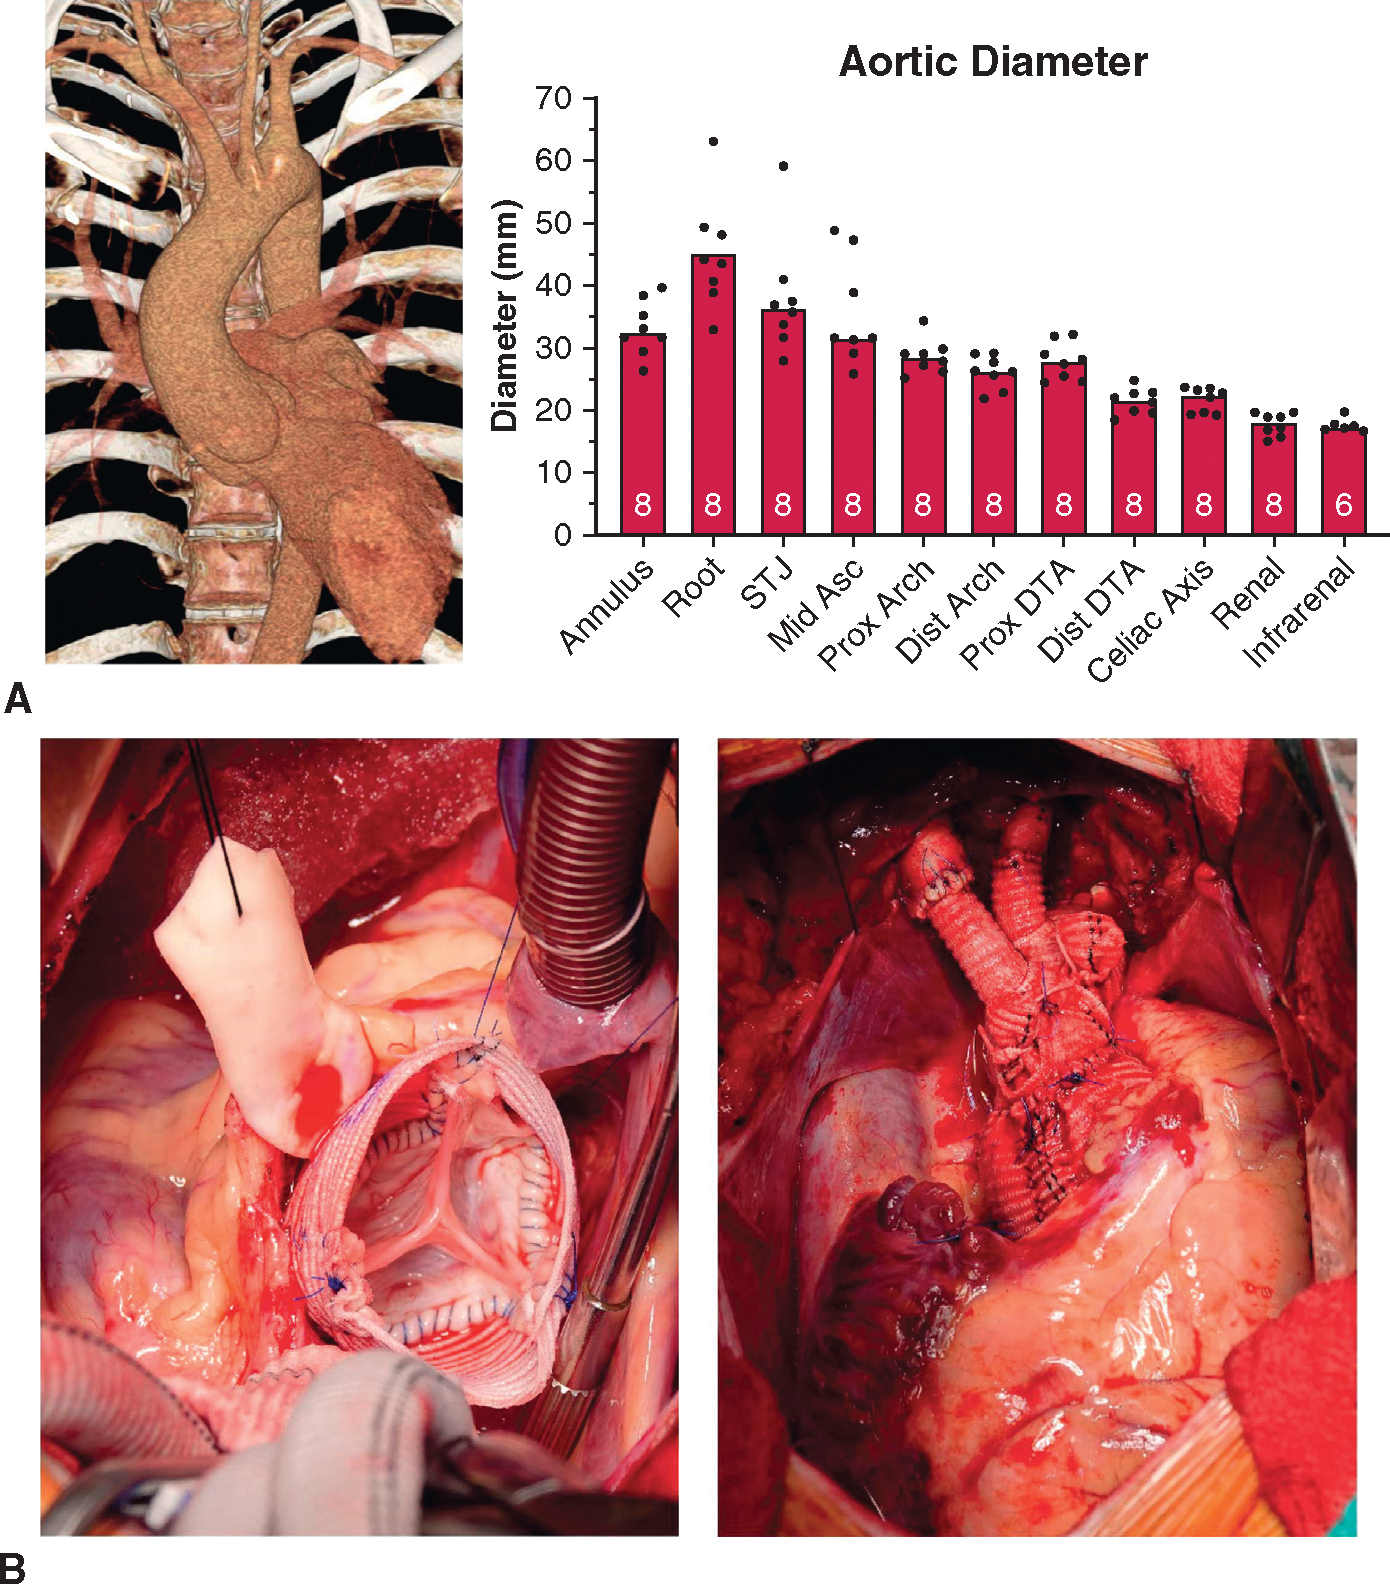
Clinical LDS VSARR + arch cases. A, Typical LDS aortic aneurysm computed tomography angiography reconstruction with focally aneurysmal root segment and preserved ascending aortic/arch diameters. Aortic diameter values at denoted segments extracted from 3-dimensional computed tomography angiography reconstructions before surgery with number of patients measured denoted within boxes. B, Typical reimplantation technique valve-sparing root replacement in a representative patient with LDS with proximal root reconstruction (left) and completed distal zone 2 arch replacement (right). STJ, Sinotubular junction; DTA, descending thoracic artery.
Four-Dimensional Flow Magnetic Resonance Imaging
Replacement of the ascending aorta with a Dacron vascular graft influences the biomechanics of the residual native aorta, which may promote degenerative remodeling16–20 and aneurysm formation or dissection over time.10,21 We sought to determine whether a distal arch anastomosis induces a differential aortic wall strain pattern in the residual native aorta relative to typical ascending aortic anastomosis. In the absence of prospectively acquired 4D flow MRI data from patients with LDS treated with standard VSARR alone, contemporary patients with MFS undergoing VSARR without arch replacement were studied to compare the distal aortic flow dynamics in patients with connective tissue disorder after proximal repairs.
Qualitative evaluation of 4D flow MRI data showed expected postoperative changes in both patients with LDS (VSARR + arch) and patients with MFS (VSARR) when compared with patients without aortopathy, including secondary flow patterns with onset of prominent vortex formation during mid to late systole. Patients with LDS and patients with MFS developed vortices in the ascending aorta or arch and in the proximal descending aorta during mid to late systole. In several patients with MFS, prominent vortices developed within the residual native distal ascending aorta, a region of relatively larger diameter compared with the more proximal Dacron graft (example in Figure 3, A). Patients with LDS developed vortices close to the ostium of the left subclavian artery (just beyond the distal anastomosis, representative image in Figure 3, B). In contrast, secondary flow patterns were rarely observed in the control group during systole (example in Figure 3, C). Flow vortices were superseded by reverse flow with turbulent or helical flow patterns during early to mid-diastole in all patients with MFS and patients with LDS. Reverse flow remained present for the remainder of the cardiac cycle.
FIGURE 3.
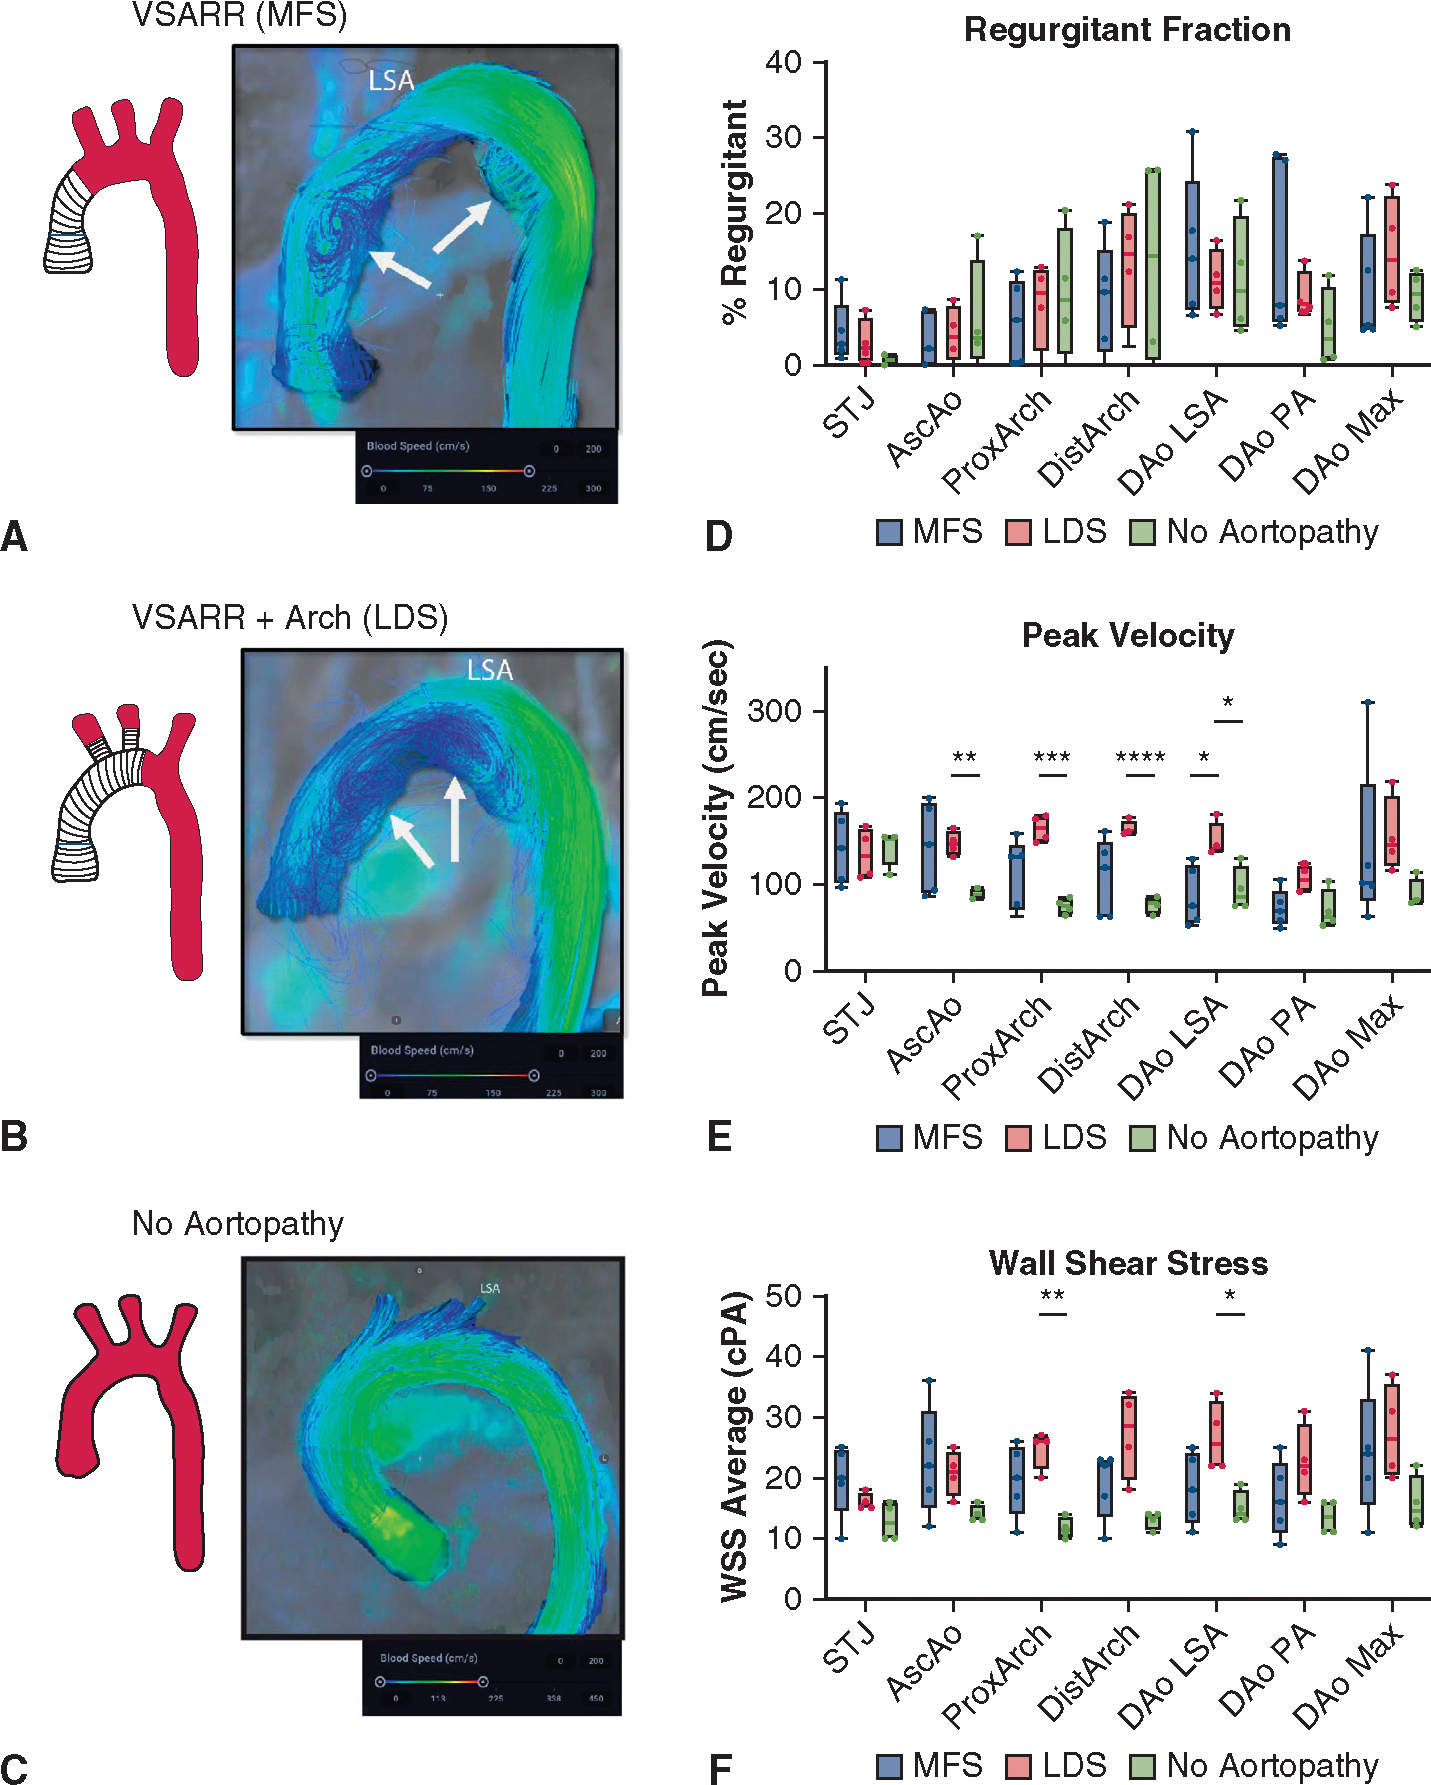
Four-dimensional flow MRI data after VSARR with or without aortic arch replacement. A, Representative flow image in MFS case. Arrows denote regions with prominent secondary flow patterns in the mid ascending and proximal descending aorta. B, Analogous image for LDS case with aortic arch replacement. C, Control (noaortopathy) images for comparison. D, Calculated data for regurgitant fractions by aortic segment in n = 4 LDS cases, n = 5 MFS, n = 4 controls. E, Wall shear stress throughout thoracic aortic segments. F, Peak flow velocity. For all box-and-whisker plots, the lines indicate range from minimum to maximum, upper and lower box borders indicate upper and lower quartiles, and the line indicates the median. *P < .05, **P < .01, ***P < .001. VSARR, Valve-sparing aortic root replacement; MFS, Marfan syndrome; LSA, left subclavian artery; STJ, sinotubular junction; DAo, descending aorta; PA, pulmonary artery; LDS, Loeys-Dietz syndrome; WSS, wall shear stress; cPA, centipascals.
Given these observations, we quantitatively compared regurgitant fraction, peak velocities, and wall shear stress throughout the thoracic aorta between groups. Mixed effects modeling was used to assess the impact of patient group, aortic segment, and interaction of these factors (segment × group) on hemodynamic parameters. We identified significant differences in regurgitant fraction as a factor of aortic segment (P = .009); however, these values did not differ significantly on the basis of patient group (P = .92) or interaction factors (P = .33, Figure 3, D, complete mixed model results in Tables E1 and E2). Conversely, peak velocity and wall shear stress demonstrated significant differences with respect to each factor (P < .05 for all comparisons). Segmental analysis of peak velocity measures revealed heightened velocity in patients with LDS within several graft segments (ascending aorta and throughout the arch) compared with controls. Patients with MFS, who showed greater variance as a group, did not reach statistical significance compared with controls (Figure 3, E). Within patients with aortopathy, patients with LDS had higher peak velocities compared with MFS only in the proximal descending aorta (just beyond left subclavian). No velocity differences were observed in the descending aorta. Patients with LDS similarly showed heightened shear stress within the proximal arch graft and proximal descending aorta relative to controls; however, there was no significant difference in these regions or the descending aorta when comparing patients with arch replacement (LDS) versus those without (MFS) (Figure 3, F).
Anatomically Segmented Aortic scRNAseq Identifies Smooth Muscle Cell–Mediated Vascular Remodeling in Loeys-Dietz Syndrome Tunica Media
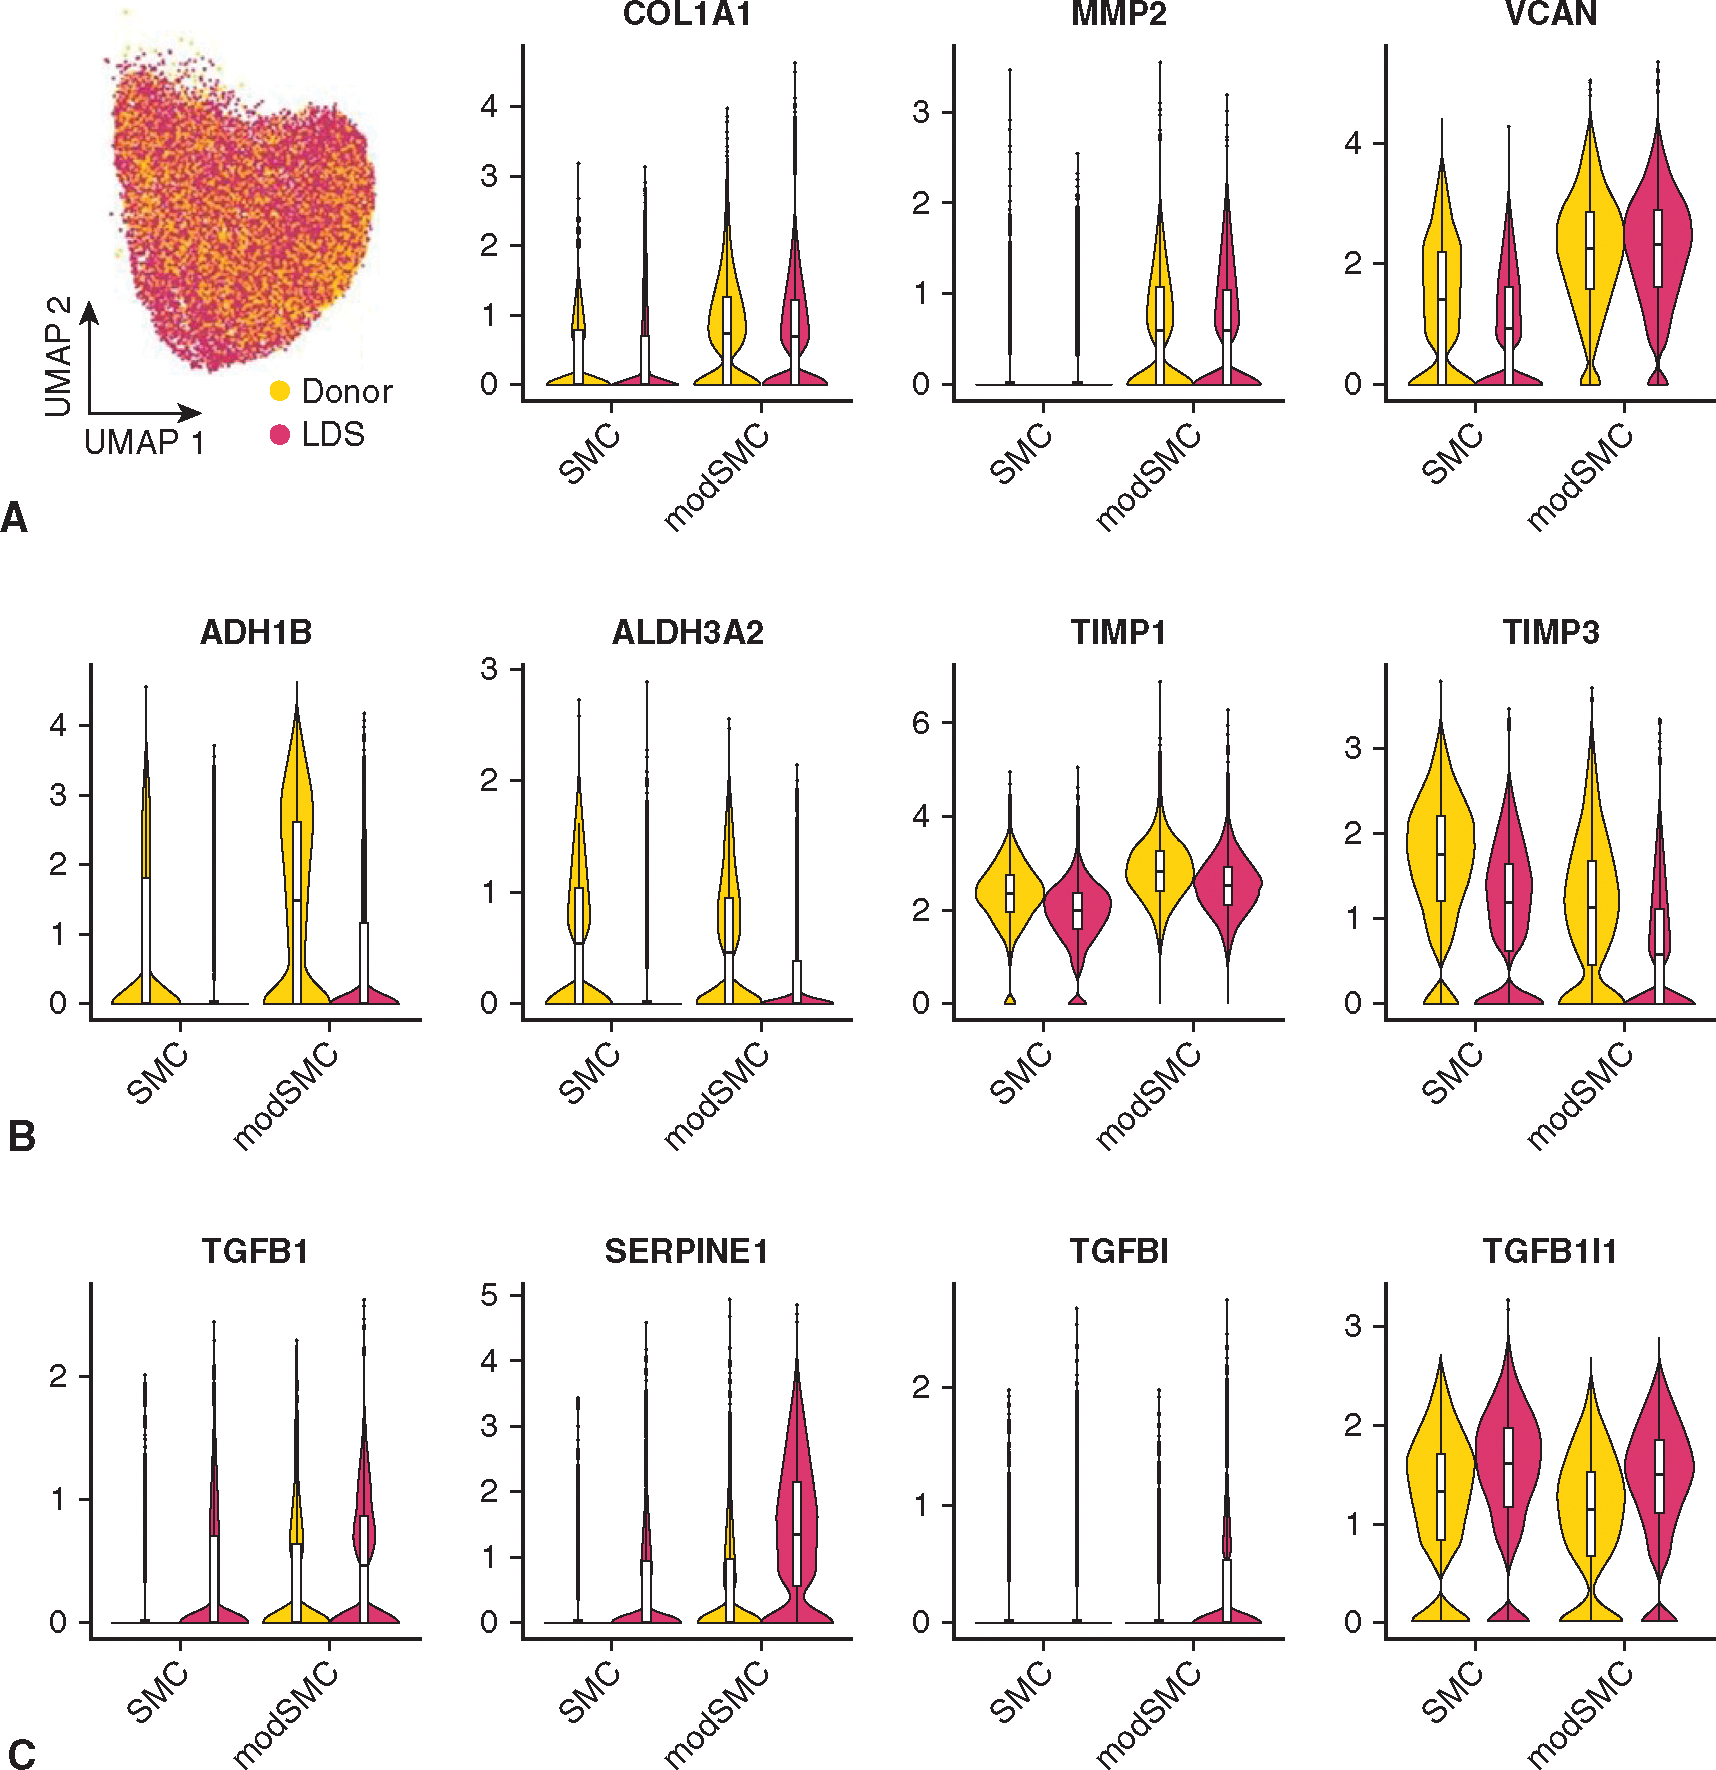
Altered SMC differentiation has been implicated in murine and in vitro models of LDS22,23; however, investigation of SMC phenotype in human LDS tissue is lacking. To enable an anatomically oriented survey of the aortic cellular landscape and specifically probe SMC phenotype in clinical LDS, we collected fresh aortic tissue from patients across the genotype spectrum (n = 1 TGFBR1, n = 2 SMAD3, and n = 1 TGFB2) and 2 abdominal organ donors declined for cardiac transplantation (Appendix E1 and Figures E1 and E2 show the details on dataset generation, quality control metrics, and cell type classification). Separate aortic root, ascending, and arch tissue specimens were prepared in parallel (Figure 4, A). To investigate SMC phenotype specifically, we performed unsupervised clustering analysis of this dataset (Figure 4, B), identifying 2 major SMC subsets (38.7% of the total dataset) comprising a typical contractile subset (SMC) and modulated (modSMC) partition distinguished chiefly by reduced expression of mature contractile genes (eg, CNN1, MYH11, SMTN) and heightened extracellular matrix (ECM) synthetic/proteolytic gene (eg, VCAN, FN1, COL1A2, MMP2) expression (Figure 4, C). Separating the SMC populations by disease state, we noted that cells labeled as modSMCs were detectable in all anatomic segments from both donor control and LDS samples (Figure 4, D). In experimental animal models, SMC phenotypic modulation occurs in aneurysmal disease as well as aortic atherogenesis24–27 and as a pathologic response to hypertension.28 Therefore, we consider SMC modulation a global transcriptomic response to vascular injury from various stimuli. Although donor control and LDS modSMCs shared a similar pattern of transcriptomic alteration from quiescent SMCs, as evidenced by their coclustering in uniform manifold approximation and projection visualizations, we hypothesized that SMCs activate distinct pathophysiologic programs in response to different pathological cues. Indeed, despite similar enrichment of central synthetic markers (eg, COL1A1, MMP2) (Figure E3), direct comparison of the modSMC population between donor control and LDS samples identified 436 differentially expressed genes. Among donor-enriched modSMC genes, we identified PDGFRB and LRP1 as genes with known SMC phenotype modulatory roles in atherosclerosis29–31 and degenerative aortic aneurysm (Figure 4, E).32,33 LDS modSMCs exhibited enrichment of several novel markers including TWEAK receptor (TNFRSF12 A), regulator of cell cycle (RGCC), and multifunctional cell surface receptor CD44. Critically, LDS modSMCs also demonstrated significantly enriched expression of TGFB1 and TGFB2 ligands, and TGF-ß–responsive genes SERPINE1, TGFBI, and TGFB1I1 (Figure 4, F), consistent with a signal of overall enhanced TGF-ß signaling activation in LDS aortas.
FIGURE 4.
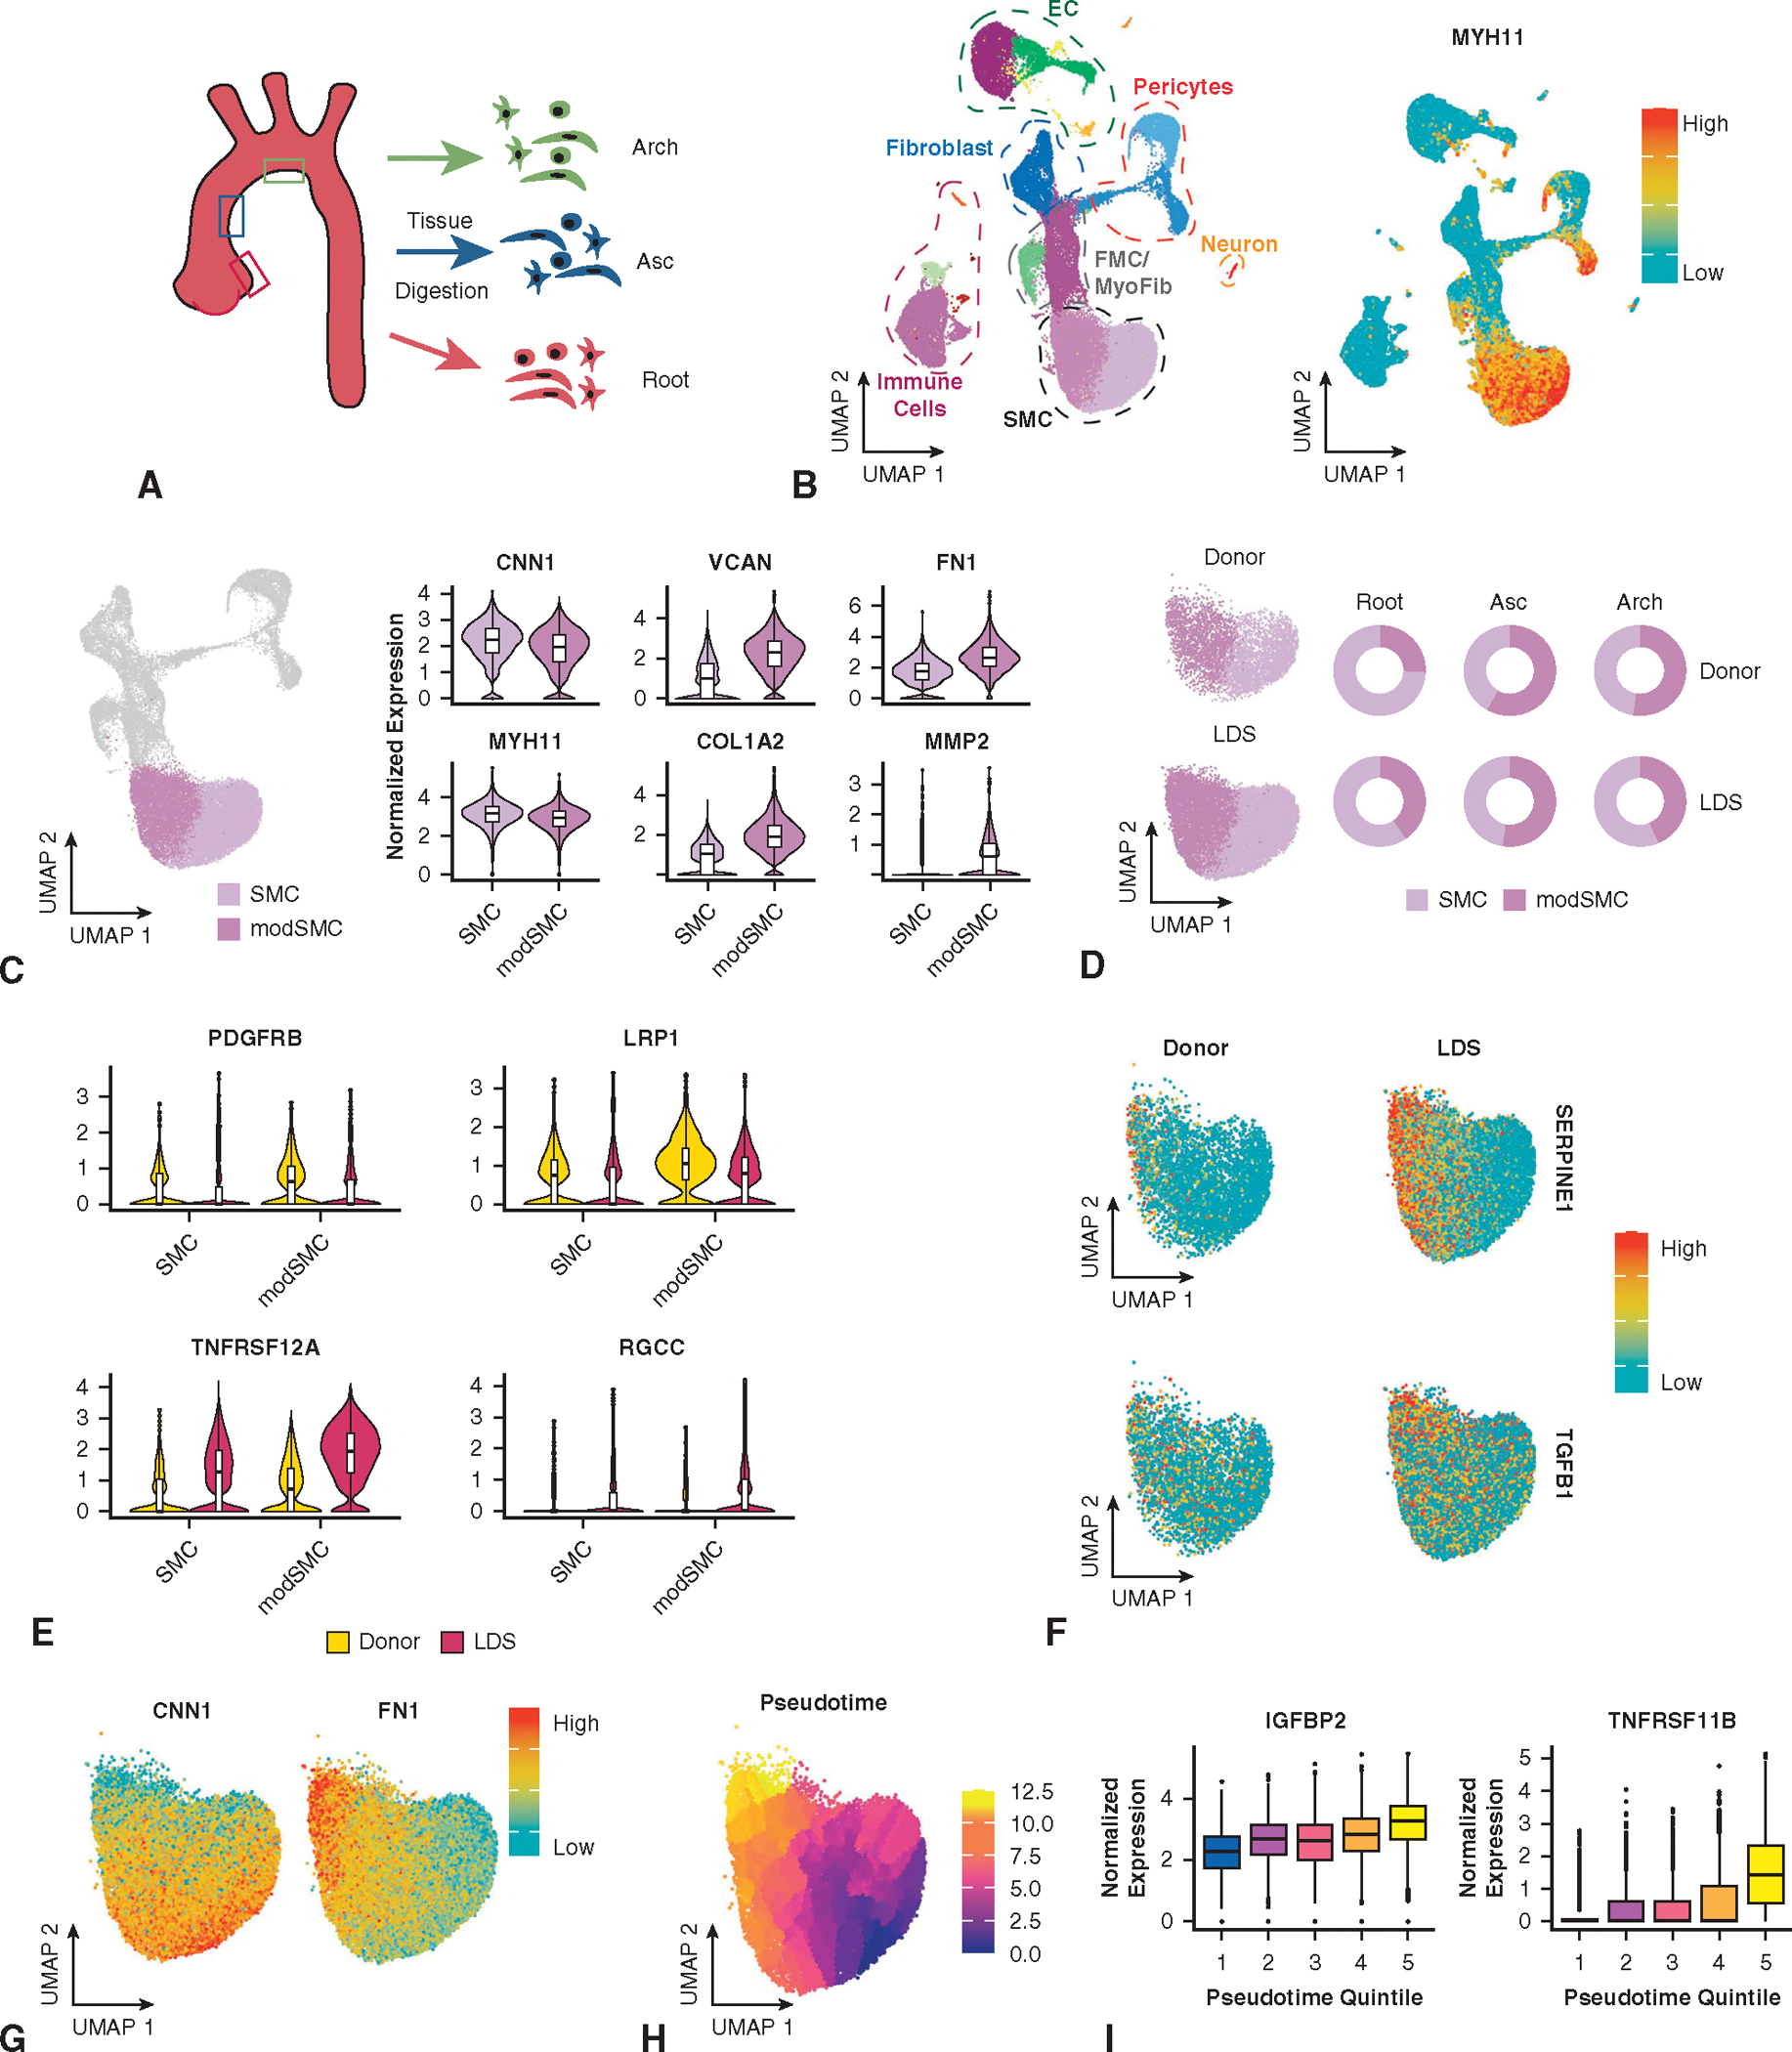
Segmental aortic scRNAseq dataset from patients with LDS and donors. A, Experimental protocol. Separate tissue samples from the aortic root (sinus of Valsalva), mid ascending aorta (Asc), and lesser curve of the aortic arch were digested, sorted, and processed for single-cell capture and RNA sequencing. B, Total dataset comprising all major aortic cell types (left) with expression distribution for validated SMC marker (contractile gene MYH11) on right. C, SMC subsets selected from unsupervised cell clustering. SMC cluster characterized by peak expression of contractile genes (eg, MYH11, CNN1), and the modSMC population demonstrated enriched ECM synthetic and proteolytic genes. D, Dataset stratification by genotype and segment. SMC and modSMC subtypes are present in all samples. E, Violin plots for representative genes with enriched modSMC expression in donor (top) or LDS samples (bottom). Boxes denote interquartile range (IQR), line denotes median, whiskers extend 1.5 IQR from box hinges. F, LDS samples demonstrate enriched expression of TGF-ß–related genes including SERPINE1 and TGFB1. G, Cells within the SMC-modSMC continuum show graded reduction of contractile genes and concomitantly enriched synthetic genes (eg, fibronectin [FN1]), consistent with a gradual shift in phenotype. H, Pseudotemporal scoring reflects SMC phenotype progression across a continuous, rather than binary scale. I, Dynamic expression of modSMC markers including insulin-like growth factor binding protein-2 (IGFBP2) and osteoprotegerin (TNFRSF11 B). EC, endothelial cell; FMC, fibromyocyte; SMC, smooth muscle cell; LDS, Loeys-Dietz syndrome; TGF-ß, transforming growth factor-beta.
Given the identification of macroscopic intimal plaque in donor tissue, we questioned whether donor control and LDS modSMCs may also reside in spatially different domains within the aortic wall according to distinct pathologies. To identify the modSMC population histologically, we sought common genes marking phenotypic shift from contractile to modSMCs irrespective of genotype. As in our prior investigations of SMC phenotype in MFS human and mouse samples, we observed that gene expression patterns reflected continuous, rather than bimodal distributions (Figure 4, G), consistent with a gradual phenotypic continuum directed toward a fibroblast-like state. To more quantitatively study this, we harnessed the granular nature of scRNAseq data by constructing a continuous trajectory of the entire SMC-modSMC phenotype across a shift in cell phenotype, generating numerical pseudotime values corresponding with the position of individual cells along a phenotypic spectrum using Monocle3.34 This technique capitalizes on the heterogeneity within scRNAseq data to assess gene expression continuum (Figure 4, H). Within this construct, we selected IGFBP2, a multifunctional gene we previously identified as an early marker of aortic SMC modulation in mice11,28 and potential biomarker for aortic aneurysm35 and TNFRSF11 B, a conserved marker of advanced modulation in atherosclerosis25 and aneurysm disease (Figure 4, I). RNA in situ hybridization for these markers in donor control tissue identified patchy IGFBP2 expression in the aortic tunica media and foci of rare TNFRSF11B-expressing cells in the tunica media with dispersed clusters of positive cells in the thickened intima layer (Figure 5, A). Conversely, examination of tissue from patients with LDS identified transmural modSMCs in all aortic segments, with gradually reduced density in the ascending aorta and arch (Figure 5, B).
FIGURE 5.
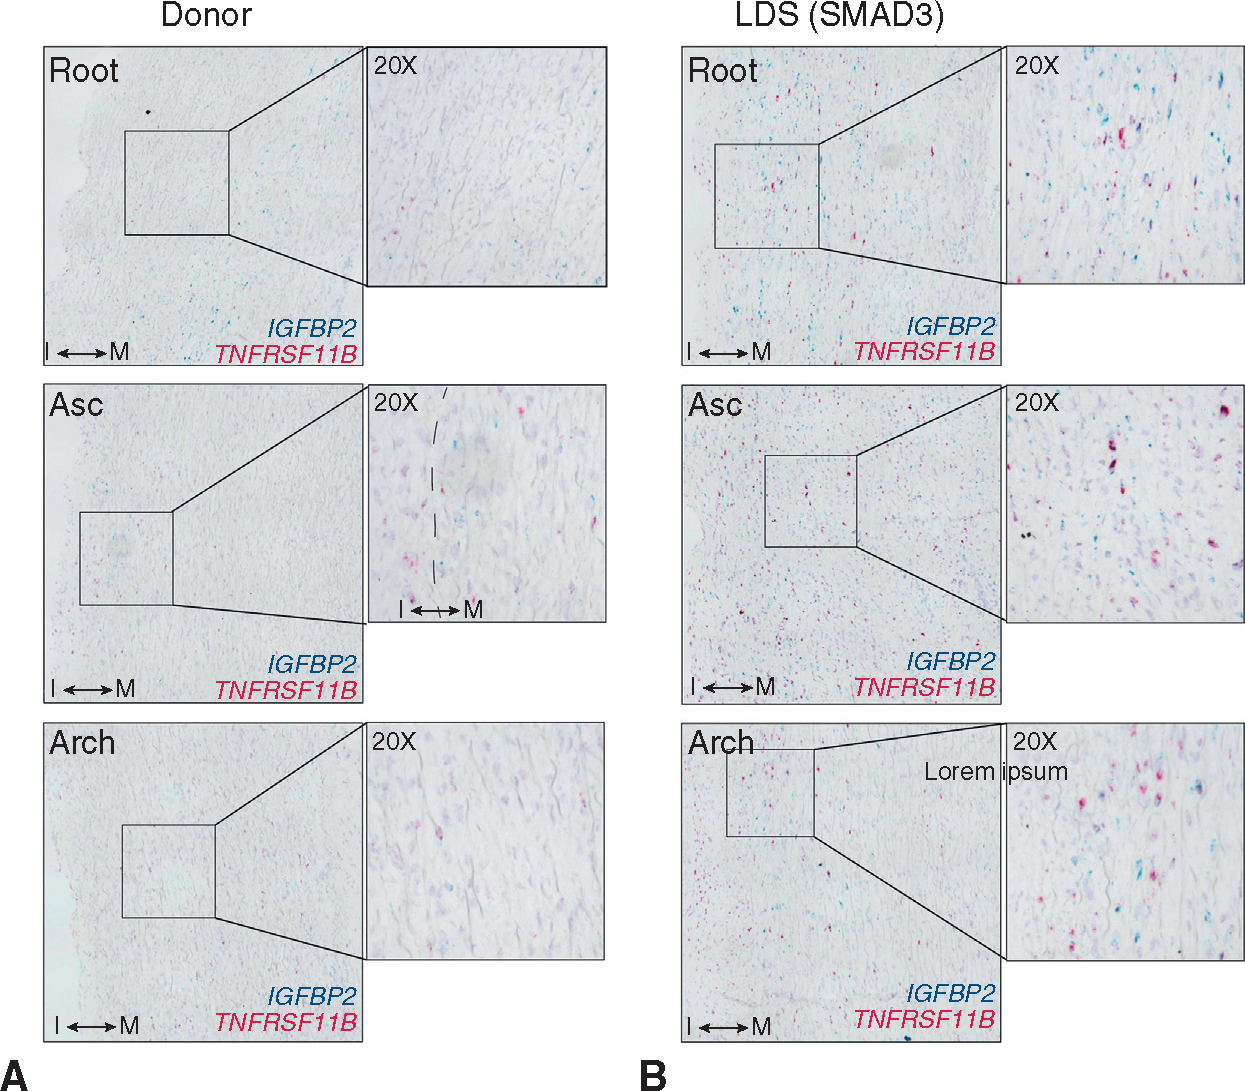
Histologic evaluation of modSMC tissue distribution A, Duplexed chromogenic RNA in situ hybridization for modSMC markers (IGFPB2, TNFRSF11 B) in donor control tissues spanning form aortic root to aortic arch. “I” indicates tunica intima layer. “M” indicates tunica media. Dashed line indicates transition between layers. B, Analogous, simultaneously performed RNA in situ hybridization in a patient with LDS with SMAD3 variant. LDS, Loeys-Dietz syndrome; Asc, ascending aorta.
Smooth Muscle Cell Modulation Impacts Critical Cell-Extracellular Matrix Interactions in Concert With Enriched Transforming Growth Factor-ß Signaling
Having confirmed that aortic SMC modulation represents a spatially distinct process within remodeling LDS aortas, we next sought to comprehensively profile the dynamic gene expression changes associated with SMC phenotypic evolution in LDS specifically. After sub-selecting only cells from patients with LDS, we directly compared the 2 subclusters, identifying 392 genes (260 enriched, 132 suppressed, Table E3) with differential expression defining the transition to modSMC. To identify functional pathways affected by these genes, we first ranked them by fold change and then performed gene set enrichment analysis for annotated gene ontology pathways using clusterProfler,36 identifying 90 statistically significant pathways (31 suppressed, 59 enriched). Suppressed pathways predominantly included various protein translation pathways reflecting reduced transcripts for multiple ribosomal genes and muscle contraction, and enriched pathways included multiple pathways related to cell-ECM interaction, integrin-mediated signaling, and response to TGF-ß signaling (full pathway list in Table E4). To assess the landscape of phenotype change in terms of biologic processes, rather than single genes, we generated composite expression values for all genes within these annotated gene ontology gene sets and plotted these scores as a function of pseudotime. In each case, this highlighted the incremental, rather than binary, nature of SMC phenotypic evolution toward the modulated identity (Figure 6, A). We next examined the individual gene-level changes driving enrichment of cell-ECM interaction and signaling pathways, identifying coordinated overexpression of diverse collagen isoforms, ECM glycoproteins, proteoglycans, elastin fiber components, and multiple integrin receptor subtypes in concert with reduced expression of mature contractile SMC markers and cytoskeletal genes (Figure 6, B). We then performed functional interaction gene network enrichment analysis to more comprehensively identify the core biologic functions affected during LDS SMC phenotype evolution. This analysis identified a network of tightly interrelated modules of overlapping cellular processes surrounding cell-matrix interactions, SMC contractile/cytoskeletal homeostasis, and cell signaling pathways including TGF-ß (Figure 7).
FIGURE 6.
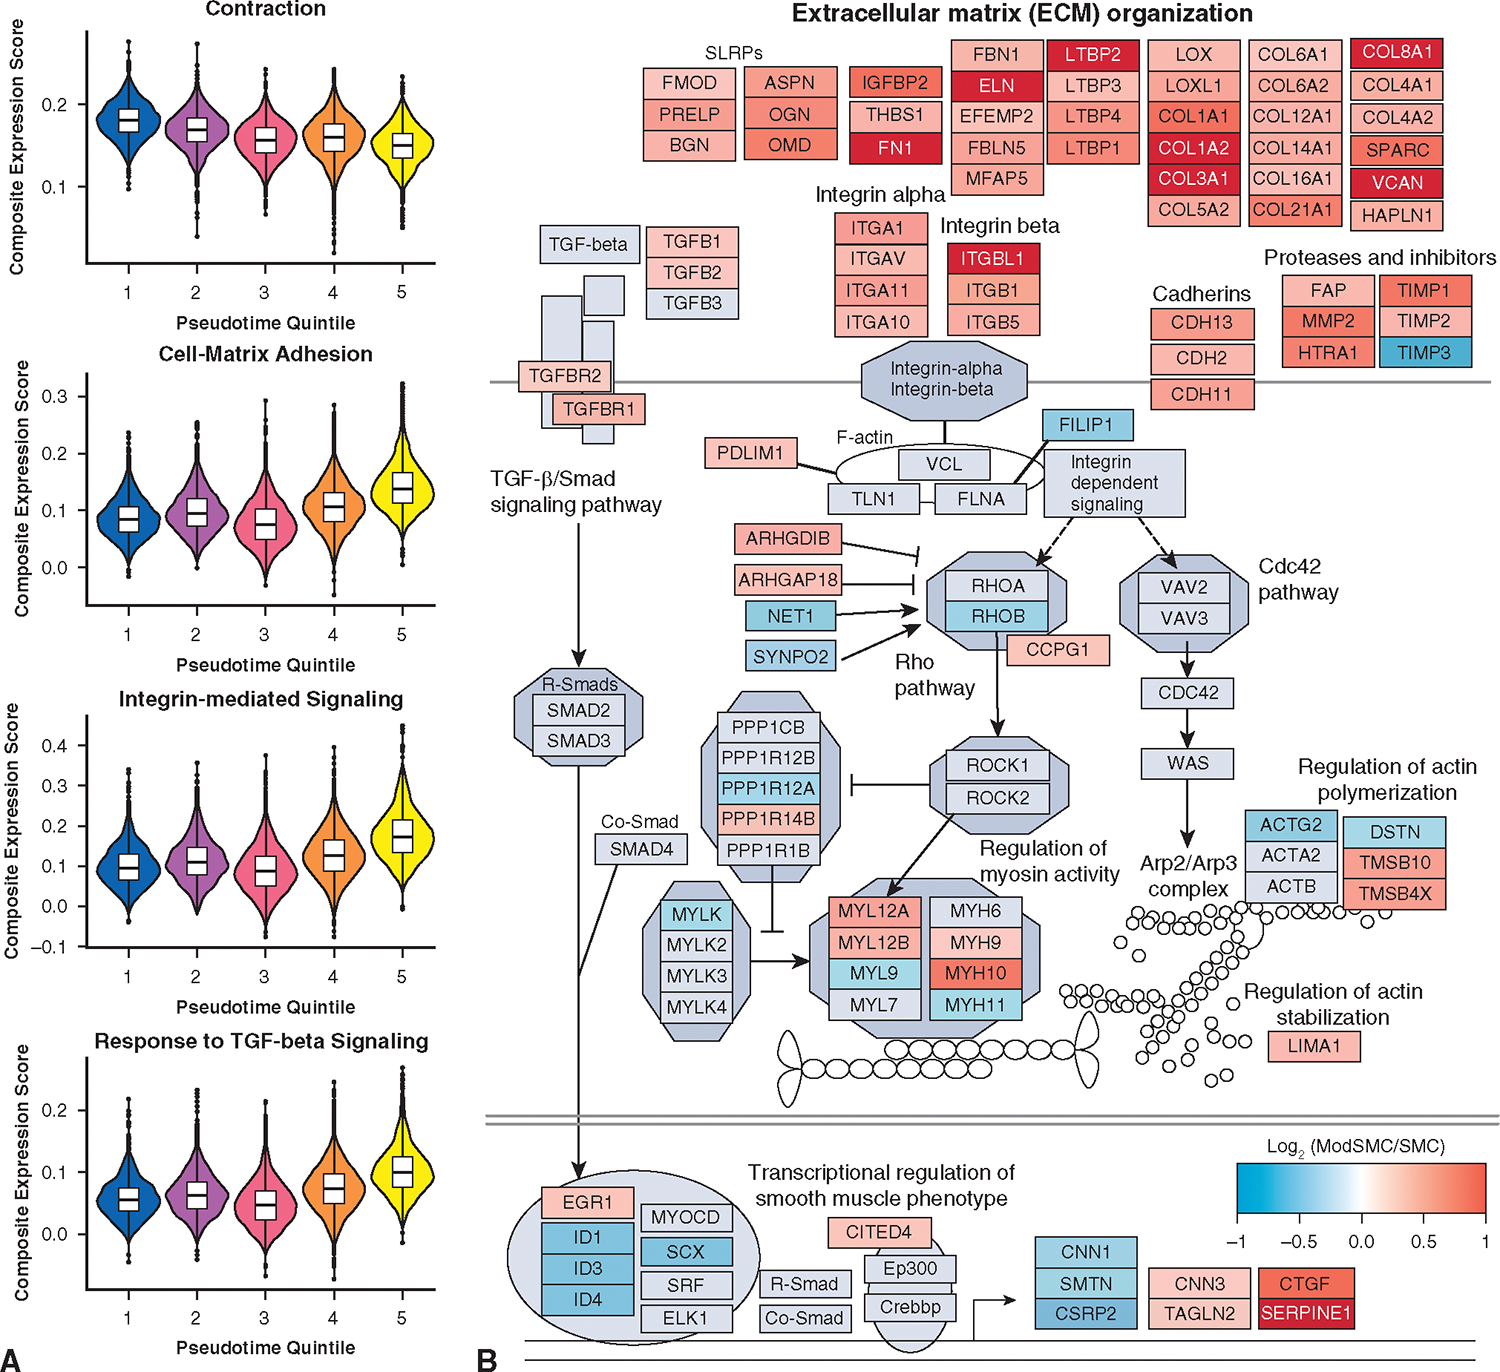
Pathway analysis of LDS SMC phenotype modulation signature. A, Representative pathways with statistically significant differences between SMC and modSMC subset. Module scores represent composite value for all genes within denoted gene ontology gene sets plotted across the pseudotemporal spectrum for the entire SMC-modSMC continuum. Boxes denote IQR, line denotes median, whiskers extend 1.5 IQR from box hinges. B, Custom pathway diagram constructed from curated WikiPathways (WP523, WP6, WP85, WP113) with superimposed gene expression data for modSMC versus SMC comparison, highlighting broad evolution of ECM components and related focal adhesion/contractile apparatus in association with TGF-β signaling. TGF-ß, Transforming growth factor-beta; SMC, smooth muscle cell.
FIGURE 7.
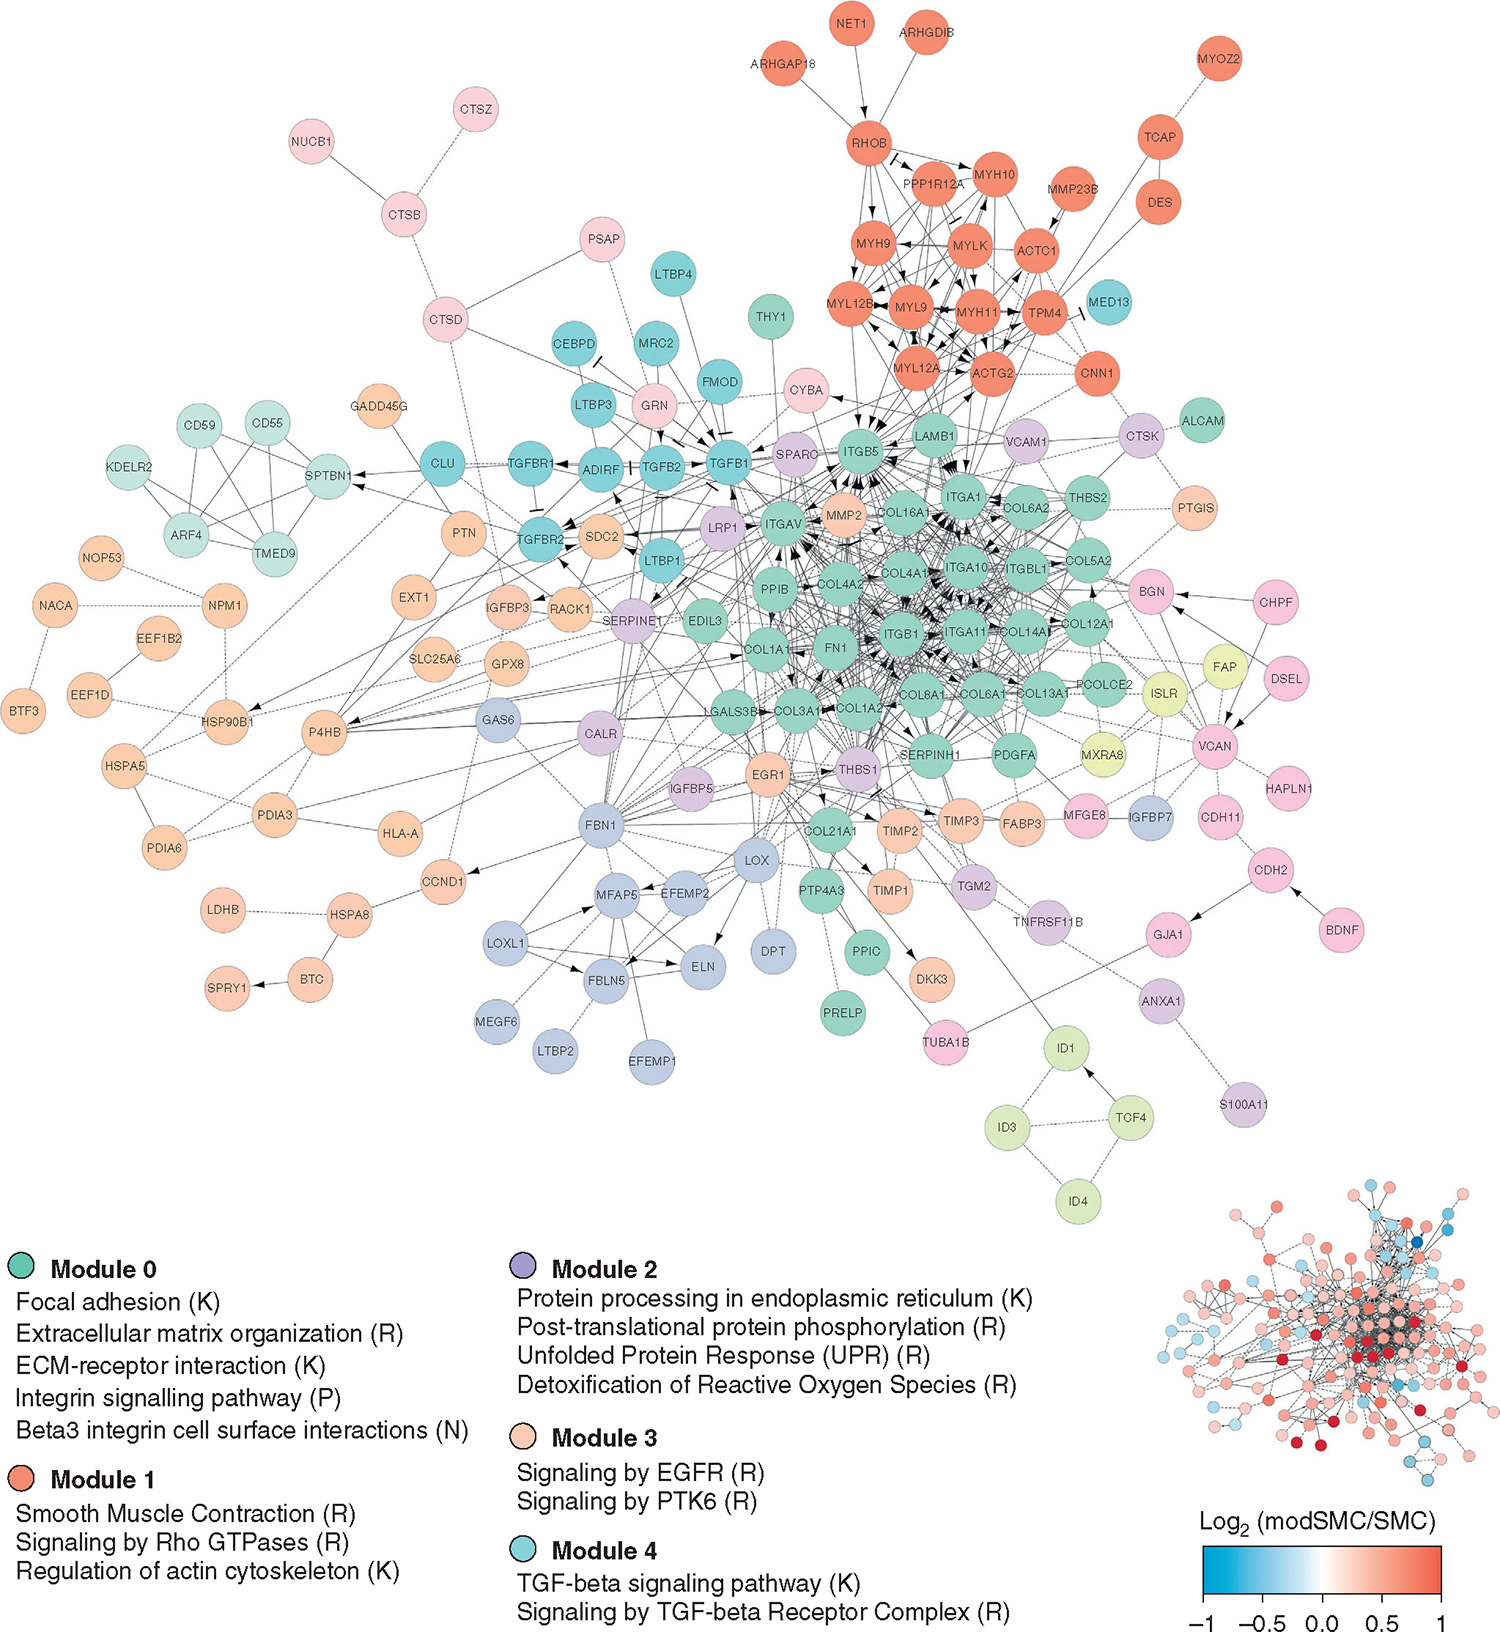
Functional interaction gene network enrichment analysis for differentially expressed genes in modSMC relative to SMC. Core enriched modules center around adhesive and contractile pathways (modules 0 and 1) and cell signaling pathways (modules 3 and 4). Scale bar and miniaturized interaction network depict single gene-level data for logarithmic fold change within denoted gene. TGF-ß, Transforming growth factor-beta; SMC, smooth muscle cell.
DISCUSSION
Clinical Implications
The determination of optimal timing of aortic root replacement in patients with LDS currently relies on clinical judgement using serial aortic measurements integrated with family history and an evolving understanding of relative risks of various genotypes.4,37 Although diligent surveillance and timely VSARR can effectively prevent acute type A aortic dissection and preserve native valve function, accumulating evidence from limited available midterm follow-up data demonstrates a troublesome rate of distal aortic events in patients with LDS. In the largest published retrospective series of patients with LDS who underwent elective aortic root replacement (n = 67), the surgical group at Johns Hopkins reported 12% of patients required secondary arch operations during a mean follow-up of 6.2 years, compared with only 1.3% of patients with MFS.8 Notably, this study did not report the various genotypes of patients who did and did not require arch reintervention. Likewise, a smaller Japanese series of 24 patients with TGFBR1 or TGFBR2 variants highlighted greater incidence of arch reintervention and distal aortic dissection relative to patients with MFS.9 In our own institutional experience of n = 574 patients who underwent VSARR for root aneurysm (including n = 166 MFS, n = 39 patients with LDS of all subtypes), patients with LDS had significantly higher cumulative incidence of type B dissection compared with patients with MFS and nonsyndromic patients (estimated 15-year incidence 30% vs 10% vs 1%). Collectively, these clinical observations across multiple aortic centers have prompted consideration of a more aggressive prophylactic arch replacement strategy, although the additional short- and long-term risks associated with this strategy are uncertain. Notably, a recent report of the LDS experience at Yale reported that 2 of 15 (13.3%) genetically confirmed patients with LDS had distal aortic events in a median 5-year follow-up from replacement in proximal aortic repair (type B dissection in a TGFBR2 patient and arch reoperation in a TGFBR1 patient).38 These data further underscore the heightened aggressiveness of TGFBR1/2 variants, although the authors concluded from this data that routine arch LDS may not be warranted.
In the first prospective investigation of prophylactic aortic arch replacement during elective VSARR, we demonstrate excellent initial outcomes without undue morbidity when performed by an aortic surgical team with extensive experience treating patients with connective tissue disorder. Although this initial experience is limited in scope (n = 8 patients) because of the rare incidence of patients with LDS, we conclude that this approach is technically feasible and safe but will require both mid- and long-term follow-up and a larger cohort to ultimately determine efficacy. Notably, we observed that all patients with LDS in this study had a very distal left subclavian artery takeoff, creating difficulty in accessing the distal arch/proximal descending aorta via sternotomy. We performed zone 2 arch replacements to minimize the risk of complications for this prophylactic strategy. Nevertheless, we advocate for total arch replacement when technically feasible. In addiion to directly preventing arch aneurysm via prophylactic resection, we speculate that this approach may reduce the overall risk of type B dissection for patients with LDS; however, this will be discernible only through long-term follow-up. We note that this strategy also confers several advantages in the lifelong management of patients with LDS. First, the risk of retrograde extension into tthe arch after a type B dissection is obviated. Furthermore, arch replacement establishes an advantageous position in the event of future descending aneurysm or type B dissection, either of which could be repaired in a single stage through a left thoracotomy or thoracoabdominal approach, preventing the need for redo sternotomy and complicated arch reoperation. These advantages would be negated by even a low frequency of death or serious complication from initial VSARR + arch operation; therefore, we emphasize that this strategy should be undertaken only by surgeons/centers with expertise in connective tissue disorders and substantial aortic arch experience after a thorough informed consent discussion.
Hemodynamic Data and Implications for the Residual Thoracic Aorta
Although prophylactic Dacron graft replacement of the arch obviously eliminates the possibility of dissection or aneurysm formation of the replaced segment, altered hemodynamics downstream might predispose the native residual aorta to future degeneration. Abnormal flow patterns and heightened wall shear stress just distal to the graft-to-native aorta anastomosis have been observed in prior studies using 4D flow MRI after VSARR, which at least partially may be due to altered geometry, conduit material, or aortic kinking. We compared 4D flow MRI measurements in a small cohort of VSARR + arch (LDS) patients with VSARR (MFS) to determine if arch replacement simply shifts the abnormal aortic wall stress to the downstream aorta, putting those sections at greater risk. As expected, we found higher peak velocity ranges within the Dacron grafts of all postoperative patients. Although this initial investigation also demonstrated slightly higher velocity and maximum shear stress immediately distal to the arch graft in patients with LDS, the maximum velocities were within the range of peak velocities observed in the descending aorta in patients with MFS after VSARR. Similar patterns of regurgitant fraction and wall shear stress in the proximal descending aorta were also observed in both surgical groups, although these conclusions are limited by small sample size and different genotypes between groups (MFS vs LDS). Secondary flow patterns within the proximal descending aorta, a region of focal relative diameter enlargement, were present irrespective of distal anastomosis in the ascending aorta versus arch. Although the long-term risk for distal aortic aneurysm/dissection remains uncertain, our observations do not suggest that shifting the distal graft-to-aorta anastomosis further downstream induces any overtly detrimental effects on the postoperative hemodynamic profile.
Dynamic Smooth Muscle Cell Phenotype in the Loeys-Dietz Syndrome Thoracic Aorta: Ubiquitous Signal for Transforming Growth Factor-ß Activation
Despite substantial progress in the understanding of SMC pathology in aortic aneurysm pathology22,39–42 and advancing medical genetics for patients with LDS, the role that SMC phenotype change plays during aneurysm formation in LDS is currently undetermined. We applied scRNAseq to LDS human aortic tissue to generate new hypotheses and possible targets for future mechanistic study of aneurysm formation in LDS. Our data identify a similar pattern of SMC phenotypic evolution in LDS as that described in MFS human and mouse tissues.11 Overall, we regard both the dynamic gene expression changes throughout the SMC-modSMC phenotype spectrum and the spatial distribution of these cells as the most meaningful finding from our scRNAseq data. Globally, we hypothesize that these gradual, programmed transcriptomic changes lead to enhanced elastolysis and collagen deposition, ultimately leading to enhanced aortic stiffness and wall strain, which are characteristic of thoracic aortic aneurysm pathology.
Our scRNAseq data confirmed the presence of abnormal SMC gene expression changes both within the aneurysmal aortic root and into the normal diameter arch, although at a gradually reduced density. SMCs demonstrated phenotypic modulation toward a fundamentally synthetic phenotype particularly with respect to collagen expression, while also progressively enriching adhesion molecules (eg, integrins, cadherins), elastolytic enzymes (eg, MMP2), and TGF-ß signaling components. These findings highlight the critical role of dynamic ECM-SMC contractile unit in thoracic aneurysm and the inimitable relationship between TGF-ß and these processes.43,44 The enrichment of TGF-ß ligands, receptors, and signaling-responsive genes (eg, SERPINE1, CTGF, COL1A1, FN1) in LDS supports a role for overactive TGF-ß signaling as a driver of progressive SMC phenotype evolution in LDS, a feature shared with the SMC phenotype modulatory process in MFS. Proving a functional role for TGF-ß in SMC phenotype shift in human-derived samples remains difficult given the pleiotropic effects of this signaling molecule using in vitro systems.45 Furthermore, although we cannot definitely determine whether modSMCs promote aneurysm progression directly or perform some partially restorative role within a primarily impaired aortic wall, the presence of these abnormal SMC phenotypes within the tunica media reliably serves as a marker for aortic remodeling in aneurysm.11,28,45 In that respect, we hypothesize that modSMC presence within the nondilated arch reflects molecular proof of ongoing pathology, which may explain the predisposition for future arch aneurysm/dissection risk. This finding also suggests that SMC modulation may represent an important initiating event in aneurysm formation.
Although the rarity of LDS operations precludes an adequately powered randomized clinical trial to discern the benefits of a prophylactic arch replacement strategy stratified by genetic subtype, we submit that the heightened propensity for late arch aneurysm in LDS and evidence of ongoing SMC-mediated aortic arch remodeling despite the complete lack of aneurysmal dilation support the consideration of concomitant arch replacement in patients with low surgical risk. Although we currently use this proactive approach across the LDS spectrum, accumulating outcomes data for larger cohorts of patients with LDS may ultimately alter this decision-making for patients with less aggressive phenotypes.
Study Limitations
Analyses within this study are inherently limited by the rare frequency of patients with LDS in the population and within our surgical cohort. Accordingly, our results are intended to represent a proof-of-concept for a more aggressive surgical approach to LDS. Close monitoring of these patients and additional patients with LDS over the coming years will be critical to determine the long-term consequences of this strategy. Likewise, MRI data from this relatively small cohort may not adequately reflect the nuanced ways in which a fundamentally different aortic construction in VSARR + arch operations affect the flow patterns and stresses in the distal aorta. The random effect models are derived from nonrandomized data, and the estimates and their associated P values should be interpreted as useful summarizations rather than in the traditional sense used in randomized trials (ie, assessing population-level differences).
Although our scRNAseq dataset provides the first high-resolution insight into the in vivo consequences for loss-of-function variants in critical TGF-ß signaling components in human patients, analyses without consideration of the spectrum of clinical disease aggressiveness between distinct genotypes/LDS subtypes limit our ability to discern distinctions between more clinically severe (TGFBR1/TGFBR2) variants and less aggressive (SMAD3/TGFB2) subtypes. In the future, a broader survey of multiple banked biologic replicates from distinct LDS subtypes may identify potential clinically relevant differences in aortic cellular behavior across the phenotype spectrum.
We note that the relative abundance of cell types may be inadvertently influenced at numerous points during sample processing. These factors clearly influenced the efficiency of SMC/modSMC capture, given the similar ratios of these cells between samples in scRNAseq data (Figure 4, D) but varying modSMC density using histologic techniques. This highlights the importance of using orthogonal techniques—in this case scRNAseq to determine cell identities and histologic studies to identify cells of interest in physical space—to fully deconstruct tissue phenotype at the single-cell level. Although we identified numerous genes and pathways with differential activation in LDS SMCs specifically, it is likely that LDS variants affect phenotypic homeostasis in other aortic cell types (eg, fibroblast, endothelial, inflammatory, and adventitial microvascular cells) that may participate in aneurysm progression39,46 and merit devoted investigation. Additionally, the presence of multiple variables within our scRNAseq dataset (genotype, sex, aortic segment) is likely to introduce error during the multiple separate pairwise comparisons used in the analysis of this complex dataset. Because these technical considerations undoubtedly lead to some amount of statistical noise, we emphasize that single-gene level results may be confounded, and we have endeavored to focus our analyses on central pathways of biologic interest where possible to generate a broad understanding of unique behaviors of individual cell types based on single variables.
Finally, this study is inherently limited by the lack of truly healthy control samples for comparison. The requirement for aortic root tissue mandated that tissues could be recovered only from donors not suitable for cardiac transplantation. Consequently, despite the relatively young age, both donors examined in this study had significant risk factors for cardiovascular disease (eg, smoking, hypertension) and diffuse atherosclerotic burden, all of which are known to promote SMC phenotype modulation.25,28,47 This limitation precludes definitive conclusions about the normal SMC phenotype in human aortic tissue.
CONCLUSIONS
Nevertheless, comparisons between patients with LDS and donors provided insight into disease-relevant gene signatures, particularly with respect to the role of TGF-ß in LDS aneurysm. Furthermore, the spatial distribution of modSMCs in the LDS aortic tunica media reflects the distinct pathology involved in aortic aneurysm compared with intimal/atherosclerotic processes.
PERSPECTIVE.
Patients with LDS carry a heightened risk of distal aortic events after root replacement surgery. This study highlights acceptable early clinical outcomes and no clearly detrimental distal flow patterns in patients with LDS treated with aortic root and prophylactic arch replacement. High-resolution aortic cellular phenotyping identified ongoing tissue remodeling in the macroscopically normal diameter LDS arch.
Acknowledgments
The authors thank the staff scientists at the Stanford Genome Sequencing Service Center for critical assistance in single-cell RNA library preparation and sequencing.
This work was supported by grants from the National Institutes of Health F32HL154681 (A.J.P.), F32HL160058 (A.R.D.), R01HL157949 (M.P.F.), K08HL153798 (P.C.), R01HL139478 (T.Q.), R01HL145708 (T.Q.), R01HL134817 (T.Q.), R01HL151535 (T.Q.), R01HL156846 (T.Q.), and UM1HG011972 (T.Q.); a Human Cell Atlas grant from the Chan Zuckerberg Foundation (T.Q.) and from the American Heart Association #834986 (R.S.), 20CDA35310303 (P.C.).
All elements of this study were prospectively approved by the Institutional Review Board at Stanford University (#23395). Approved September 29, 2022.
Abbreviations and Acronyms
- ECM
extracellular matrix
- 4D
4-dimensional
- LDS
Loeys-Dietz syndrome
- MFS
Marfan syndrome
- modSMC
modulated smooth muscle cell
- MRI
magnetic resonance imaging
- scRNAseq
single-cell RNA sequencing
- SMC
smooth muscle cell
- TGF-ß
transforming growth factor-beta
- VSARR
valve-sparing aortic root replacement
APPENDIX E1. ORGAN DONOR CONTROL TISSUES
Aortic tissues were collected at the time of abdominal organ preservation from donors deemed unsuitable for cardiac transplant. Although donors were young (n = 1 male age 39 years and n = 1 female age 38 years), both had significant history of poorly controlled hypertension and other cardiovascular risk factors (smoking, obesity, amphetamine use). Gross inspection and histology identified substantial atherosclerotic plaque in the coronary arteries and diffuse fibroatheroma in the aortic intima Figure E1.
TISSUE HANDLING AND DIGESTION
Aortic tissues from patients with LDS were collected immediately upon resection in the operating room and kept in Hanks balanced salt solution (HBSS) on ice until processed. Separate tissue pieces from the noncoronary sinus of Valsalva (root), mid ascending aorta, and lesser curve of the aortic arch were used for each study subject. Donor samples were preserved in cold UW solution on ice during transport for a period of 1 to 3 hours. Small sections of each specimen were placed in 4% paraformaldehyde for histologic analysis. Perivascular fat was meticulously removed with scissors and multiply rinsed to remove any residual blood from the adventitial surface, which may inhibit enzymatic activity. The tissue was then dissected into 3 × 3-mm sections and weighed. Four individual pieces weighing 70 to 90 mg each and composed of all vascular layers were then finely minced in digestion buffer (Liberase [Millipore-Sigma, Burlington, Mass] 10.4 U/mL, elastase [Sigma #E7885] 8 U/mL in HBSS). Minced tissue was then transferred into an orbital shaking heat block prewarmed to 37C and rotating at 750 RPM. Tissue pieces were mechanically disrupted by gentle repeated pipetting and kept in the heat block shaking for 60 to 75 minutes until all residual tissue was digested. Digestate was then passed through a 70-μm filter and centrifuged at 500 × g for 5 minutes. After supernatant removal, cell pellets were resuspended 200 μL of HBSS without magnesium or calcium.
CELL SORTING AND SINGLE-CELL RNA CAPTURES
Cell suspensions were sorted using a Sony SH800S cell sorter toss exclude debris and cell clumps. Calcein green (ThermoFisher Scientific #C34852) was added to each sample to enable positiveselection of livecells. 50,000 live cells from each aortic segment were sorted into 1.5 mL tubes and transported to the Stanford Genomics core laboratory. All library preparation steps were performed by this core laboratory using the Next GEM Single Cell 3’ v3.1 reagent kit according to supplier instructions. Samples were sequenced sequentially on a NovaSeq 6000 device due to large time intervals between sample collections.
SINGLE-CELL RNA SEQUENCING ANALYSIS
We combined datasets from all patients with LDS and donors. Raw sequencing data across multiple sequencing runs were processed into gene expression matrices using Cell Ranger Single-cell software suite 6.1.2 using the data aggregating (‘aggr’) pipeline to normalize read depth between samples. Reads were then aligned to the human genome (GRCh38). The combined final output filtered expression matrices was then imported into the Seurat package in R and built into a Seurat object using the CreateSeuratObject function. Thresholds for individual cell read counts (nCount_RNA) and genes (nFeature_RNA) were determined by excluding indices (cells) with counts outside of normal distributions for these variables. Cells with more than 7.5% mitochondrial gene content were excluded as outliers after assessing the normal distribution for this metric within the total cell population (pre- and postquality control date in Figure E2, A). Samples were then demultiplexed by barcode and integrated with reciprocal PCA to identify feature anchors between samples.
After dataset integration, 49,294 cells with a median of 2624 genes per cell (IQR, 2105–3187) were jointly analyzed via principal component analysis, dimensional reduction, and clustering (quality control metrics for merged dataset presented in Figure E2, B). We first assessed the global cellular architecture by clustering cells at low resolution, identifying all major aortic cell types (Figure 3, B) via enrichment for typical gene markers including 2 SMC subtypes (expressing MYH11, CNN1), fibroblasts (CFH), 2 clusters of pericytes (NOTCH3), 4 endothelial cell types (PECAM1), immune cells (FCER1G), and a rare neuronal population (S100 B).
Where differential expression testing is described in the text, a pairwise Wilcoxon signed-rank test was performed for all cells in 1 category versus all cells in the other. Resulting P values were adjusted using Bonferroni correction for multiple comparisons. All values reported as statistically significant satisfy P less than .05 after correction for multiple comparisons. Pseudotime analysis was performed using the Monocle3 package and built-in Seurat wrapper.
GENE SET ENRICHMENT ANALYSIS
The differentially expressed gene list between modSMCs and SMC was used as input for gene set enrichment analysis using the clusterProfiler package in R. Genes were ranked by average log2 fold change. Module scores for pathways of interest were then generated within Seurat by generating a sum for the expression values of all genes within the denoted gene ontology.
REACTOME FUNCTIONAL INTERACTION GENE NETWORK AND PATHWAY ENRICHMENT
A total of 394 transcripts were found to be differentially expressed between modSMC and SMCs in the LDS samples using a threshold of 0.25 Log2FC and an adjusted P value less than .05. After filtering of ribosomal transcripts, this gene list was used for analysis with the Gene Set/Pathway Enrichment analysis pipeline in the Reactome-FIVIz package (https://reactome.org/tools/reactome-fiviz) using Cytoscape (Version: 3.9.0). A total of 336 transcripts were successfully mapped to a node, with 157 being connected in the main REACTOME network, which is shown in Figure 7. “Analyze Network Functions–Pathway Enrichment” and “Analyze Module Functions–Pathway Enrichment” operators in REACTOME-FI were used to identify relevant pathways.
VISUALIZATION OF EXPRESSION DATA IN PATHWAYS AND NETWORKS
Expression data were imported as a table into Cytoscape and used to determine the “fill color” of nodes based on the value of average logarithmic fold change between modSMCs and SMCs withing the LDS. PathVisio 3.3.0 was used to download and modify WikiPathways of interest. The following WikiPathways were used to generate a merged a custom pathway: www.wikipathways.org/instance/WP523; www.wikipathways.org/instance/WP6; https://www.wikipathways.org/instance/WP85; www.wikipathways.org/instance/WP113.
RNAscope IN SITU HYBRIDIZATION
Aortic tissues fixed for 24 hours were dehydrated in ethanol and processed into paraffin blocks by the human pathology core facility at Stanford, and 7-μm sections were generated. Sections were deparaffinized, dehydrated, and treated with hydrogen peroxide to quench tissue peroxidase activity. Target retrieval was performed in boiling 1× target retrieval buffer for 30 minutes. Sections were then hybridized with duplex probes for IGFBP2 and TNFRSF11 B, and the duplex chromogenic RNAscope assay was performed according to supplier instructions.
FIGURE E1.

scRNAseq donor controls. A, Minimal demographic data provided by organ procurement organization. Both donors had reduced cardiac function prompting rejection for heart transplantation. B, Gross tissue inspection for donor 2. Left: thoracic aorta with arch vessels and coronary arteries. Middle: line of delineation between aortic root and ascending aorta, corresponding to the anatomic sinotubular junction. Patchy intimal atherosclerotic disease burden was observed throughout the aorta including in the arch and branch vessels (right). Black arrow indicates brachiocephalic artery orifice. C, Trichrome stain for donor 2 right coronary artery and aortic root demonstrating substantial coronary atherosclerotic plaque burden and intimal-medial fibrosis within the aorta. CV, Cardiovascular.
FIGURE E2.
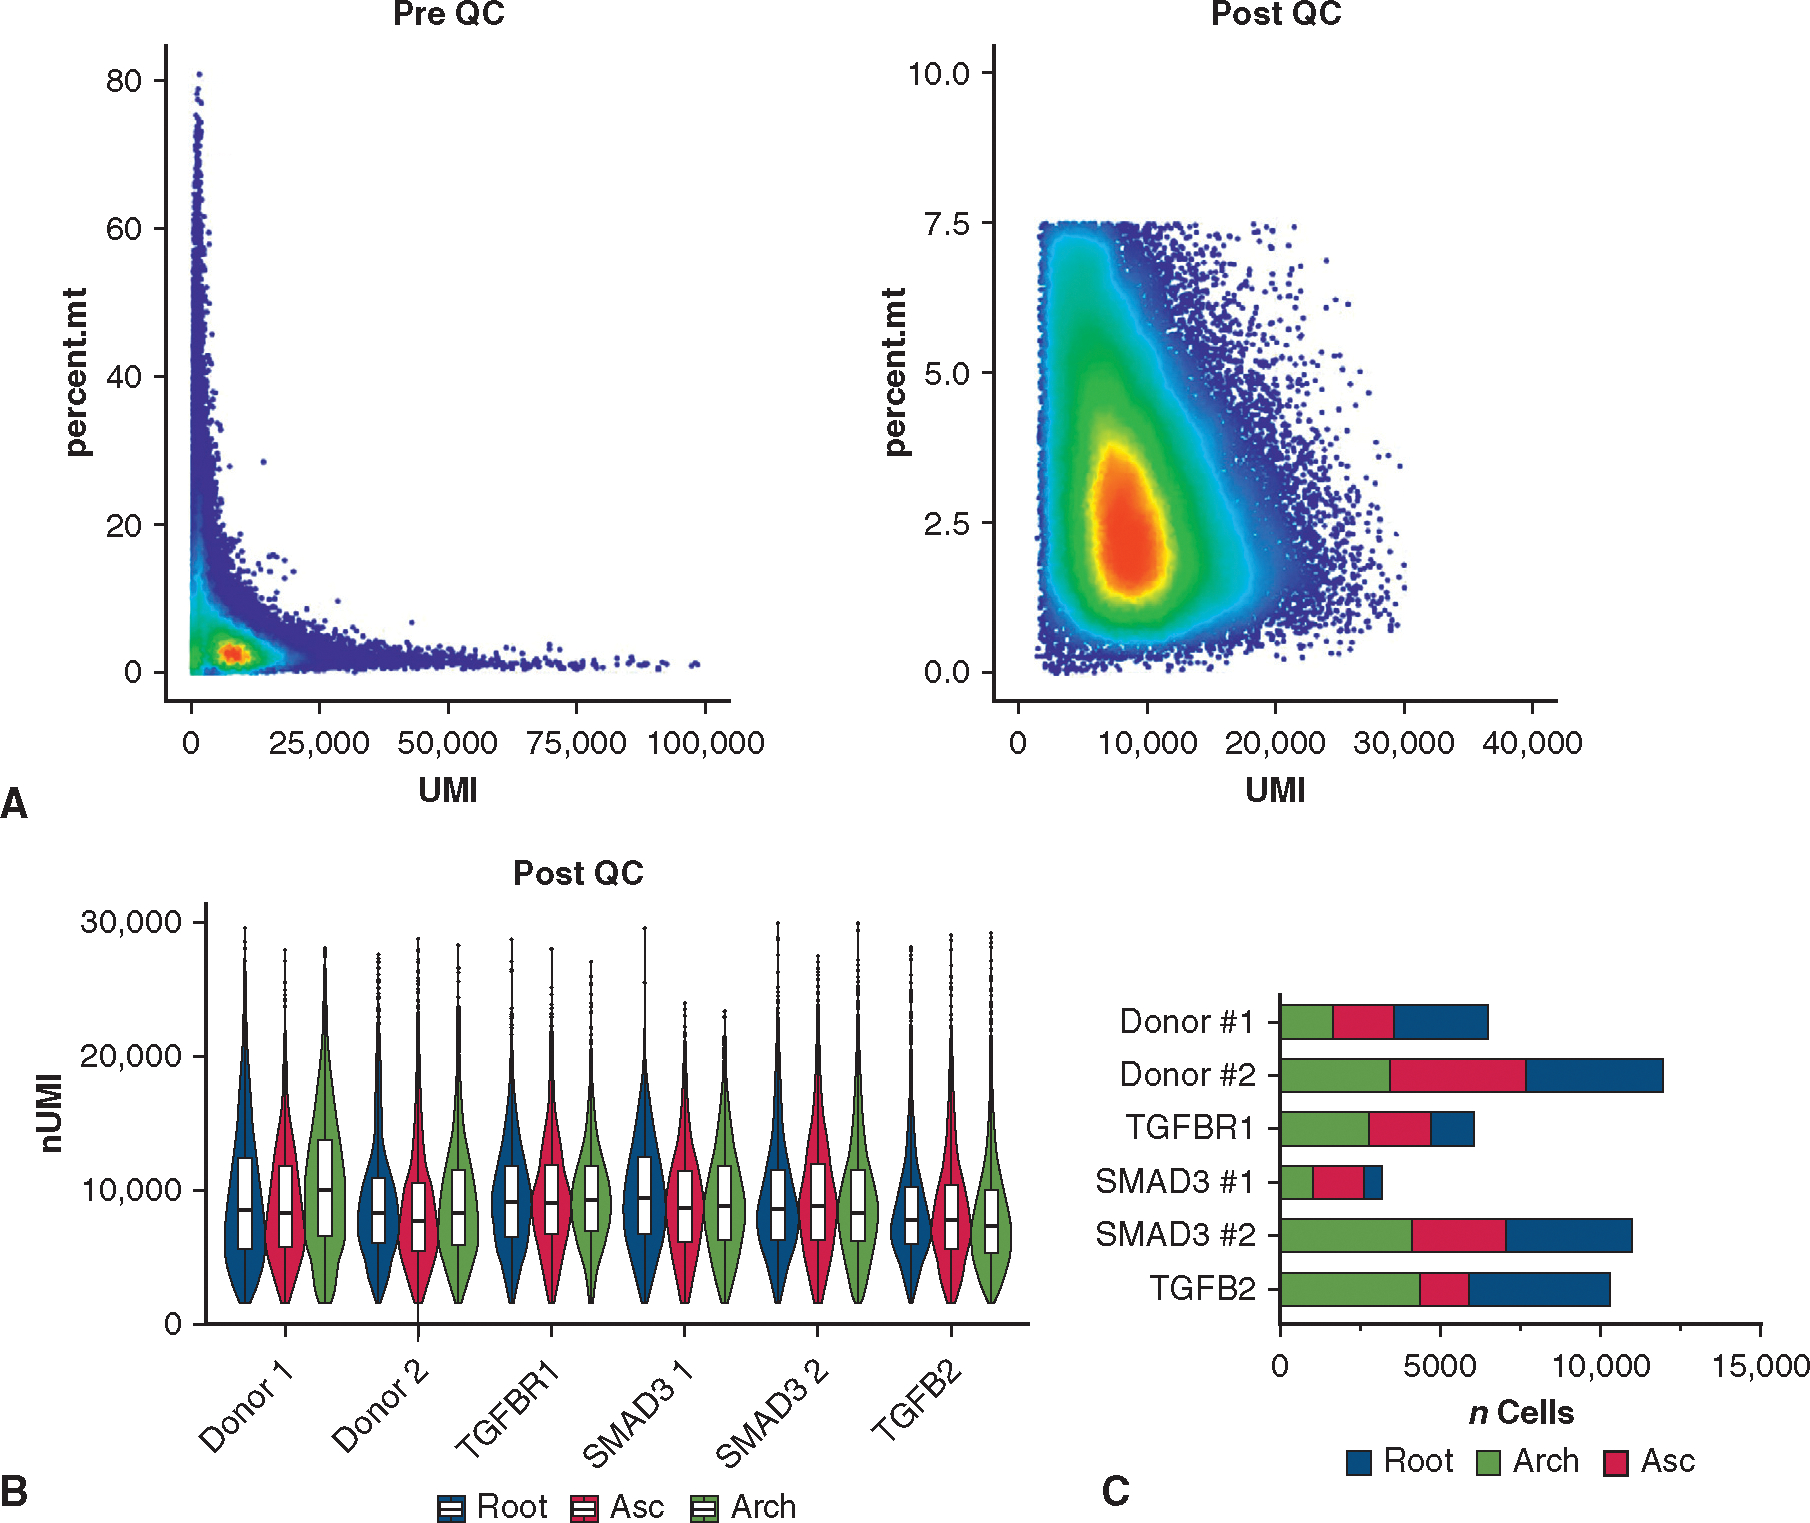
Quality-control metrics for single-cell RNA sequencing dataset. A, Scatter plot for unfiltered, aggregated data from n = 18 individual libraries. Data were then subset to remove cells with a high percentage of mitochondrial reads (dead cells) and high unique molecular identifier values (doublets). B, Post–quality-control unique molecular identifier count for individual cells in n = 18 libraries demonstrating similar depth among samples in the dataset, including between segments in individual subjects. Boxes denote IQR, line denotes median, whiskers extend 1.5 IQR from boxhinges. C, Cell counts from each aortic segment for each subject in the filtered scRNAseq dataset. QC, Quality control; UMI, unique molecular identifier; Asc, ascending aorta.
FIGURE E3.
Differential gene expression in LDS and donor control SMC clusters. A, Uniform manifold approximation and projection (UMAP) plot for SMC + modSMC clusters with generally overlapping distributions between LDS and control. modSMCs show similar overexpression of core markers (COL1A1, MMP2, VCAN) regardless of genotype. B, Gene markers enriched in donor SMCs among 436 differentially expressed genes. C, TGF-β–related genes among those enriched in LDS SMC/modSMCs. LDS, Loeys-Dietz syndrome; SMC, smooth muscle cell.
TABLE E1.
Results of mixed effects model for denoted variables with respect to aortic segment, patient group (Marfan syndrome, Loeys-Dietz syndrome, no aortopathy), and interaction term (segment × group)
| Regurgitant fraction |
|||||
|---|---|---|---|---|---|
| Fixed effects (type III) | P value | P value summary | Statistically significant (P < .05)? | F (DFn, DFd) | Geisser-Greenhouse’s epsilon |
|
| |||||
| Segment | .009 | ** | Yes | F (2.274, 22.74) = 5.505 | 0.3791 |
| Genotype | .9229 | Ns | No | F (2, 10) = 0.08092 | |
| Segment × genotype | .3306 | Ns | No | F (12, 60) = 1.162 | |
|
| |||||
| Wall shear stress |
|||||
| Fixed effects (type III) | P value | P value summary | Statistically significant (P < .05)? | F (DFn, DFd) | Geisser-Greenhouse’s epsilon |
|
| |||||
| Segment | .0328 | * | Yes | F (2.144, 21.44) = 3.926 | 0.3573 |
| Genotype | .0361 | * | Yes | F (2, 10) = 4.714 | |
| Segment × genotype | .0131 | * | Yes | F (12, 60) = 2.399 | |
|
| |||||
| Peak velocity |
|||||
| Fixed effects (type III) | P value | P value summary | Statistically significant (P < .05)? | F (DFn, DFd) | Geisser-Greenhouse’s epsilon |
|
| |||||
| Segment | .0254 | * | Yes | F (1.612, 16.12) = 5.042 | 0.2686 |
| Genotype | .037 | * | Yes | F (2, 10) = 4.667 | |
| Segment × genotype | .0296 | * | Yes | F (12, 60) = 2.108 | |
P < .05
P < .01
TABLE E2.
Detailed results of multiple comparison testing between groups for each measured aortic segment
| Regurgitant fraction multiple comparisons by segment | |||||
|---|---|---|---|---|---|
|
| |||||
| Tukey’s multiple comparisons test | Mean difference | 95% CI of difference | Below threshold? | Summary | Adjusted P value |
|
| |||||
| STJ | |||||
| MFS vs LDS | 1.28 | −5.750 to 8.310 | No | ns | .8564 |
| MFS vs no aortopathy | 3.625 | −2.860 to 10.11 | No | ns | .2354 |
| LDS vs no aortopathy | 2.345 | −3.850 to 8.540 | No | ns | .3951 |
| Ascending aorta | |||||
| MFS vs LDS | −0.658 | −7.997 to 6.681 | No | ns | .961 |
| MFS vs no aortopathy | −2.696 | −17.21 to 11.82 | No | ns | .7988 |
| LDS vs no aortopathy | −2.038 | −16.48 to 12.41 | No | ns | .882 |
| Proximal arch | |||||
| MFS vs LDS | −2.213 | −13.68 to 9.258 | No | ns | .8348 |
| MFS vs no aortopathy | −3.63 | −20.03 to 12.77 | No | ns | .7599 |
| LDS vs no aortopathy | −1.418 | −18.13 to 15.29 | No | ns | .9604 |
| Distal arch | |||||
| MFS vs LDS | −4.534 | −20.27 to 11.21 | No | ns | .6733 |
| MFS vs no aortopathy | −4.924 | −31.63 to 21.78 | No | ns | .8083 |
| LDS vs no aortopathy | −0.39 | −27.11 to 26.33 | No | ns | .9987 |
| DAo LSA | |||||
| MFS vs LDS | 4.26 | −10.70 to 19.22 | No | ns | .6663 |
| MFS vs no aortopathy | 3.977 | −13.22 to 21.18 | No | ns | .7814 |
| LDS vs no aortopathy | −0.2825 | −15.25 to 14.69 | No | ns | .9978 |
| DAo PA | |||||
| MFS vs LDS | 5.634 | −12.22 to 23.49 | No | ns | .5833 |
| MFS vs no aortopathy | 9.992 | −7.850 to 27.83 | No | ns | .2705 |
| LDS vs no aortopathy | 4.358 | −5.557 to 14.27 | No | ns | .3927 |
| DAo Max | |||||
| MFS vs LDS | −4.905 | −20.06 to 10.25 | No | ns | .6202 |
| MFS vs no aortopathy | 0.7375 | −11.11 to 12.59 | No | ns | .9797 |
| LDS vs no aortopathy | 5.643 | −8.752 to 20.04 | No | ns | .4332 |
| Test details | Mean 1 | Mean 2 | Mean difference | SE of difference | N1 | N2 | q | DF |
|---|---|---|---|---|---|---|---|---|
|
| ||||||||
| STJ | ||||||||
| MFS vs LDS | 4.36 | 3.08 | 1.28 | 2.386 | 5 | 4 | 0.7586 | 6.987 |
| MFS vs no aortopathy | 4.36 | 0.735 | 3.625 | 1.861 | 5 | 4 | 2.755 | 4.202 |
| LDS vs no aortopathy | 3.08 | 0.735 | 2.345 | 1.55 | 4 | 4 | 2.139 | 3.222 |
| Ascending aorta | ||||||||
| MFS vs LDS | 3.422 | 4.08 | −0.658 | 2.441 | 5 | 4 | 0.3812 | 6.457 |
| MFS vs no aortopathy | 3.422 | 6.118 | −2.696 | 4.104 | 5 | 4 | 0.9289 | 4.069 |
| LDS vs no aortopathy | 4.08 | 6.118 | −2.038 | 4.207 | 4 | 4 | 0.6849 | 4.354 |
| Proximal arch | ||||||||
| MFS vs LDS | 5.81 | 8.023 | −2.213 | 3.81 | 5 | 4 | 0.8213 | 6.421 |
| MFS vs no aortopathy | 5.81 | 9.44 | −3.63 | 4.997 | 5 | 4 | 1.027 | 4.885 |
| LDS vs no aortopathy | 8.023 | 9.44 | −1.418 | 5.216 | 4 | 4 | 0.3843 | 5.228 |
| Distal arch | ||||||||
| MFS vs LDS | 8.726 | 13.26 | −4.534 | 5.179 | 5 | 4 | 1.238 | 6.203 |
| MFS vs no aortopathy | 8.726 | 13.65 | −4.924 | 7.724 | 5 | 4 | 0.9016 | 4.282 |
| LDS vs no aortopathy | 13.26 | 13.65 | −0.39 | 8.083 | 4 | 4 | 0.0682 | 4.79 |
| DAo LSA | ||||||||
| MFS vs LDS | 15.5 | 11.24 | 4.26 | 4.781 | 5 | 4 | 1.26 | 5.622 |
| MFS vs no aortopathy | 15.5 | 11.53 | 3.977 | 5.837 | 5 | 4 | 0.9635 | 6.984 |
| LDS vs no aortopathy | 11.24 | 11.53 | −0.2825 | 4.428 | 4 | 4 | 0.0902 | 4.521 |
| DAo PA | ||||||||
| MFS vs LDS | 14.85 | 9.22 | 5.634 | 5.369 | 5 | 4 | 1.484 | 4.716 |
| MFS vs no aortopathy | 14.85 | 4.863 | 9.992 | 5.757 | 5 | 4 | 2.455 | 5.799 |
| LDS vs no aortopathy | 9.22 | 4.863 | 4.358 | 3.028 | 4 | 4 | 2.035 | 4.912 |
| DAo Max | ||||||||
| MFS vs LDS | 9.9 | 14.81 | −4.905 | 5.075 | 5 | 4 | 1.367 | 6.62 |
| MFS vs no aortopathy | 9.9 | 9.163 | 0.7375 | 3.817 | 5 | 4 | 0.2732 | 5.766 |
| LDS vs no aortopathy | 14.81 | 9.163 | 5.643 | 4.123 | 4 | 4 | 1.935 | 4.188 |
| Peak velocity multiple comparisons by segment | |||||
|---|---|---|---|---|---|
|
| |||||
| Tukey’s multiple comparisons test | Mean difference | 95% CI of difference | Below threshold? | Summary | Adjusted P value |
|
| |||||
| STJ | |||||
| MFS vs LDS | 7.261 | −62.67 to 77.19 | No | ns | .9499 |
| MFS vs no aortopathy | −0.8815 | −66.24 to 64.48 | No | ns | .9991 |
| LDS vs no aortopathy | −8.142 | −65.12 to 48.84 | No | ns | .896 |
| Ascending aorta | |||||
| MFS vs LDS | −4.573 | −85.77 to 76.62 | No | ns | .981 |
| MFS vs no aortopathy | 54.18 | −28.64 to 137.0 | No | ns | .1636 |
| LDS vs no aortopathy | 58.76 | 31.12–86.39 | Yes | ** | .0038 |
| Proximal arch | |||||
| MFS vs LDS | −51.19 | −114.2 to 11.80 | No | ns | .0999 |
| MFS vs no aortopathy | 37.6 | −26.11 to 101.3 | No | ns | .2161 |
| LDS vs no aortopathy | 88.79 | 59.40–118.2 | Yes | *** | .0005 |
| Distal arch | |||||
| MFS vs LDS | −55.59 | −126.1 to 14.89 | No | ns | .103 |
| MFS vs no aortopathy | 31.67 | −38.63 to 102.0 | No | ns | .3618 |
| LDS vs no aortopathy | 87.26 | 67.21–107.3 | Yes | **** | <.0001 |
| DAo LSA | |||||
| MFS vs LDS | −63.89 | −118.7 to −9.096 | Yes | * | .0264 |
| MFS vs no aortopathy | −7.182 | −66.16 to 51.80 | No | ns | .9322 |
| LDS vs no aortopathy | 56.71 | 5.290–108.1 | Yes | * | .0344 |
| DAo PA | |||||
| MFS vs LDS | −33.82 | −70.54 to 2.895 | No | ns | .0687 |
| MFS vs no aortopathy | 2.102 | −43.53 to 47.74 | No | ns | .9894 |
| LDS vs no aortopathy | 35.92 | −8.923 to 80.77 | No | ns | .1042 |
| DAo max | |||||
| MFS vs LDS | −17.19 | −169.6 to 135.2 | No | ns | .9354 |
| MFS vs no aortopathy | 49.88 | −104.6 to 204.3 | No | ns | .5521 |
| LDS vs no aortopathy | 67.07 | −18.18 to 152.3 | No | ns | .0995 |
| Test details | Mean 1 | Mean 2 | Mean difference | SE of difference | N1 | N2 | q | DF |
|---|---|---|---|---|---|---|---|---|
|
| ||||||||
| STJ | ||||||||
| MFS vs LDS | 142.6 | 135.3 | 7.261 | 23.69 | 5 | 4 | 0.4334 | 6.935 |
| MFS vs no aortopathy | 142.6 | 143.5 | −0.8815 | 21.45 | 5 | 4 | 0.0581 | 6.148 |
| LDS vs no aortopathy | 135.3 | 143.5 | −8.142 | 18.06 | 4 | 4 | 0.6377 | 5.473 |
| Ascending aorta | ||||||||
| MFS vs LDS | 142.8 | 147.4 | −4.573 | 24.44 | 5 | 4 | 0.2646 | 4.726 |
| MFS vs no aortopathy | 142.8 | 88.6 | 54.18 | 23.54 | 5 | 4 | 3.255 | 4.115 |
| LDS vs no aortopathy | 147.4 | 88.6 | 58.76 | 7.666 | 4 | 4 | 10.84 | 3.905 |
| Proximal arch | ||||||||
| MFS vs LDS | 113 | 164.1 | −51.19 | 19.79 | 5 | 4 | 3.658 | 5.33 |
| MFS vs no aortopathy | 113 | 75.36 | 37.6 | 18.77 | 5 | 4 | 2.833 | 4.476 |
| LDS vs no aortopathy | 164.1 | 75.36 | 88.79 | 8.912 | 4 | 4 | 14.09 | 4.82 |
| Distal arch | ||||||||
| MFS vs LDS | 108.5 | 164.1 | −55.59 | 20.57 | 5 | 4 | 3.822 | 4.375 |
| MFS vs no aortopathy | 108.5 | 76.82 | 31.67 | 20.67 | 5 | 4 | 2.167 | 4.455 |
| LDS vs no aortopathy | 164.1 | 76.82 | 87.26 | 6.515 | 4 | 4 | 18.94 | 5.942 |
| DAo LSA | ||||||||
| MFS vs LDS | 86.63 | 150.5 | −63.89 | 18.33 | 5 | 4 | 4.928 | 6.605 |
| MFS vs no aortopathy | 86.63 | 93.81 | −7.182 | 20.02 | 5 | 4 | 0.5072 | 6.998 |
| LDS vs no aortopathy | 150.5 | 93.81 | 56.71 | 16.48 | 4 | 4 | 4.866 | 5.677 |
| DAo PA | ||||||||
| MFS vs LDS | 72.4 | 106.2 | −33.82 | 12.46 | 5 | 4 | 3.839 | 6.982 |
| MFS vs no aortopathy | 72.4 | 70.3 | 2.102 | 15.08 | 5 | 4 | 0.1971 | 6.304 |
| LDS vs no aortopathy | 106.2 | 70.3 | 35.92 | 14.06 | 4 | 4 | 3.614 | 5.293 |
| DAo Max | ||||||||
| MFS vs LDS | 139 | 156.2 | −17.19 | 49.1 | 5 | 4 | 0.4951 | 5.771 |
| MFS vs no aortopathy | 139 | 89.12 | 49.88 | 44.7 | 5 | 4 | 1.578 | 4.29 |
| LDS vs no aortopathy | 156.2 | 89.12 | 67.07 | 23.52 | 4 | 4 | 4.033 | 3.858 |
| Wall shear stress multiple comparisons by segment | |||||
|---|---|---|---|---|---|
|
| |||||
| Tukey’s multiple comparisons test | Mean difference | 95.00% CI of difference | Below threshold? | Summary | Adjusted P value |
|
| |||||
| STJ | |||||
| MFS vs LDS | 3.6 | −5.666 to 12.87 | No | ns | .4547 |
| MFS vs no aortopathy | 6.85 | −2.530 to 16.23 | No | ns | .1444 |
| LDS vs no aortopathy | 3.25 | −2.898 to 9.398 | No | ns | .2612 |
| Ascending aorta | |||||
| MFS vs LDS | 2.05 | −11.90 to 16.00 | No | ns | .8918 |
| MFS vs no aortopathy | 8.8 | −5.399 to 23.00 | No | ns | .1887 |
| LDS vs no aortopathy | 6.75 | −0.5873 to 14.09 | No | ns | .064 |
| Proximal arch | |||||
| MFS vs LDS | −5.15 | −14.53 to 4.230 | No | ns | .2906 |
| MFS vs no aortopathy | 7.85 | −1.368 to 17.07 | No | ns | .0843 |
| LDS vs no aortopathy | 13 | 6.898–19.10 | Yes | ** | .0027 |
| Distal arch | |||||
| MFS vs LDS | −8.25 | −22.10 to 5.604 | No | ns | .2332 |
| MFS vs no aortopathy | 6 | −2.739 to 14.74 | No | ns | .1528 |
| LDS vs no aortopathy | 14.25 | −0.5436 to 29.04 | No | ns | .0553 |
| DAo LSA | |||||
| MFS vs LDS | −8.55 | −20.32 to 3.224 | No | ns | .1486 |
| MFS vs no aortopathy | 3.2 | −5.985 to 12.38 | No | ns | .5647 |
| LDS vs no aortopathy | 11.75 | 0.5653–22.93 | Yes | * | .0425 |
| DAo PA | |||||
| MFS vs LDS | −6.15 | −18.64 to 6.343 | No | ns | .3614 |
| MFS vs no aortopathy | 3.1 | −6.529 to 12.73 | No | ns | .6078 |
| LDS vs no aortopathy | 9.25 | −2.698 to 21.20 | No | ns | .1072 |
| DAo max | |||||
| MFS vs LDS | −3.3 | −21.82 to 15.22 | No | ns | .8618 |
| MFS vs no aortopathy | 8.45 | −8.409 to 25.31 | No | ns | .3305 |
| LDS vs no aortopathy | 11.75 | −3.380 to 26.88 | No | ns | .1105 |
| Test details | Mean 1 | Mean 2 | Mean difference | SE of difference | N1 | N2 | q | DF |
|---|---|---|---|---|---|---|---|---|
|
| ||||||||
| STJ | ||||||||
| MFS vs LDS | 19.6 | 16 | 3.6 | 2.75 | 5 | 4 | 1.852 | 4.556 |
| MFS vs no aortopathy | 19.6 | 12.75 | 6.85 | 3.102 | 5 | 4 | 3.123 | 6.32 |
| LDS vs no aortopathy | 16 | 12.75 | 3.25 | 1.75 | 4 | 4 | 2.626 | 4.128 |
| Ascending aorta | ||||||||
| MFS vs LDS | 22.8 | 20.75 | 2.05 | 4.45 | 5 | 4 | 0.6515 | 5.589 |
| MFS vs no aortopathy | 22.8 | 14 | 8.8 | 4.091 | 5 | 4 | 3.042 | 4.245 |
| LDS vs no aortopathy | 20.75 | 14 | 6.75 | 2.016 | 4 | 4 | 4.736 | 3.826 |
| Proximal arch | ||||||||
| MFS vs LDS | 19.6 | 24.75 | −5.15 | 3.102 | 5 | 4 | 2.348 | 6.32 |
| MFS vs no aortopathy | 19.6 | 11.75 | 7.85 | 2.791 | 5 | 4 | 3.978 | 4.801 |
| LDS vs no aortopathy | 24.75 | 11.75 | 13 | 1.814 | 4 | 4 | 10.13 | 4.579 |
| Distal arch | ||||||||
| MFS vs LDS | 19 | 27.25 | −8.25 | 4.419 | 5 | 4 | 2.64 | 5.587 |
| MFS vs no aortopathy | 19 | 13 | 6 | 2.608 | 5 | 4 | 3.254 | 4.621 |
| LDS vs no aortopathy | 27.25 | 13 | 14.25 | 3.705 | 4 | 4 | 5.439 | 3.226 |
| DAo LSA | ||||||||
| MFS vs LDS | 18.2 | 26.75 | −8.55 | 3.937 | 5 | 4 | 3.071 | 6.588 |
| MFS vs no aortopathy | 18.2 | 15 | 3.2 | 2.99 | 5 | 4 | 1.514 | 5.976 |
| LDS vs no aortopathy | 26.75 | 15 | 11.75 | 3.25 | 4 | 4 | 5.113 | 4.329 |
| DAo PA | ||||||||
| MFS vs LDS | 16.6 | 22.75 | −6.15 | 4.17 | 5 | 4 | 2.086 | 6.542 |
| MFS vs no aortopathy | 16.6 | 13.5 | 3.1 | 3.121 | 5 | 4 | 1.405 | 5.891 |
| LDS vs no aortopathy | 22.75 | 13.5 | 9.25 | 3.437 | 4 | 4 | 3.806 | 4.228 |
| DAo max | ||||||||
| MFS vs LDS | 24.2 | 27.5 | −3.3 | 6.284 | 5 | 4 | 0.7427 | 6.975 |
| MFS vs no aortopathy | 24.2 | 15.75 | 8.45 | 5.367 | 5 | 4 | 2.227 | 5.551 |
| LDS vs no aortopathy | 27.5 | 15.75 | 11.75 | 4.562 | 4 | 4 | 3.642 | 4.748 |
DAo, Distal aorta; LDS, Loeys-Dietz syndrome; LSA, left subclavian artery; MFS, Marfan syndrome; PA, pulmonary artery; STJ, sinotubular junction.
P < .05
P < .01
P < .001
P < .0001.
TABLE E3.
Differentially expressed genes (modulated smooth muscle cell vs smooth muscle cell)
| Gene | P value | Average (log2FC) | pct.1 | pct.2 | Adjusted P value |
|---|---|---|---|---|---|
|
| |||||
| CYTL1 | 0 | 2.16481639 | 0.488 | 0.072 | 0 |
| VCAN | 0 | 1.86474504 | 0.953 | 0.637 | 0 |
| TNFRSF11 B | 0 | 1.84384827 | 0.63 | 0.23 | 0 |
| FN1 | 0 | 1.70011604 | 0.986 | 0.877 | 0 |
| COL1A2 | 0 | 1.59731752 | 0.958 | 0.737 | 0 |
| SERPINE1 | 0 | 1.46614753 | 0.767 | 0.388 | 0 |
| LTBP2 | 0 | 1.39576409 | 0.85 | 0.393 | 0 |
| MGP | 0 | 1.38232192 | 1 | 0.998 | 0 |
| GAS6 | 0 | 1.37339539 | 0.988 | 0.934 | 0 |
| COL8A1 | 0 | 1.30657145 | 0.901 | 0.571 | 0 |
| ELN | 0 | 1.1177823 | 0.822 | 0.54 | 0 |
| COL3A1 | 0 | 1.09316631 | 0.824 | 0.572 | 0 |
| EFEMP1 | 0 | 1.05731965 | 0.915 | 0.648 | 0 |
| AEBP1 | 0 | 1.02327383 | 0.958 | 0.785 | 0 |
| ITGBL1 | 0 | 0.99965973 | 0.799 | 0.491 | 0 |
| CYR61 | 1.92E-295 | 0.98001934 | 0.82 | 0.576 | 5.12E-291 |
| CTGF | 2.65E-287 | 0.96523868 | 0.959 | 0.85 | 7.07E-283 |
| FMO2 | 0 | 0.96433947 | 0.724 | 0.419 | 0 |
| IGFBP2 | 0 | 0.93882735 | 0.992 | 0.966 | 0 |
| SFRP1 | 4.10E-277 | 0.93601881 | 0.645 | 0.36 | 1.09E-272 |
| COL1A1 | 0 | 0.93322018 | 0.621 | 0.309 | 0 |
| C2orf40 | 0 | 0.9271795 | 0.431 | 0.148 | 0 |
| SPARC | 0 | 0.91751715 | 0.995 | 0.954 | 0 |
| CST6 | 0 | 0.89559867 | 0.539 | 0.225 | 0 |
| TIMP1 | 0 | 0.87868608 | 0.99 | 0.961 | 0 |
| CD55 | 0 | 0.86807634 | 0.525 | 0.235 | 0 |
| PRSS23 | 0 | 0.85793697 | 0.801 | 0.49 | 0 |
| MMP2 | 0 | 0.8563816 | 0.562 | 0.155 | 0 |
| MYH10 | 0 | 0.85431321 | 0.997 | 0.959 | 0 |
| CCND1 | 0 | 0.84449476 | 0.734 | 0.358 | 0 |
| OMD | 0 | 0.82016572 | 0.627 | 0.27 | 0 |
| COL21A1 | 0 | 0.81227254 | 0.824 | 0.522 | 0 |
| HTRA1 | 0 | 0.79888489 | 0.951 | 0.796 | 0 |
| CFH | 2.50E-301 | 0.79115224 | 0.293 | 0.062 | 6.66E-297 |
| NOV | 0 | 0.77185454 | 0.99 | 0.94 | 0 |
| CTSD | 0 | 0.74994446 | 0.937 | 0.766 | 0 |
| LTBP1 | 0 | 0.7474405 | 0.984 | 0.9 | 0 |
| PTN | 7.53E-263 | 0.73657212 | 0.444 | 0.176 | 2.01E-258 |
| ADH1B | 6.83E-169 | 0.73339935 | 0.371 | 0.166 | 1.82E-164 |
| OGN | 0 | 0.71716092 | 0.976 | 0.895 | 0 |
| TNFRSF12 A | 1.35E-262 | 0.69487169 | 0.9 | 0.715 | 3.61E-258 |
| CTSZ | 0 | 0.6850623 | 0.873 | 0.641 | 0 |
| CRISPLD1 | 2.83E-247 | 0.64665887 | 0.727 | 0.462 | 7.54E-243 |
| S100A10 | 7.48E-183 | 0.64546492 | 0.908 | 0.801 | 2.00E-178 |
| HMCN1 | 9.19E-265 | 0.63881222 | 0.677 | 0.383 | 2.45E-260 |
| LTBP4 | 0 | 0.62926078 | 0.848 | 0.584 | 0 |
| PLXDC2 | 9.15E-250 | 0.62857214 | 0.789 | 0.535 | 2.44E-245 |
| IGFBP5 | 6.81E-104 | 0.62675892 | 0.626 | 0.456 | 1.82E-99 |
| FSTL1 | 3.41E-261 | 0.6215747 | 0.816 | 0.584 | 9.10E-257 |
| THY1 | 0 | 0.61971946 | 0.254 | 0.03 | 0 |
| IGFBP3 | 3.71E-190 | 0.61688568 | 0.346 | 0.135 | 9.90E-186 |
| TPM4 | 0 | 0.6143201 | 0.989 | 0.937 | 0 |
| PDGFD | 0 | 0.61211081 | 0.535 | 0.195 | 0 |
| DKK3 | 0 | 0.61121375 | 0.956 | 0.824 | 0 |
| ISLR | 0 | 0.60548501 | 0.461 | 0.155 | 0 |
| CDH13 | 8.32E-278 | 0.59989404 | 0.775 | 0.493 | 2.22E-273 |
| C5orf46 | 1.36E-235 | 0.59406993 | 0.463 | 0.197 | 3.64E-231 |
| FXYD5 | 9.32E-306 | 0.58384961 | 0.713 | 0.393 | 2.49E-301 |
| CXCL12 | 3.70E-279 | 0.58188958 | 0.355 | 0.107 | 9.86E-275 |
| ASPN | 6.14E-172 | 0.57299804 | 0.849 | 0.684 | 1.64E-167 |
| PRELP | 1.40E-224 | 0.56976988 | 0.954 | 0.854 | 3.75E-220 |
| PCOLCE2 | 2.96E-250 | 0.56771089 | 0.456 | 0.192 | 7.89E-246 |
| PLSCR4 | 6.97E-253 | 0.56649091 | 0.749 | 0.487 | 1.86E-248 |
| TM4SF1 | 9.64E-224 | 0.56429143 | 0.819 | 0.607 | 2.57E-219 |
| CLU | 2.69E-242 | 0.56379269 | 0.999 | 0.992 | 7.18E-238 |
| THBS2 | 7.40E-206 | 0.56047657 | 0.71 | 0.446 | 1.97E-201 |
| ITGA11 | 1.60E-243 | 0.55563732 | 0.575 | 0.296 | 4.27E-239 |
| TPH1 | 3.79E-224 | 0.55484596 | 0.611 | 0.343 | 1.01E-219 |
| HSP90B1 | 8.98E-307 | 0.55310974 | 0.961 | 0.877 | 2.40E-302 |
| CDH11 | 4.47E-277 | 0.5508197 | 0.412 | 0.145 | 1.19E-272 |
| WISP2 | 4.71E-104 | 0.55055764 | 0.648 | 0.471 | 1.26E-99 |
| TMSB10 | 1.90E-299 | 0.54795238 | 0.97 | 0.933 | 5.07E-295 |
| GEM | 1.44E-218 | 0.54696907 | 0.827 | 0.609 | 3.84E-214 |
| MMP23 B | 5.09E-214 | 0.54691887 | 0.321 | 0.111 | 1.36E-209 |
| ITGA1 | 9.22E-236 | 0.54454087 | 0.689 | 0.413 | 2.46E-231 |
| IGFBP7 | 0 | 0.53649916 | 1 | 0.999 | 0 |
| FBLN5 | 6.82E-253 | 0.53193424 | 0.93 | 0.793 | 1.82E-248 |
| ALCAM | 9.12E-190 | 0.52984987 | 0.814 | 0.601 | 2.43E-185 |
| ITGB1 | 0 | 0.52796874 | 0.998 | 0.986 | 0 |
| CPXM2 | 5.71E-218 | 0.5220643 | 0.79 | 0.557 | 1.52E-213 |
| LOXL1 | 9.97E-277 | 0.51599877 | 0.565 | 0.267 | 2.66E-272 |
| SULF1 | 5.28E-107 | 0.50444768 | 0.574 | 0.386 | 1.41E-102 |
| MFAP5 | 1.74E-129 | 0.50333376 | 0.136 | 0.028 | 4.64E-125 |
| SFRP4 | 3.21E-245 | 0.50193942 | 0.459 | 0.194 | 8.57E-241 |
| MYL12 A | 0 | 0.49522352 | 0.988 | 0.966 | 0 |
| GJA1 | 8.30E-177 | 0.49475531 | 0.741 | 0.511 | 2.21E-172 |
| CYBA | 3.09E-262 | 0.48606978 | 0.673 | 0.374 | 8.23E-258 |
| COL5A2 | 8.32E-208 | 0.48110416 | 0.477 | 0.225 | 2.22E-203 |
| RGCC | 7.85E-114 | 0.48015445 | 0.451 | 0.262 | 2.09E-109 |
| SUGCT | 1.13E-215 | 0.47892478 | 0.804 | 0.563 | 3.01E-211 |
| RCN3 | 1.18E-219 | 0.46609535 | 0.575 | 0.311 | 3.14E-215 |
| COL14A1 | 1.33E-191 | 0.46442437 | 0.992 | 0.958 | 3.55E-187 |
| ITGB5 | 3.88E-174 | 0.46162081 | 0.765 | 0.55 | 1.04E-169 |
| PXDC1 | 7.31E-178 | 0.45810222 | 0.822 | 0.627 | 1.95E-173 |
| LRRC17 | 4.66E-211 | 0.45753148 | 0.418 | 0.176 | 1.24E-206 |
| COL6A2 | 3.82E-189 | 0.45261933 | 0.962 | 0.871 | 1.02E-184 |
| ITM2B | 0 | 0.45159468 | 0.994 | 0.977 | 0 |
| ANXA1 | 3.61E-273 | 0.4499151 | 0.982 | 0.953 | 9.62E-269 |
| CRIM1 | 3.62E-141 | 0.44882794 | 0.833 | 0.651 | 9.65E-137 |
| TUBA1B | 1.83E-180 | 0.44841824 | 0.94 | 0.857 | 4.89E-176 |
| COL4A1 | 7.15E-122 | 0.44367111 | 0.771 | 0.588 | 1.91E-117 |
| MXRA8 | 4.54E-166 | 0.44309151 | 0.689 | 0.455 | 1.21E-161 |
| NUCB2 | 9.59E-172 | 0.43922063 | 0.735 | 0.522 | 2.56E-167 |
| TMSB4X | 3.44E-216 | 0.4363342 | 0.999 | 0.997 | 9.18E-212 |
| HAPLN1 | 4.27E-225 | 0.4338017 | 0.326 | 0.105 | 1.14E-220 |
| HSPA5 | 1.79E-134 | 0.43369901 | 0.872 | 0.732 | 4.77E-130 |
| PDIA3 | 2.31E-218 | 0.42869993 | 0.94 | 0.835 | 6.16E-214 |
| PPIC | 1.28E-189 | 0.42654771 | 0.741 | 0.511 | 3.42E-185 |
| ARHGDIB | 1.22E-211 | 0.42651108 | 0.479 | 0.221 | 3.25E-207 |
| AQP1 | 5.72E-114 | 0.42502442 | 0.831 | 0.677 | 1.53E-109 |
| COL4A2 | 4.71E-153 | 0.42478366 | 0.905 | 0.771 | 1.26E-148 |
| SCG2 | 4.39E-226 | 0.42371827 | 0.161 | 0.014 | 1.17E-221 |
| RRBP1 | 8.82E-169 | 0.42207072 | 0.669 | 0.432 | 2.35E-164 |
| RBMS3 | 1.97E-137 | 0.42073974 | 0.76 | 0.565 | 5.27E-133 |
| THUMPD2 | 4.30E-210 | 0.41957389 | 0.558 | 0.289 | 1.15E-205 |
| PLAC9 | 6.23E-164 | 0.41845707 | 0.283 | 0.104 | 1.66E-159 |
| MYL12 B | 1.54E-291 | 0.41707267 | 0.986 | 0.966 | 4.10E-287 |
| COL12A1 | 9.03E-161 | 0.41625741 | 0.376 | 0.172 | 2.41E-156 |
| EDIL3 | 5.63E-158 | 0.4059248 | 0.912 | 0.765 | 1.50E-153 |
| SLC14A1 | 9.30E-218 | 0.4030895 | 0.23 | 0.049 | 2.48E-213 |
| BGN | 7.18E-219 | 0.40251897 | 0.999 | 0.992 | 1.91E-214 |
| THBS1 | 3.06E-95 | 0.39808335 | 0.18 | 0.067 | 8.17E-91 |
| LRP1 | 9.77E-123 | 0.39513403 | 0.691 | 0.484 | 2.61E-118 |
| TGFBR1 | 4.65E-112 | 0.39398864 | 0.458 | 0.269 | 1.24E-107 |
| NPDC1 | 2.84E-183 | 0.39386464 | 0.583 | 0.327 | 7.59E-179 |
| CHPF | 5.37E-177 | 0.39289235 | 0.486 | 0.248 | 1.43E-172 |
| FHL1 | 4.15E-126 | 0.39201238 | 0.978 | 0.936 | 1.11E-121 |
| FBN1 | 6.48E-158 | 0.38925008 | 0.494 | 0.266 | 1.73E-153 |
| SSPN | 1.21E-159 | 0.38756013 | 0.883 | 0.73 | 3.22E-155 |
| TIMP2 | 3.34E-160 | 0.38520013 | 0.956 | 0.858 | 8.92E-156 |
| MYDGF | 3.32E-162 | 0.37893058 | 0.781 | 0.573 | 8.85E-158 |
| CDH2 | 1.72E-154 | 0.37732208 | 0.503 | 0.275 | 4.58E-150 |
| FAP | 1.63E-260 | 0.37353951 | 0.287 | 0.067 | 4.35E-256 |
| S100A11 | 1.73E-238 | 0.37318829 | 0.992 | 0.983 | 4.62E-234 |
| MAP1B | 1.02E-107 | 0.36924449 | 0.989 | 0.966 | 2.71E-103 |
| PPIB | 7.51E-193 | 0.36913578 | 0.957 | 0.909 | 2.00E-188 |
| LOX | 4.08E-202 | 0.36532254 | 0.287 | 0.088 | 1.09E-197 |
| CTSF | 1.87E-134 | 0.36450453 | 0.667 | 0.451 | 5.00E-130 |
| MAP3K7CL | 4.98E-157 | 0.3620058 | 0.422 | 0.205 | 1.33E-152 |
| PAM | 1.41E-126 | 0.36126775 | 0.872 | 0.71 | 3.76E-122 |
| KRT17 | 2.09E-75 | 0.36092428 | 0.119 | 0.038 | 5.59E-71 |
| S100A13 | 7.82E-115 | 0.3585284 | 0.805 | 0.645 | 2.08E-110 |
| FKBP10 | 7.86E-169 | 0.35614218 | 0.498 | 0.259 | 2.10E-164 |
| SPTBN1 | 9.10E-113 | 0.35482092 | 0.814 | 0.644 | 2.43E-108 |
| ITGAV | 1.91E-118 | 0.35436728 | 0.608 | 0.4 | 5.10E-114 |
| ANTXR1 | 9.21E-98 | 0.3518319 | 0.776 | 0.609 | 2.46E-93 |
| SMOC2 | 3.18E-121 | 0.35136788 | 0.943 | 0.858 | 8.49E-117 |
| S100A16 | 9.78E-117 | 0.34980393 | 0.625 | 0.427 | 2.61E-112 |
| ITGA10 | 2.91E-144 | 0.34893995 | 0.483 | 0.262 | 7.77E-140 |
| FAM114A1 | 5.31E-133 | 0.34802051 | 0.706 | 0.499 | 1.42E-128 |
| ARPP21 | 8.84E-118 | 0.34759042 | 0.279 | 0.122 | 2.36E-113 |
| LY6E | 3.25E-116 | 0.34612234 | 0.59 | 0.384 | 8.67E-112 |
| LIMA1 | 1.15E-123 | 0.34557303 | 0.588 | 0.375 | 3.06E-119 |
| LTBP3 | 1.58E-127 | 0.34549365 | 0.713 | 0.5 | 4.22E-123 |
| GLIPR1 | 3.00E-123 | 0.34368326 | 0.842 | 0.667 | 7.99E-119 |
| SEPT11 | 3.75E-122 | 0.34264912 | 0.679 | 0.475 | 1.00E-117 |
| CTSB | 1.07E-133 | 0.34154491 | 0.634 | 0.415 | 2.85E-129 |
| CP | 2.12E-64 | 0.34040873 | 0.373 | 0.24 | 5.65E-60 |
| GALNT2 | 7.05E-146 | 0.34003679 | 0.512 | 0.286 | 1.88E-141 |
| UACA | 3.21E-107 | 0.33983547 | 0.637 | 0.434 | 8.57E-103 |
| GPX8 | 1.69E-168 | 0.33743869 | 0.438 | 0.211 | 4.51E-164 |
| MEDAG | 2.82E-135 | 0.33703245 | 0.421 | 0.22 | 7.52E-131 |
| CALU | 3.85E-109 | 0.33686327 | 0.833 | 0.679 | 1.03E-104 |
| PROS1 | 1.12E-88 | 0.33508066 | 0.582 | 0.401 | 2.98E-84 |
| MYO1D | 1.41E-93 | 0.33467817 | 0.762 | 0.591 | 3.76E-89 |
| SPINT2 | 1.25E-157 | 0.33420618 | 0.973 | 0.939 | 3.34E-153 |
| ADAMTS8 | 3.43E-190 | 0.3316512 | 0.189 | 0.036 | 9.14E-186 |
| COL16A1 | 1.04E-178 | 0.3309758 | 0.345 | 0.136 | 2.76E-174 |
| CALR | 7.50E-125 | 0.33093888 | 0.926 | 0.817 | 2.00E-120 |
| ATP10D | 2.24E-158 | 0.3293825 | 0.405 | 0.19 | 5.97E-154 |
| PPP1R14 B | 7.43E-112 | 0.32875896 | 0.838 | 0.699 | 1.98E-107 |
| TINAGL1 | 9.64E-105 | 0.32866008 | 0.847 | 0.703 | 2.57E-100 |
| COL13A1 | 1.47E-168 | 0.32831125 | 0.362 | 0.152 | 3.91E-164 |
| KRT7 | 4.77E-194 | 0.3281688 | 0.196 | 0.039 | 1.27E-189 |
| EMP3 | 5.28E-101 | 0.32539707 | 0.887 | 0.774 | 1.41E-96 |
| CD59 | 4.54E-120 | 0.32512644 | 0.879 | 0.759 | 1.21E-115 |
| P4HB | 7.39E-113 | 0.32393683 | 0.804 | 0.647 | 1.97E-108 |
| ARHGAP18 | 1.30E-241 | 0.32377397 | 0.236 | 0.045 | 3.47E-237 |
| LGALS3BP | 7.89E-132 | 0.32220087 | 0.53 | 0.312 | 2.10E-127 |
| BCAP29 | 3.29E-98 | 0.32138212 | 0.879 | 0.758 | 8.78E-94 |
| MEG3 | 5.87E-139 | 0.32134564 | 0.29 | 0.116 | 1.56E-134 |
| FGF1 | 1.75E-191 | 0.32123959 | 0.294 | 0.098 | 4.68E-187 |
| CD151 | 2.38E-145 | 0.31522458 | 0.991 | 0.977 | 6.35E-141 |
| FAM180 A | 2.85E-105 | 0.31093147 | 0.446 | 0.261 | 7.59E-101 |
| GRN | 1.46E-117 | 0.31069274 | 0.55 | 0.343 | 3.89E-113 |
| PHLDA2 | 7.35E-186 | 0.30971185 | 0.228 | 0.059 | 1.96E-181 |
| TFPI | 3.15E-151 | 0.30939512 | 0.35 | 0.151 | 8.40E-147 |
| CITED4 | 3.13E-95 | 0.30933679 | 0.533 | 0.349 | 8.35E-91 |
| EFEMP2 | 1.31E-102 | 0.30857096 | 0.735 | 0.557 | 3.48E-98 |
| HLA-A | 6.00E-92 | 0.30851468 | 0.927 | 0.857 | 1.60E-87 |
| FRZB | 7.08E-97 | 0.30790451 | 0.975 | 0.934 | 1.89E-92 |
| DSEL | 1.57E-102 | 0.30746455 | 0.5 | 0.308 | 4.18E-98 |
| PLD3 | 4.46E-105 | 0.30604958 | 0.664 | 0.462 | 1.19E-100 |
| CCPG1 | 6.91E-112 | 0.30531319 | 0.853 | 0.703 | 1.84E-107 |
| LAMP1 | 1.70E-102 | 0.30507102 | 0.822 | 0.656 | 4.55E-98 |
| SOST | 8.53E-33 | 0.30459242 | 0.339 | 0.243 | 2.28E-28 |
| TGM2 | 4.26E-71 | 0.30314621 | 0.473 | 0.318 | 1.14E-66 |
| MYOZ2 | 6.14E-78 | 0.30305823 | 0.391 | 0.238 | 1.64E-73 |
| VCAM1 | 4.86E-124 | 0.30094389 | 0.135 | 0.029 | 1.30E-119 |
| PRRX1 | 1.43E-97 | 0.30062178 | 0.505 | 0.317 | 3.82E-93 |
| SDC2 | 2.83E-104 | 0.29848348 | 0.739 | 0.546 | 7.56E-100 |
| FMOD | 1.14E-65 | 0.2984694 | 0.773 | 0.626 | 3.04E-61 |
| PID1 | 9.84E-102 | 0.29821658 | 0.656 | 0.453 | 2.62E-97 |
| CTHRC1 | 1.41E-71 | 0.29780598 | 0.814 | 0.682 | 3.75E-67 |
| SH3BGRL3 | 5.99E-70 | 0.29677196 | 0.925 | 0.861 | 1.60E-65 |
| MRC2 | 9.87E-152 | 0.29638335 | 0.344 | 0.146 | 2.63E-147 |
| DPT | 2.54E-102 | 0.29503732 | 0.177 | 0.061 | 6.78E-98 |
| COL6A1 | 8.11E-58 | 0.29503193 | 0.822 | 0.701 | 2.16E-53 |
| BDNF | 1.33E-120 | 0.29444371 | 0.139 | 0.032 | 3.54E-116 |
| PSAP | 1.72E-116 | 0.29440862 | 0.956 | 0.881 | 4.59E-112 |
| ARF4 | 2.22E-98 | 0.29413039 | 0.772 | 0.609 | 5.93E-94 |
| EXT1 | 1.40E-104 | 0.29363126 | 0.552 | 0.351 | 3.74E-100 |
| NPR3 | 1.32E-111 | 0.29340587 | 0.278 | 0.125 | 3.52E-107 |
| SDF4 | 1.63E-99 | 0.29054874 | 0.694 | 0.505 | 4.35E-95 |
| TGFB1 | 3.22E-102 | 0.29027001 | 0.519 | 0.325 | 8.59E-98 |
| TSPAN4 | 5.75E-121 | 0.28987041 | 0.431 | 0.234 | 1.53E-116 |
| ADAMTS1 | 1.49E-66 | 0.28952539 | 0.516 | 0.357 | 3.98E-62 |
| PDLIM1 | 7.36E-82 | 0.2887623 | 0.884 | 0.753 | 1.96E-77 |
| TCF4 | 1.86E-80 | 0.28740978 | 0.664 | 0.483 | 4.95E-76 |
| EGR1 | 3.65E-64 | 0.28713738 | 0.398 | 0.256 | 9.74E-60 |
| CLMP | 3.27E-87 | 0.28666971 | 0.556 | 0.37 | 8.73E-83 |
| PDIA6 | 2.28E-95 | 0.28418621 | 0.81 | 0.647 | 6.08E-91 |
| CST3 | 4.80E-161 | 0.28315159 | 0.997 | 0.99 | 1.28E-156 |
| NNMT | 1.83E-69 | 0.28302701 | 0.883 | 0.781 | 4.89E-65 |
| TGFB2 | 1.66E-121 | 0.27985157 | 0.221 | 0.081 | 4.42E-117 |
| KDELR2 | 7.22E-94 | 0.27914733 | 0.702 | 0.521 | 1.93E-89 |
| FAM3C | 1.17E-102 | 0.2790829 | 0.584 | 0.386 | 3.12E-98 |
| DPP7 | 1.28E-94 | 0.27855106 | 0.684 | 0.493 | 3.42E-90 |
| LAMB1 | 7.80E-168 | 0.27851416 | 0.195 | 0.046 | 2.08E-163 |
| SUSD5 | 2.66E-65 | 0.27835865 | 0.818 | 0.679 | 7.11E-61 |
| PDGFA | 1.35E-57 | 0.27711793 | 0.755 | 0.623 | 3.60E-53 |
| CCDC85 B | 3.80E-80 | 0.27550776 | 0.89 | 0.792 | 1.01E-75 |
| BASP1 | 1.71E-115 | 0.27541848 | 0.491 | 0.285 | 4.55E-111 |
| PTGIS | 8.49E-69 | 0.27530801 | 0.657 | 0.493 | 2.26E-64 |
| MFGE8 | 1.74E-83 | 0.27499419 | 0.996 | 0.985 | 4.63E-79 |
| PKD2 | 8.51E-64 | 0.27446816 | 0.748 | 0.594 | 2.27E-59 |
| TAGLN2 | 8.72E-89 | 0.27368074 | 0.882 | 0.778 | 2.33E-84 |
| TMED9 | 3.03E-84 | 0.27233986 | 0.793 | 0.654 | 8.09E-80 |
| PCDH10 | 4.14E-112 | 0.27194275 | 0.27 | 0.118 | 1.10E-107 |
| ASAP2 | 1.13E-90 | 0.27185891 | 0.493 | 0.311 | 3.00E-86 |
| MYO1B | 2.29E-138 | 0.26847906 | 0.344 | 0.155 | 6.09E-134 |
| STK38 L | 8.36E-59 | 0.26626484 | 0.825 | 0.709 | 2.23E-54 |
| SERPINH1 | 1.47E-91 | 0.26377285 | 0.445 | 0.271 | 3.93E-87 |
| CCDC80 | 2.65E-47 | 0.26364849 | 0.399 | 0.27 | 7.08E-43 |
| MEGF6 | 3.19E-159 | 0.26340563 | 0.24 | 0.076 | 8.51E-155 |
| EMB | 1.41E-109 | 0.26324379 | 0.222 | 0.087 | 3.77E-105 |
| ECM2 | 9.20E-76 | 0.26308436 | 0.595 | 0.421 | 2.45E-71 |
| HSPA8 | 3.19E-70 | 0.26266217 | 0.92 | 0.854 | 8.50E-66 |
| SPRY1 | 3.42E-74 | 0.26184149 | 0.37 | 0.222 | 9.13E-70 |
| CNN3 | 3.94E-69 | 0.26077861 | 0.864 | 0.747 | 1.05E-64 |
| TGFBR2 | 2.74E-72 | 0.25935388 | 0.587 | 0.414 | 7.32E-68 |
| NUCB1 | 5.56E-84 | 0.25927487 | 0.782 | 0.623 | 1.48E-79 |
| F2R | 2.68E-186 | 0.2592446 | 0.144 | 0.016 | 7.15E-182 |
| MED13 | 1.85E-87 | 0.25890075 | 0.399 | 0.234 | 4.93E-83 |
| MYH9 | 2.66E-64 | 0.2556256 | 0.955 | 0.889 | 7.08E-60 |
| ADD3 | 6.87E-107 | 0.25554723 | 0.381 | 0.203 | 1.83E-102 |
| CTSK | 4.14E-126 | 0.25416267 | 0.334 | 0.155 | 1.11E-121 |
| IGFBP6 | 3.94E-46 | 0.25358567 | 0.94 | 0.871 | 1.05E-41 |
| COMT | 4.31E-76 | 0.25325484 | 0.744 | 0.58 | 1.15E-71 |
| RCAN1 | 1.15E-94 | 0.25252887 | 0.297 | 0.149 | 3.07E-90 |
| RPS12 | 1.56E-137 | −0.2508736 | 0.997 | 0.994 | 4.15E-133 |
| RPLP1 | 2.05E-217 | −0.2509469 | 1 | 1 | 5.48E-213 |
| BTC | 8.01E-44 | −0.251357 | 0.234 | 0.317 | 2.14E-39 |
| MT-CO3 | 3.90E-67 | −0.2517749 | 0.998 | 0.998 | 1.04E-62 |
| SLC40A1 | 7.85E-30 | −0.2518907 | 0.339 | 0.395 | 2.09E-25 |
| EIF3E | 3.74E-72 | −0.2519344 | 0.887 | 0.896 | 9.98E-68 |
| UBXN1 | 2.23E-59 | −0.2541336 | 0.812 | 0.818 | 5.94E-55 |
| C12orf57 | 5.62E-79 | −0.2562334 | 0.954 | 0.959 | 1.50E-74 |
| ADIRF | 1.14E-75 | −0.2562532 | 0.992 | 0.995 | 3.03E-71 |
| RPL39 | 1.20E-113 | −0.2596499 | 0.969 | 0.98 | 3.20E-109 |
| RPS18 | 1.24E-109 | −0.2602763 | 0.996 | 0.997 | 3.31E-105 |
| MCAM | 3.98E-58 | −0.2628023 | 0.885 | 0.888 | 1.06E-53 |
| NPM1 | 1.21E-110 | −0.2636575 | 0.969 | 0.975 | 3.23E-106 |
| RPL11 | 1.39E-181 | −0.2638312 | 0.999 | 0.998 | 3.72E-177 |
| RPL15 | 8.68E-124 | −0.2689532 | 0.995 | 0.996 | 2.31E-119 |
| TOMM20 | 5.74E-79 | −0.2690719 | 0.903 | 0.905 | 1.53E-74 |
| NOP53 | 1.56E-59 | −0.2700835 | 0.834 | 0.835 | 4.17E-55 |
| MAP3K20 | 2.40E-46 | −0.2716197 | 0.573 | 0.615 | 6.39E-42 |
| EEF1D | 1.64E-104 | −0.2717619 | 0.967 | 0.972 | 4.38E-100 |
| DDT | 9.48E-58 | −0.2719224 | 0.688 | 0.718 | 2.53E-53 |
| PLCG2 | 0.4081757 | −0.274503 | 0.733 | 0.672 | 1 |
| NPTX2 | 2.40E-56 | −0.2758177 | 0.182 | 0.28 | 6.41E-52 |
| RPL37 | 1.24E-172 | −0.2767445 | 0.995 | 0.996 | 3.31E-168 |
| RPS25 | 4.42E-208 | −0.277323 | 0.996 | 0.996 | 1.18E-203 |
| UQCRB | 5.52E-122 | −0.278269 | 0.963 | 0.971 | 1.47E-117 |
| RPL13 A | 1.27E-65 | −0.2783512 | 0.996 | 0.994 | 3.40E-61 |
| MXI1 | 6.75E-60 | −0.2797772 | 0.69 | 0.726 | 1.80E-55 |
| RPL9 | 5.05E-146 | −0.2813107 | 0.994 | 0.994 | 1.35E-141 |
| RPL36 | 5.49E-143 | −0.281842 | 0.98 | 0.983 | 1.46E-138 |
| RPL22 | 7.96E-193 | −0.2836233 | 0.992 | 0.993 | 2.12E-188 |
| RPS15 A | 1.52E-164 | −0.2849171 | 0.98 | 0.988 | 4.06E-160 |
| COX7C | 2.52E-162 | −0.2860764 | 0.976 | 0.983 | 6.71E-158 |
| MRGPRF | 7.75E-47 | −0.2862943 | 0.422 | 0.487 | 2.07E-42 |
| BTF3 | 1.45E-145 | −0.2870685 | 0.974 | 0.982 | 3.86E-141 |
| RACK1 | 4.26E-168 | −0.2892033 | 0.986 | 0.99 | 1.14E-163 |
| NCS1 | 9.74E-57 | −0.2894968 | 0.365 | 0.446 | 2.60E-52 |
| EEF1B2 | 1.30E-121 | −0.2895468 | 0.963 | 0.971 | 3.47E-117 |
| AKAP1 | 3.70E-51 | −0.2895906 | 0.312 | 0.399 | 9.88E-47 |
| DSTN | 1.87E-247 | −0.2900282 | 1 | 0.999 | 4.99E-243 |
| RPS26 | 9.78E-17 | −0.2912338 | 0.95 | 0.947 | 2.61E-12 |
| RPL30 | 4.46E-212 | −0.2913634 | 0.996 | 0.995 | 1.19E-207 |
| RPS2 | 1.95E-147 | −0.292069 | 0.995 | 0.994 | 5.20E-143 |
| RPL32 | 1.92E-222 | −0.2948768 | 0.995 | 0.996 | 5.12E-218 |
| GADD45 G | 1.85E-09 | −0.2949686 | 0.34 | 0.364 | 4.93E-05 |
| LDHB | 2.59E-81 | −0.2953564 | 0.834 | 0.851 | 6.91E-77 |
| MYH11 | 1.43E-87 | −0.296054 | 0.996 | 0.995 | 3.82E-83 |
| RPL38 | 4.69E-105 | −0.2977327 | 0.981 | 0.975 | 1.25E-100 |
| TKT | 9.21E-51 | −0.2986252 | 0.543 | 0.591 | 2.46E-46 |
| RPL37 A | 2.85E-112 | −0.2990764 | 0.997 | 0.996 | 7.59E-108 |
| PPP1R12 A | 2.83E-72 | −0.2993823 | 0.857 | 0.867 | 7.56E-68 |
| C1QTNF1 | 1.89E-49 | −0.3021769 | 0.31 | 0.396 | 5.05E-45 |
| NACA | 1.62E-202 | −0.3040117 | 0.992 | 0.993 | 4.32E-198 |
| RPL7A | 2.83E-235 | −0.3041719 | 0.996 | 0.998 | 7.54E-231 |
| RPS24 | 1.27E-218 | −0.3044556 | 0.995 | 0.995 | 3.38E-214 |
| BCAM | 1.62E-49 | −0.3069953 | 0.417 | 0.492 | 4.33E-45 |
| ADRA2C | 6.76E-53 | −0.3073009 | 0.318 | 0.413 | 1.80E-48 |
| RPL36AL | 3.35E-149 | −0.3078249 | 0.973 | 0.98 | 8.93E-145 |
| RPL27 A | 2.79E-51 | −0.3086457 | 0.967 | 0.953 | 7.45E-47 |
| RPS6 | 1.81E-155 | −0.3112936 | 0.995 | 0.996 | 4.83E-151 |
| FOXN3 | 1.17E-63 | −0.3139266 | 0.517 | 0.591 | 3.12E-59 |
| SELENOM | 5.16E-165 | −0.3161689 | 0.989 | 0.992 | 1.38E-160 |
| RYR2 | 9.56E-78 | −0.3166881 | 0.155 | 0.276 | 2.55E-73 |
| GUCY1A1 | 7.28E-48 | −0.3202333 | 0.383 | 0.457 | 1.94E-43 |
| RPL10 A | 3.09E-220 | −0.3212161 | 0.992 | 0.993 | 8.24E-216 |
| RPS3 | 3.48E-261 | −0.3225074 | 0.994 | 0.995 | 9.29E-257 |
| RPL18 A | 5.13E-260 | −0.3227531 | 0.994 | 0.996 | 1.37E-255 |
| SMTN | 1.49E-57 | −0.3234942 | 0.495 | 0.557 | 3.98E-53 |
| SYNPO2 | 1.38E-61 | −0.324197 | 0.753 | 0.779 | 3.68E-57 |
| RPL6 | 1.18E-277 | −0.3268196 | 0.995 | 0.995 | 3.14E-273 |
| SORBS2 | 1.37E-64 | −0.3291678 | 0.7 | 0.73 | 3.66E-60 |
| SLC25A6 | 5.12E-123 | −0.3298817 | 0.93 | 0.942 | 1.37E-118 |
| RPS10 | 8.10E-111 | −0.3299201 | 0.875 | 0.899 | 2.16E-106 |
| RPL19 | 7.11E-273 | −0.331838 | 0.997 | 0.996 | 1.90E-268 |
| SOD3 | 1.45E-142 | −0.3323687 | 0.985 | 0.983 | 3.87E-138 |
| RHOB | 2.67E-54 | −0.3328342 | 0.696 | 0.736 | 7.11E-50 |
| CEBPD | 3.90E-22 | −0.3356818 | 0.491 | 0.532 | 1.04E-17 |
| RPS16 | 2.12E-182 | −0.3358515 | 0.994 | 0.994 | 5.66E-178 |
| RPS3A | 5.08E-280 | −0.3361857 | 0.992 | 0.992 | 1.36E-275 |
| RPL21 | 1.69E-178 | −0.336581 | 0.996 | 0.996 | 4.51E-174 |
| RPL8 | 2.02E-239 | −0.3390078 | 0.998 | 0.997 | 5.39E-235 |
| CNN1 | 1.76E-85 | −0.3402613 | 0.938 | 0.953 | 4.68E-81 |
| RPL24 | 2.62E-276 | −0.3406548 | 0.992 | 0.994 | 6.99E-272 |
| RPL26 | 4.53E-234 | −0.3411506 | 0.986 | 0.99 | 1.21E-229 |
| ATP5MC2 | 5.53E-138 | −0.3414212 | 0.937 | 0.949 | 1.48E-133 |
| RPL29 | 1.48E-227 | −0.3431114 | 0.991 | 0.992 | 3.95E-223 |
| C6orf48 | 2.71E-35 | −0.3432914 | 0.591 | 0.608 | 7.22E-31 |
| MYLK | 1.72E-102 | −0.3439244 | 0.937 | 0.937 | 4.59E-98 |
| RPL41 | 0 | −0.3494831 | 0.997 | 0.998 | 0 |
| RPS27 A | 4.92E-302 | −0.3496164 | 0.997 | 0.995 | 1.31E-297 |
| RPS27 | 2.55E-170 | −0.3507336 | 0.995 | 0.997 | 6.81E-166 |
| RPL35 A | 1.41E-278 | −0.3524584 | 0.992 | 0.992 | 3.76E-274 |
| RPS13 | 1.23E-235 | −0.3531428 | 0.994 | 0.992 | 3.29E-231 |
| RPL34 | 0 | −0.3540056 | 0.997 | 0.997 | 0 |
| DACT3 | 2.77E-90 | −0.3628224 | 0.425 | 0.531 | 7.38E-86 |
| RPS28 | 3.88E-250 | −0.363127 | 0.991 | 0.994 | 1.04E-245 |
| RPL23 A | 1.60E-219 | −0.3721572 | 0.997 | 0.996 | 4.25E-215 |
| RPS21 | 6.58E-172 | −0.3752784 | 0.945 | 0.964 | 1.75E-167 |
| ACTG2 | 2.78E-50 | −0.3792845 | 0.635 | 0.702 | 7.41E-46 |
| MYL9 | 2.46E-170 | −0.3793654 | 0.999 | 0.999 | 6.55E-166 |
| RPS5 | 8.39E-272 | −0.3852327 | 0.986 | 0.989 | 2.24E-267 |
| FILIP1 | 1.04E-83 | −0.3918581 | 0.642 | 0.711 | 2.76E-79 |
| NET1 | 8.12E-75 | −0.3939533 | 0.597 | 0.654 | 2.17E-70 |
| SNHG8 | 1.11E-94 | −0.3963151 | 0.666 | 0.722 | 2.95E-90 |
| RPS7 | 0 | −0.4035053 | 0.992 | 0.995 | 0 |
| RPS8 | 0 | −0.404585 | 0.996 | 0.997 | 0 |
| PTP4A3 | 4.00E-129 | −0.4079394 | 0.227 | 0.388 | 1.07E-124 |
| RPL7 | 1.06E-265 | −0.4079924 | 0.991 | 0.991 | 2.83E-261 |
| LHFPL6 | 2.09E-97 | −0.4111448 | 0.725 | 0.757 | 5.56E-93 |
| RPL18 | 0 | −0.4192863 | 0.995 | 0.997 | 0 |
| ZFAS1 | 2.88E-112 | −0.4279933 | 0.726 | 0.774 | 7.69E-108 |
| FAU | 0 | −0.4283129 | 0.996 | 0.997 | 0 |
| FABP3 | 3.77E-116 | −0.4288539 | 0.285 | 0.429 | 1.01E-111 |
| RPL14 | 0 | −0.4348216 | 0.996 | 0.997 | 0 |
| BEX2 | 3.02E-134 | −0.4357761 | 0.113 | 0.273 | 8.06E-130 |
| RPS14 | 0 | −0.4435065 | 0.992 | 0.994 | 0 |
| EPB41L4A-AS1 | 4.20E-112 | −0.4474936 | 0.488 | 0.59 | 1.12E-107 |
| ID4 | 5.60E-93 | −0.4477053 | 0.783 | 0.84 | 1.49E-88 |
| RPL5 | 0 | −0.4490334 | 0.992 | 0.994 | 0 |
| PLN | 2.45E-184 | −0.4565461 | 0.955 | 0.962 | 6.53E-180 |
| ID3 | 2.28E-110 | −0.4585242 | 0.882 | 0.922 | 6.07E-106 |
| SCX | 1.51E-65 | −0.4618221 | 0.536 | 0.61 | 4.03E-61 |
| ID1 | 9.73E-56 | −0.4642694 | 0.284 | 0.39 | 2.59E-51 |
| CARMN | 8.17E-98 | −0.4960061 | 0.666 | 0.729 | 2.18E-93 |
| CKB | 3.69E-81 | −0.5027735 | 0.222 | 0.345 | 9.84E-77 |
| TCAP | 8.31E-144 | −0.5241113 | 0.084 | 0.239 | 2.22E-139 |
| RARRES2 | 1.87E-171 | −0.5361741 | 0.398 | 0.617 | 4.99E-167 |
| CSRP2 | 1.88E-116 | −0.5461695 | 0.644 | 0.733 | 5.01E-112 |
| RRAD | 7.73E-134 | −0.5682217 | 0.292 | 0.456 | 2.06E-129 |
| RPS19 | 0 | −0.5795184 | 0.992 | 0.996 | 0 |
| SBSPON | 5.39E-226 | −0.5835834 | 0.36 | 0.57 | 1.44E-221 |
| MT1X | 4.22E-25 | −0.5963161 | 0.548 | 0.573 | 1.13E-20 |
| TIMP3 | 0 | −0.7099549 | 0.551 | 0.762 | 0 |
| DES | 7.89E-55 | −0.7360545 | 0.196 | 0.295 | 2.10E-50 |
| C11orf96 | 0 | −0.8586091 | 0.968 | 0.99 | 0 |
| ACTC1 | 0 | −1.4926102 | 0.384 | 0.69 | 0 |
pct.1, Fraction of modulated smooth muscle cell–expressing gene; pct.2, fraction of smooth muscle cell–expressing gene.
TABLE E4.
Gene set enrichment analysis results comparing modulated smooth muscle cell to smooth muscle cell cluster in patients with Loeys-Dietz syndrome only
| ID | Description | Set size | Enrichment score | NES | P value | p.adjust | Q values | Rank | core_enrichment |
|---|---|---|---|---|---|---|---|---|---|
|
| |||||||||
| GO:0007584 | Response to nutrient | 11 | 0.824 | 2.444 | 1.29E-06 | 4.26E-05 | 3.26E-05 | 38 | TNFRSF11 B GAS6 IGFBP2 SFRP1 COL1A1 SPARC CCND1 PTN |
| GO:0001501 | Skeletal system development | 39 | 0.534 | 2.199 | 8.59E-05 | 1.89E-03 | 1.45E-03 | 28 | CYTL1 VCAN TNFRSF11 B COL1A2 MGP COL3A1 EFEMP1 SFRP1 COL1A1 TIMP1 MMP2 |
| GO:0031214 | Biomineral tissue development | 10 | 0.743 | 2.173 | 2.19E-04 | 4.34E-03 | 3.32E-03 | 60 | COL1A2 MGP GAS6 COL1A1 OMD PTN ASPN |
| GO:0110148 | Biomineralization | 10 | 0.743 | 2.173 | 2.19E-04 | 4.34E-03 | 3.32E-03 | 60 | COL1A2 MGP GAS6 COL1A1 OMD PTN ASPN |
| GO:0031667 | Response to nutrient levels | 17 | 0.639 | 2.164 | 6.82E-04 | 1.08E-02 | 8.27E-03 | 38 | TNFRSF11 B GAS6 IGFBP2 SFRP1 COL1A1 SPARC CCND1 PTN |
| GO:0010810 | Regulation of cell-substrate adhesion | 18 | 0.623 | 2.137 | 7.40E-04 | 1.13E-02 | 8.63E-03 | 56 | FN1 SERPINE1 COL8A1 SFRP1 COL1A1 PTN S100A10 THY1 CDH13 |
| GO:0007155 | Cell adhesion | 86 | 0.460 | 2.126 | 1.71E-05 | 4.37E-04 | 3.35E-04 | 134 | VCAN FN1 SERPINE1 GAS6 COL8A1 COL3A1 ITGBL1 IGFBP2 SFRP1 COL1A1 CD55 MYH10 OMD PTN TNFRSF12 A S100A10 HMCN1 THY1 ISLR CDH13 FXYD5 CXCL12 THBS2 ITGA11 CDH11 ITGA1 IGFBP7 FBLN5 ALCAM ITGB1 MYL12 A RGCC COL14A1 ITGB5 COL6A2 ANXA1 MXRA8 HAPLN1 ARHGDIB COL12A1 EDIL3 THBS1 LRP1 FBN1 SSPN CDH2FAP S100A11 |
| GO:0022610 | Biological adhesion | 86 | 0.460 | 2.126 | 1.71E-05 | 4.37E-04 | 3.35E-04 | 134 | VCAN FN1 SERPINE1 GAS6 COL8A1 COL3A1 ITGBL1 IGFBP2 SFRP1 COL1A1 CD55 MYH10 OMD PTN TNFRSF12 A S100A10 HMCN1 THY1 ISLR CDH13 FXYD5 CXCL12 THBS2 ITGA11 CDH11 ITGA1 IGFBP7 FBLN5 ALCAM ITGB1 MYL12 A RGCC COL14A1 ITGB5 COL6A2 ANXA1 MXRA8 HAPLN1 ARHGDIB COL12A1 EDIL3 THBS1 LRP1 FBN1 SSPN CDH2FAP S100A11 |
| GO:0031589 | Cell-substrate adhesion | 34 | 0.526 | 2.110 | 3.69E-04 | 6.64E-03 | 5.08E-03 | 79 | FN1 SERPINE1 GAS6 COL8A1 COL3A1 ITGBL1 SFRP1 COL1A1 PTN S100A10 THY1 CDH13 ITGA11 ITGA1 FBLN5 ITGB1 |
| GO:0030336 | Negative regulation of cell migration | 19 | 0.606 | 2.108 | 8.30E-04 | 1.24E-02 | 9.49E-03 | 123 | SERPINE1 COL3A1 SFRP1 TIMP1 PTN IGFBP5 THY1 IGFBP3 CXCL12 SULF1 GJA1 RGCC ARHGDIB THBS1 LRP1 |
| GO:0009991 | Response to extracellular stimulus | 18 | 0.605 | 2.077 | 1.74E-03 | 2.18E-02 | 1.67E-02 | 38 | TNFRSF11 B GAS6 IGFBP2 SFRP1 COL1A1 SPARC CCND1 PTN |
| GO:0001503 | Ossification | 32 | 0.521 | 2.056 | 1.32E-03 | 1.87E-02 | 1.43E-02 | 70 | VCAN COL1A2 MGP SFRP1 COL1A1 SPARC MMP2 OMD PTN IGFBP5 TPM4 ASPN ITGA11 CDH11 |
| GO:0007167 | Enzyme-linked receptor protein signaling pathway | 55 | 0.468 | 2.054 | 1.72E-04 | 3.69E-03 | 2.83E-03 | 128 | COL1A2 LTBP2 GAS6 COL3A1 EFEMP1 IGFBP2 SFRP1 COL1A1 MMP2 HTRA1 LTBP1 PTN LTBP4 IGFBP5 FSTL1 IGFBP3 PDGFD DKK3 CDH13 ASPN ITGA1 SULF1 SFRP4 ITGB5 CRIM1 COL4A1 HSPA5 COL4A2 THBS1 LRP1 TGFBR1 FBN1 |
| GO:0040013 | Negative regulation of locomotion | 20 | 0.580 | 2.046 | 1.53E-03 | 2.02E-02 | 1.54E-02 | 123 | SERPINE1 COL3A1 SFRP1 TIMP1 PTN IGFBP5 THY1 IGFBP3 CXCL12 SULF1 GJA1 RGCC ARHGDIB THBS1 LRP1 |
| GO:0051271 | Negative regulation of cellular component movement | 20 | 0.580 | 2.046 | 1.53E-03 | 2.02E-02 | 1.54E-02 | 123 | SERPINE1 COL3A1 SFRP1 TIMP1 PTN IGFBP5 THY1 IGFBP3 CXCL12 SULF1 GJA1 RGCC ARHGDIB THBS1 LRP1 |
| GO:2000146 | Negative regulation of cell motility | 20 | 0.580 | 2.046 | 1.53E-03 | 2.02E-02 | 1.54E-02 | 123 | SERPINE1 COL3A1 SFRP1 TIMP1 PTN IGFBP5 THY1 IGFBP3 CXCL12 SULF1 GJA1 RGCC ARHGDIB THBS1 LRP1 |
| GO:0001935 | Endothelial cell proliferation | 11 | 0.688 | 2.041 | 1.90E-03 | 2.24E-02 | 1.72E-02 | 131 | SPARC CDH13 CXCL12 SULF1 GJA1 CYBA RGCC SCG2 THBS1 TGFBR1 MYDGF |
| GO:0001936 | Regulation of endothelial cell proliferation | 11 | 0.688 | 2.041 | 1.90E-03 | 2.24E-02 | 1.72E-02 | 131 | SPARC CDH13 CXCL12 SULF1 GJA1 CYBA RGCC SCG2 THBS1 TGFBR1 MYDGF |
| GO:0001568 | Blood vessel development | 52 | 0.472 | 2.036 | 5.18E-04 | 8.55E-03 | 6.54E-03 | 147 | FN1 COL1A2 SERPINE1 COL8A1 SFRP1 COL1A1 SPARC MMP2 PTN TNFRSF12 ATHY1 PDGFD CDH13 THBS2 ITGB1 LOXL1 SULF1 RGCC ANXA1 COL4A1 AQP1 COL4A2 SCG2 THBS1 LRP1 TGFBR1 MYDGF CDH2 FAP LOX FKBP10 ITGAV ANTXR1 SMOC2 |
| GO:0001944 | Vasculature development | 52 | 0.472 | 2.036 | 5.18E-04 | 8.55E-03 | 6.54E-03 | 147 | FN1 COL1A2 SERPINE1 COL8A1 SFRP1 COL1A1 SPARC MMP2 PTN TNFRSF12 ATHY1 PDGFD CDH13 THBS2 ITGB1 LOXL1 SULF1 RGCC ANXA1 COL4A1 AQP1 COL4A2 SCG2 THBS1 LRP1 TGFBR1 MYDGF CDH2 FAP LOX FKBP10 ITGAV ANTXR 1 SMOC2 |
| GO:0007229 | Integrin-mediated signaling pathway | 15 | 0.619 | 2.023 | 2.64E-03 | 2.78E-02 | 2.13E-02 | 93 | FN1 COL3A1 ITGBL1 TIMP1 PTNTHY1 ITGA11 ITGA1 ITGB1 ITGB5 |
| GO:0007166 | Cell surface receptor signaling pathway | 96 | 0.432 | 2.012 | 5.20E-05 | 1.25E-03 | 9.56E-04 | 124 | FN1 COL1A2 SERPINE1 LTBP2 GAS6 COL3A1 EFEMP1 ITGBL1 IGFBP2 SFRP1 COL1A1 TIMP1 CD55 MMP2 CCND1 HTRA1 LTBP1 PTN TNFRSF12 A LTBP4 IGFBP5 FSTL1 THY1 IGFBP3 PDGFD DKK3 CDH13 CXCL12 ASPN ITGA11 GEM ITGA1 ITGB1 SULF1 SFRP4 ITGB5 ANXA1 CRIM1 COL4A1 TMSB4X HSPA5 PDIA3 COL4A2 SCG2 RBMS3 THBS1 LRP1 TGFBR1 |
| GO:0009719 | Response to endogenous stimulus | 76 | 0.438 | 1.998 | 1.86E-04 | 3.88E-03 | 2.97E-03 | 140 | TNFRSF11 B COL1A2 LTBP2 COL3A1 IGFBP2 SFRP1 COL1A1 SPARC TIMP1 MMP2 CCND1 HTRA1 LTBP1 PTN LTBP4 IGFBP5 FSTL1 PDGFD DKK3 CDH13 CXCL12 ASPN HSP90B1 IGFBP7 ITGB1 SULF1 SFRP4 GJA1 CYBA COL5A2 ITGB5 ANXA1 CRIM1 COL4A1 HSPA5 AQP1 COL4A2 THBS1 LRP1 TGFBR1 FBN1 TIMP2 MAP1B LOX PAM |
| GO:0071310 | Cellular response to organic substance | 85 | 0.431 | 1.995 | 2.32E-04 | 4.47E-03 | 3.43E-03 | 111 | COL1A2 SERPINE1 LTBP2 GAS6 COL3A1 IGFBP2 SFRP1 COL1A1 CD55 MMP2 CCND1 HTRA1 LTBP1 PTN LTBP4 IGFBP5 FSTL1 PDGFD DKK3 CXCL12 ASPN PCOLCE2 PLSCR4 CLU HSP90B1 IGFBP7 SULF1 SFRP4 GJA1 CYBA COL5A2 ITGB5 ANXA1 CRIM1 TUBA1B COL4A1 TMSB4X HSPA5 PDIA3 AQP1 COL4A2 |
| GO:0007160 | Cell-matrix adhesion | 23 | 0.549 | 1.986 | 2.26E-03 | 2.56E-02 | 1.96E-02 | 79 | FN1 SERPINE1 COL3A1 ITGBL1 SFRP1 S100A10 THY1 CDH13 ITGA11 ITGA1 FBLN5 ITGB1 |
| GO:0090092 | Regulation of transmembrane receptor protein serine/threonine kinase signaling pathway | 20 | 0.562 | 1.983 | 2.89E-03 | 2.97E-02 | 2.27E-02 | 137 | SFRP1 HTRA1 LTBP1 LTBP4 FSTL1 DKK3 ASPN SULF1 SFRP4 CRIM1 HSPA5 THBS1 LRP1 TGFBR1 FBN1 LOX |
| GO:0050673 | Epithelial cell proliferation | 24 | 0.543 | 1.976 | 2.31E-03 | 2.57E-02 | 1.97E-02 | 133 | COL8A1 SFRP1 SPARC CCND1 HTRA1 PTN IGFBP5 CDH13 CXCL12 SULF1 GJA1 CYBA RGCC SCG2 THBS1 TGFBR1 MYDGF FAP |
| GO:0042476 | Odontogenesis | 11 | 0.664 | 1.969 | 4.07E-03 | 4.03E-02 | 3.08E-02 | 33 | TNFRSF11 B COL1A2 SERPINE1 COL1A1 HTRA1 |
| GO:0010811 | Positive regulation of cell-substrate adhesion | 14 | 0.617 | 1.967 | 2.79E-03 | 2.90E-02 | 2.22E-02 | 56 | FN1 COL8A1 SFRP1 PTN S100A10 THY1 CDH13 |
| GO:0051093 | Negative regulation of developmental process | 40 | 0.476 | 1.962 | 5.09E-04 | 8.55E-03 | 6.54E-03 | 128 | TNFRSF11 B SERPINE1 GAS6 EFEMP1 SFRP1 SPARC CCND1 PTN IGFBP5 THY1 ASPN THBS2 ITGB1 SULF1 GJA1 COL5A2 RGCC LRRC17 ANXA1 CRIM1 COL4A2 THBS1 TGFBR1 FBN1 |
| GO:0001525 | Angiogenesis | 37 | 0.478 | 1.948 | 2.47E-03 | 2.64E-02 | 2.02E-02 | 147 | FN1 SERPINE1 COL8A1 SFRP1 SPARC MMP2 PTN TNFRSF12 A THY1 CDH13 THBS2 ITGB1 SULF1 RGCC ANXA1 COL4A1 AQP1 COL4A2 SCG2 THBS1 TGFBR1 MYDGF FAP ITGAV SMOC2 |
| GO:0030334 | Regulation of cell migration | 49 | 0.455 | 1.947 | 1.43E-03 | 1.99E-02 | 1.52E-02 | 124 | FN1 SERPINE1 GAS6 COL3A1 SFRP1 COL1A1 SPARC TIMP1 PTN IGFBP5 THY1 IGFBP3 PDGFD CDH13 CXCL12 TMSB10 ITGB1 SULF1 GJA1 RGCC ANXA1 TMSB4X HSPA5 ARHGDIB THBS1 LRP1 TGFBR1 |
| GO:0030155 | Regulation of cell adhesion | 36 | 0.478 | 1.934 | 2.06E-03 | 2.40E-02 | 1.84E-02 | 59 | FN1 SERPINE1 COL8A1 IGFBP2 SFRP1 COL1A1 CD55 PTN S100A10 THY1 CDH13 FXYD5 CXCL12 |
| GO:0010648 | Negative regulation of cell communication | 47 | 0.455 | 1.933 | 1.76E-03 | 2.18E-02 | 1.67E-02 | 132 | SERPINE1 GAS6 IGFBP2 SFRP1 HTRA1 LTBP1 IGFBP5 THY1 IGFBP3 DKK3 CXCL12 ASPN CLU ITGA1 ITGB1 SULF1 SFRP4 GJA1 CRIM1 TMSB4X HSPA5 SCG2 RBMS3 THBS1 LRP1 TGFBR1 FBN1 TIMP2 CDH2 |
| GO:0023057 | Negative regulation of signaling | 47 | 0.455 | 1.933 | 1.76E-03 | 2.18E-02 | 1.67E-02 | 132 | SERPINE1 GAS6 IGFBP2 SFRP1 HTRA1 LTBP1 IGFBP5 THY1 IGFBP3 DKK3 CXCL12 ASPN CLU ITGA1 ITGB1 SULF1 SFRP4 GJA1 CRIM1 TMSB4X HSPA5 SCG2 RBMS3 THBS1 LRP1 TGFBR1 FBN1 TIMP2 CDH2 |
| GO:2000026 | Regulation of multicellular organismal development | 51 | 0.449 | 1.932 | 2.18E-03 | 2.50E-02 | 1.92E-02 | 141 | FN1 SERPINE1 MGP GAS6 EFEMP1 SFRP1 SPARC CCND1 OMD PTNTHY1 CXCL12 ASPN THBS2 ITGB1 SULF1 SFRP4 GJA1 RGCC LRRC17 ANXA1 AQP1 COL4A2 THBS1 LRP1 TGFBR1 FBN1 MYDGF MAP1B LOX KRT17 |
| GO:0045785 | Positive regulation of cell adhesion | 25 | 0.518 | 1.920 | 4.14E-03 | 4.03E-02 | 3.08E-02 | 59 | FN1 COL8A1 IGFBP2 SFRP1 CD55PTN S100A10THY1 CDH13 CXCL12 |
| GO:0040012 | Regulation of locomotion | 52 | 0.442 | 1.905 | 2.45E-03 | 2.64E-02 | 2.02E-02 | 124 | FN1 SERPINE1 GAS6 COL3A1 SFRP1 COL1A1 SPARC TIMP1 PTN IGFBP5 THY1 IGFBP3 PDGFD CDH13 CXCL12 TMSB10 ITGB1 SULF1 GJA1 RGCC ANXA1 TMSB4X HSPA5 ARHGDIB SCG2 THBS1 LRP1 TGFBR1 |
| GO:0071559 | Response to transforming growth factor B | 26 | 0.510 | 1.903 | 4.44E-03 | 4.14E-02 | 3.17E-02 | 60 | COL1A2 LTBP2 COL3A1 SFRP1 COL1A1 HTRA1 LTBP1 LTBP4 PDGFD DKK3 ASPN |
| GO:0071560 | Cellular response to transforming growth factor β stimulus | 26 | 0.510 | 1.903 | 4.44E-03 | 4.14E-02 | 3.17E-02 | 60 | COL1A2 LTBP2 COL3A1 SFRP1 COL1A1 HTRA1 LTBP1 LTBP4 PDGFD DKK3 ASPN |
| GO:0009968 | Negative regulation of signal transduction | 46 | 0.448 | 1.901 | 3.13E-03 | 3.18E-02 | 2.44E-02 | 132 | SERPINE1 GAS6 IGFBP2 SFRP1 HTRA1 LTBP1 IGFBP5 THY1 IGFBP3 DKK3 CXCL12 ASPN CLU ITGA1 ITGB1 SULF1 SFRP4 CRIM1 TMSB4X HSPA5 SCG2 RBMS3 THBS1 LRP1 TGFBR1 FBN1 TIMP2 CDH2 |
| GO:0048856 | Anatomic structure development | 181 | 0.387 | 1.894 | 8.21E-05 | 1.87E-03 | 1.43E-03 | 147 | CYTL1 VCAN TNFRSF11 B FN1 COL1A2 SERPINE1 MGP GAS6 COL8A1 ELN COL3A1 EFEMP1 SFRP1 COL1A1 SPARC CST6 TIMP1 MMP2 MYH10 CCND1 OMD HTRA1 PTN TNFRSF12 A CTSZ CRISPLD1 S100A10 LTBP4 IGFBP5 FSTL1 THY1 IGFBP3 PDGFD DKK3 CDH13 CXCL12 ASPN PRELP CLU THBS2 ITGA11 CDH11 ITGA1 IGFBP7 ALCAM ITGB1 LOXL1 SULF1 MFAP5 SFRP4 MYL12 A GJA1 COL5A2 RGCC RCN3 ITGB5 LRRC17 ITM2B ANXA1 CRIM1 COL4A1 MXRA8 HAPLN1 HSPA5 ARHGDIB AQP1 COL4A2 SCG2 MYL12 B COL12A1 BGN THBS1 LRP1 TGFBR1 FHL1 FBN1 TIMP2 MYDGF CDH2 FAP MAP1B PPIB LOX PAM KRT17 FKBP10 ITGAV ANTXR1 SMOC2 |
| GO:0071495 | Cellular response to endogenous stimulus | 62 | 0.424 | 1.886 | 1.81E-03 | 2.21E-02 | 1.69E-02 | 137 | COL1A2 LTBP2 COL3A1 IGFBP2 SFRP1 COL1A1 MMP2 HTRA1 LTBP1 PTN LTBP4 IGFBP5 FSTL1 PDGFD DKK3 ASPN HSP90B1 IGFBP7 SULF1 SFRP4 GJA1 CYBA COL5A2 ITGB5 ANXA1 CRIM1 COL4A1 HSPA5 AQP1 COL4A2 THBS1 LRP1 TGFBR1 FBN1 MAP1B LOX |
| GO:0007275 | Multicellular organism development | 164 | 0.383 | 1.877 | 8.25E-05 | 1.87E-03 | 1.43E-03 | 147 | CYTL1 VCAN TNFRSF11 B FN1 COL1A2 SERPINE1 MGP GAS6 COL8A1 ELN COL3A1 EFEMP1 SFRP1 COL1A1 SPARC TIMP1 MMP2 CCND1 OMD HTRA1 PTN TNFRSF12 A CTSZ LTBP4 IGFBP5 FSTL1 THY1 PDGFD DKK3 CDH13 CXCL12 ASPN PRELP CLU THBS2 ITGA11 CDH11 ITGA1 IGFBP7 ALCAM ITGB1 LOXL1 SULF1 MFAP5 SFRP4 GJA1 COL5A2 RGCC RCN3 ITGB5 LRRC17 ITM2B ANXA1 CRIM1 COL4A1 MXRA8 HAPLN1 HSPA5 ARHGDIB AQP1 COL4A2 SCG2 COL12A1 BGN THBS1 LRP1 TGFBR1 FHL1 FBN1 TIMP2 MYDGF CDH2 FAP MAP1B PPIB LOX PAM KRT17 FKBP10 ITGAV ANTXR1 SMOC2 |
| GO:2000145 | Regulation of cell motility | 51 | 0.435 | 1.871 | 4.31E-03 | 4.11E-02 | 3.14E-02 | 124 | FN1 SERPINE1 GAS6 COL3A1 SFRP1 COL1A1 SPARC TIMP1 PTN IGFBP5 THY1 IGFBP3 PDGFD CDH13 CXCL12 TMSB10 ITGB1 SULF1 GJA1 RGCC ANXA1 TMSB4X HSPA5 ARHGDIB THBS1 LRP1 TGFBR1 |
| GO:0070887 | Cellular response to chemical stimulus | 102 | 0.398 | 1.869 | 6.78E-04 | 1.08E-02 | 8.27E-03 | 112 | COL1A2 SERPINE1 LTBP2 GAS6 COL3A1 FMO2 IGFBP2 SFRP1 COL1A1 CD55 MMP2 CCND1 HTRA1 LTBP1 PTN LTBP4 IGFBP5 FSTL1 PDGFD DKK3 CXCL12 ASPN PCOLCE2 PLSCR4 CLU HSP90B1 ITGA1 IGFBP7 FBLN5 SULF1 SFRP4 GJA1 CYBA COL5A2 RGCC ITGB5 ANXA1 CRIM1 TUBA1B COL4A1 TMSB4X HSPA5 PDIA3 AQP1 COL4A2 SCG2 |
| GO:0048514 | Blood vessel morphogenesis | 46 | 0.439 | 1.861 | 4.75E-03 | 4.28E-02 | 3.28E-02 | 147 | FN1 SERPINE1 COL8A1 SFRP1 SPARC MMP2 PTN TNFRSF12 A THY 1 CDH13 THBS2 ITGB1 SULF1 RGCC ANXA1 COL4A1 AQP1 COL4A2 SCG2 THBS1 LRP1 TGFBR1 MYDGF CDH2 FAP LOX FKBP10 ITGAV SMOC2 |
| GO:0010033 | Response to organic substance | 111 | 0.392 | 1.856 | 4.11E-04 | 7.24E-03 | 5.54E-03 | 111 | TNFRSF11 B COL1A2 SERPINE1 LTBP2 GAS6 COL3A1 IGFBP2 SFRP1 COL1A1 SPARC TIMP1 CD55 MMP2 CCND1 HTRA1 LTBP1 PTN LTBP4 IGFBP5 FSTL1 PDGFD DKK3 CDH13 CXCL12 ASPN PCOLCE2 PLSCR4 CLU HSP90B1 IGFBP7 ITGB1 LOXL1 SULF1 SFRP4 GJA1 CYBA COL5A2 RCN3 ITGB5 COL6A2 ANXA1 CRIM1 TUBA1B COL4A1 TMSB4X HSPA5 PDIA3 AQP1 COL4A2 |
| GO:0002682 | Regulation of immune system process | 35 | 0.459 | 1.853 | 4.99E-03 | 4.44E-02 | 3.40E-02 | 98 | SERPINE1 GAS6 COL3A1 IGFBP2 SFRP1 CD55 HTRA1 CFH PTN THY1 PDGFD CXCL12 CLU CYBA RGCC LRRC17 ANXA1 |
| GO:0070848 | Response to growth factor | 44 | 0.437 | 1.824 | 4.55E-03 | 4.15E-02 | 3.17E-02 | 137 | COL1A2 LTBP2 GAS6 COL3A1 SFRP1 COL1A1 HTRA1 LTBP1 PTN LTBP4 FSTL1 PDGFD DKK3 ASPN SULF1 SFRP4 ITGB5 ANXA1 CRIM1 HSPA5 COL4A2 THBS1 TGFBR1 FBN1 MAP1B LOX |
| GO:0071363 | Cellular response to growth factor stimulus | 44 | 0.437 | 1.824 | 4.55E-03 | 4.15E-02 | 3.17E-02 | 137 | COL1A2 LTBP2 GAS6 COL3A1 SFRP1 COL1A1 HTRA1 LTBP1 PTN LTBP4 FSTL1 PDGFD DKK3 ASPN SULF1 SFRP4 ITGB5 ANXA1 CRIM1 HSPA5 COL4A2 THBS1 TGFBR1 FBN1 MAP1B LOX |
| GO:0048731 | System development | 153 | 0.370 | 1.804 | 3.20E-04 | 6.03E-03 | 4.62E-03 | 147 | CYTL1 VCAN TNFRSF11 B FN1 COL1A2 SERPINE1 MGP GAS6 COL8A1 ELN COL3A1 EFEMP1 SFRP1 COL1A1 SPARC TIMP1 MMP2 CCND1 OMD HTRA1 PTN TNFRSF12 A CTSZ IGFBP5 THY1 PDGFD DKK3 CDH13 CXCL12 ASPN PRELP CLU THBS2 ITGA11 CDH11 ITGA1 ALCAM ITGB1 LOXL1 SULF1 MFAP5 SFRP4 GJA1 COL5A2 RGCC RCN3 LRRC17 ITM2B ANXA1 CRIM1 COL4A1 MXRA8 HAPLN1 HSPA5 AQP1 COL4A2 SCG2 BGN THBS1 LRP1 TGFBR1 FHL1 FBN1 TIMP2 MYDGF CDH2 FAP MAP1B PPIB LOX PAM KRT17 FKBP10 ITGAV ANTXR1 SMOC2 |
| GO:0009653 | Anatomic structure morphogenesis | 122 | 0.374 | 1.787 | 7.02E-04 | 1.09E-02 | 8.35E-03 | 147 | TNFRSF11 B FN1 COL1A2 SERPINE1 MGP COL8A1 ELN EFEMP1 SFRP1 COL1A1 SPARC CST6 MMP2 MYH10 HTRA1 PTN TNFRSF12 A CTSZ CRISPLD1 S100A10IGFBP5 THY1 DKK3 CDH13 CXCL12 ASPN CLU THBS2 CDH11 ITGA1 ALCAM ITGB1 SULF1 MFAP5 SFRP4 MYL12 A GJA1 COL5A2 RGCC ITGB5 ANXA1 COL4A1 HSPA5 AQP1 COL4A2 SCG2 MYL12 B COL12A1 THBS1 LRP1 TGFBR1 FHL1 FBN1 MYDGF CDH2 FAP MAP1B LOX PAM KRT17 FKBP10 ITGAV ANTXR1 SMOC2 |
| GO:0016477 | Cell migration | 73 | 0.390 | 1.769 | 3.82E-03 | 3.83E-02 | 2.93E-02 | 137 | FN1 SERPINE1 GAS6 COL3A1 ITGBL1 SFRP1 COL1A1 SPARC TIMP1 PTN IGFBP5 FSTL1 THY1 IGFBP3 PDGFD CDH13 CXCL12 ITGA11 TMSB10 ITGA1 ITGB1 SULF1 GJA1 RGCC ITGB5 ANXA1 TMSB4X HSPA5 ARHGDIB SCG2 THBS1 LRP1 TGFBR1 CDH2 FAP S100A11 MAP1B PPIB LOX |
| GO:0042221 | Response to chemical | 138 | 0.366 | 1.764 | 9.99E-04 | 1.44E-02 | 1.10E-02 | 112 | TNFRSF11 B COL1A2 SERPINE1 LTBP2 GAS6 COL3A1 FMO2 IGFBP2 SFRP1 COL1A1 SPARC TIMP1 CD55 MMP2 CCND1 HTRA1 LTBP1 PTN S100A10 LTBP4 IGFBP5 FSTL1 PDGFD DKK3 CDH13 CXCL12 ASPN PCOLCE2 PLSCR4 CLU HSP90B1 ITGA1 IGFBP7 FBLN5 ALCAM ITGB1 LOXL1 SULF1 SFRP4 GJA1 CYBA COL5A2 RGCC RCN3 ITGB5 COL6A2 ANXA1 CRIM1 TUBA1B COL4A1 NUCB2 TMSB4X HSPA5 PDIA3 AQP1 COL4A2 SCG2 |
| GO:0032502 | Developmental process | 197 | 0.359 | 1.763 | 3.56E-04 | 6.55E-03 | 5.01E-03 | 147 | CYTL1 VCAN TNFRSF11 B FN1 COL1A2 SERPINE1 MGP GAS6 COL8A1 ELN COL3A1 EFEMP1 IGFBP2 SFRP1 COL1A1 SPARC CST6 TIMP1 MMP2 MYH10 CCND1 OMD HTRA1 PTN TNFRSF12 A CTSZ CRISPLD1 S100A10 LTBP4 IGFBP5 FSTL1 THY1 IGFBP3 TPM4 PDGFD DKK3 CDH13 CXCL12 ASPN PRELP CLU THBS2 ITGA11 CDH11 ITGA1 IGFBP7 ALCAM ITGB1 LOXL1 SULF1 MFAP5 SFRP4 MYL12 AGJA1 COL5A2 RGCC RCN3 ITGB5 LRRC17 ITM2B ANXA1 CRIM1 COL4A1 MXRA8 HAPLN1 HSPA5 ARHGDIB AQP1 COL4A2 SCG2 RRBP1 MYL12 B COL12A1 BGN THBS1 LRP1 TGFBR1 FHL1 FBN1 TIMP2 MYDGF CDH2 FAP MAP1B PPIB LOX PAM KRT17 FKBP10 ITGAV ANTXR1 SMOC2 |
| GO:0050793 | Regulation of developmental process | 88 | 0.373 | 1.729 | 4.17E-03 | 4.03E-02 | 3.08E-02 | 147 | TNFRSF11 B FN1 SERPINE1 MGP GAS6 EFEMP1 SFRP1 COL1A1 SPARC MYH10 CCND1 OMD PTN S100A10 LTBP4 IGFBP5 THY1 IGFBP3 CXCL12 ASPN THBS2 ITGB1 SULF1 SFRP4 MYL12 A GJA1 COL5A2 RGCC LRRC17 ANXA1 CRIM1 AQP1 COL4A2 MYL12 B THBS1 LRP1 TGFBR1 FBN1 TIMP2 MYDGF CDH2 MAP1B PPIB LOX KRT17 ITGAV SMOC2 |
| GO:0032501 | Multicellular organismal process | 204 | 0.345 | 1.699 | 1.65E-03 | 2.15E-02 | 1.64E-02 | 147 | CYTL1 VCAN TNFRSF11 B FN1 COL1A2 SERPINE1 MGP GAS6 COL8A1 ELN COL3A1 EFEMP1 IGFBP2 SFRP1 COL1A1 SPARC TIMP1 CD55 MMP2 CCND1 OMD HTRA1 LTBP1 PTN TNFRSF12 A CTSZ HMCN1 LTBP4 IGFBP5 FSTL1 THY1 TPM4 PDGFD DKK3 CDH13 CXCL12 ASPN PRELP CLU THBS2 ITGA11 CDH11 ITGA1 IGFBP7 ALCAM ITGB1 LOXL1 SULF1 MFAP5 SFRP4 MYL12 A GJA1 CYBA COL5A2 RGCC RCN3 ITGB5 LRRC17 ITM2B ANXA1 CRIM1 COL4A1 MXRA8 TMSB4X HAPLN1 HSPA5 ARHGDIB AQP1 COL4A2 SCG2 RRBP1 COL12A1 BGN THBS1 LRP1 TGFBR1 FHL1 FBN1 SSPN TIMP2 MYDGF CDH2 FAP MAP1B PPIB LOX PAM KRT17 S100A13 FKBP10 SPTBN1 ITGAV ANTXR1 SMOC2 |
| GO:0023052 | Signaling | 159 | 0.329 | 1.609 | 5.35E-03 | 4.71E-02 | 3.61E-02 | 114 | CYTL1 TNFRSF11 B FN1 COL1A2 SERPINE1 LTBP2 GAS6 COL3A1 EFEMP1 ITGBL1 IGFBP2 SFRP1 COL1A1 TIMP1 CD55 MMP2 CCND1 HTRA1 LTBP1 PTN OGN TNFRSF12 A LTBP4 IGFBP5 FSTL1 THY1 IGFBP3 PDGFD DKK3 CDH13 CXCL12 ASPN CLU ITGA11 CDH11 GEM ITGA1 IGFBP7 ALCAM ITGB1 SULF1 SFRP4 GJA1 CYBA RCN3 ITGB5 ANXA1 CRIM1 COL4A1 NUCB2 TMSB4X HSPA5 PDIA3 ARHGDIB AQP1 COL4A2 SCG2 RBMS3 |
| GO:0010467 | Gene expression | 148 | −0.214 | −2.010 | 4.94E-05 | 1.22E-03 | 9.35E-04 | 128 | ADIRF RPL39 RPS18 NPM1 RPL11 RPL15 NOP53 EEF1D DDT PLCG2 RPL37 RPS25 RPL13 A MXI1 RPL9 RPL36 RPL22 RPS15 A BTF3 RACK1 EEF1B2 RPS26 RPL30 RPS2 RPL32 RPL38 RPL37 A PPP1R12 A C1QTNF1 RPL7A RPS24 RPL36AL RPL27 A RPS6 FOXN3 RPL10 A RPS3 RPL18 A RPL6 RPS10 RPL19 CEBPD RPS16 RPS3A RPL21 RPL8 RPL24 RPL26 RPL29 RPL41 RPS27 A RPS27 RPL35 A RPS13 RPL34 RPS28 RPL23 A RPS21 ACTG2 RPS5 RPS7 RPS8 PTP4A3 RPL7 RPL18 RPL14 RPS14 ID4 RPL5 ID3 SCX ID1 CARMN RPS19 ACTC1 |
| GO:0003012 | Muscle system process | 22 | −0.404 | −2.133 | 2.45E-03 | 2.64E-02 | 2.02E-02 | 91 | MYH11 ADRA2C RYR2 GUCY1A1 SMTN SORBS2 CNN1 MYLK MYL9 PLN TCAP DES ACTC1 |
| GO:0006936 | Muscle contraction | 18 | −0.492 | −2.327 | 8.61E-04 | 1.26E-02 | 9.67E-03 | 91 | MYH11 ADRA2C RYR2 GUCY1A1 SMTN CNN1 MYLK MYL9 PLN TCAP DES ACTC1 |
| GO:0034641 | Cellular nitrogen compound metabolic process | 129 | −0.268 | −2.427 | 2.50E-07 | 1.04E-05 | 7.97E-06 | 128 | ADIRF RPL39 RPS18 NPM1 RPL11 RPL15 NOP53 EEF1D PLCG2 RPL37 RPS25 RPL13 A MXI1 RPL9 RPL36 RPL22 RPS15 A BTF3 RACK1 EEF1B2 RPS26 RPL30 RPS2 RPL32 RPL38 RPL37 A PPP1R12 A RPL7A RPS24 RPL36AL RPL27 A RPS6 FOXN3 GUCY1A1 RPL10 A RPS3 RPL18 A RPL6 RPS10 RPL19 CEBPD RPS16 RPS3A RPL21 RPL8 RPL24 RPL26 ATP5MC2 RPL29 RPL41 RPS27 A RPS27 RPL35 A RPS13 RPL34 RPS28 RPL23 A RPS21 RPS5 RPS7 RPS8 PTP4A3 RPL7 RPL18 RPL14 RPS14 ID4 RPL5 ID3 SCX ID1 RPS19 |
| GO:0009059 | Macromolecule biosynthetic process | 125 | −0.268 | −2.488 | 2.89E-07 | 1.09E-05 | 8.36E-06 | 128 | ADIRF RPL39 RPS18 NPM1 RPL11 RPL15 NOP53 EEF1D PLCG2 RPL37 RPS25 RPL13 A MXI1 RPL9 RPL36 RPL22 RPS15 A BTF3 RACK1 EEF1B2 RPS26 RPL30 RPS2 RPL32 RPL38 RPL37 A PPP1R12 A RPL7A RPS24 RPL36AL RPL27 A RPS6 FOXN3 RPL10 A RPS3 RPL18 A RPL6 RPS10 RPL19 CEBPD RPS16 RPS3A RPL21 RPL8 RPL24 RPL26 RPL29 RPL41 RPS27 A RPS27 RPL35 A RPS13 RPL34 RPS28 RPL23 A RPS21 RPS5 RPS7 RPS8 PTP4A3 RPL7 RPL18 RPL14 RPS14 ID4 RPL5 ID3 SCX ID1 RPS19 |
| GO:0034645 | Cellular macromolecule biosynthetic process | 125 | −0.268 | −2.488 | 2.89E-07 | 1.09E-05 | 8.36E-06 | 128 | ADIRF RPL39 RPS18 NPM1 RPL11 RPL15 NOP53 EEF1D PLCG2 RPL37 RPS25 RPL13 A MXI1 RPL9 RPL36 RPL22 RPS15 A BTF3 RACK1 EEF1B2 RPS26 RPL30 RPS2 RPL32 RPL38 RPL37 A PPP1R12 A RPL7A RPS24 RPL36AL RPL27 A RPS6 FOXN3 RPL10 A RPS3 RPL18 A RPL6 RPS10 RPL19 CEBPD RPS16 RPS3A RPL21 RPL8 RPL24 RPL26 RPL29 RPL41 RPS27 A RPS27 RPL35 A RPS13 RPL34 RPS28 RPL23 A RPS21 RPS5 RPS7 RPS8 PTP4A3 RPL7 RPL18 RPL14 RPS14 ID4 RPL5 ID3 SCX ID1 RPS19 |
| GO:0044271 | Cellular nitrogen compound biosynthetic process | 123 | −0.297 | −2.609 | 1.72E-08 | 9.74E-07 | 7.45E-07 | 128 | ADIRF RPL39 RPS18 NPM1 RPL11 RPL15 NOP53 EEF1D PLCG2 RPL37 RPS25 RPL13 A MXI1 RPL9 RPL36 RPL22 RPS15 A BTF3 RACK1 EEF1B2 RPS26 RPL30 RPS2 RPL32 RPL38 RPL37 A PPP1R12 A RPL7A RPS24 RPL36AL RPL27 A RPS6 FOXN3 GUCY1A1 RPL10 A RPS3 RPL18 A RPL6 RPS10 RPL19 CEBPD RPS16 RPS3A RPL21 RPL8 RPL24 RPL26 ATP5MC2 RPL29 RPL41 RPS27 A RPS27 RPL35 A RPS13 RPL34 RPS28 RPL23 A RPS21 RPS5 RPS7 RPS8 PTP4A3 RPL7 RPL18 RPL14 RPS14 ID4 RPL5 ID3 SCX ID1 RPS19 |
| GO:0044249 | Cellular biosynthetic process | 136 | −0.273 | −2.630 | 9.31E-08 | 4.09E-06 | 3.13E-06 | 128 | ADIRF RPL39 RPS18 NPM1 RPL11 RPL15 NOP53 EEF1D DDT PLCG2 RPL37 RPS25 RPL13 A MXI1 RPL9 RPL36 RPL22 RPS15 A BTF3 RACK1 EEF1B2 RPS26 RPL30 RPS2 RPL32 RPL38 TKT RPL37 A PPP1R12 A RPL7A RPS24 RPL36AL RPL27 A RPS6 FOXN3 GUCY1A1 RPL10 A RPS3 RPL18 A RPL6 RPS10 RPL19 CEBPD RPS16 RPS3A RPL21 RPL8 RPL24 RPL26 ATP5MC2 RPL29 RPL41 RPS27 A RPS27 RPL35 A RPS13 RPL34 RPS28 RPL23 A RPS21 RPS5 RPS7 RPS8 PTP4A3 RPL7 RPL18 FABP3 RPL14 RPS14 ID4 RPL5 ID3 SCXID1 RPS19 |
| GO:0009058 | Biosynthetic process | 140 | −0.268 | −2.642 | 5.23E-08 | 2.43E-06 | 1.86E-06 | 128 | ADIRF RPL39 RPS18 NPM1 RPL11 RPL15 NOP53 EEF1D DDT PLCG2 RPL37 RPS25 RPL13 A MXI1 RPL9 RPL36 RPL22 RPS15 A BTF3 RACK1 EEF1B2 RPS26 RPL30 RPS2 RPL32 RPL38 TKT RPL37 A PPP1R12 A RPL7A RPS24 RPL36AL RPL27 A RPS6 FOXN3 GUCY1A1 RPL10 A RPS3 RPL18 A RPL6 RPS10 RPL19 CEBPD RPS16 RPS3A RPL21 RPL8 RPL24 RPL26 ATP5MC2 RPL29 RPL41 RPS27 A RPS27 RPL35 A RPS13 RPL34 RPS28 RPL23 A RPS21 RPS5 RPS7 RPS8 PTP4A3 RPL7 RPL18 FABP3 RPL14 RPS14 ID4 RPL5 ID3 SCX ID1 CKB RPS19 |
| GO:1901576 | Organic substance biosynthetic process | 137 | −0.281 | −2.740 | 2.72E-08 | 1.43E-06 | 1.10E-06 | 128 | ADIRF RPL39 RPS18 NPM1 RPL11 RPL15 NOP53 EEF1D DDT PLCG2 RPL37 RPS25 RPL13 A MXI1 RPL9 RPL36 RPL22 RPS15 A BTF3 RACK1 EEF1B2 RPS26 RPL30 RPS2 RPL32 RPL38 TKT RPL37 A PPP1R12 A RPL7A RPS24 RPL36AL RPL27 A RPS6 FOXN3 GUCY1A1 RPL10 A RPS3 RPL18 A RPL6 RPS10 RPL19 CEBPD RPS16 RPS3A RPL21 RPL8 RPL24 RPL26 ATP5MC2 RPL29 RPL41 RPS27 A RPS27 RPL35 A RPS13 RPL34 RPS28 RPL23 A RPS21 RPS5 RPS7 RPS8 PTP4A3 RPL7 RPL18 FABP3 RPL14 RPS14 ID4 RPL5 ID3 SCX ID1 CKB RPS19 |
| GO:0042255 | Ribosome assembly | 13 | −0.712 | −2.980 | 6.07E-06 | 1.66E-04 | 1.27E-04 | 124 | RPL11 NOP53 RPL38 RPL6 RPL24 RPS27 RPS28 RPL23 A RPS5 RPS14 RPL5 RPS19 |
| GO:0022618 | Ribonucleoprotein complex assembly | 14 | −0.696 | −3.006 | 5.07E-06 | 1.44E-04 | 1.10E-04 | 131 | RPL11 NOP53 RPL13 A RPL38 RPL6 RPL24 RPS27 RPS28 RPL23 A RPS5 RPS14 RPL5 RPS19 |
| GO:0071826 | Ribonucleoprotein complex subunit organization | 14 | −0.696 | −3.006 | 5.07E-06 | 1.44E-04 | 1.10E-04 | 131 | RPL11 NOP53 RPL13 A RPL38 RPL6 RPL24 RPS27 RPS28 RPL23 A RPS5 RPS14 RPL5 RPS19 |
| GO:0042273 | Ribosomal large subunit biogenesis | 14 | −0.714 | −3.085 | 2.24E-06 | 6.82E-05 | 5.22E-05 | 124 | RPL11 NOP53 RPL38 RPL7A RPL10 A RPL6 RPL24 RPL26 RPL35 A RPL23 A RPL7 RPL14 RPL5 |
| GO:0042274 | Ribosomal small subunit biogenesis | 14 | −0.714 | −3.085 | 2.24E-06 | 6.82E-05 | 5.22E-05 | 124 | RPS25 RPL38 RPS24 RPS6 RPS16 RPS27 RPS28 RPS21 RPS5 RPS7 RPS8 RPS14 RPS19 |
| GO:0140694 | Nonmembrane-bounded organelle assembly | 20 | −0.625 | −3.126 | 8.70E-07 | 2.99E-05 | 2.29E-05 | 124 | NPM1 RPL11 NOP53 MYH11 RPL38 RPS3 RPL6 RPL24 RPS27 RPS28 RPL23 A RPS5 RPS14 RPL5 TCAP CSRP2 RPS19 ACTC1 |
| GO:0070925 | Organelle assembly | 22 | −0.601 | −3.170 | 4.57E-07 | 1.65E-05 | 1.26E-05 | 124 | NPM1 RPL11 NOP53 MYH11 RPL38 RPS3 SYNPO2 RPL6 RPL24 RPS27 RPS28 RPL23 A RPS5 RPS14 RPL5 TCAP CSRP2 RPS19 ACTC1 |
| GO:0006396 | RNA processing | 26 | −0.623 | −3.508 | 3.09E-08 | 1.53E-06 | 1.17E-06 | 124 | NPM1 RPL11 NOP53 RPS25 RPS26 RPL7A RPS24 RPS6 RPL10 A RPS16 RPL26 RPS27 RPL35 A RPS13 RPS28 RPS21 RPS7 RPS8 RPL7 RPL14 RPS14 RPL5 RPS19 |
| GO:0034470 | ncRNA processing | 21 | −0.673 | −3.512 | 7.25E-09 | 4.42E-07 | 3.38E-07 | 123 | RPL11 NOP53 RPS25 RPL7A RPS24 RPS6 RPL10 A RPS16 RPL26 RPS27 RPL35 A RPS28 RPS21 RPS7 RPS8 RPL7 RPL14 RPS14 RPL5 RPS19 |
| GO:0034660 | ncRNA metabolic process | 21 | −0.673 | −3.512 | 7.25E-09 | 4.42E-07 | 3.38E-07 | 123 | RPL11 NOP53 RPS25 RPL7A RPS24 RPS6 RPL10 A RPS16 RPL26 RPS27 RPL35 A RPS28 RPS21 RPS7 RPS8 RPL7 RPL14 RPS14 RPL5 RPS19 |
| GO:0006364 | rRNA processing | 20 | −0.728 | −3.642 | 7.88E-10 | 5.67E-08 | 4.34E-08 | 123 | NOP53 RPS25 RPL7A RPS24 RPS6 RPL10 A RPS16 RPL26 RPS27 RPL35 A RPS28 RPS21 RPS7 RPS8 RPL7 RPL14 RPS14 RPL5 RPS19 |
| GO:0016072 | rRNA metabolic process | 20 | −0.728 | −3.642 | 7.88E-10 | 5.67E-08 | 4.34E-08 | 123 | NOP53 RPS25 RPL7A RPS24 RPS6 RPL10 A RPS16 RPL26 RPS27 RPL35 A RPS28 RPS21 RPS7 RPS8 RPL7 RPL14 RPS14 RPL5 RPS19 |
| GO:1901566 | Organonitrogen compound biosynthetic process | 83 | −0.478 | −3.784 | 1.00E-10 | 8.80E-09 | 6.74E-09 | 136 | RPS12 RPLP1 EIF3E RPL39 RPS18 NPM1 RPL11 RPL15 EEF1D RPL37 RPS25 RPL13 A RPL9 RPL36 RPL22 RPS15 A RACK1 EEF1B2 RPS26 RPL30 RPS2 RPL32 RPL38 RPL37 A RPL7A RPS24 RPL36AL RPL27 A RPS6 GUCY1A1 RPL10 A RPS3 RPL18 A RPL6 RPS10 RPL19 RPS16 RPS3A RPL21 RPL8 RPL24 RPL26 ATP5MC2 RPL29 RPL41 RPS27 A RPS27 RPL35 A RPS13 RPL34 RPS28 RPL23 A RPS21 RPS5 RPS7 RPS8 RPL7 RPL18 FABP3 RPL14 RPS14 RPL5 CKB RPS19 |
| GO:0022613 | Ribonucleoprotein complex biogenesis | 28 | −0.722 | −4.101 | 1.00E-10 | 8.80E-09 | 6.74E-09 | 131 | NPM1 RPL11 NOP53 RPS25 RPL13 A RPL38 RPL7A RPS24 RPS6 RPL10 A RPL6 RPS16 RPL24 RPL26 RPS27 RPL35 A RPS28 RPL23 A RPS21 RPS5 RPS7 RPS8 RPL7 RPL14 RPS14 RPL5 RPS19 |
| GO:0042254 | Ribosome biogenesis | 26 | −0.737 | −4.150 | 1.00E-10 | 8.80E-09 | 6.74E-09 | 124 | RPL11 NOP53 RPS25 RPL38 RPL7A RPS24 RPS6 RPL10 A RPL6 RPS16 RPL24 RPL26 RPS27 RPL35 A RPS28 RPL23 A RPS21 RPS5 RPS7 RPS8 RPL7 RPL14 RPS14 RPL5 RPS19 |
| GO:0043603 | Cellular amide metabolic process | 70 | −0.581 | −4.437 | 1.00E-10 | 8.80E-09 | 6.74E-09 | 136 | RPS12 RPLP1 EIF3E RPL39 RPS18 NPM1 RPL11 RPL15 EEF1D RPL37 RPS25 RPL13 A RPL9 RPL36 RPL22 RPS15 A RACK1 EEF1B2 RPS26 RPL30 RPS2 RPL32 RPL38 RPL37 A RPL7A RPS24 RPL36AL RPL27 A RPS6 RPL10 A RPS3 RPL18 A RPL6 RPS10 RPL19 RPS16 RPS3A RPL21 RPL8 RPL24 RPL26 RPL29 RPL41 RPS27 A RPS27 RPL35 A RPS13 RPL34 RPS28 RPL23 A RPS21 RPS5 RPS7 RPS8 RPL7 RPL18 RPL14 RPS14 RPL5RPS19 |
| GO:0006518 | Peptide metabolic process | 69 | −0.591 | −4.590 | 1.00E-10 | 8.80E-09 | 6.74E-09 | 136 | RPS12 RPLP1 EIF3E RPL39 RPS18 NPM1 RPL11 RPL15 EEF1D RPL37 RPS25 RPL13 A RPL9 RPL36 RPL22 RPS15 A RACK1 EEF1B2 RPS26 RPL30 RPS2 RPL32 RPL38 RPL37 A RPL7A RPS24 RPL36AL RPL27 A RPS6 RPL10 A RPS3 RPL18 A RPL6 RPS10 RPL19 RPS16 RPS3A RPL21 RPL8 RPL24 RPL26 RPL29 RPL41 RPS27 A RPS27 RPL35 A RPS13 RPL34 RPS28 RPL23 A RPS21 RPS5 RPS7 RPS8 RPL7 RPL18 RPL14 RPS14 RPL5RPS19 |
| GO:0043604 | Amide biosynthetic process | 66 | −0.659 | −4.917 | 1.00E-10 | 8.80E-09 | 6.74E-09 | 136 | RPS12 RPLP1 EIF3E RPL39 RPS18 NPM1 RPL11 RPL15 EEF1D RPL37 RPS25 RPL13 A RPL9 RPL36 RPL22 RPS15 A RACK1 EEF1B2 RPS26 RPL30 RPS2 RPL32 RPL38 RPL37 A RPL7A RPS24 RPL36AL RPL27 A RPS6 RPL10 A RPS3 RPL18 A RPL6 RPS10 RPL19 RPS16 RPS3A RPL21 RPL8 RPL24 RPL26 RPL29 RPL41 RPS27 A RPS27 RPL35 A RPS13 RPL34 RPS28 RPL23 A RPS21 RPS5 RPS7 RPS8 RPL7 RPL18 RPL14 RPS14 RPL5 RPS19 |
| GO:0006412 | Translation | 65 | −0.675 | −5.004 | 1.00E-10 | 8.80E-09 | 6.74E-09 | 136 | RPS12 RPLP1 EIF3E RPL39 RPS18 NPM1 RPL11 RPL15 EEF1D RPL37 RPS25 RPL13 A RPL9 RPL36 RPL22 RPS15 A RACK1 EEF1B2 RPS26 RPL30 RPS2 RPL32 RPL38 RPL37 A RPL7A RPS24 RPL36AL RPL27 A RPS6 RPL10 A RPS3 RPL18 A RPL6 RPS10 RPL19 RPS16 RPS3A RPL21 RPL8 RPL24 RPL26 RPL29 RPL41 RPS27 A RPS27 RPL35 A RPS13 RPL34 RPS28 RPL23 A RPS21 RPS5 RPS7 RPS8 RPL7 RPL18 RPL14 RPS14 RPL5 RPS19 |
| GO:0043043 | Peptide biosynthetic process | 65 | −0.675 | −5.004 | 1.00E-10 | 8.80E-09 | 6.74E-09 | 136 | RPS12 RPLP1 EIF3E RPL39 RPS18 NPM1 RPL11 RPL15 EEF1D RPL37 RPS25 RPL13 A RPL9 RPL36 RPL22 RPS15 A RACK1 EEF1B2 RPS26 RPL30 RPS2 RPL32 RPL38 RPL37 A RPL7A RPS24 RPL36AL RPL27 A RPS6 RPL10 A RPS3 RPL18 A RPL6 RPS10 RPL19 RPS16 RPS3A RPL21 RPL8 RPL24 RPL26 RPL29 RPL41 RPS27 A RPS27 RPL35 A RPS13 RPL34 RPS28 RPL23 A RPS21 RPS5 RPS7 RPS8 RPL7 RPL18 RPL14 RPS14 RPL5 RPS19 |
| GO:0002181 | Cytoplasmic translation | 55 | −0.650 | −3.673 | 1.00E-10 | 8.80E-09 | 6.74E-09 | 136 | RPLP1 EIF3E RPL39 RPS18 RPL11 RPL15 RPL37 RPS25 RPL13 A RPL9 RPL36 RPL22 RPS15 A RPS26 RPL30 RPS2 RPL32 RPL38 RPL37 A RPL7A RPS24 RPL27 A RPS6 RPL10 A RPS3 RPL18 A RPL6 RPS10 RPL19 RPS16 RPS3A RPL21 RPL8 RPL24 RPL26 RPL29 RPL41 RPS27 A RPS27 RPL35 A RPS13 RPL34 RPS28 RPL23 A RPS21 RPS5 RPS7 RPS8 RPL7 RPL18 RPL14 RPS14 RPL5 RPS19 |
Footnotes
Conflict of Interest Statement
The authors reported no conflicts of interest.
The Journal policy requires editors and reviewers to disclose conflicts of interest and to decline handling or reviewing manuscripts for which they may have a conflict of interest. The editors and reviewers of this article have no conflicts of interest.
CENTRAL MESSAGE
Prophylactic aortic arch replacement at the time of aortic root replacement is safe and supported by abnormal aortic cellular phenotype in the normal diameter aortic arch.
References
- 1.MacCarrick G, Black JH, Bowdin S, El-Hamamsy I, Frischmeyer-Guerrerio PA, Guerrerio AL, et al. Loeys-Dietz syndrome: a primer for diagnosis and management. Genet Med. 2014;16:576–87. 10.1038/gim.2014.11 [DOI] [PMC free article] [PubMed] [Google Scholar]
- 2.Jondeau G, Ropers J, Regalado E, Braverman A, Evangelista A, Teixedo G, et al. International registry of patients carrying TGFBR1 or TGFBR2 mutations: results of the MAC (Montalcino Aortic Consortium). Circ Cardiovasc Genet. 2016;9:548–58. 10.1161/CIRCGENETICS.116.001485 [DOI] [PMC free article] [PubMed] [Google Scholar]
- 3.Hostetler EM, Regalado ES, Guo DC, Hanna N, Arnaud P, Muiño-Mosquera L, et al. SMAD3 pathogenic variants: risk for thoracic aortic disease and associated complications from the Montalcino Aortic Consortium. J Med Genet. 2019;56: 252–60. 10.1136/jmedgenet-2018-105583 [DOI] [PubMed] [Google Scholar]
- 4.Milewicz DM, Guo D, Hostetler E, Marin I, Pinard AC, Cecchi AC. Update on the genetic risk for thoracic aortic aneurysms and acute aortic dissections: implications for clinical care. J Cardiovasc Surg. 2021;62:203–10. 10.23736/S0021-9509.21.11816-6 [DOI] [PMC free article] [PubMed] [Google Scholar]
- 5.Schepers D, Tortora G, Morisaki H, MacCarrick G, Lindsay M, Liang D, et al. A mutation update on the LDS- associated genes TGFB2/3 and SMAD2/3. Hum Mutat. 2018;39:621–34. 10.1002/humu.23407 [DOI] [PMC free article] [PubMed] [Google Scholar]
- 6.Lindsay ME, Schepers D, Bolar NA, Doyle JJ, Gallo E, Fert-Bober J, et al. Loss-of-function mutations in TGFB2 cause a syndromic presentation of thoracic aortic aneurysm. Nat Genet. 2012;44:922–7. 10.1038/ng.2349 [DOI] [PMC free article] [PubMed] [Google Scholar]
- 7.Isselbacher EM, Preventza O, Hamilton Black J III, Augoustides JG, Beck AW, Bolen MA, et al. 2022 ACC/AHA Guideline for the Diagnosis and Management of Aortic Disease: a report of the American Heart Association/American College of Cardiology Joint Committee on Clinical Practice Guidelines. Circulation. 2022;146:e334–482. 10.1161/CIR.0000000000001106 [DOI] [PMC free article] [PubMed] [Google Scholar]
- 8.Schoenhoff FS, Alejo DE, Black JH, Crawford TC, Dietz HC, Grimm JC, et al. Management of the aortic arch in patients with Loeys-Dietz syndrome. J Thorac Cardiovasc Surg. 2020;160:1166–75. 10.1016/j.jtcvs.2019.07.130 [DOI] [PubMed] [Google Scholar]
- 9.Seike Y, Matsuda H, Inoue Y, Sasaki H, Morisaki H, Morisaki T, et al. The differences in surgical long-term outcomes between Marfan syndrome and Loeys-Dietz syndrome. J Thorac Cardiovasc Surg. 2022;164:16–25.e2. 10.1016/j.jtcvs.2020.07.089 [DOI] [PubMed] [Google Scholar]
- 10.Palumbo MC, Redaelli A, Wingo M, Tak KA, Leonard JR, Kim J, et al. Impact of ascending aortic prosthetic grafts on early postoperative descending aortic biomechanics on cardiac magnetic resonance imaging. Eur J Cardiothorac Surg. 2022;61:860–8. 10.1093/ejcts/ezab501 [DOI] [PMC free article] [PubMed] [Google Scholar]
- 11.Pedroza AJ, Tashima Y, Shad R, Cheng P, Wirka R, Churovich S, et al. Single-cell transcriptomic profiling of vascular smooth muscle cell phenotype modulation in Marfan syndrome aortic aneurysm. Arterioscler Thromb Vasc Biol. 2020;40: 2195–211. 10.1161/ATVBAHA.120.314670 [DOI] [PMC free article] [PubMed] [Google Scholar]
- 12.Demers P, Miller DC. Simple modification of “T. David-V” valve-sparing aortic root replacement to create graft pseudosinuses. Ann Thorac Surg. 2004;78: 1479–81. 10.1016/j.athoracsur.2003.08.032 [DOI] [PubMed] [Google Scholar]
- 13.Miller DC. Rationale and results of the Stanford modification of the David V reimplantation technique for valve-sparing aortic root replacement. J Thorac Cardiovasc Surg. 2015;149:112–4. 10.1016/j.jtcvs.2014.08.077 [DOI] [PubMed] [Google Scholar]
- 14.Markl M, Frydrychowicz A, Kozerke S, Hope M, Wieben O. 4D flow MRI. J Magn Reson Imaging. 2012;36:1015–36. 10.1002/jmri.23632 [DOI] [PubMed] [Google Scholar]
- 15.Contijoch FJ, Horowitz M, Masutani E, Kligerman S, Hsiao A. 4D flow vorticity visualization predicts regions of quantitative flow inconsistency for optimal blood flow measurement. Radiol Cardiothorac Imaging. 2020;2:e190054. 10.1148/ryct.2020190054 [DOI] [PMC free article] [PubMed] [Google Scholar]
- 16.Takahashi K, Sekine T, Ando T, Ishii Y, Kumita S. Utility of 4D flow MRI in thoracic aortic diseases: a literature review of clinical applications and current evidence. Magn Reson Med Sci. 2022;21:327–39. 10.2463/mrms.rev.2021-0046 [DOI] [PMC free article] [PubMed] [Google Scholar]
- 17.Cheng Z, Tan FPP, Riga CV, Bicknell CD, Hamady MS, Gibbs RG, et al. Analysis of flow patterns in a patient-specific aortic dissection model. J Biomech Eng. 2010;132:051007. 10.1115/1.4000964 [DOI] [PubMed] [Google Scholar]
- 18.Numata S, Itatani K, Kanda K, Doi K, Yamazaki S, Morimoto K, et al. Blood flow analysis of the aortic arch using computational fluid dynamics. Eur J Cardiothorac Surg. 2016;49:1578–85. 10.1093/ejcts/ezv459 [DOI] [PubMed] [Google Scholar]
- 19.Nannini G, Caimi A, Palumbo MC, Saitta S, Girardi LN, Gaudino M, et al. Aortic hemodynamics assessment prior and after valve sparing reconstruction: a patient-specific 4D flow-based FSI model. Comput Biol Med. 2021;135:104581. 10.1016/j.compbiomed.2021.104581 [DOI] [PubMed] [Google Scholar]
- 20.Gaudino M, Piatti F, Lau C, Sturla F, Weinsaft JW, Weltert L, et al. Aortic flow after valve sparing root replacement with or without neosinuses reconstruction. J Thorac Cardiovasc Surg. 2019;157:455–65. 10.1016/j.jtcvs.2018.06.094 [DOI] [PubMed] [Google Scholar]
- 21.Rong LQ, Palumbo MC, Rahouma M, Meineri M, Arguelles GR, Kim J, et al. Immediate impact of prosthetic graft replacement of the ascending aorta on circumferential strain in the descending aorta. Eur J Vasc Endovasc Surg. 2019;58:521–8. 10.1016/j.ejvs.2019.05.003 [DOI] [PubMed] [Google Scholar]
- 22.Bramel EE, Creamer TJ, Saqib M, Camejo Nunez WA, Bagirzadeh R, Roker LA, et al. Postnatal Smad3 inactivation in murine smooth muscle cells elicits a temporally and regionally distinct transcriptional response. Front Cardiovasc Med. 2022;9:826495. 10.3389/fcvm.2022.826495 [DOI] [PMC free article] [PubMed] [Google Scholar]
- 23.Zhou D, Feng H, Yang Y, Huang T, Qiu P, Zhang C, et al. hiPSC modeling of lineage-specific smooth muscle cell defects caused by TGFBR1A230T variant, and its therapeutic implications for Loeys-Dietz syndrome. Circulation. 2021; 144:1145–59. 10.1161/CIRCULATIONAHA.121.054744 [DOI] [PMC free article] [PubMed] [Google Scholar]
- 24.Gomez D, Owens GK. Smooth muscle cell phenotypic switching in atherosclerosis. Cardiovasc Res. 2012;95:156–64. 10.1093/cvr/cvs115 [DOI] [PMC free article] [PubMed] [Google Scholar]
- 25.Wirka RC, Wagh D, Paik DT, Pjanic M, Nguyen T, Miller CL, et al. Atheroprotective roles of smooth muscle cell phenotypic modulation and the TCF21 disease gene as revealed by single-cell analysis. Nat Med. 2019;25:1280–9. 10.1038/s41591-019-0512-5 [DOI] [PMC free article] [PubMed] [Google Scholar]
- 26.Dobnikar L, Taylor AL, Chappell J, Oldach P, Harman JL, Oerton E, et al. Disease-relevant transcriptional signatures identified in individual smooth muscle cells from healthy mouse vessels. Nat Commun. 2018;9:4567. 10.1038/s41467-018-06891-x [DOI] [PMC free article] [PubMed] [Google Scholar]
- 27.Alencar GF, Owsiany KM, Karnewar S, Sukhavasi K, Mocci G, Nguyen AT, et al. Stem cell pluripotency genes Klf4 and Oct4 regulate complex SMC phenotypic changes critical in late-stage atherosclerotic lesion pathogenesis. Circulation. 2020;142:2045–59. 10.1161/CIRCULATIONAHA.120.046672 [DOI] [PMC free article] [PubMed] [Google Scholar]
- 28.Pedroza AJ, Shad R, Dalal AR, Yokoyama N, Nakamura K, Hiesinger W, et al. Acute induced pressure overload rapidly incite thoracic aortic aneurysmal smooth muscle cell phenotype. Hypertension. 1979;79:e86–9. 10.1161/HYPERTENSIONAHA.121.18640 [DOI] [PMC free article] [PubMed] [Google Scholar]
- 29.He C, Medley SC, Hu T, Hinsdale ME, Lupu F, Virmani R, et al. PDGFRβ signalling regulates local inflammation and synergizes with hypercholesterolaemia to promote atherosclerosis. Nat Commun. 2015;6:7770. 10.1038/ncomms8770 [DOI] [PMC free article] [PubMed] [Google Scholar]
- 30.Newman AAC, Serbulea V, Baylis RA, Shankman LS, Bradley X, Alencar GF, et al. Multiple cell types contribute to the atherosclerotic lesion fibrous cap by PDGFRb and bioenergetic mechanisms. Nat Metab. 2021;3:166–81. 10.1038/s42255-020-00338-8 [DOI] [PMC free article] [PubMed] [Google Scholar]
- 31.Chen J, Su Y, Pi S, Hu B, Mao L. The dual role of low-density lipoprotein Receptor662 related protein 1 in atherosclerosis. Front Cardiovasc Med. 2021; 8:682389. 10.3389/fcvm.2021.682389 [DOI] [PMC free article] [PubMed] [Google Scholar]
- 32.Davis FM, Rateri DL, Balakrishnan A, Howatt DA, Strickland DK, Muratoglu SC, et al. Smooth muscle cell deletion of low-density lipoprotein receptor-related protein 1 augments angiotensin II-induced superior mesenteric arterial and ascending aortic aneurysms. Arterioscler Thromb Vasc Biol. 2015; 35:155–62. 10.1161/ATVBAHA.114.30468333 [DOI] [PMC free article] [PubMed] [Google Scholar]
- 33.Sawada H, Katsumata Y, Higashi H, Zhang C, Li Y, Morgan S, et al. Second heart field–derived cells contribute to angiotensin II–mediated ascending aortopathies. Circulation. 2022;145:987–1001. 10.1161/CIRCULATIONAHA.121.058173 [DOI] [PMC free article] [PubMed] [Google Scholar]
- 34.Trapnell C, Cacchiarelli D, Grimsby J, Pokharel P, Li S, Morse M, et al. The dynamics and regulators of cell fate decisions are revealed by pseudotemporal ordering of single cells. Nat Biotechnol. 2014;32:381–6. 10.1038/nbt.2859 [DOI] [PMC free article] [PubMed] [Google Scholar]
- 35.Thijssen CGE, Dekker S, Bons LR, Geenen LW, Gökalp AL, Takkenberg JJM, et al. Novel biomarkers associated with thoracic aortic disease. Int J Cardiol. 2023;378:115–22. 10.1016/j.ijcard.2023.02.006 [DOI] [PubMed] [Google Scholar]
- 36.Wu T, Hu E, Xu S, Chen M, Guo P, Dai Z, et al. clusterProfiler 4.0: a universal enrichment tool for interpreting omics data. Innov Camb Mass. 2021; 2:100141. 10.1016/j.xinn.2021.100141 [DOI] [PMC free article] [PubMed] [Google Scholar]
- 37.Harris SL, Lindsay ME. Role of clinical genetic testing in the management of aortopathies. Curr Cardiol Rep. 2021;23:10. 10.1007/s11886-020-01435-6 [DOI] [PubMed] [Google Scholar]
- 38.Weininger G, Zafar M, Ziganshin BA, Mori M, Papanikolaou D, Sekar RB, et al. Long-term risk of arch complications in Loeys Dietz syndrome patients undergoing proximal ascending aortic replacement. J Card Surg. 2022;37:3688–92. 10.1111/jocs.16855 [DOI] [PubMed] [Google Scholar]
- 39.Li Y, Ren P, Dawson A, Vasquez HG, Ageedi W, Zhang C, et al. Single-cell transcriptome analysis reveals dynamic cell populations and differential gene expression patterns in control and aneurysmal human aortic tissue. Circulation. 2020;142:1374–88. 10.1161/CIRCULATIONAHA.120.046528 [DOI] [PMC free article] [PubMed] [Google Scholar]
- 40.Creamer TJ, Bramel EE, MacFarlane EG. Insights on the pathogenesis of aneurysm through the study of hereditary aortopathies. Genes. 2021;12:183. 10.3390/genes12020183 [DOI] [PMC free article] [PubMed] [Google Scholar]
- 41.Chen PY, Qin L, Li G, Malagon-Lopez J, Wang Z, Bergaya S, et al. Smooth muscle cell reprogramming in aortic aneurysms. Cell Stem Cell. 2020;26:542–57.e11. 10.1016/j.stem.2020.02.013 [DOI] [PMC free article] [PubMed] [Google Scholar]
- 42.Crosas-Molist E, Meirelles T, Lopez-Luque J, Serra-Peinado C, Selva J, Caja L, et al. Vascular smooth muscle cell phenotypic changes in patients with Marfan syndrome. Arterioscler Thromb Vasc Biol. 2015;35:960–72. 10.1161/ATVBAHA.114.304412 [DOI] [PubMed] [Google Scholar]
- 43.Milewicz Dianna M, Trybus Kathleen M, Guo D-C, Sweeney HL, Regalado E, Kamm K, et al. Altered smooth muscle cell force generation as a driver of thoracic aortic aneurysms and dissections. Arterioscler Thromb Vasc Biol. 2017;37:26–34. 10.1161/ATVBAHA.116.303229 [DOI] [PMC free article] [PubMed] [Google Scholar]
- 44.Milewicz DM, Guo DC, Tran-Fadulu V, Lafont AL, Papke CL, Inamoto S, et al. Genetic basis of thoracic aortic aneurysms and dissections: focus on smooth muscle cell contractile dysfunction. Annu Rev Genomics Hum Genet. 2008;9: 283–302. 10.1146/annurev.genom.8.080706.092303 [DOI] [PubMed] [Google Scholar]
- 45.Pedroza AJ, Koyano T, Trojan J, Rubin A, Palmon I, Jaatinen K, et al. Divergent effects of canonical and non-canonical TGF-β signalling on mixed contractilesynthetic smooth muscle cell phenotype in human Marfan syndrome aortic root aneurysms. J Cell Mol Med. 2020;24:2369–83. 10.1111/jcmm.14921 [DOI] [PMC free article] [PubMed] [Google Scholar]
- 46.MacFarlane EG, Parker SJ, Shin JY, Kang BE, Ziegler SG, Creamer TJ, et al. Lineage-specific events underlie aortic root aneurysm pathogenesis in Loeys-Dietz syndrome. J Clin Invest. 2019;129:659–75. 10.1172/JCI123547 [DOI] [PMC free article] [PubMed] [Google Scholar]
- 47.Kim JB, Zhao Q, Nguyen T, Pjanic M, Cheng P, Wirka R, et al. The environment-sensing aryl-hydrocarbon receptor inhibits the chondrogenic fate of modulated smooth muscle cells in atherosclerotic lesions. Circulation. 2020;142:575–90. 10.1161/CIRCULATIONAHA.120.045981 [DOI] [PMC free article] [PubMed] [Google Scholar]
Associated Data
This section collects any data citations, data availability statements, or supplementary materials included in this article.
Data Availability Statement
All scRNAseq data (raw and processed) will be deposited into the Gene Expression Omnibus for public access.