

Abstract
In response to the difficulty in predicting the change of bolt preload when using torque method to load bolt, this paper proposes a bolt preload prediction method based on mechanism and data fusion calculation for hexagonal end face bolt, and establishes a tightening prediction model based on machine learning method. Firstly, a tightening mechanism model is established, revealing the reasons why bolt preload is difficult to predict and errors cannot be eliminated. Secondly, sensitivity evaluation indicator is established to conduct parameter sensitivity analysis, and the fusion method of “mechanism model guiding data model to perform feature selection” is determined. Finally, the tightening prediction model based on Gaussian Process Regression is proposed, and corresponding engineering prediction software is established. The experimental results show that this prediction model can not only predict the variation of bolt preload with tightening torque, but also synchronously display the confidence interval of bolt preload fluctuation in a probabilistic sense. Under different operating conditions, the prediction accuracy still remains above 98.18%. The prediction model breaks through the limitation of traditional method, which calculates the torque coefficient and indirectly loads the bolt preload.
Keywords: Bolted connection, Mechanism model, Mechanism and data fusion, Gaussian process regression, Prediction model
Subject terms: Mechanical engineering, Statistics, Computer science
Introduction
The assembly process is a critical step in the manufacturing process, and bolted connection has become one of the most widely used and typical connection methods in engineering structures. The bolt preload value of bolted connection during assembly directly affects the safety and reliability of equipment1,2. The torque method is currently the most widely used bolt tightening process due to its advantages of low control cost and wide applicability3,4. When assembling the bolt, the tightening torque and bolt preload theoretically have a linear relationship. However, this linear relationship may undergo uncertainty changes due to the uncertainty factors of assembly conditions5. Many scholars have studied the relationship between tightening torque and bolt preload. Liu et al.6 theoretically calculated the torque coefficient based on the equivalent model of bolt force, but failed to consider the effects of bolt parameters and different lubrication conditions on the torque coefficient. Wang et al.7 studied the variation of torque coefficient using an equivalent coordinate system. However, they did not take into account the large single error and strong randomness of the torque coefficient during bolt tightening, and did not provide an explanation for this phenomenon. Li et al.8,9 studied the assembly process of aero-engine bolt and analyzed the effects of different tightening strategies on the bolt preload and its consistency. But they can only draw qualitative conclusions and fail to explain the reasons for the changes in torque coefficient through mechanistic model. Zhang et al.10 studied the effects of lubrication conditions and tightening speed on torque coefficient and proposed a method for calculating the standard deviation of torque coefficient. However, this method has a strong dependence on a large amount of prior raw data. Therefore, the study of the variation law of tightening curve is of great significance for solving practical assembly problems, ensuring bolted connection quality, and promoting innovative development of manufacturing industry. How to accurately predict the changes in bolt preload has always been an important research topic in the field of assembly.
At the mechanism level, a corresponding tightening mechanism model can be established through mechanical theoretical analysis of bolt tightening. However, the quantitative calculation method is not accurate enough for predicting the bolt preload in actual assembly affected by multiple factors. At the data level, due to the influence of structural errors and assembly common errors of bolt, the actual tightening data has problems with poor data transferability and insufficient interpretability. These problems result in some errors when applying original tightening conclusions to bolt assembly under other similar conditions11,12. With the development of artificial intelligence and Industry 4.0 technology, the idea of transforming traditional manufacturing processes into interconnected data-driven systems has gradually been widely applied13,14. Therefore, it is considered to use mechanism and data fusion calculation to predict the entire process of the change in bolt preload. The prediction results of this method have the advantages of interpretability and quantitative data of mechanism model, as well as the advantages of high accuracy and qualitative data of data model15,16. Reichstein et al.17 proposed using machine learning mechanism model to guide data model for feature selection in image recognition. Qin et al.18 used kernel partial least squares method combined with data model to correct the bias of the mechanism model. Sadowski et al.19 proposed establishing an expert network through a data model to predict unknown variables in the mechanism model. Therefore, it is particularly important to analyze the determinacy and randomness of the bolt tightening process and select appropriate a mechanism and data fusion method for the accuracy of the prediction model.
Therefore, this article starts with the tightening mechanism model, and establishes the bolt tightening prediction model based on mechanism and data fusion, taking the hexagonal end face bolt as the research object. Firstly, a bolt tightening mechanism model was established, and the advantages and disadvantages of the mechanism model and data model were compared and explained. Secondly, the sources of deterministic and stochastic factors during the tightening process were analyzed, and key features were selected through sensitivity analysis. Finally, a predictive model for the “mechanism model guiding data model” was established through Gaussian process regression, and the feasibility and applicability of the predictive model were demonstrated through experiments. This prediction model can not only predict the fluctuation and probability distribution of the bolt preload with the tightening torque under different working conditions, but also provide reference for connection quality evaluation and assembly process exploration. It is of great significance to improve the accuracy of bolt preload and determine the error value.
Mechanism model
Tightening process of any structure bolt
Tightening bolt is achieved by applying tightening torque to rotate the bolt head relative to the nut, compressing the connected parts through the influence of thread pitch angle. Then, the fastening end faces at both ends of the connected parts are clamped and tightly fitted, and the bolt itself is stretched to provide sufficient clamping force for the fastening end faces. At this time, the tensile force of the bolt is equal to the clamping force of the connected parts, that is, the bolt preload20,21. The tightening process of bolt is a process of overcoming friction, where a portion of the tightening torque is used to overcome frictional consumption, and another portion can be converted into bolt preload22,23. Due to the non-linear changes in parameters such as friction coefficient during the tightening process, the torque coefficient undergoes uncertain changes. When using the torque method to load bolts, it is important to pay attention to the changes in torque coefficient to improve the control accuracy of bolt preload. At this time, the tightening torque T is converted into the thread pair friction torque Tt and the end face friction torque Tn. The internal performance of the bolt is shown in Fig. 1a.
Fig. 1.

Force analysis of bolted connection: (a)internal performance of the bolt; (b)sloping slider model.
The internal performance of the bolt is equivalently analyzed using a sloping slider model. Due to the non-zero thread tooth side angle βof non rectangular threads, the bolted connection structure expands into a wedge-shaped inclined surface24. The nut is equivalent to a slider in a two-dimensional plane, and the process of applying tightening torque is equivalent to using the horizontal force Fh to push the slider up along the slope. By analyzing the force acting on the slider in Fig. 1b, it can be concluded that the forces in all four directions remain balanced. Therefore, the bolt preload F is:
| 1 |
where ρt is the equivalent friction angle, d2 is the thread pitch diameter, and α is the thread pitch angle.
When β = 0, the normal force Fn perpendicular to the thread pair is equal to the bolt preload F. When β ≠ 0, the normal force  perpendicular to the thread pair is transformed into:
 |
2 |
where μ´t and μt are the threaded pair friction coefficients when β = 0 and β ≠ 0, respectively.
Furthermore, the equivalent friction angle ρt can be obtained as:
 |
3 |
When the applied tightening torque is 0Nm, the generated bolt preload is also 0kN. Starting from 0Nm, the unit bolt preload  of the threaded pair is integrated along the inner diameter to outer diameter direction of the circular ring. The relationship between bolt preload and thread pair friction torque can be obtained as follows:
 |
4 |
where d is the thread nominal diameter, and d1 is the thread minor diameter.
To obtain the relationship between the bolt preload and the end face friction torque under any structure, the profile of the contact end face is assumed to be the inner profile ri(θ) and the outer profile ro(θ). Then, the contact end face is analyzed in the polar coordinate system, as shown in Fig. 2a.
Fig. 2.

Equivalent principle diagram of contact end face: (a) principle diagram of any end face structure; (b) physical diagram of hexagonal end face; (c) principle diagram of hexagonal end face.
The unit bolt preload  of the contact end face is double integrated along the inner profile to the outer profile. The relationship between bolt preload and end face friction torque can be obtained as follows:
| 5 |
where θ is the rotation angle of polar coordinates, µb is the contact end face friction coefficient, and dm is the bolt hole diameter.
Therefore, the relationship between bolt preload and tightening torque change of any structure is :
| 6 |
The structure of the hexagonal end face bolt is shown in Fig. 2b and c, and the relationship between the bolt preload and tightening torque of the hexagonal end face bolt is:
| 7 |
where dh is the inscribed circle diameter of outer profile.
At this time, the torque coefficient of the hexagonal end bolt is:
| 8 |
Analysis of mechanism model
According to Eq. (8), it can be seen that the bolt preload and tightening torque theoretically have a linear relationship when using the torque method to load bolt. However, the linear factor may undergo uncertain changes under different operating conditions. Therefore, the core of torque method is to obtain the torque coefficient within the error range, and to better reflect the change of the tightening curve through the torque coefficient.
Then, the above mechanism model is simulated and tested. According to GB/T 15,756 standard, the typical hexagonal end face bolted connection structure is selected, and their respective torque coefficients are calculated. The structural parameters are shown in Table 1. According to the subsequent experimental conditions, it is assumed that the thread pair and contact end face are lubricated, and µt is selected as 0.114 and µb is selected as 0.070. And assuming that the diameter of the bolt hole is the same as the nominal diameter of the bolt, that is, d = dm.
Table 1.
Typical bolted connection structure parameters.
| Thread nominal diameter (mm) | Thread pitch (mm) | Thread pitch diameter (mm) | Thread minor diameter (mm) | Inscribed circle diameter of outer profile (mm) |
|---|---|---|---|---|
| 8.00 | 1.25 | 7.19 | 6.47 | 13.00 |
| 10.00 | 1.50 | 9.03 | 8.16 | 16.00 |
| 12.00 | 1.75 | 10.86 | 9.85 | 18.00 |
| 14.00 | 2.00 | 12.70 | 11.55 | 21.00 |
| 16.00 | 2.00 | 14.70 | 13.55 | 24.00 |
| 18.00 | 2.50 | 16.38 | 14.93 | 27.00 |
| 20.00 | 2.50 | 18.38 | 16.93 | 30.00 |
| 22.00 | 2.50 | 20.38 | 18.93 | 33.00 |
| 24.00 | 3.00 | 22.05 | 20.32 | 36.00 |
| 27.00 | 3.00 | 25.05 | 23.32 | 40.00 |
| 30.00 | 3.50 | 27.73 | 25.71 | 45.00 |
From the test results in Fig. 3 below, it can be seen that as the thread nominal diameter increases, the torque coefficients of the typical bolt decrease in a fluctuating manner. And its downward trend is getting smaller and smaller. According to the analysis of Eq. (8) and Table 1, it can be seen that due to the composite changes in the structural parameters of the typical bolt, their torque coefficients decrease in a fluctuating manner. The mechanistic model demonstrates advantages in interpretability and quantitative result.
Fig. 3.

Numerical simulation results.
Material and method
Sources of certainty and randomness
The process of tightening bolt using torque method involves a conjugate relationship of both certainty and randomness. At transient time point, the tightening process has computability and high certainty. With the increase of time scale, the nonlinear effects at the micro level extend to the macro scale, and the randomness of the tightening process gradually increases. At the micro level, the tightening parameters and extrusion deformation undergo nonlinear changes with the degree of fit. At the macro level, there are varying degrees of structural differences between the bolt individual and the joint surface, making it difficult to predict the change of torque coefficient at the macro and micro levels. The manifestation of tightening results is that the curve of multiple tightening under the same working condition still shows a certain degree of discreteness.
The magnitude and variation of torque coefficient have important guiding significance for the bolt assembly process. However, in the actual assembly process, the torque coefficient is unstable and cannot be accurately calculated. The torque coefficient obtained by the tightening mechanism model cannot meet the actual assembly needs25–27. In order to compare the error values between the certainty and randomness of the bolt tightening process, the following bolt tightening experiment is conducted. To obtain consistent data under the same working condition, the same batch of bolts, nuts, and connected parts are selected for the experiment, and the experiment pieces are uniformly surface treated. In the experiment, the nut is fixed on the experimental platform and the tightening process is achieved by rotating the bolt head. Then, different lubrication conditions are treated with and without lubrication by applying D-321R lubricant. The experiment is conducted on the fastener tightening experiment machine, and the process parameters are monitored in conjunction with an ultrasonic tightening force measurement system. The torque control range is less than 200Nm, with an accuracy index of 0.5Nm, and the force measurement range is less than 120kN, with an accuracy index of 0.1kN, as shown in Fig. 4; Table 2.
Fig. 4.

Tightening experiment equipment diagram.
Table 2.
Experiment conditions.
| Name | Type | Material | Surface Treatment | Hardness Rockwell C |
|---|---|---|---|---|
| bolt | M8 | GH159 | passivation | ≧ 44 |
| nut | M8 | GH738 | plate with silver | 34 ~ 44 |
| connected parts | 65·90·5 mm | GH4169 | shot peening strengthening | ≧ 45 |
The bolts were divided into four experimental groups with different lubrication conditions: test group 1 with sufficient lubrication, test group 2 with only end face lubrication, test group 3 with only thread lubrication, and test group 4 with no lubrication. The accuracy of the torque coefficient calculated by the mechanism model under different lubrication conditions is verified. The results are shown in Fig. 5. The least square method is used to linearly fit the results is shown in Fig. 6.
Fig. 5.

Tightening curves under different lubrication conditions.
Fig. 6.

Torque coefficient under different lubrication conditions.
The data model composed of experimental results shows that the change in the bolt tightening curve tends to increase linearly, and the concentrated growth area of the tightening curve varies with different lubrication conditions. After lubrication treatment, a layer of lubricating grease film will form on the lubrication surface, which can reduce the phenomenon of coating detachment and wear, avoid damage and plowing effect, and improve the stability of friction coefficient. This is also the main reason for the large dispersion and deviation of torque coefficient under no lubrication conditions.
Comparing the errors between the mechanism model and the data model shown in Table 3, it can be seen that the experimental average torque coefficient is close to the theoretical torque coefficient, and the maximum error is 4.44%, which belongs to a relatively low level. This error result indicating the effectiveness of the mechanism model. However, the maximum error between the single experiment torque coefficient and the theoretical torque coefficient is 12.70%. This phenomenon indicates that the torque coefficient has a certain degree of discreteness and fluctuation in the actual assembly process. If only the mechanism model is used to calculate the torque coefficient, the obtained torque coefficient has errors that cannot be eliminated or predicted. And the dispersion and error of the torque coefficient in the actual assembly process cannot be accurately predicted. Therefore, the calculation results of the bolt tightening mechanism model can only serve as a theoretical reference for actual assembly. The mechanism model is not accurate enough due to the coupling effects of micro-convex body extrusion deformation, grease shedding, scratching phenomenon, frictional heat generation, furrow effect and so on, which is also the reason why the errors of the torque method are difficult to avoid.
Table 3.
Comparison of torque coefficient.
| Group sequence | Data model: average torque coefficient | Mechanism model: torque coefficient | Average relative error (%) | Single maximum relative error (%) |
|---|---|---|---|---|
| 1 | 0.1337 | 0.1365 | 2.09% | 11.36% |
| 2 | 0.1779 | 0.1811 | 1.80% | 7.79% |
| 3 | 0.1501 | 0.1557 | 3.73% | 10.73% |
| 4 | 0.2117 | 0.2023 | 4.44% | 12.70% |
Prediction method by mechanism model guiding data model
If the mechanism is unclear, it is difficult to judge the accuracy and applicability of the prediction model; if the data is insufficient, it is challenging to provide quantitative conclusions from the experiments28. Therefore, the mechanism and data fusion calculation method are adopted to predict the entire tightening process. Considering that the bolt tightening mechanism model takes into account the complex stress conditions and influencing factors at a macro level, it can better reflect the mechanism of bolt tightening. However, in order to simplify the analysis, the nonlinear effects at the micro level are ignored, and the bolt preload is precisely affected by the superposition of such random errors, resulting in certain errors in the fitting results between the mechanism model and data model29,30. Therefore, the mechanism and data fusion calculation method can adopt a model of “mechanism model guiding data model to perform feature selection” to predict the range of bolt preload fluctuation with tightening torque. In this fusion model, the interaction of physics, mathematics, and algorithms feedback each other, ultimately achieving the prediction of bolt preload. From Fig. 7, it can be seen that the driving function is a key component of the prediction model, and an appropriate driving function is of great significance for prediction accuracy.
Fig. 7.

Model network system diagram.
Gaussian Process Regression (GPR) is a machine learning method based on Bayesian estimation. By using Gaussian process priors to perform regression analysis on data, the regression variables all follow the Gaussian distribution31,32. The bolt tightening curve has characteristics such as local nonlinearity and discreteness. When using GPR as the driving model, it can simultaneously predict the target mean and standard deviation, and achieve the prediction and measurement of bolt preload fluctuations. The results have probabilistic significance. The multivariate probability density function  is:
is:
| 9 |
where µ is the mean, and σ is the standard deviation.
For a prediction model  within the range of real numbers, if any variable
  and its corresponding
  follow the above probability distribution, the high-dimensional Gaussian distribution can be represented by the mean function
  of spatial sample points and the positive definite covariance function
  , which can be denoted as
  . By using Bayesian equation, we can obtain:
 |
10 |
Considering that bolt tightening is affected by external disturbances  , the noise model is also used for regression analysis, and the function model is:
 |
11 |
If the distribution of disturbances follows ξ~ N(0, σ2n). Since the mean function is a prior probability, it is set to 0. The distribution of the training sample y(x) follows:
 |
12 |
where X is the training set sample matrix.
If the noise term is added to the model, the training set result y and the prediction result  follow a joint Gaussian distribution, and the probability expression is:
 |
13 |
where  is the n-order covariance matrix,
  is the covariance matrix between the prediction variable
  and the training set sample matrix, and
  is the covariance matrix between the prediction variable
  and itself.
The posterior probability distribution of the prediction values  is
is  , where:
 |
14 |
The covariance function describes the similarity between samples, and its structural selection is particularly important for the accuracy of GPR. The hyperparameter vector  contains parameters of covariance function and noise, and reflects the relationship between sample point and output value. By using the conjugate gradient method to solve the hyperparameter vector ψ, the likelihood function
  can be maximized through likelihood estimation.
| 15 |
Parameter sensitivity analysis
In the prediction process, excessive feature variables can actually cause the prediction model to not converge, resulting in low model accuracy. Therefore, selecting key features can ensure the convergence and accuracy of the model. Parameters sensitivity analysis of bolt tightening is to observe the influence degree of small changes of parameters on changes of model prediction errors. The bolt tightening process is an implicit model that makes it difficult to intuitively analyze the influence degree of various features on the tightening process. Therefore, the joint cooperation of mechanism model and sensitivity analysis can select and fix parameters that have a weaker impact on the model, focus on studying parameters that have a stronger impact on the model, thereby achieving the selection of key characteristic variables of the prediction model33.
By analyzing the tightening process, six characteristic variables are ultimately selected for parameter sensitivity analysis. Under different lubrication conditions, there are significant differences in the dispersion and magnitude of torque coefficients. Therefore, the M8 hexagonal end face bolt is taken as the research object to conduct sensitivity analysis under different lubrication conditions. The values of the characteristic variables are shown in Table 4.
Table 4.
Characteristic variables for sensitivity analysis.
| Characteristic variable | Change range | Description |
|---|---|---|
| P | 1.25 mm ± 15% | the thread pitch |
| d h | 13 mm ± 15% | the inscribed circle diameter of outer profile |
| µ t | 0.114 ± 15% | the thread pair friction coefficient, lubrication |
| 0.203 ± 15% | the thread pair friction coefficient, no lubrication | |
| µ b | 0.070 ± 15% | the contact end face friction coefficient, lubrication |
| 0.102 ± 15% | the contact end face friction coefficient, no lubrication | |
| d 1 | 6.466 mm ± 15% | the thread minor diameter |
| d 2 | 7.188 mm ± 15% | the thread pitch diameter |
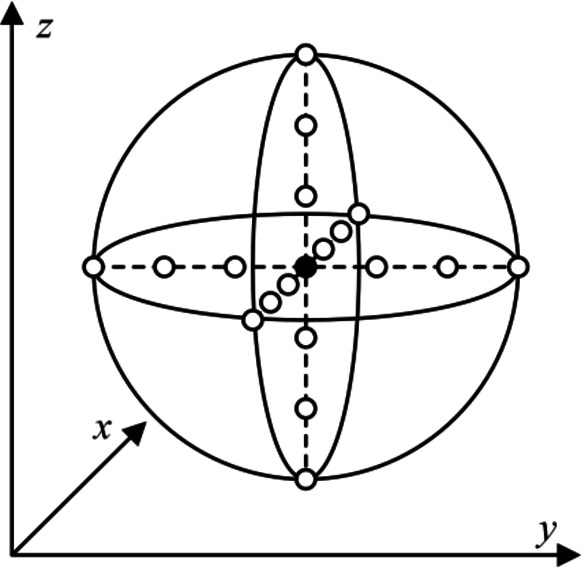
Under the condition of ensuring that the values of other characteristic variables remain unchanged, the analyzed characteristic variable is uniformly and equally sampled at 7 points within their range of variation. Then, the influence of the variation of each characteristic variable on the torque coefficient is studied. The sample distribution of the parameter testing method is shown in Fig. 8, and the number of tests c is:
 |
16 |
Fig. 8.
Sample distribution of parameter testing method.
where m is the number of lubrication conditions, n is the number of sampling points, and pj is the value of the j-th characteristic variable.
Sensitivity analysis is conducted on the six characteristic variables in the bolt tightening mechanism model using parameter testing method. The torque coefficients of each sample point in the mechanism model are calculated separately. The results are shown in Fig. 9.
Fig. 9.

Results of parameter testing method.
From Fig. 9, it can be seen that the influence degree of each characteristic variable on the bolt tightening process is different. Among them, the characteristic variable that has the greatest impact on bolt tightening is the thread pair friction coefficient, followed by the contact end face friction coefficient. Under different lubrication conditions, as the friction coefficient increases, the difference in torque coefficient also gradually increases. In addition, the influence degree of thread minor diameter and the inscribed circle diameter of outer profile is moderate, while the influence degree of thread pitch and thread pitch diameter is relatively less significant.
To quantify the effectiveness of the sensitivity analysis, this section uses the Composite Scaling Sensitivity Analysis (CSS) as the sensitivity evaluation index to quantitatively calculate the impact of multidimensional characteristic variables. The CSS method belongs to the local sensitivity analysis method, which uses the central finite difference method to calculate the slope of the sampling point. And it takes the error function to calculate the quantization result. The composite scaling sensitivity CSSj is:
 |
17 |
where SSij is the scaling sensitivity calculated at the i-th sampling point of the j-th feature, and ∆pj is the difference between the parameter value and the baseline parameter.
The error function ε in the Eq. (17) is used to measure the deviation between the model baseline value and the calculated value. Mean squared error (MSE) is sensitive to outliers and can reflect the distribution of errors ε.
 |
18 |
where  is the baseline value, and yi is the calculated value.
From Fig. 10, it can be seen that the bolt tightening process is more sensitive to the changes of µt, µb, dh and d1, while the sensitivity to d2 and P is lower. Therefore, considering the feasibility of the follow-up experiment, the input characteristics are finally selected as the thread pair friction coefficient, the contact end face friction coefficient, the inscribed circle diameter of outer profile and the tightening torque.
Fig. 10.

Results of sensitivity analysis.
Results and discussion
Model evaluation
The experiment data is provided by SCHATZ fastener tightening experiment machine, and the experiment conditions are the same as those in Table 2. According to the conclusion of the parameter sensitivity analysis, the input and output of the bolt tightening prediction model are shown in Table 5.
Table 5.
Input and output in tightening prediction model.
| Model input | Model output |
|---|---|
| the inscribed circle diameter of outer profile dh | the prediction mean of bolt preload Fµ |
| the thread pair friction coefficient µt | |
| the contact end face friction coefficient µb | the prediction dispersion of bolt preload Fσ |
| the tightening torque T |
To improve the universality of the prediction model, the orthogonal experimental method is used to change the values of input features to obtain sufficient training data. Two different sizes of bolts are selected, with dh of 13 mm and 15 mm, respectively. The threads are lubricated and non-lubricated, with µt of 0.114 and 0.203, respectively. The contact surface are lubricated and non-lubricated, with µb of 0.070 and 0.102, respectively. Tightening torque is controlled by tightening experimental machine. The experiment is repeated 25 times under each experimental condition. The 20 sets of data are randomly selected as the training set and the other 5 sets of data as the testing set. There are 160 training sets and 40 testing sets.
The training set is used to train the prediction model under different covariance functions. Then the performance of the prediction model on the testing set is compared. The prediction model uses four different covariance functions to train and predict under certain conditions, and the prediction results are shown in Fig. 11.
Fig. 11.

Prediction results of different covariance functions.
In order to select the optimal covariance function, the root mean square error (RMSE), mean absolute percentage error (MAPE), determination coefficient (R2) and accuracy (PA) of the actual and predicted results are used as quantitative evaluation indicators to measure the performance of the prediction model34. From the results of Table 6, it can be seen that when the covariance function selects the exponential function, the data fitting effect is the best, and the prediction error of the model is the smallest. Therefore, the covariance function finally selected for the bolt tightening prediction model is the exponential function.
Table 6.
Prediction performance of covariance function.
| Covariance function | RMSE | MAPE | R 2 | P A |
|---|---|---|---|---|
| exponential function | 8.049% | 2.315 | 0.977 | 98.18% |
| square exponential function | 8.166% | 2.345 | 0.968 | 85.45% |
| 5/2 matern kernel function | 8.274% | 2.367 | 0.966 | 81.82% |
| quadratic rational function | 8.171% | 2.355 | 0.973 | 91.82% |
The prediction results of all operating conditions indicate that the output of the bolt tightening prediction model based on GPR is a probabilistic distribution band rather than just a predetermined curve. The maximum error between the prediction value and the mean value of the experimental data is 8.57%, with a 95% probability that the experimental data is within the prediction confidence interval. And the accuracy reaches 99.75%, with a good degree of agreement. Under different operating conditions, the prediction accuracy still remains above 98.18%. It can accurately reflect the trend and fluctuation range of the bolt preload with tightening torque during bolt assembly, proving the effectiveness of the prediction model. The Fig. 12 shows the output results of some operating conditions under different lubrication conditions.
Fig. 12.

Prediction results under different conditions.
To investigate the influence of other regression models on the prediction results of bolt preload, the prediction results based on Gaussian Process Regression (GPR), Kernel Ridge Regression (KRR), and Support Vector Regression (SVR) under a certain operating condition are compared and displayed, as shown in Fig. 13. The experimental results demonstrate that the mean maximum errors of GPR, KRR, and SVR regression models are 7.32%, 12.03%, and 13.89%, respectively. However, due to the superposition of random errors caused by uncertain factors, the bolt tightening curve has a certain degree of discreteness. Then, using only a certain prediction value cannot effectively reveal the fluctuation of bolt preload with tightening torque. Therefore, using GPR can predict the confidence interval of bolt preload fluctuation with tightening torque in a probabilistic sense, which can better characterize the bolt assembly process.
Fig. 13.

Prediction results of different regression models.
Development of engineering prediction software
To improve the engineering practicality of the bolt preload prediction method, this paper developed a corresponding bolt tightening prediction software using the Python programming, as shown in Fig. 14. This software can predict the range of variation of bolt preload with tightening torque under given working conditions and draw the corresponding trend of bolt preload discrete distribution. It can also achieve grouping prediction and save prediction models. Then, it has also developed an interface for importing new experimental data, which facilitates retraining the model and improves its adaptability to various working conditions.
Fig. 14.

Engineering prediction software for bolt tightening.
In order to improve the applicability of engineering prediction software, a library composed of a large amount of prediction data has been established. It can directly select and call the prediction model under different working conditions in the database. If a high-precision prediction model is needed, the corresponding bolt can be modeled separately in the laboratory for actual working conditions. If a convenient prediction model is needed, the established models in the database can be called and parameter selected online.
Conclusions
In response to the problem of large calculation errors of the mechanism model and low interpretability of the data model during bolt tightening, this paper establishes a bolt tightening prediction model based on GPR with “mechanism model guiding data model to perform feature selection”. The advantages and disadvantages of the mechanism model and data model are verified through numerical simulation and experimental methods, respectively. And it proves the sources of certainty and randomness from a micro to macro perspective. The main conclusions are as follows:
The reason for the significant error between the theoretical torque coefficient and the experimental torque coefficient is explained. And it has been proven that the results of the mechanism model can only serve as theoretical references for actual assembly.
Due to the heterogeneity and different fidelity of multidimensional data, a fusion computing method is designed to predict the bolt preload. And parameter sensitivity analysis is conducted to determine the input characteristics of the prediction model as dh, µt, µb, and T.
The experimental results show that the GPR model using exponential function as covariance function has the best prediction performance for bolt tightening prediction, which can obtain the confidence interval of the change of the bolt preload in probability sense. Under different operating conditions, the minimum PA is 98.18%, meeting the accuracy requirements.
Corresponding engineering software has been built to accurately predict tightening curves under different conditions, improving the application ability of prediction method. Ultimately, the prediction method can optimize and improve the production efficiency and quality control of bolt tightening.
Acknowledgements
The authors are grateful to the esteemed editors and anonymous reviewers for their valuable suggestions to improve the quality of this study.
List of symbols
- T
the tightening torque
- Tt
the thread pair friction torque
- Tn
the end face friction torque
- β
the non-zero thread tooth side angle
- Fh
the horizontal force
- F
the bolt preload
- ρt
the equivalent friction angle
- d2
the thread pitch diameter
- α
the thread pitch angle
- Fn
the normal force when β = 0
- F´n
the normal force when β ≠ 0
- μ´t
the threaded pair friction coefficient when β=0
- μt
the threaded pair friction coefficient when β ≠ 0
- ∆f1
the unit bolt preload of the threaded pair
- d
the thread nominal diameter
- d1
the thread minor diameter
- ri(θ)
the inner profile
- ro(θ)
the outer profile
- ∆f2
the unit bolt preload of the contact end face
- θ
the rotation angle of polar coordinates
- μb
the contact end face friction coefficient
- dm
the bolt hole diameter
- dh
the inscribed circle diameter of outer profile
- d2
the thread pitch diameter
- P
the thread pitch
- μ
the mean
- σ
the standard deviation
- f(xi)
a prediction model
- xi
a variable
- μ(x)
the mean function
- Κ(m, n)
the positive definite covariance function of m and n
- ξ
the external disturbances
- Χ
the training set sample matrix
- y*
the prediction result
- y
the training set result
- x*
the prediction variable
- ψ
the hyperparameter vector
- Ρ(y | x,ψ)
the likelihood function
- c
the number of tests
- m
the number of lubrication conditions
- n
the number of sampling points
- pj
the value of the j-th characteristic variable
- CSSj
the composite scaling sensitivity
- SSij
the scaling sensitivity calculated at the i-th sampling point of the j-th feature
- ∆pj
the difference between the parameter value and the baseline parameter
- ε
the distribution of errors
- y*i
the baseline value
- yi
the calculated value
- Fμ
the prediction mean of bolt preload
- Fσ
the prediction dispersion of bolt preload
Author contributions
Q.Y. designed this prediction algorithm and conducted experiments to verify their correctness. Z.B. led this research work and statistically conducted analyzed the whole article. D.D. conducted data processing and optimized the structure of the prediction model. O.W. was responsible for the overall layout, citations, and polishing of the paper. In the end manuscript draft was proof-read and revised by all authors before submitting to your prestigious journal.
Funding
The authors disclose receipt of the following financial support for the research and publication of this article: the Project of Qinghai Provincial Department of Science and Technology (2024-ZJ-741), the Project of Qinghai Provincial Department of Science and Technology (k071920), the Kunlun Talent-High end Innovative Talent Project in Qinghai Province (k9923194) and the Ministry of Education’s Industry University Research Collaborative Education Project (202102108040). This article is one of the phased achievements of the project.
Data availability
The data that support the findings of this study are available from the corresponding author on a reasonable request.
Declarations
Competing interests
The authors declare no competing interests.
Footnotes
Publisher’s note
Springer Nature remains neutral with regard to jurisdictional claims in published maps and institutional affiliations.
References
- 1.Zhao, B. et al. Evaluation and analysis on Bolt Pre-tightening forces of nine-stage Disc Assembly. J. China Mech. Eng.31 (13), 1570–1576. 10.3969/j.issn.1004-132X.2020.13.008 (2020). [Google Scholar]
- 2.Zhu, L. B. et al. Interface contact performance model of bolted joints considering macro-micro morphology. J. J. Xi’an Jiaotong Univ.58 (07), 148–159. 10.7652/xjtuxb202407014 (2024). [Google Scholar]
- 3.Wang, X. B. et al. Study on the influence of screwing bolts and nuts onthread axial preload. J. Manuf. Technol. Mach. Tool.06, 189–193. 10.19287/j.cnki.1005-2402.2019.06.035 (2019). [Google Scholar]
- 4.Zhao, W. et al. Novel fuzzy direct torque control based on constructed functional transformed grey model. J. J. Power Electron.21 (6), 901–910. 10.1007/s43236-021-00236-6 (2021). [Google Scholar]
- 5.Zhao, B., Zhang, S. Y. & Wang, H. Analyses of preload variations in aeroengine rotor bolted connections. J. J. Tsinghua Univ.61 (10), 1144–1151. 10.16511/j.cnki.qhdxxb.2020.22.035 (2021). [Google Scholar]
- 6.Liu, S. X. et al. Theoretical calculation of torque coefficient for hexagon head bolt with hexagon end. J. J. Dalian Univ. Technol.60 (03), 262–266. 10.7511/dllgxb202003006 (2020). [Google Scholar]
- 7.Wang, C. L. et al. Theoretical calculation of torque coefficient of bolt with arbitrary end face. J. J. Mech. Strength.46 (01), 136–142. 10.16579/j.issn.1001.9669.2024.01.018 (2024). [Google Scholar]
- 8.Li, X. Q. et al. Influence of Tightening Strategy on Pre-tightening Force of Aero-engine Single-bolt Connection. J. JOURNAL OF MECHANICAL ENGINEERING. 56(13), 231 – 41. (2020). 10.3901/JME.2020.13.231
- 9.Li, X. Q. et al. Experiment on bolt tightening torque coefficient fluctuation of aeroengine. J. J. Aerosp. Power. 38 (08), 1793–1804. 10.13224/j.cnki.jasp.20210629 (2023). [Google Scholar]
- 10.Zhang, S. Y. et al. Nut coefficient variation of Aeronautical Threaded fasteners, Experimental Research. J. Modular Mach. Tool. Automatic Manuf. Technique. 09, 25–28. 10.13462/j.cnki.mmtamt.2020.09.006 (2020). [Google Scholar]
- 11.Chen, Z. et al. Diagnosing tunnel collapse sections based on TBM tunneling big data and deep learning, a case study on the Yinsong Project. J. Tunn. Undergr. Space Technol.108, 103700. 10.1016/j.tust.2020.103700 (2021). [Google Scholar]
- 12.Ren, P. F. et al. Rolling force model for 304 stainless steel ultra-thin strip based on mechanism and data fusion. J. Iron Steel. 1–15. 10.13228/j.boyuan.issn0449-749x.20240094 (2024).
- 13.Khan, R. et al. Internet of things (IoT) based saffron cultivation system in greenhouse. J. Sci. Rep.14, 22589. 10.1038/s41598-024-69513-1 (2024). [DOI] [PMC free article] [PubMed] [Google Scholar]
- 14.Yin, F. J., Xu, Z. Y. & Liu, H. Thinking on constructing an intelligent control system of wastewater treatment based on the combination of mechanism and data-driven model. J. Environ. Eng.40 (06), 138–144. 10.13205/j.hjgc.202206018 (2022). [Google Scholar]
- 15.Wang, L. T., Zhang, X. L. & Liu, J. H. Prediction of bolt connect ion loosening based on mechanism and data fusion. J. Comput. Integr. Manuf. Syst.27 (03), 692–700. 10.13196/j.cims.2021.03.004 (2021). [Google Scholar]
- 16.Ye, T., Feng, H. & Li, G. Strength Prediction of Composite Material Bolted Joints Based on BP Neural Networks. J. Composites Science and Engineering. 1–10. (2024). http://kns.cnki.net/kcms/detail/10.1683.TU.20240327.1204.006.html
- 17.Reichstein, M. et al. Deep learning and process understanding for data-driven Earth system science. J. Nat.566 (7743), 195–204. 10.1038/s41586-019-0912-1 (2019). [DOI] [PubMed] [Google Scholar]
- 18.Qin, T. M. et al. Self-adaptive hybrid dynamic model of SCR flue gas denitration system. J. Chinese Journal of Scientific Instrument. 37(12), 2844-50. (2016). 10.3969/j.issn.0254-3087.2016.12.025
- 19.Sadowski, P. et al. Synergies between Quantum Mechanics and Machine Learning in reaction prediction. J. J. Chem. Inform. Model.56 (11), 2125–2128. 10.1021/acs.jcim.6b00351 (2016). [DOI] [PubMed] [Google Scholar]
- 20.Liu, Y. Analysis of Formation Mechanism of Bolt Pretension and Its Fatigue Performance Influence under Manufacturing Deviation. D. Dalian University of Technology. (2021). 10.26991/d.cnki.gdllu.2021.002250
- 21.Xiong, F. et al. Lateral stiffness of bolted prefabricated concrete wall. J. Adv. Eng. Inf.54 (03), 98–108. 10.15961/j.jsuese.202100304 (2022). [Google Scholar]
- 22.Wu, Z. et al. Torque control of bolt tightening process through adaptive-gain second-order sliding mode. J. Meas. Control. 53, 1131–1143. 10.1177/0020294020932354 (2020). [Google Scholar]
- 23.Wu, Z. et al. Fuzzy Control Based on Torque and Angle Method for Bolt Assembling System. C. Prognostics and Health Management Conference (PHM-Besançon). 214–218. (2020). 10.1109/PHM-Besancon49106.2020.00042 (2020).
- 24.Li, L. et al. A modified elastic contact stiffness model considering the deformation of bulk substrate. J. J. Mech. Sci. Technol.34 (2), 777–790. 10.1007/s12206-020-0126-3 (2020). [Google Scholar]
- 25.Wettstein, A., Kretschmer, T. & Matthiesen, S. Investigation of dynamic friction during impact tightening of bolted joints. J. Tribology Int.146, 106251. 10.1016/j.triboint.2020.106251 (2020). [Google Scholar]
- 26.Liu, N. et al. Influence of deviation on Tightening Torque-preload relation of bolted joints. J. Mach. Des. Res.40 (04), 249–255. 10.13952/j.cnki.jofmdr.2024.0176 (2024). [Google Scholar]
- 27.Lee, J., Kim, D. & Seok, C. S. Methodology for evaluating the tightening torque-clamping force relationship and friction coefficients in bolted joints. J. J. Mech. Sci. Technol.36 (4), 1913–1919. 10.1007/s12206-022-0328-y (2022). [Google Scholar]
- 28.Wang, H. Y. et al. Study and application of data-driven rolling force prediction model in hot strip mills. J. China Metall. 1–10. 10.13228/j.boyuan.issn1006-9356.20240429 (2024).
- 29.Liu, Z. F. et al. A method of predicting the residual clamping force of bolts based on BP neural network. P. Beijing, China, CN201910967846. 1-9. (2020).
- 30.Luo, Z. et al. Variation Law of Preload of Bolted Joint in tightening process. J. J. Northeastern Univ. (Natural Science). 44 (02), 215–222. 10.12068/j.issn.1005-3026.2023.02.009 (2023). [Google Scholar]
- 31.Chen, X. K. et al. Tool life prediction based on bagging integrated gaussian process regression model. J. Manuf. Technol. Mach. Tool. (12), 110–115. 10.19287/j.cnki.1005-2402.2020.12.021 (2020).
- 32.Zhang, H. et al. Research on the yield control tightening process and monitor the preload of bolted joints for Fan tower. J. Mechanical Science and Technology for Aerospace Engineering. 1–9. (2024). 10.13433/j.cnki.1003-8728.20240017
- 33.Zhu, B. & Chen, Z. Calibrating and validating a soil constitutive model through conventional triaxial tests, an in-depth study on CSUH model. J. Acta Geotech.17 (8), 3407–3420. 10.1007/s11440-021-01432-1 (2022). [Google Scholar]
- 34.Zhang, G. et al. Online Prediction of Extreme Deviation of Physical-Data Fusion Frequency Based on Wide-Area Measurements. J. Electric Power Construction. 44(8), 1–12. (2023). 10.12204/j.issn.1000-7229.2023.08.001
Associated Data
This section collects any data citations, data availability statements, or supplementary materials included in this article.
Data Availability Statement
The data that support the findings of this study are available from the corresponding author on a reasonable request.