

Summary
The COVID-19 pandemic was the most dramatic in the newest history with nearly 7 million deaths and global impact on mankind. Here, we report binding index of 305 human leukocyte antigen (HLA) class I molecules from 18,771 unique haplotypes of 28,104 individuals to 821 peptides experimentally observed from spike protein receptor binding domain (RBD) of five main SARS-CoV-2 strains hydrolyzed by human proteasomes with constitutive and immune catalytic phenotypes. Our data read that mutations in the human angiotensin-converting enzyme 2 (hACE2)-binding region RBD496-513 of Omicron B.1.1.529 strain results in a dramatic increase of proteasome-mediated release of two public HLA class I epitopes. Global population analysis of HLA class I haplotypes, specific to these peptides, demonstrated decreased mortality of human populations enriched in these haplotypes from COVID-19 after but not before December, 2021, when Omicron became dominant SARS-CoV-2 strain. Noteworthy, currently circulating BA.2.86 and JN.1 strains contain same amino acid substitutions at key proteasomal cleavage sites, thus preserving identified core epitopes.
Subject areas: Immunology, Immune response, Cell biology
Graphical abstract
Highlights
-
•
Mutations in SARS-CoV-2 Omicron lead to altered proteasome-mediated RBD processing
-
•
Release of public CD8 T cell epitopes by proteasome is elevated in Omicron RBD
-
•
Human HLA class I alleles providing increased resistance to Omicron are identified
-
•
Currently circulating SARS-CoV-2 lineages preserve identified core epitope
Immunology; Immune response; Cell biology
Introduction
Coronavirus disease 2019 (COVID-19) caused by SARS-CoV-2 infection is associated with immune dysregulation and abnormal hyperinflammation and on December 2024 reached 0.7 billion confirmed cases with 1% mortality (World Health Organization). Despite lost pandemic status, SARS-CoV-2 is still actively persisting in the human population. SARS-CoV-2-specific CD4+ and CD8+ T cell responses, but not antibody titer, play a critical protective role during COVID-19.1 Kinetic studies quantifying SARS-CoV-2-specific T cells and antibody responses over the course of acute infection in naive individuals revealed rapid expansion of interferon gamma (IFN-γ)-producing T cells specific for different structural and non-structural SARS-CoV-2 proteins including spike (S), membrane (M), nucleocapsid protein (N), ORF3a, and ORF7/8 in patients who experienced rapidly controlled SARS-CoV-2 replication without severe disease. In contrast, patients with prolonged infection and severe COVID-19 mounted robust antibody responses but had less circulating SARS-CoV-2-specific T cells.2 Over 2,400 experimentally verified human T cell SARS-CoV-2 human leukocyte antigen (HLA) class I and class II epitopes have been described so far, and in majority of subjects T cell responses exhibit remarkable breadth.3,4
According to the World Health Organization, there are five SARS-CoV-2 variants of concern (VOCs), which have been circulating: Alpha (B.1.1.7), Beta (B.1.351), Gamma (B.1.1.28 (P.1)), Delta (B.1.617.2), and Omicron (B.1.1.529, including BA.1, BA.2, BA.3, BA.4, BA.5, and descendant lineages). At the present time, no SARS-CoV-2 variants meet the VOC criteria, but several variants are stated as variant of interest (VOI) and variants under monitoring (VUMs), including the emerging lineage of Omicron BA.2.86.5 Current data indicate that the Omicron variant has the largest number of mutations and thus the highest ability to evade therapeutic monoclonal and vaccine-elicited polyclonal neutralizing antibodies.6,7,8,9,10 On the other hand, the T cell responses against the Omicron variant in donors, who were vaccinated with ancestral S protein or infected by previous strains, were largely preserved.11,12,13,14
The intrinsic severity of Omicron is lower than that of previous variants, potentially due to its tropism for upper airways and hence lower risk of lower respiratory tract infection.15 Mutations in Omicron spike protein as well as in nsp6 causes less severe disease compared to the ancestral virus due to altered viral tropism and adaptation to the changed tissue environment.16 The less efficient spike cleavage of Omicron at S1/S217 is associated with a shift in cellular virulence away from TMPRSS2-expressing cells, with implications for altered pathogenesis.18 Additionally, Omicron variant is less effective in antagonizing the host cell interferon response, which may explain why it causes less severe disease.19
Summarizing, despite SARS-CoV-2 losing its pandemic status, comprehensive analysis of its evolution and immunogenicity features may better prepare humanity to overcome more confidently future SARS-like viral epidemics. Previous studies demonstrate direct link of HLA class I polymorphism with incidence and mortality of the SARS-CoV-2.20,21,22,23,24,25 In our study, we aimed to elucidate if there any antigenic determinants in Omicron variant, which may contribute to its decreased severity. Our scientific logic was that highly mutated spike protein receptor binding domain (RBD) may be a source of novel antigenic determinants due to the appearance of proteolytic sites beneficial for proteasome cleavage. Here, we experimentally analyzed fragmentation of RBD of five main SARS-CoV-2 strains by human proteasomes of constitutive and immune phenotypes. Our data revealed that reduced severity of Omicron variant may be directly linked with the mutations in its C-terminal region causing altered proteasome-mediated release of two CD8+ T-cell-positive immunodominant HLA class I epitopes, covering 82% and 27% of world population haplotypes. Analysis of population frequency of HLA class I alleles revealed that HLA-B∗07:02, -B∗08:01, -B∗15:01, -C∗01:02, -C∗06:02, -C∗07:02, and -C∗12:03 potentially provide increased resistance of human population to Omicron.
Results
Study design
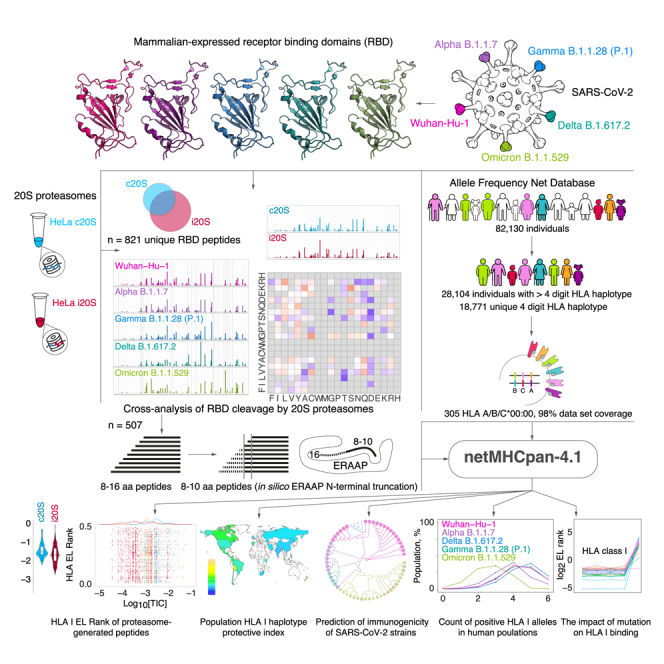
Purified human 20S proteasomes from HeLa cells (constitutive proteasomes, c20S) and HeLa cells exposed to IFN-γ (immunoproteasomes, i20S) (Figure 1A) were mixed with mammalian-expressed RBD variants of SARS-CoV-2 strains Wuhan-Hu-1, Alpha B.1.1.7, Delta B.1.617.2, Gamma B.1.1.28 (P.1), and Omicron B.1.1.529 (Figure 1B). Obtained hydrolysates were analyzed by liquid chromatography-tandem mass spectrometry (LS-MS/MS) (Figure 1C). Peptides from 9 to 16 amino acids long were subjected to in silico ERAAP (aminopeptidase associated with antigen processing in the ER26,27) N-terminal truncation to length of 8–10 amino acids28 and analyzed versus HLA class I molecules representing 305 alleles of 18,771 unique haplotypes from 28,104 individuals according to Allele Frequency Net Database (98% world population dataset coverage) (Figure 1D). The HLA class I EL ranks calculated by artificial neural network netMHCpan-4.1 were used for further analysis of population haplotype HLA class I protective index, count of RBD-positive HLA class I haplotypes, and estimation of SARS-CoV-2 mutation drift on its immunogenicity (Figure 1E).
Figure 1.

Study design
(A) Intact HeLa cells or HeLa cells treated by IFN-γ stably expressing HTBH-tagged proteasome subunit β7 were lysed in the absence of ATP, and further protein lysates were incubated with streptavidin beads. Washing buffer was supplemented with 0.75 M NaCl to dissociate 20S and 19S particles. Trapped human constitutive proteasomes (HeLa c20S) and immunoproteasomes (HeLa i20S) were eluted with TEV protease. Mammalian-expressed (B) receptor-binding domains (RBDs) of SARS-CoV-2 strains Wuhan-Hu-1, Alpha B.1.1.7, Delta B.1.617.2, Gamma B.1.1.28 (P.1), and Omicron B.1.1.529 were hydrolyzed by 20S proteasomes with different catalytic phenotypes and further analyzed by LS-MS/MS (C). Observed 8–16 amino acid peptides (n = 507) were in silico truncated to length of 8–10 and further analyzed by netMHCpan-4.1 algorithm for binding index with 305 HLA class I molecules covering 18,771 unique haplotypes of 28,104 individuals from Allele Frequency Net Database (D).
(E) Final data included EL rank values of proteasome-generated peptides, population haplotype HLA class I binding index, and count of RBD-positive HLA class I haplotypes.
There are several reasons why we chose uncapped 20S proteasome for our in vitro studies. Firstly, 20S proteasomes are believed to represent two-thirds of the total proteasome pool29 and may degrade up to 20% of intracellular proteins.30 At least 10% of HLA class I peptides were found to be dependent on the proteasome but independent of ubiquitination for their generation.31 Secondly, 20S proteasomes itself may degrade ubiquitinated substrates,32 especially in oxidative stress conditions.33,34 Thirdly, SARS-CoV-2 S protein ubiquitination35 is post-translational modification, which affects its cleavage by proteases36 rather is linked with ubiquitin-dependent degradation mediated by 26S proteasome.
Fragmentation of RBD variants from five reference SARS-CoV-2 strains by human proteasomes with different catalytic phenotypes
The DNA constructs coding for HTBH-tagged proteasome subunit β7 (PSMB4) were integrated into the genome of the HEK 293T and HeLa cells using Sleeping Beauty transposon system as described previously.37 HEK 293T and HeLa cells, exposed or not exposed to IFN-γ for 96 h, stably expressing HTBH-tagged proteasome subunit, were lysed in the absence of ATP, and further protein lysates were incubated with streptavidin beads. Washing buffer was supplemented with 0.75 M NaCl to dissociate 20S and 19S particles. Purified human proteasomes were analyzed by gel electrophoresis utilizing Coomassie staining, in-gel fluorescence with Me4BodipyFL-Ahx3Leu3VS fluorescent proteasome probe (UbiQ18)38 (Figure 2A), and western blotting (Figure 2B). Our data clearly indicate that in contrast to HeLa and HEK 293T cells, 20S proteasome isolated from HeLa cells subjected to IFN-γ has distinct immune phenotype due to the presence of all three catalytic subunits β1i, β2i, and β5i. In line with this, activity toward immunoproteasome substrate PAL-AMC and ratio of chymotryptic to caspase activity of 20S proteasomes, isolated from HeLa cells exposed to IFN-γ, increased approximately 2.5 times in comparison with non-treated HeLa and HEK 293T cells (Figure 2C). Due to the identical subunit composition and activity of 20S proteasomes, isolated from HEK 293T cells and HeLa cells not exposed to IFN-γ, in further experiments we used constitutive 20S proteasome (c20S) from untreated HeLa cells and immunoproteasome-enriched 20S samples from HeLa cells subjected to IFN-γ (i20S).
Figure 2.

Characterization of purified human c20S and i20S proteasomes from HEK 293T and HeLa cells
Analysis of the proteasomes purified from HEK 293T, HeLa cells, and HeLa cells treated by IFN-γ by Coomassie-stained SDS-PAGE and in-gel fluorescence using Me4BodipyFL-Ahx3Leu3VS fluorescent probe (UbiQ18) (A), western blotting with antibodies specific to structural (α) and catalytic (β) core subunits (B).
(C) Activity of purified proteasomes toward fluorogenic 7-amido-4-methylcoumarin (AMC) substrates. The LLVY-AMC/LLE-AMC activity ratio is shown in the right. Data are represented as average (n = 5) and standard deviation. Statistically significant difference according to Student’s t test (p < 0.001) is shown by asterisk.
(D) The S protein RBDs purified from HEK 293F cells of Wuhan-Hu-1, Alpha B.1.1.7, Delta B.1.617.2, Gamma B.1.1.28 (P.1), and Omicron B.1.1.529 strains analyzed by SDS-PAGE followed by Coomassie staining.
The S protein RBDs purified from HEK 293F cells of Wuhan-Hu-1, Alpha B.1.1.7, Delta B.1.617.2, Gamma B.1.1.28 (P.1), and Omicron B.1.1.529 strains (Figure 2D) were incompletely (80%–90%) digested by c20S and i20S proteasomes in order to restrict substrate re-entry. The LS-MS/MS analysis of hydrolysates revealed different distribution of C-terminal and N-terminal amino acids in peptides, generated by c20S and i20S proteasomes (Figure 3A). Both types of proteasomes tended to generate peptides with hydrophilic N-terminus, whereas C-terminus of i20S-released RBD peptides were more hydrophobic in comparison with c20S proteasomes. As expected, c20S proteasomes more actively hydrolyze RBD variants after acidic amino acids, especially aspartate, due to the presence of caspase-like activity. Analysis of sequence-specific RBD cleavage between c20S and i20S revealed that difference in cleavage sites between c20S and i20S was similar between RBD variants and was minimal in Omicron B.1.1.529 RBD variant (Figure 3B).
Figure 3.

The SARS-CoV-2 S protein RDB cleavage site preferences of human proteasomes with different catalytic phenotypes
(A) Differential plot of peptides N- and C-terminal amino acids from RBD variants hydrolyzed by human proteasomes with different catalytic phenotypes (c20S and i20S).
(B) Differential abundance of c20S (blue) and i20S (red) cleavage sites in RBD of SARS-CoV-2 strains Wuhan-Hu-1 (pink), Alpha B.1.1.7 (violet), Gamma B.1.1.28 (P.1) (blue), Delta B.1.617.2 (aquamarine), and Omicron B.1.1.529 (light green). Mutations in RBD sequence are indicated by respective colors.
The individual peptide patterns (Figure 4A) revealed that i20S proteasomes generated from RBD variants the highest diversity of peptides with length more than 7 amino acids, except Omicron RBD. The c20S-generated RBD peptides were significantly less variable and mostly overlapped with peptides produced by immunoproteasome i20S. Total amount of detected peptides was minimal in Omicron B.1.1.529 samples. Proteasome-mediated RBD cleavage was the most intensive in the middle part of the protein, and flanking regions approximately 50 amino acids long were significantly less processed. Distribution of major sites of RBD cleavage demonstrated similar pattern of hydrolysis of RBD from Wuhan-Hu-1, Alpha B.1.1.7, Delta B.1.617.2, and Gamma B.1.1.28 (P.1) strains (Figure 4B), whereas Omicron B.1.1.529 RBD variant was significantly higher processed in the 495–505 region in comparison with other strains. To elucidate if this effect is reproduced in mammalian cells, we further transfected HEK 293T cells with cDNA coding for RBD from Wuhan-Hu-1 and Omicron B.1.1.529 strains. Analysis of peptide fraction extracted from these cells confirmed existence of RBD-derived peptides from region 408 to 423, which directly fits major proteasomal cleavage sites for Wuhan-Hu-1 and Omicron B.1.1.529, observed in vitro. Importantly, peptide RBD496-510 was detected only in cells, expressing Omicron B.1.1.529 variant, suggesting correlation between in vitro and in vivo RBD processing (Figure S1).
Figure 4.

Fragmentation of SARS-CoV-2 S protein RBD variants by human proteasomes with different catalytic phenotypes
(A) Venn diagrams representing distribution of identified RBD peptides after proteasome-mediated (i20S proteasomes in blue, i20S—in red) hydrolysis identified by LS-MS/MS.
(B) Relative intensity of RBD cleavage sites of SARS-CoV-2 strains Wuhan-Hu-1 (pink), Alpha B.1.1.7 (violet), Gamma B.1.1.28 (P.1) (blue), Delta B.1.617.2 (aquamarine), and Omicron B.1.1.529 (light green). Mutations in RBD sequence are indicated by respective colors.
Prediction of affinity of S protein RBD HLA class I epitopes utilizing LC-MS/MS data of RBD hydrolysis by proteasomes with different catalytic phenotypes
Experimentally observed peptides from 8 to 16 amino acids long were further subjected to in silico ERAAP N-terminal truncation to length of 8–10 amino acids and analyzed versus HLA class I molecules corresponded to 305 alleles (Tables S1, S2 and S3, Data S1 and S2). Analysis of distribution of peptides with EL rank less than 0.5 revealed that i20S immunoproteasomes solely generate approximately half of total HLA I epitopes, whereas other part is mostly generated by both c20S and i20S (Figure 5A). Percentage of peptides overlapping between c20S and i20S RBD hydrolysis products increased in Omicron B.1.1.529 RBD samples from 50 to 65 in comparison with other RBD variants. Analysis of HLA class I EL rank of the proteasome-generated RBD peptides versus its relative abundance (Figure 5B) revealed that HLA class I epitopes in Omicron B.1.1.529 RBD samples shifted to the more quantitively representative area. Density of HLA class I epitopes relatively its intensity clearly demonstrated that, firstly, i20S proteasomes generally produce broader repertoire of the peptides and, secondly, c20S generates HLA class I epitopes more intensively (Figure 5C). Importantly, in contrast to other strains, in the Omicron B.1.1.529 RBD samples c20S and i20S HLA class I epitopes, density curves were completely overlapped. Calculation of median and interquartile range of relative abundance and its relative abundance to EL rank index of c20S- and i20S-generated HLA I epitopes revealed statistically significant increase of Omicron B.1.1.529 values in comparison with other SARS-CoV-2 RBD variants (Figure 5D). Finally, estimation of cumulative protection index of unique RBD HLA I epitopes for each variant demonstrated the highest values for Omicron B.1.1.529 RBD peptides generated by both c20S and i20S proteasomes (Figure 5E, Table S4).
Figure 5.

Analysis of HLA class I binding index of SARS-CoV-2 RBD peptides generated by human proteasomes with different catalytic phenotypes
(A) Venn diagrams representing distribution of proteasome-generated RBD peptides (herein and after c20S in blue, i20S—in red) with HLA class I EL rank ≤0.5.
(B) Distribution of HLA class I EL rank and relative abundance of proteasome-generated RBD peptides related to different SARS-CoV-2 strains.
(C) Density of HLA class I epitopes count (without duplication) grouped by SARS-CoV-2 strains (top) and proteasomes type (bottom).
(D) Violin plots of HLA class I proteasome-generated peptide binders according to its relative abundance (top) and relative abundance normalized to HLA class I EL rank (bottom). Data are represented as box-and-whiskers diagram, i.e., individual values, median, interquartile range, and data spread excluding outliers. Statistically significant difference of Omicron B.1.1.529 with all other strains (p < 0.0001) according to Dunn’s test with Bonferroni correction employed after the Kruskal-Wallis test is indicated by asterisk.
(E) Multiple Venn diagrams of S protein RBD peptides of SARS-CoV-2 strains Wuhan-Hu-1 (pink), Alpha B.1.1.7 (violet), Gamma B.1.1.28 (P.1) (blue), Delta B.1.617.2 (aquamarine), and Omicron B.1.1.529 (light green) generated by c20S (top) and i20S (bottom) proteasomes. Protective index (average amount of epitope-positive HLA class I alleles in world population human haplotypes, PI) for unique RBD HLA class I epitopes is indicated.
Elucidation of physiologically relevant SARS-CoV-2 S protein RBD epitopes
Firstly, we collapsed proteasome-generated N-terminally extended peptides related to the same core HLA class I CD8+ T cell epitopes listed in the Immune Epitope Database (IEDB) (Tables S5 and S6). Comparison of previously reported CD8+ T cell epitopes3,4,39,40,41,42,43,44,45,46 and experimentally observed proteasome-generated SARS-CoV-2 core RBD HLA class I epitopes revealed that only minor part of them is overlapped (Figure 6A; Table S7). Majority of abundant proteasome-generated epitopes have neither broad HLA class I haplotype coverage nor experimentally registered CD8+ T cell response. We further focused on the most abundant and population-relevant RBD epitopes. In the C-terminal Omicron RBD region 496–513, we observed enhanced release of two core epitopes, namely 504GHQPYRVVVL513 and 496SFRPTYGVGH505 (Figure 6B). Epitope 504GHQPYRVVVL513 was released from Omicron B.1.1.529 RBD variant by proteasome-mediated hydrolysis 3–10 times more effectively in comparison with 504GYQPYRVVVL513 in other SARS-CoV-2 RBD variants. Epitope 496SFRPTYGVGH505 was observed solely in Omicron B.1.1.529 RBD hydrolysates (Figure 6C). Next, we systematically analyzed epitopes shown on Figure 6A in terms of c20S- and i20S-proteasome-mediated release, percentage of HLA class I positive haplotypes (Figure 6D), and previously reported CD8+ T cell assays (Figure 6E). Our data read that abundant proteasome-generated Omicron RBD HLA class I epitopes 504GHQPYRVVVL513 and 496SFRPTYGVGH505 cover 82% and 27% of human haplotype variants, and RBD504-513 elicited CD8 T cell response in 31% of individuals. Another representative Omicron RBD epitope 442KVSGNYNYLY451 covers 17% of human haplotype variants and previously was shown to be positive in half of patients’ cytotoxic assays. In other SARS-CoV-2 RBD variants, we highlighted RBD epitopes 506QPYRVVVL513, 502GVGYQPYRVV511, and less abundant 504GYQPYRVVVL513, which were positive in one-third of CD8+ T cell assays and cover 16%, 35%, and 97% of human haplotypes variants, respectively.
Figure 6.

Proteasome-mediated Omicron RBD cleavage results in release of public CD8+ T cell core epitopes
(A) Comparison of previously reported CD8+ T cell epitopes and experimentally observed proteasome-generated collapsed core SARS-CoV-2 RBD HLA class I epitopes.
(B) C-terminal Omicron RBD region 490–514 with indicated proteasome-generated N-terminally extended peptides and intensity of cleavage sites.
(C) Relative abundance of core epitopes in RBD hydrolysates by c20S and i20S proteasomes.
(D and E) Systematical analysis of epitopes shown on (A) in terms of c20S- and i20S-proteasome-mediated release, percentage of HLA class I positive haplotypes (D), and previously reported CD8+ T cell assays (E). Omicron mutations are shown in bold.
We further turned to the structural aspects of the determined main Omicron RBD HLA class I epitopes. To this aim, we mapped these epitopes on previously reported47 crystal structure of Omicron RBD-human angiotensin-converting enzyme 2 (hACE2) complex (Figure 7A). Interestingly, amino acids from two of three epitopes, 496SFRPTYGVGH505 and 442DSKVSGNYNYLY453, are directly involved in the formation of the patch 2 of the RBD-hACE2 binding interface. Thus, Omicron B.1.1.529 RBD Y449 interacts with residues D38 and Q42 from hACE2, RBD R498 forms a salt bridge with D38 from hACE2, RDB T500 and Y501 interact with Y41 from hACE2, and K353 from hACE2 forms a hydrogen bond with G502 of RBD.47
Figure 7.

Identified proteasome-generated public Omicron SARS-CoV-2 RBD epitopes have global physiological relevance
(A) Crystal structure of Omicron RBD-hACE2 complex with marked regions containing public Omicron SARS-CoV-2 RBD epitopes. RBD amino acids crucial for patch 2 of the RBD-hACE2 binding interface are shown.
(B and C) Correlation between COVID-19 mortality and percentage of haplotypes (B) and population frequency of haplotypes (C) positive toward public Omicron SARS-CoV-2 RBD epitopes in different countries according to Spearman’s rank correlation. Omicron mutations are shown in bold.
(D) Analysis of population haplotype protective index and HLA-class I-positive haplotypes frequency toward RBD503-513 core epitope in different countries.
(E) COVID-19 mortality rate and vaccination status in Republic of Paraguay and geographically proximal Plurinational State of Bolivia in South America.
(F) Mortality rate, confirmed COVID-19 cases, and vaccination dynamics in Paraguay and Bolivia since March, 2020 till beginning of 2023. Confirmed cases and mortality are reported for periods from March, 2020 till beginning of December, 2021 (light gray) and for first Omicron wave 12.06.2021–03.07.2022 (gray).
Global population analysis of HLA class I haplotypes specific to Omicron RBD peptides 496SFRPTYGVGH505 and 504GHQPYRVVVL513 demonstrated negative correlation between COVID-19 mortality and percentage of positive haplotypes in distinct countries (Tables S8 and S9). Remarkably, this correlation was observed after but not before December, 2021, when Omicron B.1.1.529 spread over the world and became dominant SARS-CoV-2 strain (Figure 7B). Analysis of population frequency of 496SFRPTYGVGH505 and 504GHQPYRVVVL513-binding HLA class I molecules revealed that HLA-B∗07:02, -B∗08:01, -B∗51:01, -C∗01:02, -C∗06:02, and -C∗07:02 potentially may provide increased resistance of human population to Omicron B.1.1.529 strain (Figure 7C).
Evaluation of population-specific HLA class I haplotypes, which may present Omicron RBD 504GHQPYRVVVL513 peptide, revealed abnormally low protective index (average count of binding alleles) and percentage of positive haplotypes (haplotypes with at least one binding allele) in Republic of Paraguay, South America (Figure 7D). We next analyzed COVID-19 mortality rate and vaccination status in Paraguay and geographically proximal Plurinational State of Bolivia (Figure 7E). According to the World Health Organization, value of deaths caused by COVID-19 was 1.5 times lower in Bolivia than in Paraguay. Herewith, frequency of confirmed SARS-CoV-2 infection cases was significantly higher in Bolivia in comparison with Paraguay, whereas current vaccination status in both countries is similar. We further used World Health Organization weekly reports in order to track COVID-19-confirmed cases and deaths in Bolivia and Paraguay starting from March, 2020 till beginning of 2023. These data indicate almost doubled mortality rate per confirmed COVID-19 cases in Paraguay versus Bolivia (with p value less than 2.2 × 10⁻¹⁶ according to Fisher’s exact test) during the fourth Omicron B.1.1.529-raised COVID-19 pandemic wave (Figure 7F). At the same time, dynamic of vaccination per 100 people in Bolivia and Paraguay was nearly identical. Nonetheless, correlative analysis of frequency of human haplotypes and COVID-19 mortality on country level may still yield false-positive result due to the quarantine restrictions, regional healthcare organizational structure, and data on HLA haplotyping, which may be enriched in closed ethnic communities, being not relevant to total population.
Discussion
Despite numerous studies describing potent SARS-CoV-2 T cell epitopes, absolute majority of these studies operate with T cell assays using overlapping synthetic peptides or in silico prediction algorithms.48,49 As a result, proteasome, which generates majority of HLA-class-I-exposed peptides, is beyond the resulting conclusions. Consequently, putting proteasome-mediated antigen processing out of the brackets may significantly misrepresent interpretation of such datasets (e.g., IEDB). Despite its in vitro activity in form of short peptides, majority of reported epitopes may not physically exist50 (not released or internally cleaved by proteasome during intracellular antigen processing) and thus has no physiological meaning. Another crucial aspect is that current knowledge on SARS-CoV-2 CD8+ T cell epitopes evidently is restricted by most frequent human haplotypes. Here, we aimed to cover this gap by comprehensive analysis of SARS-CoV-2 RBD immunopeptidome of five main SARS-CoV-2 strains released by human proteasomes with constitutive and immune phenotypes. As a result, we report binding index of 305 HLA class I molecules from 18,771 unique haplotypes of 28,104 individuals to 821 physiologically relevant RBD peptides.
Here, we show that immunoproteasomes generate broader peptide repertoire; however, surprisingly, it is less immunogenic in terms of integral HLA class I epitope quantity. Nonetheless, convolution of the relative abundance of N-terminally extended epitopes with identical C-terminus leads to nearly similar release of core CD8+ T cell epitopes by both types of proteasomes, which correlates with study by Cascio et al.51 In case of Omicron RBD, constitutive and immune proteasomes generate less diversity but significantly more quantity of HLA class I epitopes in comparison with other variants. Middle part of RBD is processed more intensively; although, another possibility is that flanking fragments are, contrary, overprocessed and hydrolysis products are less than 6–8 amino acids in length.52 Constitutive and immune proteasomes have distinct cleavage site preferences, and this difference is less manifested in Omicron RBD variant. Also, proteasome-mediated hydrolysis of Omicron RBD variant results in diminished number of peptides with length more than 8 amino acids, which may be caused by decreased stability and increased susceptibility to protease digestion of this variant.53 Similar to flanking regions of all variants, Omicron RBD peptides may be overprocessed by both proteasomes in general. Evaluation of peptidome of mammalian cells expressing RBD variants revealed that intracellularly generated peptides fit well major sites of in vitro proteasome-mediated RBD cleavage. Interestingly, pool of RBD-derived peptides contained RBD392-412, which is not aligned with observed proteasomal sites. Currently, we have no reasonable explanation of this observation. Probably it may be somehow linked with integrin-binding R403GD motif, located in this region.54
Our data suggest that majority of previously reported CD8+ T cell SARS-CoV-2 RBD epitopes are not overlap with proteasome-generated peptides. Complex analysis of observed CD8 T cell epitopes, global HLA class I haplotypes frequency, and relative abundance of the RBD peptides generated by proteasomes revealed two RBD regions, 496–513 and 442–453, which contain the most pronounced CD8+ T cell antigenic determinants. Quantity of three core RBD epitopes 504GHQPYRVVVL513, 496SFRPTYGVGH505, and 442KVSGNYNYLY451, which may be presented by HLA class I molecules encoded by 80%, 30%, and 17% of human haplotypes, respectively, was significantly increased in Omicron hydrolysates in comparison with other RBD variants. Importantly, RBD peptide 506QPYRVVVL513 had the highest magnitude of response in AIM assay among tested CD8+ T cell S-protein-derived antigens.40 Also, our data are in line with recent report suggesting that SARS-CoV-2 S protein RBD484-508 peptide elicits T cell IFN-γ response in cells from naïve-to-infection and unvaccinated subjects with close contact with SARS-CoV-2-positive patients comparable to those observed in cells infected by SARS-CoV-2 pseudovirus.55
Analysis of human haplotypes revealed that molecules encoded by frequently distributed alleles HLA-B∗07:02, -B∗08:01, -B∗51:01, -C∗01:02, -C∗06:02, -C∗07:02, and -C∗12:03 may present RBD496-513-derived epitopes. These data are correlated with observation made by Olafsdottir et al. concluding that S1-reactive CD8+ T cell responses are strongly associated with presence of HLA-C∗07:02 and HLA-B∗07:02 alleles.56 Global analysis of COVID-19 mortality rate in 27 countries and pairwise comparison of Bolivia-Paraguay single case provide statistically significant evidences that haplotypes coding for HLA class I molecules binding 496SFRPTYGVGH505 and 504GHQPYRVVVL513 may be regarded as protective against Omicron SARS-CoV-2. Evolution of SARS-CoV-2 resulted in appearance of BA.2.86 lineage,57 first identified in August 2023, and its more recent and currently circulating descendant, JN.1.58 Although data related to JN.1 are yet limited, SARS-CoV-2 BA.2.86 elicits CD8+ T cell responses similar to other Omicron lineages.59,60,61 Noteworthy, BA.2.86 and JN.1 are massively mutated in RBD region 442–453 but contain same amino acid substitutions in fragment 496-513 except G496S in comparison with Omicron B.1.1.529.58 Thus, at least one major epitope identified in our study is retained in these SARS-CoV-2 variants.
Question, which is still enigmatic, if there is a link between positioning of epitopes in RBD structure and its immunological relevance? The N-terminal part of RBD496-513 contains amino acid residues essential for hACE2 binding47 and key sites for the host adaptation of SARS-CoV-2.62 C-terminal part forms a β-strand required for the maintaining of overall RBD structure (Figure 7A). This structural feature probably restricts mutational drift of this part as all mutations are located in the N-terminal segment. We further suggest that RBD496-513 region probably was maturated in Omicron lineages as major immunodominant epitope under synergetic evolution pressure driven by gaining ability of cross-species transmission63,64 and by beneficial proteasome-mediated processing, resulted in more effective SARS-CoV-2 recognition by human immune system. Another possibility may be permanent virus persisting in chronically infected individuals65 until immune system obtain ability to identify viral peptides in the HLA class I context. Mutations in Omicron RBD496-513 preserve public C-terminal core CD8+ T cell epitope and at the same time allow proteasome to generate increased amount of N-terminally extended pre-epitopes suitable for ERAAP truncation. Consequently, this may contribute to decreased severity and higher frequency of asymptomatic SARS-CoV-2 infection and, as a result, increased rate of human-to-human Omicron SARS-CoV-2 transmission. Concluding, emerge of proteolytic sites in Omicron RBD, beneficial for proteasome cleavage, leading to release of public CD8+ T cell epitopes, might be one of the factors that forced the SARS-CoV-2 to cross back the red line of the pandemic status.
Limitations of the study
ERAAP (ERAP1) cleaves broad spectrum of N-terminal amino acids in epitope precursors, but efficiency of the truncation may significantly differ.66 Additionally, cytosolic aminopeptidases, acting before ERAAP, such as thimet oligopeptidase (TOP) and tripeptidyl peptidase II (TPPII) may contribute to the trimming of the HLA class I peptide ligands.67 Thus, our in silico truncation of epitope precursors may not ideally reflect complexed intracellular pathway of antigen processing. Global correlative population analysis of frequency of human haplotypes and COVID-19 mortality in different countries potentially may yield either false-positive or false-negative result due to the rise of population immunity, different dynamic of vaccination, quarantine restrictions, and regional healthcare organizational structure. Also, data on HLA haplotyping in some countries may be enriched in closed ethnic communities and thus be distort in terms of actual population coverage. Finally, despite frequency of mutations in RBD being the highest, there is possibility that mutations outside this region may be still significant in terms of generation of new T cell epitopes.
Resource availability
Lead contact
Further information and requests for resources should be directed to and will be fulfilled by the lead contact, Alexey Belogurov Jr. (belogurov@ibch.ru).
Materials availability
All plasmids created in the current study are available from the lead contact upon request and completion of a material transfer agreement by the receiving institution. This study did not generate new unique reagents.
Data and code availability
-
•
Data: the mass spectrometry proteomics data have been deposited to the ProteomeXchange Consortium via the PRIDE68 partner repository: PXD050265. Raw data files are located at Mendeley Data: (https://doi.org/10.17632/yc7ht4cgnc.1).
-
•
Code: the code and pipelines used for data analysis are available from the lead contact upon request.
-
•
Cell lines and microbe strains: HEK 293T, HeLa, and HEK 293F cells were cultured as indicated in method details. The XL-1 BLUE strain was obtained from the Evrogen (Russia).
Acknowledgments
This work was supported, in part, by RSF grants 21-74-10154 (to A.A.K.) (mass spectrometry and bioinformatic studies) and 23-74-00053 (to A.A.B. Jr.) (proteasome samples purification). The funders had no role in study design, data collection and interpretation, or the decision to submit the work for publication.
Author contributions
Conceptualization, V.M.G. and A.A.B.Jr.; investigation, A.A.K., I.O.B., G.A.S., A.S.E., and Y.A.M.; resources, A.A.G., V.M.G., and A.A.B.Jr.; visualization, M.T.R. and A.A.B.Jr.; validation, A.A.K. and A.A.B.Jr.; funding acquisition, A.A.K. and A.A.B.Jr.; project administration, A.A.K., I.V.S., D.S.M., and A.A.B.Jr.; supervision, A.A.K., I.V.S., D.S.M., and A.A.B.Jr.; writing—original draft, M.T.R., A.A.B., and A.A.B.Jr.; writing—review & editing, A.A.K., M.T.R., A.A.B., A.A.G., V.M.G., and A.A.B.Jr.
Declaration of interests
The authors declare no competing interests.
STAR★Methods
Key resources table
| REAGENT or RESOURCE | SOURCE | IDENTIFIER |
|---|---|---|
| Antibodies | ||
| a-LMP2 | Abcam | Cat #ab3328; RRID: AB_303707 |
| a-LMP7 | Abcam | Cat #ab3329; RRID: AB_303708 |
| a-LMP10 | Abcam | Cat #ab183506; RRID: AB_2895211 |
| a-PSMB5 | Invitrogen | Cat #PA5-28086; RRID: AB_2545562 |
| a-α1,2,3,5,6&7 subunits | Enzo Life Sciences | Cat #BML-PW8195; RRID: AB_10541045 |
| Goat a-mouse IgG, HRP | Sigma | Cat #A2554; RRID: AB_258008 |
| Goat a-rabbit IgG, HRP | Thermo Fisher Scientific | Cat #31460; RRID: AB_228341 |
| Bacterial and virus strains | ||
| XL-1 BLUE | Evrogen | Cat #CC001 |
| Chemicals, peptides, and recombinant proteins | ||
| DMEM | Gibco | Cat #12491023 |
| FreeStyle™ 293 Expression Medium | Gibco | Cat #12338018 |
| Fetal bovine serum | Gibco | Cat #10099141 |
| Antibiotic-Antimicotic | Gibco | Cat #15240062 |
| Lipofectamine 3000 | Life Technologies | Cat #3000015 |
| Suc-LLVY-AMC | UBPBio | Cat #G1100 |
| Boc-LRR-AMC | UBPBio | Cat #G3100 |
| Z-LLE-AMC | UBPBio | Cat #G2101 |
| Ac-PAL-AMC | UBPBio | Cat #G2110 |
| ProteinSafe Protease Inhibitor Cocktail | TransGen Biotech | Cat #DI111-01 |
| Copure C18A SPE Cartridges | Biocomma | Cat #COC18A1100 |
| Me4BodipyFL-Ahx3Leu3VS (UbiQ-018) | UbiQ | Cat # B01092013-001 |
| Deposited data | ||
| The mass spectrometry proteomics data | ProteomeXchange Consortium via the PRIDE partner repository | https://www.ebi.ac.uk/pride/archive/projects/PXD050265 |
| Experimental models: Cell lines | ||
| HEK 293F | VCCC | N/A |
| HEK 293T | VCCC | N/A |
| HeLa | VCCC | N/A |
| Recombinant DNA | ||
| pSBbi Pur PSMB4-HTBH | generated in this study | N/A |
| pCMV(CAT) T7-SB100 | Addgene | Cat#34879 |
| pFUSE RBD Wuhan Hu-1 AviTag | generated in this study | N/A |
| pFUSE RBD Alpha B.1.1.529 AviTag | generated in this study | N/A |
| pFUSE RBD Gamma P.1 AviTag | generated in this study | N/A |
| pFUSE RBD Delta B.1.617.2 AviTag | generated in this study | N/A |
| pFUSE RBD Omicron B.1.1.529 AviTag | generated in this study | N/A |
| Software and algorithms | ||
| FragPipe 21.0 | Kong et al. (2017)69 | https://fragpipe.nesvilab.org/ |
| MaxQuant 2.3.1.0 | Cox et al. (2011)70 | https://www.maxquant.org/ |
| netMHCpan-4.1 | Reynisson et al. (2021)71 | https://services.healthtech.dtu.dk/services/NetMHCpan-4.1a/ |
| Other | ||
| Streptavidin agarose resin | ThermoFisher scientific | Cat #20353 |
| TEV protease, His | Genscript Biotech | Cat #Z03030 |
Experimental model and study participant details
Mammalian cells constitutively expressing HTBH-Tagged proteasomes
HEK 293T (human embryonic kidney) and HeLa (human, cervical adenocarcinoma) cells were obtained from shared research facility "Vertebrate cell culture collection" of the Institute of Cytology Russian Academy of Sciences. All mammalian cell lines were cultured in DMEM medium (Gibco, Thermo Fisher Scientific, Waltham, MA, USA). The media was supplemented with 10% fetal bovine serum (Gibco, Thermo Fisher Scientific, Waltham, MA, USA) and 1% antibiotic-antimycotic (Gibco, Thermo Fisher Scientific, Waltham, MA, USA). The cell lines were incubated in 37°C humidified incubator with 5% CO2. All cells were routinely tested for Mycoplasma contamination. The Sleeping beauty transposon system was used to generate HEK 293T and HeLa cells that overexpressed human PSMB4 proteasome subunit with HTBH tag. Cells were co-transfected with Sleeping Beauty transposon plasmid pSBi-Pur (PSMB4-HTBH, cDNA) and Sleeping Beauty transposase plasmid pCMV (CAT) T7-SB100 in ratio 10:1 with Lipofectamine 3000 (Thermo Fisher Scientific, Waltham, MA, USA). Three days after transfection, cells were maintained in selection medium (1 μg/mL puromycin in DMEM growth medium) for at least seven days. Sleeping Beauty transposon vector pSBbi-Pur (Addgene plasmid #60523) and the pCMV(CAT)T7-SB100 (Addgene plasmid #34879) containing the cytomegalovirus (CMV) promoter and SB100X transposase were gifts to Addgene from Eric Kowarz72 and Zsuzsanna Izsvak,73 respectively. The sequence encoding the PSMB4 proteasome subunit was amplified from cDNA isolated from HeLa cells via PCR, then overlapped with HTBH tag sequence and subcloned into the pSBbi-Pur vector.
Method details
Plasmids construction
For obtaining recombinant proteins, the cDNA coding for receptor binding domain (RBD) of the ancestorial SARS-CoV-2 strain (amino acids residues 330–528, Wuhan Hu-1) and its lineages Alpha B.1.1.7 (N501Y), Gamma P.1 (K417T, E484K, N501Y), Delta B.1.617.2 (L452R и T478K) and Omicron B.1.1.529 (G339D, S371L, S373P, S375F, K417N, N440K, G446S, S477N, T478K, E484A, Q493R, G496S, Q498R, N501Y, Y505H) in frame with an AviTag (GLNDIFEAQKIEWHE) and a 6xHis tag, were chemically synthesized (Evrogen, Russia) and cloned into the pFUSE vector with IL-2 leader sequence using EcoRI and NheI (Thermo Fisher Scientific, Waltham, MA, USA) restriction endonucleases. For SARS-CoV-2 intracellular peptidome analysis, these plasmids were modified by site-directed mutagenesis by PCR with a pair of complementary primers (fr 5′-GAGGGCCACCATGGCCCCTATCACCAATCTGTGCCCC-3’; 5′-CATGGTGGCCCTCCTTCGCCGGTG-3′) to remove the IL-2 leader sequence, followed by DpnI (Thermo Fisher Scientific, Waltham, MA, USA) digestion.
Recombinant RBD proteins
Recombinant proteins were produced by transient expression of different variants of RBD in HEK 293F cells cultured in FreeStyle Expression Medium (Gibco Thermo Fisher Scientific, Waltham, MA, USA) at 37°C in humidified incubator with 5% CO2. This was followed by purification on HiTrap Chelating column and size exclusion chromatography in PBS buffer on Superdex 75 10/300 GL according to the manufacturer’s protocols.
Isolation of peptides from the crude extract
The HEK 293T cells (1 × 10⁷) transfected with cDNA coding for Wuhan Hu-1 and Omicron B.1.1.529 RBDs after 24 h were first washed two times with PBS supplemented with 1 mM PMSF directly on T-75 culture flask. Then cells were scrapped, collected into 1.5 mL centrifuge tube and centrifugated at 250 g for 10 min 4°C. The pellet was resuspended with 300 μL deionized water with ProteinSafe Protease Inhibitor Cocktail (TransGen Biotech, China) and heated for 20 min at 80°C to inactivate proteases. After cooling down the samples on ice, HCl was added to the final concentration of 10 mM. Then samples were treated with ultrasonic treatment (15 s with 30 s intervals for cooling during 3 min; 40% power (JY92-IIN Vilitek, China)). After that, homogenate was centrifuged at 20,000 g for 1 h at 4°C. The supernatants were collected, desalted and concentrated with C18 solid phase extraction (Copure C18A SPE Cartridges, 100 mg/mL, Biocomma). At last, the obtained samples were dried in a vacuum centrifuge and stored at −80°C. The diverse peptides abundance from different samples were analyzed by LC-MS/MS.
Purification of HTBH-tagged 20S proteasomes
Stable HeLa or HEK 293T cell lines expressing HTBH-tagged proteasomes37 were cultured until they reached 90% confluence, and then were washed with PBS buffer. The cell pellets were lysed using a buffer containing 30 mM Tris-HCl (pH 7.5), 5 mM MgCl2, 0.5% NP-40, 1 mM DTT, 1 mM PMSF. The lysates were centrifuged at 20,000 g for 15 min to remove cellular debris, and the resulting supernatant was incubated with Streptavidin-agarose resin (Thermo Fisher Scientific, Waltham, MA, USA) overnight at 4°C with constant rotation. To purify the 20S proteasomes, the streptavidin beads were washed twice with 10 volumes of the following buffer: 30 mM Tris-HCl (pH 7.5), 5 mM MgCl2, 1 mM TCEP, and 750 mM NaCl. Subsequently, they were washed another two times with same buffer without 750 mM NaCl. The beads were then resuspended in the required volume of wash buffer containing TEV protease (Genscript Biotech, Piscataway, NJ, USA), and were incubated at 30°C for 2 h. Eluted proteasomes were additionally purified by size-exclusion chromatography on Superose 6 (Cytiva, Marlborough, MA, USA) column in 20 mM Tris (pH 7.5), 5 mM MgCl2, and 1 mM DTT.
In-gel fluorescence with Me4BodipyFL-Ahx3Leu3VS fluorescent proteasome probe
Equal amounts of 20S proteasomes were incubated with Me4BodipyFL-Ahx3Leu3VS (UbiQ, Netherlands) for 30 min at 37°C in buffer containing 30 mM Tris-HCl pH 7.5, 1 mM TCEP. This was followed by adding sample buffer containing β-mercaptoethanol. Samples were analyzed using 15% sodium dodecyl sulfate polyacrylamide gel electrophoresis (SDS-PAGE). Wet gel slabs were imaged using the ChemiDoc imaging system (Bio-Rad, Hercules, CA, USA) with appropriate filter settings (λ(ex/em) = 480/530 nm). Protein loading was verified by staining gels with a Coomassie blue stain.
Western blotting
Equal amounts of protein were mixed with 2x sample buffer containing β-mercaptoethanol and heated at 95°C for 10 min. Proteins were separated by 15% SDS-PAGE and transferred to nitrocellulose membrane (Bio-Rad, Hercules, CA, USA), the membrane was then blocked with PBS-T containing 5% milk. All membranes were probed overnight with indicated primary antibodies in PBS-T with 0.5% milk at 4°C (a-LMP2 (ab3328, abcam, UK), a-LMP7 (ab3329, Abcam, UK), a-LMP10 (ab183506, Abcam, UK), a-alpha subunits (BML-PW8195, Enzo Life Sciences, Inc, USA), a-PSMB5 (PA5-28086, Invitrogen, USA)), followed by 1 h incubation with secondary antibodies in PBS-T with 0.5% milk (Goat Anti-Mouse IgG (Fc specific)–HRP (A2554, Sigma, USA), Goat Anti-Rabbit IgG-HRP (31460, Thermo Fisher Scientific, USA)). Bands were detected with ECL reagent (Bio-Rad, Hercules, CA, USA) using ChemiDoc imaging system (Bio-Rad, Hercules, CA, USA) and serial time exposure with signal saturation avoidance.
Analysis of peptidase activity of proteasomes
The peptidase activity of the proteasomes was assessed using a microplate reader (CLARIOstar plus, BMG Labtech, Ortenberg, Germany) at 37°C. A volume of 25 μL, consisting 0.125 μg of proteasome and 20 μM of either the fluorogenic substrates Suc-LLVY-AMC (UBPBio, USA), Boc-LRR-AMC (UBPBio, USA), Z-LLE-AMC (UBPBio, USA) or Ac-PAL-AMC (UBPBio, USA) was used for the assay. The excitation wavelength was set at 380 nm, and the emission wavelength was set at 440 nm. The buffer used for measuring proteasome activity contained 30 mM Tris-HCl (pH 7.5), 5 mM MgCl2 and 1 mM TCEP.
RBD hydrolysis by purified proteasomes
The hydrolysis of RBD variants (1.5 μg) by 20S proteasomes (1 μg) was carried out in a 20 μL volume of buffer contained 20 mM Tris (pH 7.5), 5 mM MgCl2, and 1 mM DTT. The mixtures were incubated overnight at 37°C. Control RBD samples were incubated in same conditions without proteasomes.
LC-MS/MS analysis
Totally we analyzed 50 samples, 10 samples per RBD: each RBD variant with either c20S or i20S (4 replicates, 8 samples totally) and control RBD samples (2 replicates). 1 μL of each sample was diluted with 10 μL of loading solution (5% v/v acetonitrile, 0.1% trifluoracetic acid) and 5 μL were injected. Injection was performed in trap-elute manner on trap column cartridge (PepMap Neo C18 5 μM 300 μM × 5 mm, Thermo Scientific, USA) with 10 μL/min flow rate of loading solution. Peptides were separated on capillary column (Peaky, Reprosil Pur C18 AQ 1.9 μM, 75 μm × 30 cm, Molecta, Russia). Elution was performed with mobile phase gradient from 5% of solution B (80% acetonitrile, 0.1% formic acid) in solution A (0.1% formic acid) at flow rate of 250 nL/min to 50% of solvent B in 10 min. Detection was performed in data-dependent acquisition mode on high-resolution quadrupole-orbitrap tandem mass-spectrometer Exploris 480 (Thermo Scientific, USA). Electrospray ionization voltage was set at 2,200 V. Precursor scan was performed for ions wit m/z from 350 to 1400 at resolution 60 000 (at 200 m/z). Up to 30 precursors with charge from 2 to 6 were subjected to fragment ion scan (resolution 15 000 at 200 m/z) with normalized collision energy set to 30%.
Quantification and statistical analysis
LC-MS data processing
Peptide identification was performed with FragPipe software. Search was performed against a database containing sequences of RBD variants, proteasome proteins and common contaminants. Non-specific cleavage was used, peptides with mass from 500 to 12000 kDa and length from 7 to 65 residues were considered. Mass tolerance was set to 20 ppm with further optimization. Oxidation of methionines, deamidation of asparagine and glutamine, N-terminal pyro-glutamine, N-term acetylation and serine, threonine and tyrosine phosphorylation formation were used as variable modifications. FDR levels were set to 1%, validation was performed with PeptideProphet and ProteinPropher. Label-free quantification was performed with MaxQuant software against a database of peptides identified with FragPipe with no cleavage at all with the same set of variable modifications. FDR was set at 1% for PSM and Protein levels. Label-free quantification and matching between runs were enabled. The mass spectrometry proteomics data are deposited to the ProteomeXchange Consortium via the PRIDE68 partner repository with the dataset identifier PXD050265.
Bioinformatic processing
Identified peptides were filtered by mapping on corresponded RBD sequence (Wuhan-Hu-1 [www.ncbi.nlm.nih.gov/protein/1791269090], Alpha B.1.1.7, Delta B.1.617.2, Gamma B.1.1.28 (P.1), and Omicron B.1.1.529 (BA.1) [www.ecdc.europa.eu/en/covid-19/variants-concern]). Peptides, which overlapped with C-terminal AviTag-His, N-terminal non-RBD leader sequence or observed in samples without proteasomes were withdrawn. Resulted dataset contained 821 peptides (Table S1). Normalization for each peptide was performed by dividing the values of its ion current by the total ion current (TIC) value across all observed RBD peptides. Final relative abundance of each peptide in RBD hydrolyzates represents average value from four independent replicates. Peptides ranging from 8 to 16 amino acids were recruited in analysis of human leukocyte antigen class I (HLA class I) binding. Specifically, we utilized the netMHCpan-4.1 algorithm71 for 305 HLA class I alleles (Table S2) covering 98% of the requited population (28,104 individuals with 4-digit HLA class I code or higher) as documented in the Allele Frequency Net Database [www.allelefrequencies.net/BrowseGenotype.aspx]. The database initially contains 82,130 samples, of which 28,104 samples were used with HLA class I data in a 4-digit code or higher for the alleles A, B, and C. Any alleles represented by a 6-digit code or higher were convoluted to a 4-digit code. Peptides with a length of 8 amino acids were directly inputted into the algorithm, while peptides with a length more than 8 amino acids were truncated to the length of 8, 9 and 10. For HLA class I alleles that occurred multiple times, the one with the lowest EL rank was selected. Only HLA variants with threshold lower or equal 0.5 were considered. For 237 peptides positive for HLA class I binding the average level of protection and percentage of individuals with at least one positive HLA class I allele (1–6) in each country were calculated (Table S3). The CD8+ T cell epitopes sequences within RBD were extracted from IEDB database (Table S5). The N-terminally extended proteasome-generated peptides were attributed the core CD8+ T cell epitopes (Table S6) and further manually supplemented with data regarding positive CD8+ T cell assays (Table S7). Number of COVID-19 cases and related deaths were calculated from the file https://covid19.who.int/WHO-COVID-19-global-data.csv dated 20.12.2023 (Table S9). Spearman correlation was calculated for each peptide between confirmed COVID-19-caused deaths and registered COVID-19 cases before or after December, 2021 (Table S7). Analysis and figures were accomplished using a custom bash and R scripts available on request.
Statistical analysis
Difference in proteasomes’ in vitro activities were analyzed by Student’s t-test. Violin plots of HLA class I proteasome-generated peptide binders according to its relative abundance and relative abundance normalized to HLA class I EL rank were processed by Dunn’s test with Bonferroni correction employed after the Kruskal-Wallis test. Correlation between COVID-19 mortality and percentage of haplotypes and population frequency of haplotypes positive toward public Omicron SARS-CoV-2 RBD epitopes in different countries were analyzed by Spearman’s rank correlation.
Published: January 23, 2025
Footnotes
Supplemental information can be found online at https://doi.org/10.1016/j.isci.2025.111873.
Supplemental information
References
- 1.Rydyznski Moderbacher C., Ramirez S.I., Dan J.M., Grifoni A., Hastie K.M., Weiskopf D., Belanger S., Abbott R.K., Kim C., Choi J., et al. Antigen-Specific Adaptive Immunity to SARS-CoV-2 in Acute COVID-19 and Associations with Age and Disease Severity. Cell. 2020;183:996–1012.e19. doi: 10.1016/j.cell.2020.09.038. [DOI] [PMC free article] [PubMed] [Google Scholar]
- 2.Tan A.T., Linster M., Tan C.W., Le Bert N., Chia W.N., Kunasegaran K., Zhuang Y., Tham C.Y.L., Chia A., Smith G.J.D., et al. Early induction of functional SARS-CoV-2-specific T cells associates with rapid viral clearance and mild disease in COVID-19 patients. Cell Rep. 2021;34 doi: 10.1016/j.celrep.2021.108728. [DOI] [PMC free article] [PubMed] [Google Scholar]
- 3.Grifoni A., Sidney J., Vita R., Peters B., Crotty S., Weiskopf D., Sette A. SARS-CoV-2 human T cell epitopes: Adaptive immune response against COVID-19. Cell Host Microbe. 2021;29:1076–1092. doi: 10.1016/j.chom.2021.05.010. [DOI] [PMC free article] [PubMed] [Google Scholar]
- 4.Quadeer A.A., Ahmed S.F., McKay M.R. Landscape of epitopes targeted by T cells in 852 individuals recovered from COVID-19: Meta-analysis, immunoprevalence, and web platform. Cell Rep. Med. 2021;2 doi: 10.1016/j.xcrm.2021.100312. [DOI] [PMC free article] [PubMed] [Google Scholar]
- 5.Zhang L., Kempf A., Nehlmeier I., Cossmann A., Richter A., Bdeir N., Graichen L., Moldenhauer A.-S., Dopfer-Jablonka A., Stankov M.V., et al. SARS-CoV-2 BA.2.86 enters lung cells and evades neutralizing antibodies with high efficiency. Cell. 2024;187:596–608.e17. doi: 10.1016/j.cell.2023.12.025. [DOI] [PMC free article] [PubMed] [Google Scholar]
- 6.Cao Y., Wang J., Jian F., Xiao T., Song W., Yisimayi A., Huang W., Li Q., Wang P., An R., et al. Omicron escapes the majority of existing SARS-CoV-2 neutralizing antibodies. Nature. 2021;602:657–663. doi: 10.1038/d41586-021-03796-6. [DOI] [PMC free article] [PubMed] [Google Scholar]
- 7.Liu C., Ginn H.M., Dejnirattisai W., Supasa P., Wang B., Tuekprakhon A., Nutalai R., Zhou D., Mentzer A.J., Zhao Y., et al. Reduced neutralization of SARS-CoV-2 B.1.617 by vaccine and convalescent serum. Cell. 2021;184:4220–4236.e13. doi: 10.1016/j.cell.2021.06.020. [DOI] [PMC free article] [PubMed] [Google Scholar]
- 8.Wibmer C.K., Ayres F., Hermanus T., Madzivhandila M., Kgagudi P., Oosthuysen B., Lambson B.E., de Oliveira T., Vermeulen M., van der Berg K., et al. SARS-CoV-2 501Y.V2 escapes neutralization by South African COVID-19 donor plasma. Nat. Med. 2021;27:622–625. doi: 10.1038/s41591-021-01285-x. [DOI] [PubMed] [Google Scholar]
- 9.Garcia-Valtanen P., Hope C.M., Masavuli M.G., Yeow A.E.L., Balachandran H., Mekonnen Z.A., Al-Delfi Z., Abayasingam A., Agapiou D., Stella A.O., et al. SARS-CoV-2 Omicron variant escapes neutralizing antibodies and T cell responses more efficiently than other variants in mild COVID-19 convalescents. Cell Rep. Med. 2022;3 doi: 10.1016/j.xcrm.2022.100651. [DOI] [PMC free article] [PubMed] [Google Scholar]
- 10.Gattinger P., Tulaeva I., Borochova K., Kratzer B., Trapin D., Kropfmüller A., Pickl W.F., Valenta R. Omicron: A SARS-CoV-2 variant of real concern. Allergy. 2022;77:1616–1620. doi: 10.1111/all.15264. [DOI] [PMC free article] [PubMed] [Google Scholar]
- 11.GeurtsvanKessel C.H., Geers D., Schmitz K.S., Mykytyn A.Z., Lamers M.M., Bogers S., Scherbeijn S., Gommers L., Sablerolles R.S.G., Nieuwkoop N.N., et al. Divergent SARS-CoV-2 Omicron-reactive T and B cell responses in COVID-19 vaccine recipients. Sci. Immunol. 2022;7 doi: 10.1126/sciimmunol.abo2202. [DOI] [PMC free article] [PubMed] [Google Scholar]
- 12.Keeton R., Tincho M.B., Ngomti A., Baguma R., Benede N., Suzuki A., Khan K., Cele S., Bernstein M., Karim F., et al. T cell responses to SARS-CoV-2 spike cross-recognize Omicron. Nature. 2022;603:488–492. doi: 10.1038/s41586-022-04460-3. [DOI] [PMC free article] [PubMed] [Google Scholar]
- 13.Naranbhai V., Nathan A., Kaseke C., Berrios C., Khatri A., Choi S., Getz M.A., Tano-Menka R., Ofoman O., Gayton A., et al. T cell reactivity to the SARS-CoV-2 Omicron variant is preserved in most but not all individuals. Cell. 2022;185:1041–1051.e6. doi: 10.1016/j.cell.2022.01.029. [DOI] [PMC free article] [PubMed] [Google Scholar]
- 14.Muik A., Lui B.G., Quandt J., Diao H., Fu Y., Bacher M., Gordon J., Toker A., Grosser J., Ozhelvaci O., et al. Progressive loss of conserved spike protein neutralizing antibody sites in Omicron sublineages is balanced by preserved T cell immunity. Cell Rep. 2023;42 doi: 10.1016/j.celrep.2023.112888. [DOI] [PubMed] [Google Scholar]
- 15.Hui K.P.Y., Ho J.C.W., Cheung M.C., Ng K.C., Ching R.H.H., Lai K.L., Kam T.T., Gu H., Sit K.Y., Hsin M.K.Y., et al. SARS-CoV-2 Omicron variant replication in human bronchus and lung ex vivo. Nature. 2022;603:715–720. doi: 10.1038/s41586-022-04479-6. [DOI] [PubMed] [Google Scholar]
- 16.Chen D.Y., Chin C.V., Kenney D., Tavares A.H., Khan N., Conway H.L., Liu G., Choudhary M.C., Gertje H.P., O’Connell A.K., et al. Spike and nsp6 are key determinants of SARS-CoV-2 Omicron BA.1 attenuation. Nature. 2023;615:143–150. doi: 10.1038/s41586-023-05697-2. [DOI] [PubMed] [Google Scholar]
- 17.Meng B., Datir R., Choi J., CITIID-NIHR Bioresource COVID-19 Collaboration, Bradley J.R., Smith K.G.C., Lee J.H., Gupta R.K., Lyons P.A., Matheson N.J., et al. SARS-CoV-2 spike N-terminal domain modulates TMPRSS2-dependent viral entry and fusogenicity. Cell Rep. 2022;40 doi: 10.1016/j.celrep.2022.111220. [DOI] [PMC free article] [PubMed] [Google Scholar]
- 18.Meng B., Abdullahi A., Ferreira I.A.T.M., Goonawardane N., Saito A., Kimura I., Yamasoba D., Gerber P.P., Fatihi S., Rathore S., et al. Altered TMPRSS2 usage by SARS-CoV-2 Omicron impacts infectivity and fusogenicity. Nature. 2022;603:706–714. doi: 10.1038/s41586-022-04474-x. [DOI] [PMC free article] [PubMed] [Google Scholar]
- 19.Bojkova D., Widera M., Ciesek S., Wass M.N., Michaelis M., Cinatl J. Reduced interferon antagonism but similar drug sensitivity in Omicron variant compared to Delta variant of SARS-CoV-2 isolates. Cell Res. 2022;32:319–321. doi: 10.1038/s41422-022-00619-9. [DOI] [PMC free article] [PubMed] [Google Scholar]
- 20.Novelli A., Andreani M., Biancolella M., Liberatoscioli L., Passarelli C., Colona V.L., Rogliani P., Leonardis F., Campana A., Carsetti R., et al. HLA allele frequencies and susceptibility to COVID-19 in a group of 99 Italian patients. HLA. 2020;96:610–614. doi: 10.1111/tan.14047. [DOI] [PMC free article] [PubMed] [Google Scholar]
- 21.Shkurnikov M., Nersisyan S., Jankevic T., Galatenko A., Gordeev I., Vechorko V., Tonevitsky A. Association of HLA Class I Genotypes With Severity of Coronavirus Disease-19. Front. Immunol. 2021;12 doi: 10.3389/fimmu.2021.641900. [DOI] [PMC free article] [PubMed] [Google Scholar]
- 22.Littera R., Campagna M., Deidda S., Angioni G., Cipri S., Melis M., Firinu D., Santus S., Lai A., Porcella R., et al. Human Leukocyte Antigen Complex and Other Immunogenetic and Clinical Factors Influence Susceptibility or Protection to SARS-CoV-2 Infection and Severity of the Disease Course. The Sardinian Experience. Front. Immunol. 2020;11 doi: 10.3389/fimmu.2020.605688. [DOI] [PMC free article] [PubMed] [Google Scholar]
- 23.Sakuraba A., Haider H., Sato T. Population Difference in Allele Frequency of HLA-C∗05 and Its Correlation with COVID-19 Mortality. Viruses. 2020;12 doi: 10.3390/v12111333. [DOI] [PMC free article] [PubMed] [Google Scholar]
- 24.Pisanti S., Deelen J., Gallina A.M., Caputo M., Citro M., Abate M., Sacchi N., Vecchione C., Martinelli R. Correlation of the two most frequent HLA haplotypes in the Italian population to the differential regional incidence of Covid-19. J. Transl. Med. 2020;18 doi: 10.1186/s12967-020-02515-5. [DOI] [PMC free article] [PubMed] [Google Scholar]
- 25.Augusto D.G., Murdolo L.D., Chatzileontiadou D.S.M., Sabatino J.J., Yusufali T., Peyser N.D., Butcher X., Kizer K., Guthrie K., Murray V.W., et al. A common allele of HLA is associated with asymptomatic SARS-CoV-2 infection. Nature. 2023;620:128–136. doi: 10.1038/s41586-023-06331-x. [DOI] [PMC free article] [PubMed] [Google Scholar]
- 26.Serwold T., Gonzalez F., Kim J., Jacob R., Shastri N. ERAAP customizes peptides for MHC class I molecules in the endoplasmic reticulum. Nature. 2002;419:480–483. doi: 10.1038/nature01074. [DOI] [PubMed] [Google Scholar]
- 27.Kanaseki T., Blanchard N., Hammer G.E., Gonzalez F., Shastri N. ERAAP Synergizes with MHC Class I Molecules to Make the Final Cut in the Antigenic Peptide Precursors in the Endoplasmic Reticulum. Immunity. 2006;25:795–806. doi: 10.1016/j.immuni.2006.09.012. [DOI] [PMC free article] [PubMed] [Google Scholar]
- 28.Chang S.C., Momburg F., Bhutani N., Goldberg A.L. The ER aminopeptidase, ERAP1, trims precursors to lengths of MHC class I peptides by a “molecular ruler” mechanism. Proc. Natl. Acad. Sci. USA. 2005;102:17107–17112. doi: 10.1073/pnas.0500721102. [DOI] [PMC free article] [PubMed] [Google Scholar]
- 29.Fabre B., Lambour T., Garrigues L., Ducoux-Petit M., Amalric F., Monsarrat B., Burlet-Schiltz O., Bousquet-Dubouch M.P. Label-free quantitative proteomics reveals the dynamics of proteasome complexes composition and stoichiometry in a wide range of human cell lines. J. Proteome Res. 2014;13:3027–3037. doi: 10.1021/pr500193k. [DOI] [PubMed] [Google Scholar]
- 30.Baugh J.M., Viktorova E.G., Pilipenko E.V. Proteasomes Can Degrade a Significant Proportion of Cellular Proteins Independent of Ubiquitination. J. Mol. Biol. 2009;386:814–827. doi: 10.1016/j.jmb.2008.12.081. [DOI] [PMC free article] [PubMed] [Google Scholar]
- 31.Mamrosh J.L., Sherman D.J., Cohen J.R., Johnston J.A., Joubert M.K., Li J., Lipford J.R., Lomenick B., Moradian A., Prabhu S., et al. Quantitative measurement of the requirement of diverse protein degradation pathways in MHC class I peptide presentation. Sci. Adv. 2023;9 doi: 10.1126/sciadv.ade7890. [DOI] [PMC free article] [PubMed] [Google Scholar]
- 32.Sahu I., Mali S.M., Sulkshane P., Xu C., Rozenberg A., Morag R., Sahoo M.P., Singh S.K., Ding Z., Wang Y., et al. The 20S as a stand-alone proteasome in cells can degrade the ubiquitin tag. Nat. Commun. 2021;12 doi: 10.1038/s41467-021-26427-0. [DOI] [PMC free article] [PubMed] [Google Scholar]
- 33.Shringarpure R., Grune T., Davies K.J.A. Protein oxidation and 20S proteasome-dependent proteolysis in mammalian cells. Cell. Mol. Life Sci. 2001;58:1442–1450. doi: 10.1007/PL00000787. [DOI] [PMC free article] [PubMed] [Google Scholar]
- 34.Livnat-Levanon N., Kevei É., Kleifeld O., Krutauz D., Segref A., Rinaldi T., Erpapazoglou Z., Cohen M., Reis N., Hoppe T., Glickman M.H. Reversible 26S proteasome disassembly upon mitochondrial stress. Cell Rep. 2014;7:1371–1380. doi: 10.1016/j.celrep.2014.04.030. [DOI] [PubMed] [Google Scholar]
- 35.Stukalov A., Girault V., Grass V., Karayel O., Bergant V., Urban C., Haas D.A., Huang Y., Oubraham L., Wang A., et al. Multilevel proteomics reveals host perturbations by SARS-CoV-2 and SARS-CoV. Nature. 2021;594:246–252. doi: 10.1038/s41586-021-03493-4. [DOI] [PubMed] [Google Scholar]
- 36.Xu G., Wu Y., Xiao T., Qi F., Fan L., Zhang S., Zhou J., He Y., Gao X., Zeng H., et al. Multiomics approach reveals the ubiquitination-specific processes hijacked by SARS-CoV-2. Signal Transduct. Target. Ther. 2022;7 doi: 10.1038/s41392-022-01156-y. [DOI] [PMC free article] [PubMed] [Google Scholar]
- 37.Saratov G.A., Vladimirov V.I., Novoselov A.L., Ziganshin R.H., Chen G., Baymukhametov T.N., Konevega A.L., Belogurov A.A., Kudriaeva A.A. Myelin Basic Protein Fragmentation by Engineered Human Proteasomes with Different Catalytic Phenotypes Revealed Direct Peptide Ligands of MS-Associated and Protective HLA Class I Molecules. Int. J. Mol. Sci. 2023;24 doi: 10.3390/ijms24032091. [DOI] [PMC free article] [PubMed] [Google Scholar]
- 38.Berkers C.R., Van Leeuwen F.W.B., Groothuis T.A., Peperzak V., Van Tilburg E.W., Borst J., Neefjes J.J., Ovaa H. Profiling proteasome activity in tissue with fluorescent probes. Mol. Pharm. 2007;4:739–748. doi: 10.1021/mp0700256. [DOI] [PubMed] [Google Scholar]
- 39.Sahin U., Muik A., Vogler I., Derhovanessian E., Kranz L.M., Vormehr M., Quandt J., Bidmon N., Ulges A., Baum A., et al. BNT162b2 vaccine induces neutralizing antibodies and poly-specific T cells in humans. Nature. 2021;595:572–577. doi: 10.1038/s41586-021-03653-6. [DOI] [PubMed] [Google Scholar]
- 40.Tarke A., Sidney J., Kidd C.K., Dan J.M., Ramirez S.I., Yu E.D., Mateus J., da Silva Antunes R., Moore E., Rubiro P., et al. Comprehensive analysis of T cell immunodominance and immunoprevalence of SARS-CoV-2 epitopes in COVID-19 cases. Cell Rep. Med. 2021;2 doi: 10.1016/j.xcrm.2021.100204. [DOI] [PMC free article] [PubMed] [Google Scholar]
- 41.Saini S.K., Hersby D.S., Tamhane T., Povlsen H.R., Amaya Hernandez S.P., Nielsen M., Gang A.O., Hadrup S.R. SARS-CoV-2 genome-wide T cell epitope mapping reveals immunodominance and substantial CD8+ T cell activation in COVID-19 patients. Sci. Immunol. 2021;6 doi: 10.1126/sciimmunol.abf7550. [DOI] [PMC free article] [PubMed] [Google Scholar]
- 42.Ferretti A.P., Kula T., Wang Y., Nguyen D.M.V., Weinheimer A., Dunlap G.S., Xu Q., Nabilsi N., Perullo C.R., Cristofaro A.W., et al. Unbiased Screens Show CD8+ T Cells of COVID-19 Patients Recognize Shared Epitopes in SARS-CoV-2 that Largely Reside outside the Spike Protein. Immunity. 2020;53:1095–1107.e3. doi: 10.1016/j.immuni.2020.10.006. [DOI] [PMC free article] [PubMed] [Google Scholar]
- 43.Poran A., Harjanto D., Malloy M., Arieta C.M., Rothenberg D.A., Lenkala D., Van Buuren M.M., Addona T.A., Rooney M.S., Srinivasan L., Gaynor R.B. Sequence-based prediction of SARS-CoV-2 vaccine targets using a mass spectrometry-based bioinformatics predictor identifies immunogenic T cell epitopes. Genome Med. 2020;12 doi: 10.1186/s13073-020-00767-w. [DOI] [PMC free article] [PubMed] [Google Scholar]
- 44.Kared H., Redd A.D., Bloch E.M., Bonny T.S., Sumatoh H., Kairi F., Carbajo D., Abel B., Newell E.W., Bettinotti M.P., et al. SARS-CoV-2-specific CD8+ T cell responses in convalescent COVID-19 individuals. J. Clin. Invest. 2021;131 doi: 10.1172/JCI145476. [DOI] [PMC free article] [PubMed] [Google Scholar]
- 45.Snyder T.M., Gittelman R.M., Klinger M., May D.H., Osborne E.J., Taniguchi R., Zahid H.J., Kaplan I.M., Dines J.N., Noakes M.T., et al. Magnitude and Dynamics of the T-Cell Response to SARS-CoV-2 Infection at Both Individual and Population Levels. medRxiv. 2020 doi: 10.1101/2020.07.31.20165647. Preprint at: [DOI] [PMC free article] [PubMed] [Google Scholar]
- 46.Shomuradova A.S., Vagida M.S., Sheetikov S.A., Zornikova K.V., Kiryukhin D., Titov A., Peshkova I.O., Khmelevskaya A., Dianov D.V., Malasheva M., et al. SARS-CoV-2 Epitopes Are Recognized by a Public and Diverse Repertoire of Human T Cell Receptors. Immunity. 2020;53:1245–1257.e5. doi: 10.1016/j.immuni.2020.11.004. [DOI] [PMC free article] [PubMed] [Google Scholar]
- 47.Han P., Li L., Liu S., Wang Q., Zhang D., Xu Z., Han P., Li X., Peng Q., Su C., et al. Receptor binding and complex structures of human ACE2 to spike RBD from omicron and delta SARS-CoV-2. Cell. 2022;185:630–640.e10. doi: 10.1016/j.cell.2022.01.001. [DOI] [PMC free article] [PubMed] [Google Scholar]
- 48.O’Donnell T.J., Rubinsteyn A., Laserson U. MHCflurry 2.0: Improved Pan-Allele Prediction of MHC Class I-Presented Peptides by Incorporating Antigen Processing. Cell Syst. 2020;11:42–48.e7. doi: 10.1016/j.cels.2020.06.010. [DOI] [PubMed] [Google Scholar]
- 49.Lawrence P.J., Ning X. Improving MHC class I antigen-processing predictions using representation learning and cleavage site-specific kernels. Cell Rep. Methods. 2022;2 doi: 10.1016/j.crmeth.2022.100293. [DOI] [PMC free article] [PubMed] [Google Scholar]
- 50.Wellington D., Yin Z., Yu Z., Heilig R., Davis S., Fischer R., Felce S.L., Antoun E., Hublitz P., Beveridge R., et al. SARS-CoV-2 mutations affect antigen processing by the proteasome to alter CD8+ T cell responses. Heliyon. 2023;9 doi: 10.1016/j.heliyon.2023.e20076. [DOI] [PMC free article] [PubMed] [Google Scholar]
- 51.Cascio P., Hilton C., Kisselev A.F., Rock K.L., Goldberg A.L. 26S proteasomes and immunoproteasomes produce mainly N-extended versions of an antigenic peptide. EMBO J. 2001;20:2357–2366. doi: 10.1093/emboj/20.10.2357. [DOI] [PMC free article] [PubMed] [Google Scholar]
- 52.Köhler A., Cascio P., Leggett D.S., Woo K.M., Goldberg A.L., Finley D. The axial channel of the proteasome core particle is gated by the Rpt2 ATPase and controls both substrate entry and product release. Mol Cell. 2001;7:1143–1152. doi: 10.1016/S1097-2765(01)00274-X. [DOI] [PubMed] [Google Scholar]
- 53.Lin S., Chen Z., Zhang X., Wen A., Yuan X., Yu C., Yang J., He B., Cao Y., Lu G. Characterization of SARS-CoV-2 Omicron spike RBD reveals significantly decreased stability, severe evasion of neutralizing-antibody recognition but unaffected engagement by decoy ACE2 modified for enhanced RBD binding. Signal Transduct. Target Ther. 2022;7:56. doi: 10.1038/s41392-022-00914-2. [DOI] [PMC free article] [PubMed] [Google Scholar]
- 54.Liu J., Lu F., Chen Y., Plow E., Qin J. Integrin mediates cell entry of the SARS-CoV-2 virus independent of cellular receptor ACE2. J. Biol. Chem. 2022;298 doi: 10.1016/j.jbc.2022.101710. [DOI] [PMC free article] [PubMed] [Google Scholar]
- 55.Murdocca M., Citro G., Centanini E., Giannini R., Latini A., Centofanti F., Piano Mortari E., Cocciadiferro D., Novelli A., Bernardini S., et al. COVID-19: S-Peptide RBD 484–508 Induces IFN-γ T-Cell Response in Naïve-to-Infection and Unvaccinated Subjects with Close Contact with SARS-CoV-2-Positive Patients. Viruses. 2023;15 doi: 10.3390/v15071417. [DOI] [PMC free article] [PubMed] [Google Scholar]
- 56.Olafsdottir T.A., Bjarnadottir K., Norddahl G.L., Halldorsson G.H., Melsted P., Gunnarsdottir K., Ivarsdottir E., Olafsdottir T., Arnthorsson A.O., Theodors F., et al. HLA alleles, disease severity, and age associate with T-cell responses following infection with SARS-CoV-2. Commun. Biol. 2022;5 doi: 10.1038/s42003-022-03893-w. [DOI] [PMC free article] [PubMed] [Google Scholar]
- 57.Tamura T., Mizuma K., Nasser H., Deguchi S., Padilla-Blanco M., Oda Y., Uriu K., Tolentino J.E.M., Tsujino S., Suzuki R., et al. Virological characteristics of the SARS-CoV-2 BA.2.86 variant. Cell Host Microbe. 2024;32:170–180.e12. doi: 10.1016/j.chom.2024.01.001. [DOI] [PubMed] [Google Scholar]
- 58.Kaku Y., Okumura K., Padilla-Blanco M., Kosugi Y., Uriu K., Hinay A.A., Chen L., Plianchaisuk A., Kobiyama K., Ishii K.J., et al. Virological characteristics of the SARS-CoV-2 JN.1 variant. Lancet Infect. Dis. 2024;24:e82. doi: 10.1016/S1473-3099(23)00813-7. [DOI] [PubMed] [Google Scholar]
- 59.Nesamari R., Omondi M.A., Baguma R., Höft M.A., Ngomti A., Nkayi A.A., Besethi A.S., Magugu S.F.J., Mosala P., Walters A., et al. Post-pandemic memory T cell response to SARS-CoV-2 is durable, broadly targeted, and cross-reactive to the hypermutated BA.2.86 variant. Cell Host Microbe. 2024;32:162–169.e3. doi: 10.1016/j.chom.2023.12.003. [DOI] [PMC free article] [PubMed] [Google Scholar]
- 60.Sette A., Sidney J., Grifoni A. Pre-existing SARS-2-specific T cells are predicted to cross-recognize BA.2.86. Cell Host Microbe. 2024;32:19–24.e2. doi: 10.1016/j.chom.2023.11.010. [DOI] [PMC free article] [PubMed] [Google Scholar]
- 61.Müller T.R., Gao Y., Wu J., Ribeiro O., Chen P., Bergman P., Blennow O., Hansson L., Mielke S., Nowak P., et al. Memory T cells effectively recognize the SARS-CoV-2 hypermutated BA.2.86 variant. Cell Host Microbe. 2024;32:156–161.e3. doi: 10.1016/j.chom.2023.12.010. [DOI] [PubMed] [Google Scholar]
- 62.Huang K., Zhang Y., Hui X., Zhao Y., Gong W., Wang T., Zhang S., Yang Y., Deng F., Zhang Q., et al. Q493K and Q498H substitutions in Spike promote adaptation of SARS-CoV-2 in mice. EBioMedicine. 2021;67 doi: 10.1016/j.ebiom.2021.103381. [DOI] [PMC free article] [PubMed] [Google Scholar]
- 63.Wei C., Shan K.J., Wang W., Zhang S., Huan Q., Qian W. Evidence for a mouse origin of the SARS-CoV-2 Omicron variant. Journal of Genetics and Genomics. 2021;48:1111–1121. doi: 10.1016/j.jgg.2021.12.003. [DOI] [PMC free article] [PubMed] [Google Scholar]
- 64.Bate N., Savva C.G., Moody P.C.E., Brown E.A., Evans S.E., Ball J.K., Schwabe J.W.R., Sale J.E., Brindle N.P.J. In vitro evolution predicts emerging SARS-CoV-2 mutations with high affinity for ACE2 and cross-species binding. PLoS Pathog. 2022;18 doi: 10.1371/journal.ppat.1010733. [DOI] [PMC free article] [PubMed] [Google Scholar]
- 65.Choi B., Choudhary M.C., Regan J., Sparks J.A., Padera R.F., Qiu X., Solomon I.H., Kuo H.-H., Boucau J., Bowman K., et al. Persistence and Evolution of SARS-CoV-2 in an Immunocompromised Host. N. Engl. J. Med. 2020;383:2291–2293. doi: 10.1056/nejmc2031364. [DOI] [PMC free article] [PubMed] [Google Scholar]
- 66.Hearn A., York I.A., Rock K.L. The Specificity of Trimming of MHC Class I-Presented Peptides in the Endoplasmic Reticulum. J. Immunol. 2009;183:5526–5536. doi: 10.4049/jimmunol.0803663. [DOI] [PMC free article] [PubMed] [Google Scholar]
- 67.Pishesha N., Harmand T.J., Ploegh H.L. A guide to antigen processing and presentation. Nat. Rev. Immunol. 2022;22:751–764. doi: 10.1038/s41577-022-00707-2. [DOI] [PubMed] [Google Scholar]
- 68.Perez-Riverol Y., Bai J., Bandla C., García-Seisdedos D., Hewapathirana S., Kamatchinathan S., Kundu D.J., Prakash A., Frericks-Zipper A., Eisenacher M., et al. The PRIDE database resources in 2022: A hub for mass spectrometry-based proteomics evidences. Nucleic Acids Res. 2022;50:D543–D552. doi: 10.1093/nar/gkab1038. [DOI] [PMC free article] [PubMed] [Google Scholar]
- 69.Kong A.T., Leprevost F.V., Avtonomov D.M., Mellacheruvu D., Nesvizhskii A.I. MSFragger: Ultrafast and comprehensive peptide identification in mass spectrometry-based proteomics. Nat. Methods. 2017;14:513–520. doi: 10.1038/nmeth.4256. [DOI] [PMC free article] [PubMed] [Google Scholar]
- 70.Cox J., Neuhauser N., Michalski A., Scheltema R.A., Olsen J.V., Mann M. Andromeda: A peptide search engine integrated into the MaxQuant environment. J. Proteome Res. 2011;10:1794–1805. doi: 10.1021/pr101065j. [DOI] [PubMed] [Google Scholar]
- 71.Reynisson B., Alvarez B., Paul S., Peters B., Nielsen M. NetMHCpan-4.1 and NetMHCIIpan-4.0: Improved predictions of MHC antigen presentation by concurrent motif deconvolution and integration of MS MHC eluted ligand data. Nucleic Acids Res. 2020;48:W449–W454. doi: 10.1093/NAR/GKAA379. [DOI] [PMC free article] [PubMed] [Google Scholar]
- 72.Kowarz E., Löscher D., Marschalek R. Optimized Sleeping Beauty transposons rapidly generate stable transgenic cell lines. Biotechnol. J. 2015;10:647–653. doi: 10.1002/biot.201400821. [DOI] [PubMed] [Google Scholar]
- 73.Mátés L., Chuah M.K.L., Belay E., Jerchow B., Manoj N., Acosta-Sanchez A., Grzela D.P., Schmitt A., Becker K., Matrai J., et al. Molecular evolution of a novel hyperactive Sleeping Beauty transposase enables robust stable gene transfer in vertebrates. Nat. Genet. 2009;41:753–761. doi: 10.1038/ng.343. [DOI] [PubMed] [Google Scholar]
Associated Data
This section collects any data citations, data availability statements, or supplementary materials included in this article.
Supplementary Materials
Data Availability Statement
-
•
Data: the mass spectrometry proteomics data have been deposited to the ProteomeXchange Consortium via the PRIDE68 partner repository: PXD050265. Raw data files are located at Mendeley Data: (https://doi.org/10.17632/yc7ht4cgnc.1).
-
•
Code: the code and pipelines used for data analysis are available from the lead contact upon request.
-
•
Cell lines and microbe strains: HEK 293T, HeLa, and HEK 293F cells were cultured as indicated in method details. The XL-1 BLUE strain was obtained from the Evrogen (Russia).