

Abstract
Understanding DOM composition is essential for investigating the biogeochemical carbon cycle and related elements. However, methods for assigning molecular formulas (MF) in high-resolution mass spectrometry remain poorly defined, which often resulting in the misidentification of DOM components. In this study, we established a metrics evaluation framework for assessing the assignment results of each method based on similarity, accuracy and correctness. We selected six methods and then evaluated them using different settings of elemental limits, filter rules and selection rules. Our findings reveal that Formularity and TRFU are the most suitable methods for MF assignment in DOM. These two methods show high similarity ratios (93–99%) and low Bray-Curtis distances (0.13–0.14), indicating more substantial assignment capability. Their correctness rates (86–87%) and low chemical diversity errors (0.14–0.39) indicate more accurate assignment results. Other methods, TEnvR, ICBM and MFAssignR, with separate filters, show unassigned error rates of up to 47% ± 18%, potentially omitting certain DOM components. At moderate dissolved organic carbon concentrations, TRFU performs better, while Formularity outperforms at both high and low concentrations. This study provides recommendations for selecting analytical methods for DOM, facilitating a deeper understanding of its properties and role in aquatic ecosystems.
Supplementary Information
The online version contains supplementary material available at 10.1038/s41598-025-87539-x.
Keywords: High-resolution mass spectrometry, Dissolved organic matter, Molecular formula assignment methods, Assessment framework, Chemodiversity
Subject terms: Analytical chemistry, Environmental sciences
Introduction
Dissolved organic matter (DOM) is a type of crucial organic ligand and transport carrier in the aquatic environment1. DOM serves as both energy source and carbon pool for the metabolism of organisms, which in turn affects biogeochemical processes through catabolism, photosynthesis and food webs2. Human activities, such as wastewater discharge and changes in land use, can alter DOM components, affecting ecosystem carbon storage, disrupting ecological balance and increasing ecological risks3. It is essential to resolve DOM components to probe into the biogeochemical cycle effectively4. Assignment of molecular formula (MF) is a crucial approach to analyzing the chemical composition of DOM using high-resolution mass spectrometry, such as Orbitrap Mass Spectrometry (Orbitrap MS) or Fourier Transform Ion Cyclotron Resonance Mass Spectrometry (FT-ICR MS)5–7.
In the analysis of DOM using high-resolution mass spectrometry, various MF assignment methods employed, yet users often overlook the reasons for selecting a particular method. However, the assignment results can also vary in terms of DOM component identification8. The classic MF assignment method, Formularity, was proposed in 2017, is a software that assigns MF by comparing them with the Woods Hole Oceanographic Institution (WHOI) database9. However, it requires integration with a large database and separate calculations for additional indicators, including double bond equivalents (DBE), number of structural carbons (NOSC) and others. Therefore, methods based on different programming languages have been developed, which generate MF libraries through chemical rules and calculating molecular indicators. TRFU method, a MATLAB-based code, improved the calculation of related components and indicators after MF assignment10. However, the rule of selecting the MF with the fewest heteroatoms when faced with ambiguous peaks had yet to be validated. This led to the development of MFAssignR, an R-based code designed to resolve ambiguous peaks using homologous series11. ICBM-OCEAN (denoted as ICBM) was developed to handle assignments of multiple elements12. In recent years, methods such as TEnvR and NOMspectra have also been developed13,14. While commonly used as prerequisite tools for analyzing chemical diversity in DOM samples, these methods may inherently exhibit inconsistencies in MF assignments due to differences in chemical rules for limiting MF libraries (filtering rules), selection rules for ambiguous peaks (selecting the MF when a single peak corresponds to multiple possibilities), and the number of elements set during assignment (elemental limits)15,16. These rules play a crucial role in the assignment process, influencing the assignment results. Inconsistencies in MF assignments lead to misclassification of DOM components, potentially resulting in a misinterpretation of DOM’s role in biogeochemical cycles. Therefore, selecting methods that provide relatively correct assignment results is essential for subsequent studies17.
Currently, the evaluation of assignment methods includes two main types: (1) Assigning the environmental sample and comparing the differences in the results across methods. (2) Assigning based on a known chemical formula database and calculating the proportion of correct assignments. Schum et al. compared the assignment accuracy of Composer, Formularity, UltraMassExplorer (UME) and MFAssignR by assigning atmospheric organic aerosol sample data, focusing on the proportion of common MF11. Fu et al. assigned a natural organic matter (NOM)-like emerging chemical dataset with known chemical formulas and evaluated the assignment accuracy of methods such as TRFU, Formularity and WHOI based on the ratio of correctly assigned MF10. Using both experimental data and theoretical data from a known chemical formula database may allow for a more comprehensive evaluation of each method. However, relying solely on a single indicator to assess the performance of assignment methods may lack comprehensive evaluation. Therefore, it is essential to establish an evaluation framework that combines multiple experimental samples, a known chemical formula database, and various assessment indicators to evaluate method performance.
This study selected six MF assignment methods based on a literature review. Combining the known chemical formula dataset with experimental data, the evaluation framework had been conducted by quantifying six metrics to assess the assignment capability and accuracy of each MF assignment method. The experimental data includes activated sludge samples from seven different dissolved organic carbon (DOC) concentration gradients, representing DOM samples from various environmental conditions. The differences in the elemental limits, the filter and selection rules analyses were considered factors influencing the results of MF assignments. We can minimize the challenges of selecting assignment methods in high-resolution mass spectrometry data by choosing the appropriate MF assignment method. This will lead to a more accurate examination of DOM.
Materials and methods
Selecting process of assignment methods
To track the development of MF assignment methods, this study conducted a literature review using four steps: (1) Searches were performed for the keywords “high-resolution mass spectrometer” and “MF assignment” based on four databases. Web of Science Core Collection (WOSCC: https://www.webofscience.com/) included 679 peer-reviewed papers, Science Citation Index Expanded (Scopus: https://www.scopus.com/) were 1241 papers, China National Knowledge Infrastructure (CNKI: https://www.cnki.net/) and Wanfang Data Knowledge Service Platform (WFKS: https://www.wanfangdata.com.cn/) were 65 papers and 25 papers, respectively. (2) After removing the duplicates, there were 1382 related papers. (3) A total of 65 papers published between 1965 and 2024 referring to MF assignment methods were filtered by refining the title and abstract. (4) The full-text search yielded 25 papers devoted to the MF assignment methods and their principles. The detailed literature screening process was shown in Fig. S1.
Data preparation
To compare the methods of MF assignment, this study created two groups of datasets. The first dataset combined with NORMAN Substance Database (https://www.norman-network.com/nds/) and PubChem Database (https://pubchem.ncbi.nlm.nih.gov/) of 8,719 chemicals with predefined MF as known chemical formula dataset. Chemicals were converted to negative mass-to-charge ratio (m/z) values by subtracting a hydrion (1H+) prior. To prevent intensity from influencing the assignment results, in the analysis, identical intensity was used for all chemicals10. This is a cross-validation of the dataset, where only known chemical formulas of NOM are considered, while unknown or emerging compounds outside the dataset are not included in the scope. It should be noted that only the correct MF assignments were considered here, without accounting for isomerism or structural ambiguities. Therefore, this evaluation is based on relative consistency, not absolute validation.
The second dataset were obtained from the activated sludge mixture incubation experiments conducted by the authors’ research team at a wastewater treatment plant. These experiments yielded a dataset that covers a broader range of DOC concentrations by varying the temperature, adding carbon sources and using dilution-to-extinction methods to modify biological activity and DOM components. A comprehensive description of the incubation experiments was available in Text S1. The dataset comprised three consecutive samples collected at the start of each incubation experiment, which reflected the rapid changes in DOC concentrations (Table 1). Detailed information about the pre-treatment and testing procedures for the samples can be found in Text S2. In addition, we calculated the diversity and divided the composition of DOM from another two natural water samples. The diversity of the experimental data fell within the range of natural waters, and the composition of DOM showed certain similarities (Fig. S2). Thus, the experiment data were representative and revealed more conditions of DOM.
Table 1.
Conditions of incubation experiments and DOC concentrations.
| Experiments | DOC (mg·L− 1) |
|---|---|
| High temperature (HT) | 6.0-6.8 |
| Low temperature (LT) | 5.6–6.7 |
| High temperature + carbon source (HT + C) | 761.5–984.8 |
| Low temperature + carbon source (LT + C) | 605.0–716.9 |
| Dilution-to-extinction 10 times (D10) | 14.8–15.7 |
| Dilution-to-extinction 100 times (D100) | 1.1–1.7 |
| Dilution-to-extinction 1000 times (D1000) | 0.58–0.61 |
Establishment of evaluation framework
To remove the effect of environmental samples, we utilized three metrics to evaluate the results of each MF assignment method based on a known chemical formula dataset, including similarity ratio (SR), accuracy (A) and correctness (C). The similarity ratio measures the degree of similarity between the assigned MF and the original MF. Accuracy reflects the dispersion of the assignment results, while correctness indicates how much the assignment results deviate from the actual value. These metrics were calculated as shown in Eq. (1).
 |
1 |
where FNass is the number of assigned formulas, FNtot is the total number of formulas, and FNcor is the number of correct assignment formulas.
In this study, we selected the different samples from our experiments in wastewater treatment plants to compare different MF assignment methods. The Bray-Curtis dissimilarity is a commonly used metric for assessing differences in the species composition18. We used the Bray-Curtis dissimilarity (BC) to characterize the similarity of the assignment results of each MF assignment method in this study, as shown in Eq. (2). Mass error (ME) indicates the method’s effectiveness in MF assignment. Mass accuracy (MA) reveals the overall mass error of the results assigned by the method to show the accuracy of the results19, as shown in Eq. (3). Chemical diversity (CD) is an essential metric for evaluating the compositional diversity of DOM20. The correctness of the assignment method is reflected by comparing the error of chemical diversity obtained before and after the MF assignment. The error of chemical diversity (CDe) is calculated across different m/z segments, divided into nine segments with the m/z range from 100 to 1000, shown in Eq. (4). An evaluation framework of the MF assignment methods was formed based on the above metrics. For the assignment method, the ability to assign and the accuracy of the assignment were equally important8,10,11,16. Normalization of each metric (Mnor) was required to ensure that metrics fall within the interval of 0 to 1, calculated a comprehensive score in each method (Sa), as shown in Eq. (5).
 |
2 |
where xi and yi denote the ith MF in samples x and y, n is the total number of times of the MFs. The smaller the BC, the more similar the assignment results.
 |
3 |
where m is the relative molecular mass of MF, Δm is the value that measured mass (instrument output mass minus adduct mass) minus m, MEQ3 is the third quartile of the mass error, and MEQ1 is the first quartile of the mass error. The smaller the MA, the more accurate the assignment results.
 |
4 |
where Pi is the relative intensity of the jth m/z in a sample, m is the total number of m/z in a sample, CDbef is the chemical diversity of the before assignment m/z and intensity, CDaft is the chemical diversity after assigning m/z and intensity for each MF assignment method. The smaller the CDe, the higher the correct assignment results.
 |
5 |
where X is the value corresponding to each method of an indicator, Xmax is the maximum value of the corresponding indicator, and Xmin is the minimum value of the indicator. Ma, nor is the normalization of metrics used in the method a.
Metrics such as Bray-Curtis dissimilarity, mass accuracy and error in chemical diversity are relative, not absolute. These metrics primarily compare differences between methods rather than definitively measuring the correctness of the assignments. While useful for assessing method precision, they cannot confirm accuracy without external validation.
Setting of impact factors
The elemental limits in the known chemical formula dataset were set to C1–50N0–5S0–3P0–213C0–1 with H/C < 2.5 and O/C < 1.210. The elemental limits of C in the experiment dataset was set as 50 due to the m/z maximum of 100021–24.To assign more MFs, we set H and O as H1–125O1–60 via H/C < 2.5 and O/C < 1.225,26. N, S and P were set as N0–3S0–2P0–2 according to water filter9. Three other cases (Table 2) were summarized through literature to recognize the effect of the elemental limits number on assignment results.
Table 2.
The three additional cases of elemental limits.
| Cases | C | H | O | H/C | O/C | N | S | P | 13C | References |
|---|---|---|---|---|---|---|---|---|---|---|
| Case I | 1–50 | 2–73 | 1–26 | 3.0 | 1.2 | 3 | 2 | 2 | 1 | 22,40 |
| Case II | 1–60 | 1-120 | 1–30 | 2.5 | 1.2 | 5 | 3 | 2 | 1 | 25,41 |
| Case III | 1–40 | 1–82 | 1–40 | 2.5 | 1.0 | 3 | 2 | 1 | 1 | 42,21 |
In Case I, the hydrogen-to-carbon (H/C) ratio of the original case was adjusted from 2.5 to 3.0. Case II altered the atomic limits for carbon (C), nitrogen (N) and sulfur (S), while maintaining the same H/C and oxygen-to-carbon (O/C) ratios. In Case III, the O/C ratio, the atomic limits for carbon (C) and phosphorus (P) were modified. These cases were identified through a review of the literature.
To investigate how filter and selection rules impact the assignment results, we quantified the incorrect rates of MF assignments based on each set of rules. If more than half of the MF assignment methods obtained the same result, it was deemed relatively correct within the experimental dataset, because consistency among methods does not necessarily imply correctness. If multiple methods share biases, they may produce similar yet inaccurate results. We divided the m/z values of the known chemical formula dataset, ranging from 0 to 1000, into ten segments, each spaced 100 m/z units apart. We selected five m/z values from each segment, resulting in 50 m/z chosen values. We selected three parts to identify representative MF for each experimental sample: (i) The low m/z ranged from 100 to 200 with 15 MFs. (ii)The medium m/z ranged from 450 to 550 with 15 MFs. (iii) The high m/z ranged from 900 to 1000 with 15 MFs (Fig. S3). One sample was selected for each experimental method to summarize the rules for assigning incorrect MF.
Results and discussion
Determination of assignment methods
The development of current assignment methods can be divided into three phases. Rules exploration from 1965 to 2005, MF were assigned one by one based on specific chemical rules. Methods development from 2006 to 2016, methods for batch assignment of MF emerged at this stage. And methods refinement from 2017 to the present (Fig. 1A), the methods emerged were relatively mature and capable of meeting the analytical needs of mass spectrometry data. During the rules exploration phase, the MF was primarily assigned through the Kendrick mass defect (KMD) principle, the nitrogen rule and elemental limits27,28. With the purpose of the automated assignment tool compound identification algorithm (CIA) by Elizabeth’s team29, the phase of methods development presented seven heuristic golden rules30 and the double bond equivalent minus oxygen (DBE-O) limit31 in NOM. CHOFIT algorithm was developed during this period32. Until the introduction of Formularity in 2017, the MF assignment methods have been continuously refined, primarily including HaloSeeker 1.033, UME, ICBM12, MFAssignR11, TRFU10, QualAnalysis34, TEnvR13, NOMspectra14 and FTMS-Analysis35 (Fig. 1B). In the field of NOM, a mass range of 0–1000 was utilized. Formularity (v1.0.8476), TRFU, ICBM, MFAssignR, TEnvR and NOMspectra, these open-source codes were selected for subsequent comparison.
Fig. 1.

Development of assignment methods. (A) Number of publications between 1965 and 2024. (B) Assignment rules and methods under key time points.
The variability in assignment results of these MF assignment methods was mainly due to the conditions for the elemental limits, the filter rules for the assignable MF, and the selection rules for ambiguous peaks (Table 3), detailed descriptions can be found in Text S3. For elemental limits, TRFU and MFAssignR did not limit the number of H and O but limited H/C and O/C. Formularity, ICBM and NOMspectra were not limited to H/C and O/C value. For filter rules, Formularity filtered MF by chemistry rules, TRFU added the DBE-O limit, and further, MFAssignR added the separate filter. ICBM and TEnvR also have individual filters, while ICBM added NSP rules. Filter rules of NOMspectra included DBE-O limit and nitrogen rule. Formularity and TRFU selected the formula with the lowest number of heteroatoms (N, S and P) and lower errors for selection rules. Still, TRFU included lower black C (AImod > 0.66 and C > 15). ICBM, MFassignR and TEnvR chose the highest number of homologous sequences, and NOMspectra chose the lowest mass error. Current assignment methods focused solely on MF assignment, without considering the structure of the formula. Therefore, this study addressed the correctness of the MF assignment but did not include structural validation.
Table 3.
Overview of the rules for each method.
| Method | Elemental limits | Filter rules | Selection rules | Cited | References |
|---|---|---|---|---|---|
| Formularity | C, H, O, N, S, P | Chemical rules | Lower of heteroatoms, Lower errors | 173 | Tolic et al.9 |
| TRFU/FuJHA | C, N, S, P, H/C, O/C | Chemical rules, DBE-O limit | Lower black carbon, Lower of heteroatoms, Lower errors | 114 | Fu et al.10 |
| ICBM-OCEAN | C, H, O, N, S, P | NSP ruler, separate filter | Homologous sequence | 83 | Merder et al.12 |
| MFAssignR | O, N, S, P, H/C, O/C | Chemical rules, DBE-O limit, separate filter | Homologous sequence | 69 | Schum et al.11 |
| TEnvR | C, H, O, N, S, P, H/C, O/C | Separate filter | Homologous sequence, simpler MF, lower errors | 8 | Goranov et al.13 |
| NOMspectra | C, H, O, N, S, P | Nitrogen rule*, DBE-O limit | Lower errors | 1 | Volikov et al.14 |
More detailed information about each of the rules among MF assignment methods was shown in Tables S2 and S3. Literature cited as of 2024.9.30. Nitrogen rule* unlike the nitrogen rule, see Table S3 for details.
Variability of assignment results among different methods
Comprehensive scores for Formularity and TRFU were significantly higher than those of the other methods in each case (Fig. 2). In the original case, under the high temperature + carbon source (HT + C) and low temperature + carbon source (LT + C) conditions with higher DOC concentrations, Formularity scored 4.22 and 4.34, higher than TRFU (Fig. 2A). In case I, at the conditions of high temperature (HT), low temperature (LT) and dilution-to-extinction 1000 times (D1000), scores of TRFU were the highest with 4.20, 4.01 and 3.96 (Fig. 2B), respectively. In cases II and III, Formularity showed the best results in all experimental conditions (Fig. 2C, D).
Fig. 2.

Comprehensive scores of seven experimental conditions in six MF assignment methods under four elemental limits number cases. (A) Scores for the original case in C1– 50 H1–125 O1–60 N0–3S0–2 P0–213C0−1. (B) Scores for case I in C1–50 H2–73 O1–26 N0–3 S0–2 P0–213C0−1. (C) Scores for case II in C1–60 H1–120 O1–30 N0–5 S0–3 P0–213C0−1. (D) Scores for case III in C1–40 H1–82 O1–40 N0–3 S0–2 P0–113C0−1.
Formularity was more straightforward in filter rules, included only basic chemistry rules such as seven golden rules and nitrogen rule9 (Table S2) and did not lead to incorrect MF assignments. TRFU removed some MFs through the DBE-O limit, which led to up to 11% incorrect MF assignments. ICBM, MFAssignR and TEnvR have different filters that removed total MFs of 47%±18%. NSP rule of ICBM resulted in a 6%±5% incorrect rate. The DBE-O limit resulted in up to a 7% error rate for MFAssignR. The nitrogen rule and fixed elemental limit (H/C < 2.2 and O/C < 1.0) resulted in up to 15% and 24% error rates in NOMspectra, respectively. In selection rules, the incorrect rate of TRFU was up 4% through the lower heteroatoms, which was lower than that of Formularity in 9% ± 8%. The incorrect rates of ICBM and MFAssignR were up to 8% due to homologous sequences, while TEnvR had an incorrect rate of up to 13% due to simpler MFs. The highest incorrect rate in NOMspectra was 31% ± 10% due to lower errors (Table 4). Stricter filter rules reduced the incorrect rate caused by selection rules.
Table 4.
Each rule resulted in totally incorrect rates of assigning MF for each method.
| Rules | Formularity | TRFU | ICBM | MFAssignR | NOMspectra | TEnvR | |
|---|---|---|---|---|---|---|---|
| Filter rules | Nitrogen rule* | – | – | – | – | 0–15% | – |
| NSP rules | – | – | 0–17% | – | – | – | |
| DBE-O limit | – | 0–11% | – | 0–7% | – | – | |
| Separate filter | – | – | 0–48% | 26–40% | – | 26–70% | |
| Elemental limits | / | / | / | / | 0–24% | / | |
| Selection rules | Lower of heteroatoms | 0–26% | 0–4% | – | – | – | – |
| Homologous sequence | – | – | 0–8% | 0–8% | – | 0–4% | |
| Lower errors | / | / | – | – | 28–48% | / | |
| Simpler MF | – | – | – | – | / | 0–13% | |
| Lower black carbon | – | 0–4% | – | – | – | – | |
Calculation of the experimental dataset is shown in Table 6. The dataset used to assess incorrect rates was summarized in Tables S5–S11. The slash indicated that the rule in the method did not result in an error rate. The short horizontal line represented that the technique lacked the rule. The bolded numbers indicated the incorrect rates due to unassigned MF, while the unbolded numbers represented the incorrect rates due to misassigned MF.
Comparison of evaluation parameters
The similarity rates of Formularity, TRFU and NOMspectra were high at 99.5%, 93.7% and 93%, respectively (Fig. 3A). These three methods equipped with high assignment ability in lower unassignment rates ranged from 0 to 14% (Table 5), because more stringent filter rules led to lower similarity rates36. TEnvR, ICBM and MFAssignR achieved high accuracy at 98%, 96% and 96%, respectively (Fig. 3B). The ratios of assignment rate and correct assignment rate in TEnvR, ICBM and MFAssignR, with 0.89, 0.91 and 1.28, were higher among these methods (Table 5). Correctness of Formularity, TRFU and MFAssignR was higher at 87%, 86% and 83%, respectively (Fig. 3C). The correct assignment rate of these three methods ranged from 62% to 76% (Table 5). Methods with separate filter, such as TEnvR, ICBM and MFAssignR, may achieve higher accuracy due to this feature. Although these methods exhibited the highest unassigned error rates of up to 47%±18%, the resulting error rate due to incorrect MF assignments was only 13%, much lower than that of other methods (Table 6).
Fig. 3.

Assessment metrics about the similarity rate, accuracy and correctness among six MF assignment methods. (A) Assessment results of the similarity rates. (B) Assessment results of the accuracy. (C) Assessment results of the correctness.
Table 5.
Influence rules for known chemical formula dataest assignment results.
| Rules | Detailed rules | Formularity | TRFU | ICBM | MFAssign | NOMspectra | TEnvR |
|---|---|---|---|---|---|---|---|
| Rate at which rules lead to incorrect assignment results (%) | |||||||
| Filter rules | Nitrogen rule* | – | – | – | – | 8 | – |
| NSP Rules | – | – | 10 + 8 | – | – | – | |
| DBE-O limit | – | 8 + 4 | – | 4 | / | – | |
| Separate filter | – | – | 2 | 24 | – | 6 | |
| Elemental limits | / | / | / | / | 2 | / | |
| Selection rules | Lower of heteroatoms | 12 | 12 | – | – | – | – |
| Homologous sequence | – | – | 8 | 8 | / | 8 | |
| Lower errors | / | / | – | – | 12 | / | |
| Simpler MF | – | – | – | – | – | 8 | |
| Lower black carbon | – | 4 | – | – | – | – | |
| Else | 6 + 6 | 10 | / | / | 6 | / | |
The dataset used to assess incorrect rates was summarized in Table S4. The slash indicated that the rule in the method did not cause error rate. The short horizontal line represented that the method did not have the rule. Bolded and unbolded numbers were the incorrect rates due to unassigned MF and misassigned MF, respectively. Else is an assignment error caused by an isotope or an unidentifiable cause.
Table 6.
Each rule resulted in incorrect rates of assigning MF for each method in each experimental condition.
| Rules | Formularity | TRFU | ICBM | MFAssignR | NOMspectra | TEnvR | |
|---|---|---|---|---|---|---|---|
| Rates of rules leading to incorrect assignment results in seven experimental conditions. (%) | |||||||
| Filter rules | Nitrogen rule* | – | – | – | – | 15,0,0,7,0,0,10 | – |
| NSP rules | – | – | 11,4,0,7,0,0,15 | – | – | – | |
| DBE-O limit | – | 11,0,6,4,0,0,5 | – | 4,0,6,4,0,0,5 | – | – | |
| Separate filter | – | – | 11,12,12,48,8,3,0 | 26,32,27,30,34,15,25 | – | 41,64,42,36,63,21,70 | |
| Elemental limits | / | / | / | / | 15,24,3,0,0,0,0 | / | |
| Selection rules | Lower of heteroatoms | 26,12,3,0,13,3,5 | 0,0,0,0,4,0,0 | – | – | – | – |
| Homologous sequence | – | – | 0,0,6,0,0,3,0 | 4,8,6,0,0,3,0 | – | 0,0,0,4,0,0,0 | |
| Lower errors | / | / | – | – | 45,28,39,34,34,12,25 | / | |
| Simpler MF | – | – | – | – | / | 7,0,6,0,13,0,0 | |
| lower black carbon | – | 0,4,0,0,0,0,0 | – | – | – | – | |
Which are the results under seven different conditions, HT, LT, HT + C, LT + C, D10, D100, D1000, respectively. The slash indicated that the rule in the method did not result in an error rate. The short horizontal line represented that the technique lacked the rule. The bolded numbers indicated the incorrect rates due to unassigned MF, while the unbolded numbers represented the incorrect rates due to misassigned MF.
The relative accuracy of MF assignment methods was compared by assessing the similarity of assignment results across different methods. Filter and selection rules affected the ability of MF assignment and the accuracy of assignment results37. The average Bray-Curtis distances between Formularity, TRFU and NOMspectra were smaller than other methods (Fig. 4A). Specifically, the TRFU and Formularity in average Bray-Curtis dissimilarity were the lowest among the six MF assignment methods, with 0.13 and 0.14, respectively (Fig. 4B). The incorrect rates of 0% in Formularity and up to 8% in TRFU were the lowest among all methods using filter rules (Table 4). The average mass accuracy of NOMspectra was the smallest, from 0.38 to 0.46. In comparison, the average mass accuracy of Formularity and TRFU were higher, ranging from 0.58 to 0.92 and 0.63 to 0.98, respectively (Fig. 5). NOMspectra selected the MF with lower error, leading the lower mass accuracy38. The mass error was considered the heteroatoms9, and Formularity and TRFU chose the MF with the lower heteroatoms in selection rules to prove the mass accuracy (Tables 4 and 6). The average error of chemical diversity was lowest in NOMspectra, Formularity and TRFU (Fig. 6A), with values ranging from 0.15 to 0.36, 0.14 to 0.39 and 0.15 to 0.39 in m/z of 100–1000, respectively (Fig. 6B). The incorrect rates of filter and selection rules in Formularity and TRFU ranged from 0% to 26% and 0% to 19%, which was lower than other methods (Tables 4 and 6). Overall, Formularity and TRFU achieved the highest overall scores by demonstrating strong partitioning capability through the use of chemical rules as filtering rules. This allowed them to gain a significant advantage in similarity rates and Bray-Curtis distance metrics, resulting in an error rate of 0% due to unassigned formulas. By combining the selection rule of minimizing heteroatoms, they achieved a higher correct assignment ratio, gaining a significant advantage in correctness and chemical diversity error, with average correct assignment ratios of 91.4% and 96.4% (Table 6). In contrast, due to different nitrogen rule and selection rules, NOMspectra obtained a 31%±10% assignment error rate, leading to lower scores in accuracy and correctness, and consequently a lower correct assignment results.
Fig. 4.

Evaluation metrics about average Bray-Curtis dissimilarity. (A) Bray-Curtis dissimilarity in seven experimental conditions. (B) Average Bray-Curtis dissimilarity of each MF assignment method.
Fig. 5.
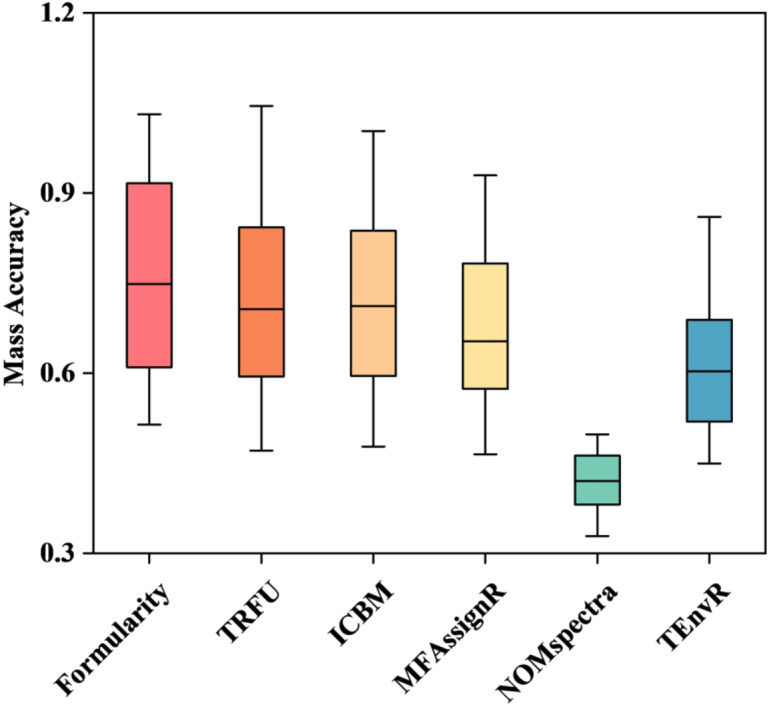
Average mass accuracy of each MF assignment method.
Fig. 6.

Evaluation metrics about chemical diversity. (A) Error of chemical diversity in seven experimental conditions. (B) Average error of chemical diversity of each MF assignment method.
By using a known chemical formula dataset and experimental data, we obtained consistent DOM evaluation results, which mutually validated each other and were almost identical. This reflected the integrity of the evaluation framework. This work can guide further research on molecular formula matching in the future.
It is important to emphasize that all evaluations in this study were based solely on MF assignment. We did not consider the structural aspects of these formulas or account for isomeric variations. Further analysis using techniques such as Liquid Chromatography-Tandem Mass Spectrometry (LC-MS/MS) or Nuclear Magnetic Resonance (NMR) can be performed to confirm the accuracy of the assigned molecular structures39.
Conclusions
Considering both assigning capacity and accuracy, Formularity and TRFU are the most suitable assignment methods. These two methods show better similarity and correctness than others in assignment results. ICBM, MFAssignR and TEnvR have lower assignment capacities but higher accuracy than Formularity and TRFU, and these methods can achieve accuracy in assignment results as high as 96–98%. The assignment capability of NOMspectra is similar to that of Formularity and TRFU, but its accuracy is lower than that of the two methods. This study recommends choosing the most suitable analytical method for DOM components in aquatic ecosystems.
Electronic supplementary material
Below is the link to the electronic supplementary material.
Acknowledgements
This study was primarily supported by the National Key Research and Development Program (2022YFC3203504) and the National Natural Science Foundation of China (Project No. U2340222). It was also supported by general research funds from the Chongqing Science and Technology Bureau (CSTB2022NSCQ-MSX0599). We thank Dr. Chen He from China University of Petroleum-Beijing for her valuable support in ensuring the thoroughness and accuracy of our methods.
Author contributions
Zhiyuan Deng: Formal analysis, Writing—Original Draft, Visualization. Xinxia He: Methodology, Validation, Writing—Review & Editing. Wenjuan Ouyang: Validation, Data curation. Hao Ying: Methodology, Validation, Resources. Qiong Tang: Investigation, Data curation. Dianchang Wang: Funding Acquisition, Project administration. Chong Li: Investigation, Funding Acquisition. Yao Chen: Supervision. Zhe Li: Conceptualization, Supervision, Writing review & editing, Funding Acquisition.
Data availability
Data are available upon request to the corresponding author.
Declarations
Competing interests
The authors declare no competing interests.
Footnotes
Publisher’s note
Springer Nature remains neutral with regard to jurisdictional claims in published maps and institutional affiliations.
Contributor Information
Xinxia He, Email: hexinxia@cigit.ac.cn.
Zhe Li, Email: lizhe@cigit.ac.cn.
References
- 1.Zhang, X. et al. Application of Fourier transform ion cyclotron resonance mass spectrometry in deciphering molecular composition of soil organic matter: a review. Sci. Total Environ.756, 144140 (2021). [DOI] [PubMed] [Google Scholar]
- 2.Panneer Selvam, B. et al. Photo-reactivity of dissolved organic carbon in the freshwater continuum. Aquat. Sci.81, 57 (2019). [Google Scholar]
- 3.Jiao, N. et al. Microbial production of recalcitrant dissolved organic matter: long-term carbon storage in the global ocean. Nat. Rev. Microbiol.8, 593–599 (2010). [DOI] [PubMed] [Google Scholar]
- 4.Shi, W., Zhuang, W. E., Hur, J. & Yang, L. Monitoring dissolved organic matter in wastewater and drinking water treatments using spectroscopic analysis and ultra-high resolution mass spectrometry. Water Res.188, 116406 (2020). [DOI] [PubMed] [Google Scholar]
- 5.Hertkorn, N. et al. Natural organic matter and the event horizon of mass spectrometry. Anal. Chem.80, 8908–8919 (2008). [DOI] [PubMed] [Google Scholar]
- 6.Qi, Y. & O’Connor, P. B. Data processing in Fourier transform ion cyclotron resonance mass spectrometry. Mass. Spectrom. Rev.33, 333–352 (2014). [DOI] [PubMed] [Google Scholar]
- 7.Zubarev, R. A. & Makarov, A. Orbitrap mass spectrometry. Anal. Chem.85, 5288–5296 (2013). [DOI] [PubMed] [Google Scholar]
- 8.Pailler, L., Renard, P., Nicol, E., Deguillaume, L. & Bianco, A. How well do we handle the sample preparation, FT-ICR mass spectrometry analysis, and data treatment of atmospheric waters? Molecules27, 1 (2022). [DOI] [PMC free article] [PubMed] [Google Scholar]
- 9.Tolić, N. et al. Formularity: Software for automated formula assignment of natural and other organic matter from ultrahigh-resolution mass spectra. Anal. Chem.89, 12659–12665 (2017). [DOI] [PubMed] [Google Scholar]
- 10.Fu, Q. L., Fujii, M. & Riedel, T. Development and comparison of formula assignment algorithms for ultrahigh-resolution mass spectra of natural organic matter. Anal. Chim. Acta1125, 247–257 (2020). [DOI] [PubMed] [Google Scholar]
- 11.Schum, S. K., Brown, L. E., Mazzoleni, L. R. & MFAssignR Molecular formula assignment software for ultrahigh resolution mass spectrometry analysis of environmental complex mixtures. Environ. Res.191, 110114 (2020). [DOI] [PubMed] [Google Scholar]
- 12.Merder, J. et al. ICBM-OCEAN: Processing ultrahigh-resolution mass spectrometry data of complex molecular mixtures. Anal. Chem.92, 6832–6838 (2020). [DOI] [PubMed] [Google Scholar]
- 13.Goranov, A. I., Sleighter, R. L. & Yordanov, D. A. TEnvR: MATLAB-based toolbox for environmental research. Anal. Methods15, 5390–5400 (2023). [DOI] [PubMed] [Google Scholar]
- 14.Volikov, A. B., Rukhovich, G. D., Perminova, I. V. & NOMspectra An open-source python package for processing high resolution mass spectrometry data on natural organic matter. J. Am. Soc. Mass. Spectrom.1, 1 (2023). [DOI] [PubMed] [Google Scholar]
- 15.Boiko, D. A., Kozlov, K. S., Burykina, J. V., Ilyushenkova, V. V. & Ananikov, V. P. Fully automated unconstrained analysis of high-resolution mass spectrometry data with machine learning. J. Am. Chem. Soc.144, 14590–14606 (2022). [DOI] [PubMed] [Google Scholar]
- 16.Fakouri Baygi, S. et al. Comparison between automated and user-interactive non-targeted screening tools: isotopic profile deconvoluted chromatogram (IPDC) algorithm and HaloSeeker 1.0. Int. J. Environ. Sci. Technol.19, 10535–10546 (2022). [Google Scholar]
- 17.Gao, S. et al. Detection and exclusion of false-positive molecular formula assignments via mass error distributions in UHR mass spectra of natural organic matter. Anal. Chem.96, 10210–10218 (2024). [DOI] [PMC free article] [PubMed] [Google Scholar]
- 18.Rosselló-Mora, R. & Amann, R. The species concept for prokaryotes. FEMS Microbiol. Rev.25, 39–67 (2001). [DOI] [PubMed] [Google Scholar]
- 19.Simon, C., Roth, V. N., Dittmar, T. & Gleixner, G. Molecular signals of heterogeneous terrestrial environments identified in dissolved organic matter: a comparative analysis of orbitrap and ion cyclotron resonance mass spectrometers. Front. Earth Sci.6, 16 (2018). [Google Scholar]
- 20.Kellerman, A. M., Dittmar, T., Kothawala, D. N. & Tranvik, L. J. Chemodiversity of dissolved organic matter in lakes driven by climate and hydrology. Nat. Commun.5, 3804 (2014). [DOI] [PubMed] [Google Scholar]
- 21.Li, W. et al. Chemodiversity of dissolved organic matter is governed by microbial biogeography in inland waters. Environ. Sci. Technol.57, 7753–7763 (2023). [DOI] [PubMed] [Google Scholar]
- 22.Qu, L. et al. Spatial variation of anthropogenic disturbances within watersheds determines dissolved organic matter composition exported to oceans. Water Res.262, 122084 (2024). [DOI] [PubMed] [Google Scholar]
- 23.Pan, B., Liu, S., Wang, Y., Li, D. & Li, M. FT-ICR-MS combined with fluorescent spectroscopy reveals the driving mechanism of the spatial variation in molecular composition of DOM in 22 plateau lakes. Environ. Res.232, 116272 (2023). [DOI] [PubMed] [Google Scholar]
- 24.Liu, Z. et al. Enrichment of geogenic phosphorus in a coastal groundwater system: new insights from dissolved organic matter characterization. Chemosphere322, 138214 (2023). [DOI] [PubMed] [Google Scholar]
- 25.Cai, S. et al. Dissolved organic matter transformation mechanisms and process optimization of wastewater sludge hydrothermal humification treatment for producing plant biostimulants. Water Res.235, 119910 (2023). [DOI] [PubMed] [Google Scholar]
- 26.Li, X., Guo, M., Wang, Y., Liu, G. & Fu, Q. Molecular insight into the release of phosphate from dissolved organic phosphorus photo-mineralization in shallow lakes based on FT-ICR MS analysis. Water Res.222, 118859 (2022). [DOI] [PubMed] [Google Scholar]
- 27.Raznikov, V. V. & Raznikova, M. O. Assignment of the mass number to peaks in high-resolution mass spectra acquired via the counting of ions. Int. J. Mass Spectrom.85, 1–21 (1988). [Google Scholar]
- 28.Fievre, A., Solouki, T., Marshall, A. G. & Cooper, W. T. High-resolution Fourier transform ion cyclotron resonance mass spectrometry of humic and fulvic acids by laser desorption/ionization and electrospray ionization. Energy Fuels11, 554–560 (1997). [Google Scholar]
- 29.Kujawinski, E. B. & Behn, M. D. Automated analysis of electrospray ionization fourier transform ion cyclotron resonance mass spectra of natural organic matter. Anal. Chem.78, 4363 (2006). [DOI] [PubMed] [Google Scholar]
- 30.Kind, T. & Fiehn, O. Seven Golden rules for heuristic filtering of molecular formulas obtained by accurate mass spectrometry. BMC Bioinform.8, 105 (2007). [DOI] [PMC free article] [PubMed] [Google Scholar]
- 31.Herzsprung, P. et al. Understanding molecular formula assignment of Fourier transform ion cyclotron resonance mass spectrometry data of natural organic matter from a chemical point of view. Anal. Bioanal. Chem.406, 7977–7987 (2014). [DOI] [PubMed] [Google Scholar]
- 32.Green, N. W. & Perdue, E. M. Fast graphically inspired algorithm for assignment of molecular formulae in ultrahigh resolution mass spectrometry. Anal. Chem.87, 5086–5094 (2015). [DOI] [PubMed] [Google Scholar]
- 33.Léon, A. et al. HaloSeeker 1.0: a user-friendly software to highlight halogenated chemicals in nontargeted high-resolution mass spectrometry data sets. Anal. Chem.91, 3500–3507 (2019). [DOI] [PubMed] [Google Scholar]
- 34.Ceolotto, N., Zangrando, R., Orlando, S. & Gambaro, A. QualAnalysis, a new tool in environmental chemistry for a faster qualitative analysis. Chemometr. Intell. Lab. Syst.1, 1 (2022). [Google Scholar]
- 35.Fu, Q. L., Fujii, M. & Ma, R. Development of a gaussian-based alignment algorithm for the ultrahigh-resolution mass spectra of dissolved organic matter. Anal. Chem.95, 2796–2803 (2023). [DOI] [PubMed] [Google Scholar]
- 36.Sarycheva, A., Perminova, I. V., Nikolaev, E. N. & Zherebker, A. Formulae differences commence a database for interlaboratory studies of natural organic matter. Environ. Sci. Technol.57, 6238–6247 (2023). [DOI] [PubMed] [Google Scholar]
- 37.He, C., He, D., Chen, C. & Shi, Q. Application of Fourier transform ion cyclotron resonance mass spectrometry in molecular characterization of dissolved organic matter. Sci. China Earth Sci.65, 2219–2236 (2022). [Google Scholar]
- 38.Potemkin, A. A., Proskurnin, M. A. & Volkov, D. S. Noise filtering algorithm using gaussian mixture models for high-resolution mass spectra of natural organic matter. Anal. Chem.96, 5455–5461 (2024). [DOI] [PubMed] [Google Scholar]
- 39.DiDonato, N. et al. Improved characterization of soil organic matter by integrating FT-ICR MS, liquid chromatography tandem mass spectrometry, and molecular networking: a case study of root litter decay under drought conditions. Anal. Chem.96, 11699–11706 (2024). [DOI] [PubMed] [Google Scholar]
- 40.Lv, L. et al. Unique dissolved organic matter molecules and microbial communities in rhizosphere of three typical crop soils and their significant associations based on FT-ICR-MS and high-throughput sequencing analysis. Sci. Total Environ.919, 170904 (2024). [DOI] [PubMed] [Google Scholar]
- 41.Liu, H. et al. Effects of reservoir construction on optical and molecular characteristics of dissolved organic matter in a typical P-contaminated river. Chemosphere341, 140037 (2023). [DOI] [PubMed] [Google Scholar]
- 42.Catalán, N. et al. Treeline displacement may affect lake dissolved organic matter processing at high latitudes and altitudes. Nat. Commun.15, 2640 (2024). [DOI] [PMC free article] [PubMed] [Google Scholar]
Associated Data
This section collects any data citations, data availability statements, or supplementary materials included in this article.
Supplementary Materials
Data Availability Statement
Data are available upon request to the corresponding author.