

Abstract
Aminoacyl-tRNA synthetases (aaRSs) maintain translational fidelity by ensuring the formation of correct aminoacyl-tRNA pairs. Numerous point mutations in human aaRSs have been linked to disease phenotypes. Structural studies of aaRSs from human pathogens encoding unique domains support these enzymes as potential candidates for therapeutics. Studies have shown that the identity of tRNA pools in cells changes between different cell types and under stress conditions. While traditional radioactive aminoacylation analyses can determine the effect of disease-causing mutations on aaRS function, these assays are not amenable to drug discovery campaigns and do not take into account the variability of the intracellular tRNA pools. Here, we review modern techniques to characterize aaRS activity in vitro and in cells. The cell-based approaches analyse the aminoacyl-tRNA pool to observe trends in aaRS activity and fidelity. Taken together, these approaches allow high-throughput drug screening of aaRS inhibitors and systems-level analyses of the dynamic tRNA population under a variety of conditions and disease states.
Keywords: Aminoacylation assays, aminoacyl-tRNA editing, aminoacyl-tRNA synthetases, cellular tRNA pools, high-throughput drug screening
1. Introduction
Aminoacyl-tRNA synthetases (aaRSs) are essential for the viability of an organism as they pair cognate amino acids and tRNAs during protein synthesis [1]. Aminoacylation proceeds in two-steps. In the first step, the aaRS activates its cognate amino acid using ATP, releasing inorganic pyrophosphate (PPi). In the second step, the activated amino acid moiety is transferred to the 3′-CCA end of the cognate tRNA (Fig. 1) [2]. Two classes of aaRSs are present in all domains of life, with the class division based on distinct active site architecture and modes of substrate binding [3]. AaRSs from both classes misactivate and mischarge non-cognate amino acids onto tRNA due to the similar physicochemical properties of some amino acids [4,5]. If these errors are not corrected, mistranslated proteins are produced that can be misfolded, leading to loss of protein function and aggregation. To prevent mistranslation, organisms across all domains of life encode quality control mechanisms to proofread the activation and transfer steps of aminoacylation. Pre-transfer editing occurs following amino acid misactivation whereby the aaRS hydrolyzes the aminoacyl-adenylate in the synthetic site or by releases it into solution (Fig. 1) [6]. Although pre-transfer editing is observed in both classes of aaRSs, it is proposed to be more predominant in class I enzymes due to slow aminoacyl-transfer kinetics [7]. Post-transfer editing refers to the removal of a non-cognate amino acid that has been esterified to the 3’-end of a tRNA. Proofreading of mischarged tRNA may occur in cis, where the aaRS translocates it to a distal editing site before product release, or in trans, where released mischarged tRNA can be rebound by the aaRS or a dedicated editing factor for hydrolysis (Fig.1) [8–11].
Figure 1. Two-step aminoacylation reaction.
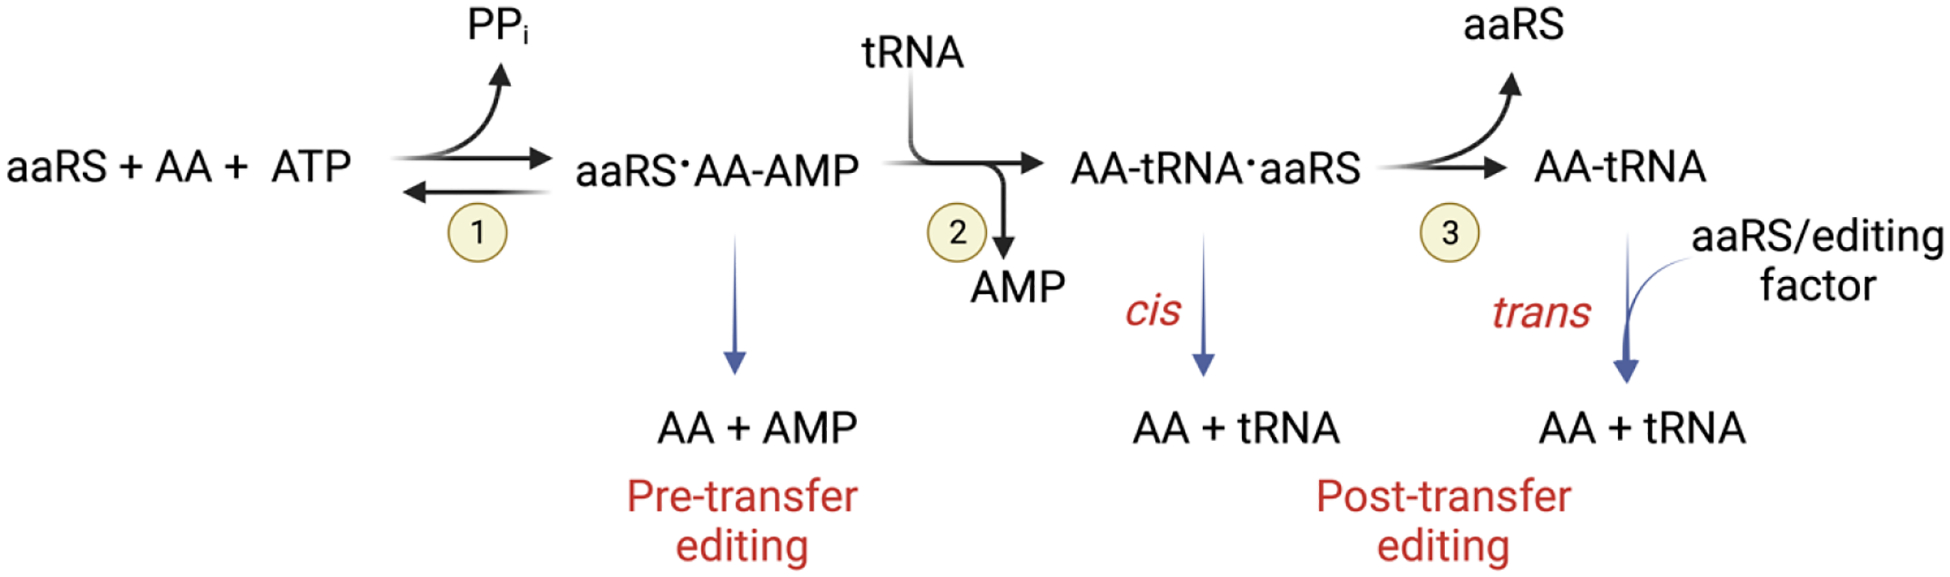
(1) Amino acid activation precedes (2) aminoacyl-transfer and (3) product release. Fidelity is maintained by pre- and post-transfer proofreading mechanisms.
Point mutations in human aaRS genes have been linked to developmental abnormalities, as well as impaired motor and neurological function [12–17]. Disease-associated mutations may also arise in the editing domains of aaRSs that do not affect aminoacylation of tRNA but instead lead to the loss of editing and increased levels of misaminoacylated tRNAs [18–21]. Based on the essential function of aaRSs, they are potential targets for anti-microbial therapeutics. AaRSs of pathogens generally have significant differences in domain architecture compared to human aaRS; these unique features can be exploited as novel drug targets [22–27]. Traditional aminoacylation assays rely on radioactivity and are not easily amenable to drug discovery campaigns that test libraries consisting of thousands of molecules. This limitation has led to the development of new methods for studying aaRS activity using colorimetric, spectrophotometric, and luminescent techniques that can be adapted to a multi-well plate reader for data acquisition.
In this review, we discuss modern approaches for characterizing aaRS activity in vitro and in cells. Previous reviews focused on the utility of radioisotopes to explore the kinetic differences between the two classes of aaRSs. The in vitro aminoacylation methods emphasized here avoid radioactive material and are instead coupled to other chemical or enzymatic reactions that produce a change in absorbance, luminescence, or gel mobility. Most of these methods are scalable to meet the needs of drug screening. The cell-based approaches analyze the aminoacylated tRNA pool by sequencing or mass spectrometry to observe trends in aaRS activity and fidelity.
2. In vitro analysis of aminoacylation and editing
Traditional aminoacylation methods
2.1. Detecting aminoacylation with radioisotopes
One of the first accounts of aaRS activity was in 1958 when Hoagland et. al combined RNA with whole cell lysate to determine whether RNA could be labeled with 14C-amino acids [28]. The use of radioisotopically-labeled amino acids or tRNAs is still commonly used to observe aaRS activity. We briefly discuss radioactive approaches and refer readers to more detailed reviews of these methods [29,30].
Aminoacylation with [3H]-, [14C]-, or [35S]-labeled amino acids typically involves nanomolar amounts of aaRS, varying tRNA (5 μM saturating) or ATP (2 mM saturating) concentrations, and an amino acid concentration well below the KM of the aaRS (~20 μM) [29]. The latter limitation is due to the low specific activity of the labeled amino acid. The assay is performed discontinuously—a 10–15 μl aliquot of the reaction is spotted onto a filter pad presoaked with 5% trichloroacetic acid at desired time points. The filter pads are washed to remove free amino acid and the amount of aa-tRNA precipitated on the pad is quantified by scintillation counting. Plateau level aminoacylation is usually achieved within 20 minutes [29]. To perform assays under saturating amino acid concentrations, aminoacylation is conducted using [32P] 3′-end labeled tRNA prepared by CCA-adding enzyme [29,31]. After initiation with enzyme, the reaction is quenched by 0.2 M NaOAc, pH 5.1 and digested with P1 or S1 nuclease. Reactions are spotted onto polyethylenimine (PEI) thin-layer chromatography (TLC) plates to separate [32P]-AMP from [32P]-aa-AMP for analysis by phosphorimaging and densitometry [29].
Both aminoacylation workflows using radiolabeled amino acids or tRNAs are scalable for synthesis of aa-tRNAs or misacylated tRNAs for post-transfer editing assays. Micromolar amounts of mischarged tRNA can be obtained by using an editing-defective aaRS. However, editing-defective aaRSs are usually limited to misacylating their cognate tRNA. This limitation is solved by mischarging tRNA with flexizyme (flexible tRNA acylation ribozyme), developed by Suga and co-workers [32–37].
Through several rounds of in vitro selection, Suga and colleagues engineered the first ribozyme capable of aminoacylating any tRNA, termed dinitroflexizyme (dFx), which recognizes a dinitrobenzylester leaving group (DBE) and as a result, binds amino acids activated with DBE. Variations of dFx include “enhanced flexizyme” (eFx) and the amino flexizyme (aFx) [34,35]. eFx aminoacylates tRNAs with aromatic amino acids conjugated to a cyanomethylester (CME) leaving group, or amino acids attached to a p-chlorobenzyl thioester (CBT) leaving group. Substrate recognition by eFx is mediated by aromatic interactions. aFx was introduced to overcome the poor solubility of hydrophobic amino acids conjugated to dFx and eFx leaving groups [35]. aFx recognizes bulky hydrophobic amino acids, like leucine, conjugated to an amino-derivatized benzyl thioester (ABT). Flexizyme-catalyzed aminoacylation mechanistically proceeds through 3′-end base pair interactions between the ribozyme and N73-A76 of the acceptor tRNA—this brings the 3′-OH of the tRNA in proximity to the carbonyl of the activated amino acid that is bound by the unique catalytic domain of dFx, eFx, or aFx to allow for acyl transfer [34,36].
Flexizyme technology has been applied in several studies that characterized the amino acid specificity of tRNAPro trans-editing factors [10,38–42]. In a typical post-transfer editing assay, 32P-tRNA is mischarged using flexizyme, which usually results in acylation efficiencies of 20–50%. Kinetic analysis of the editing factor is performed discontinuously, typically under single-turnover conditions—misacylated tRNA is introduced to a 10-fold excess of deacylase and reaction aliquots are quenched into 0.2 M NaOAc, pH 5.1 at desired time points. Deacylated product is visualized by TLC and quantified by phosphorimaging.
The utility of flexizyme goes beyond post-transfer kinetic assays and has been used for acylating tRNAs for macrocyclic peptide synthesis, introduction of non-canonical amino acids into proteins, and various ribosomal studies [43–45]. In one study, flexizyme was used to charge all 21 tRNAs needed for synthesizing tryptophanyl-tRNA synthetase (TrpRS) in a cell-free translation system [46]. Flexizyme-acylated tRNAs were competent for peptidyl transfer and the TrpRS produced in this study was competent for charging tRNATrp. dFx and eFx have also been used to attach amino acids to tRNAs with a terminal 3′-deoxy-3′-amino-adenosine analog, generating stably charged tRNA suitable for use in structural and kinetic settings [47].
The radioactive aminoacylation assays are advantageous due to their sensitivity and reproducibility, but they are labor intensive and can be costly as the price of radioactive isotopes has increased significantly in recent years. In some cases, the manufacture of radiolabeled amino acids has been discontinued. Thus, our remaining discussion will focus on methods that do not require radioisotopes.
Coupled aminoacylation methods
2.2. Leveraging PPi production to study aaRSs: MESG and Malachite Green
An early example of a non-radiometric aminoacylation assay coupled the pyrophosphate (PPi) production to spectrophotometric detection of 2-amino-6-mercapto-7-methyl purine nucleoside (MESG) [48]. In this assay, inorganic pyrophosphatase (PPiase), purine nucleoside phosphorylase (PNPase), and MESG are included in the aminoacylation reaction (Fig. 2) [48,49]. In parallel with PPi production during the activation step of aminoacylation, PPiase hydrolyzes 1 mol of PPi to 2 mol of orthophosphate (Pi). PNPase uses Pi to convert MESG into 2-amino-6-mercapto-7-methyl purine (AMMP) by irreversibly breaking the glycosidic linkage between the purine ring and ribose sugar (Fig. 2) [48,49]. The conversion of MESG to AMMP is detected by absorbance at 360 nm, which can be monitored continuously as aminoacylation proceeds. Since PPi release is linear with aa-tRNA formation, absorbance at 360 nm over time is correlated with the amount of product formed and hence is an indicator for aaRS activity [48,49].
Figure 2. Aminoacylation monitoring by PPi release.

Malachite green- and PNPase/MESG-based approaches depend on hydrolysis of released pyrophosphate by pyrophosphatase following amino acid activation (top). (1) Orthophosphate allows for color development of malachite green from yellow to green and subsequent detection at 625 nm. (2) PNPase uses orthophosphate to convert MESG to AMMP, which is detected at 360 nm. A recycling factor liberates tRNA and amino acid for multiple turnovers and improves reaction sensitivity (top; grey).
In 2018, Grube and Roy explored the utility of MESG as an indicator for activation and editing by aaRSs and hence as a screening platform for inhibitors that target synthetic and proofreading sites [49]. The authors established the conditions for their method by comparing activation of Val and non-cognate Thr by Escherichia coli valyl-tRNA synthetase (Ec ValRS). In the presence of tRNAVal, PPiase, and Ec ValRS, MESG conversion was more robust in the presence of Thr than with cognate Val [49]. The fate of misactivated Thr was either pre-transfer hydrolysis in the synthetic site or post-transfer proofreading by the Ec ValRS connective polypeptide 1 (CP1) editing domain. Both editing scenarios by Ec ValRS allowed for recycling of Thr and tRNA, while PPiase prevented the reverse ATP-PPi exchange reaction and supplied Pi to PNPase for MESG conversion. Under these conditions, tRNA and non-cognate amino acid are continually replenished in the reaction, meaning MESG is rate-limiting (Fig. 2) [49].
Grube and Roy extended their methodology with the E. coli system to aaRSs encoded by microbial pathogens, Mycobacterium tuberculosis (Mt) and Plasmodium falciparum (Pf). Kinetic parameters for misactivation of Thr by Mt ValRS and Gly by Pf AlaRS were determined. Published kinetic parameters for misactivation by Mt and Pf enzymes are not well established in the literature, nor did the authors perform comparative ATP-PPi exchange assays to validate the reliability and universality of their method. However, the KM value of Ec IleRS for Val using the MESG approach was similar to the published value obtained using radioactive ATP-PPi exchange kinetics: KM of 1.86 mM using MESG detection versus 0.5 mM with ATP-PPi exchange [49]. In contrast, the KM value of misactivation of Ser by Ec ThrRS was ~4-fold lower when measured by coupling to MESG versus the value determined by ATP-PPi exchange (~22 mM versus ~81 mM).
Similar to MESG, malachite green dye can be used for spectrophotometric detection of Pi. An advantage of the malachite green approach is that it requires no additional enzymes for absorbance detection. When malachite green complexes with Pi and molybdate, an observable color shift from yellow to green occurs, which can subsequently be detected by absorbance at 625 nm (Fig. 2) [50,51]. However, because malachite green needs acidic conditions for its colorimetric development prior to detection at 625 nm, the assay is performed discontinuously, unlike PNPase/MESG coupling [50]. Reaction aliquots taken at various time points are quenched into 10 mM EDTA, which inhibits both aminoacylation and PPiase activities [51]. The reaction can also be quenched directly into commercially available developing solution (Echelon Biosciences), which contains everything needed for malachite green color transition. Alternatively, homemade developer can be made by mixing 1.75 mM malachite green oxalate, 2.32% (w/v) polyvinyl alcohol, 292 mM ammonium molybdate prepared in 6 M HCl, and water in a 2:1:1:2 ratio [52]. The molar amount of aa-tRNA formed is calculated through a standard curve generated by incubating known concentrations of Pi with developing solution.
In 2013, Cestari and Stuart conducted a proof-of-principle kinetic characterization of recombinant Trypanosoma brucei IleRS, using the malachite green and MESG approaches. The authors observed that aminoacylation detection using Pi formation was equimolar to the amount of aa-tRNAs formed and increased with higher aaRS concentrations [51]. An aminoacylation reaction carried out using ~400 ng of IleRS, 8 μM tRNAIle, 200 μM ATP, and 5 mM Ile resulted in a plateau of 1 nmol of Pi formed after 30 minutes [51]. The kinetic parameters for activation by IleRS using malachite green (kcat/KM = 0.029 μM−1s−1) were significantly different from those obtained with MESG (kcat/KM = 112 μM−1s−1) [51]. Cestari and Stuart report low levels of product formation using MESG detection in the absence of an Ile-tRNAIle recycling mechanism; this agrees with the observations of Grube and Roy in their 2018 study [49].
2.3. aaRS activity via ATP consumption: BioThema and AMP-Glo Luminescence
Luminescent approaches for monitoring aminoacylation use the ATP-dependent luciferase/luciferin system (Fig. 3, reaction 1). The BioThema assay was commercially introduced to monitor kinase activity but has been adapted for high-throughput drug screening of aaRSs [53]. Inhibitors of aaRSs will slow down ATP turnover and as a result, one would expect a high light output following aminoacylation as more ATP will be present in solution for the luciferase reaction. The assay setup is straightforward: an aminoacylation mix is prepared containing the aaRS, cognate amino acid, luciferase/ luciferin, and inhibitor (Fig. 3, reaction 2). A mix lacking inhibitor is prepared in parallel. Aminoacylation is initiated by addition of ATP and luminescence is measured at defined time points via a plate reader. Saint-Léger and Ribas de Pouplana emphasize that the goal of the BioThema approach is to obtain a linear consumption of ATP (first-order kinetics). Thus, the assay is designed to have an ATP concentration well below the KM of both luciferase and aaRS. The disadvantage of the BioThema workflow is the possibility of luciferase and aaRS turning over ATP in tandem as both enzymes are competing for ATP [53]. Competition can be accounted for by setting up an aminoacylation reaction without aaRS in order to measure the background consumption rate of ATP by luciferase.
Figure 3. Comparison of BioThema and AMP-Glo workflows.

(1) BioThema and AMP-Glo aminoacylation approaches utilize the ATP-dependent luciferase/luciferin detection system. (2) In the BioThema approach, all components (-ATP) are included in a reaction mix from the start of the reaction. Aminoacylation is initiated with ATP and luminescence is detected continuously. In the presence of an aaRS inhibitor, more ATP is consumed by luciferase and more light is produced. (3) In the AMP-Glo assay, luminescence is detected in endpoint format. Addition of reagent I stops aminoacylation by depleting the reaction of unused ATP, degrades pyrophosphate, and converts AMP produced during aminoacyl-transfer to ADP. Reagent II contains luciferase/luciferin and an adenosine kinase to phosphorylate the ADP produced from reagent I into ATP for luminescent readout.
The AMP-Glo assay (Promega) circumvents ATP competition between aaRS and luciferase through a sequential workflow (Fig. 3, reaction 3) [54]. Aminoacylation is first conducted under similar conditions to that of BioThema ([ATP] << KM(ATP) of aaRS). The reaction is quenched at desired time points by the addition of a reagent (reagent I) that contains pyrophosphatase, ATP adenylyl cyclase, and polyphosphate AMP-phosphotransferase [54]. ATP adenylyl cyclase converts unused ATP into 3′,5′-cyclic AMP to ensure the future luminescent signal collected is proportional to the amount of acylated tRNA, while pyrophosphatase removes PPi from solution to prevent inhibition of luciferase. AMP produced from aminoacyl-transfer is then converted to ADP by the polyphosphate AMP-phosphotransferase (Fig. 3) [54]. Reagent I enzymatic conversions require a 30 minute to 1 hour incubation post-aminoacylation. After incubation with reagent I, a second reagent (reagent II), containing an adenosine kinase plus luciferase/luciferin, converts ADP generated by reagent I to ATP for luminescence readout. Moles of aa-tRNA formed are determined using a luminescence standard curve generated from incubating known concentrations of AMP with reagents I and II [54]. Like BioThema, AMP-Glo was designed for drug screening against various ATP-dependent enzymes. Both workflows appear as promising options for assaying ATP and amino acid analogs as inhibitors [55].
2.4. Aminoacylation and editing through AMP-dependent NAD+ reduction
First and Richardson described a method for coupling tyrosyl-tRNA synthetase (TyrRS) activity to AMP deaminase and inosine monophosphate (IMP) dehydrogenase activities [56]. Correlating aminoacylation with the amount of AMP produced relies, first, on the conversion of AMP to IMP by AMP deaminase, and second, on the reduction of NAD+ to NADH by IMP dehydrogenase; this allows for spectrophotometric detection of NADH at 340 nm (Fig. 4). This assay depends on tRNA acylation being the rate-limiting step [56]. The observed rate of NAD+ reduction is approximately the rate of aminoacylation under conditions of saturating amino acid, ATP, and tRNA. The downside of this assay is the lack of sensitivity in the absence of a tRNA recycling mechanism (Fig. 2). When performing the assay with TyrRS, AMP deaminase, IMP dehydrogenase, and saturating substrates, First and Richardson observed little change in absorbance at 340 nm due to the rapid consumption of tRNATyr [56]. Increased absorbance at 340 nm was observed upon introduction of cyclodityrosine synthase, which resulted in Tyr-tRNATyr deacylation and recycling for another enzymatic turnover [56].
Figure 4. Aminoacylation coupled to NAD+ reduction.

AMP produced from aminoacyl-transfer or from adenylate hydrolysis is converted to inosine monophosphate (IMP) by AMP deaminase. IMP dehydrogenase reduces NAD+ to NADH (ƛmax = 340 nm) to synthesize xanthosine monophosphate (XMP) from IMP.
Beyond TyrRS, the assay has the potential to be applied to other aaRSs if a tRNA recycling factor for the aa-tRNA can be identified. Post-transfer editing factors are candidates for recycling factors. Some editing factors have specificity for the amino acid moiety rather than specific tRNA identity elements [11]. For example, in the absence of prolyl-tRNA synthetase (ProRS), the Cys-tRNAPro deacylase, YbaK, deacylates Cys-tRNACys in vitro [57] and could be used to recycle tRNA during CysRS aminoacylation. Another example is alanyl-diacylglycerol synthase, which successfully recycled Ala-tRNAAla during a high-throughput drug screen of E. coli AlaRS using the malachite green approach [52]. More examples of reported tRNA deacylase activities are reviewed in [11,58].
2.5. Aminoacyl-tRNA biotinylation coupled to urea-PAGE and mass spectrometry
Gamper and Hou published a non-radioactive method for aminoacylation that exploits the strong affinity between biotin and streptavidin [59]. Following aminoacylation, tRNAs charged with amino acids other than Pro gain a reactive primary amine group via the newly-attached amino acid moiety. The assay uses N-hydroxy-sulfo-succinimido-biotin (sulfo-NHS-biotin) to react with the amino group of the acylated tRNA, which acts as a nucleophile and creates a stable amide linkage with the biotin. The biotin-aa-tRNA is then incubated with a molar excess of streptavidin and analyzed by urea-PAGE. tRNAs that have been aminoacylated and successfully conjugated with biotin will be bound by streptavidin resulting in an observable band shift when compared to the mobility of free tRNA. In the absence of conjugation and streptavidin binding, aa-tRNAs would need to be resolved under acidic conditions, but even then, separation of charged and uncharged species is not always obvious [60]. The authors tested the method with E. coli aaRSs of both classes and various amino acids. aa-tRNA biotin labeling efficiencies ranged from 6% (Ser-tRNASer and fMet-tRNAMet) to 59% (Ala-tRNAAla) [59]. The applicability of the assay even extends to Pro-tRNAPro, which is expected to be weakly reactive with sulfo-NHS-biotin because Pro contains a secondary amine. Pro-tRNAPro biotin conjugation was ~30% efficient [59]. The benefit of this assay is the ability to saturate the aaRS with amino acid or tRNA to determine kcat and KM [29]. The method was performed with E. coli TyrRS using a range of tRNA concentrations. Maximal aminoacylation rates were achieved at 6 μM tRNATyr [59]. After fitting the data to the Michaelis-Menten equation, the kinetic parameters were comparable to those obtained with [3H]-Tyr: kcat/KM of 2.4 μM−1s−1 obtained with the biotin workflow versus a catalytic efficiency of 1.5 μM−1s−1 reported by the radioactive approach [59]. The drawback of this assay in comparison to other non-radioactive methods is that it would be difficult to adapt to a high-throughput format.
Very recently, a similar biotinylation approach was described using electrospray ionization mass spectrometry (ESI-MS) to quantify the amount of charged tRNA following aminoacylation [61]. In this workflow, aminoacylated tRNA is reacted with sulfo-NHS-biotin and then digested to nucleosides by RNase A. The nucleosides are separated from RNase A using a 3 kDa molecular-weight cutoff filter prior to ESI-MS analysis. The utility of this workflow is limited as kinetic parameters would be difficult to obtain and the method is not easily scalable for use in high-throughput drug screening.
3. Strategies for detecting aminoacylation and aminoacyl-tRNA editing in cells
Importance of cell-based tRNA studies
For in vitro assays, tRNAs are typically transcribed using T7 RNA polymerase [62,63]. The advantages of in vitro transcription (IVT) include obtaining high concentrations of specific tRNAs without complex purification steps and the use of a cell-free system to prevent contamination with other proteins or RNAs that may inhibit downstream analyses. The major limitation of IVT is that the tRNAs are unmodified and may contain heterogenous 5′ and 3′ ends necessitating the need for additional steps like the use of hammerhead or other ribozymes to produce correct full-length tRNAs [64–66]. Native tRNAs are post-transcriptionally modified with each eukaryotic tRNA species containing an average of 13 modifications [67,68]. In some cases, like tRNAGlu, modification of the U34 in the anticodon loop is necessary to stabilize the tRNAGlu tertiary structure and for GluRS recognition and aminoacylation [69]. Although in vitro assays yield information about the rate of aminoacylation and editing by aaRSs with different tRNA species, it is difficult to extrapolate this to physiological tRNA aminoacylation due to the lack of modifications. Several methods have been developed to isolate native tRNAs from cells as discussed below.
The use of native tRNA isolated from cells provides more accurate information about aminoacylation with both cognate and non-cognate amino acids than in vitro studies using IVT tRNAs. The presence of modifications on tRNA may provide an extra layer of recognition causing the aaRS to reject noncognate tRNAs [70]. In addition, cellular elongation factors, like EF-Tu in prokaryotes or EF-1α in eukaryotes, bind to and protect aminoacylated tRNAs in vivo and transport them to the ribosome to participate in translation [71–73]. Misaminoacylated tRNAs bind sub-optimally to EF-Tu compared to the correctly charged aa-tRNAs and without this protection, they may undergo spontaneous deacylation or repeated sampling by editing domains to correct the error [74]. For example, AlaRS misaminoacylates both Ser and Gly on tRNAAla in vitro [75,76]; however, in vivo studies in E. coli rarely detect Ala-to-Gly mistranslation due to the presence of a robust editing enzyme, D-aminoacyl-tRNA deacylase (DTD) [77]. Thus, the levels of misaminoacylation by an aaRS in vitro may not represent the in vivo levels of misaminoacylation.
Genetic mutations of aaRSs can also result in increased levels of misaminoacylation resulting in mistranslated protein with loss of activity. For example, an Ala734Glu mutation in the proofreading domain of AlaRS in mice causes neurodegeneration resulting from reduced translational accuracy and increased protein misfolding and aggregation [18,19]. AaRS mutations may also cause decreased levels of aminoacylated tRNAs. Deacylated tRNAs are known to trigger a stress response due to interaction with a protein kinase like GCN2 that activates a signalling cascade causing ribosome stalling, lower protein production and lower metabolism leading to a disease phenotype [78,79]. Studies have revealed that the identity of tRNA pools in cells is not always constant and changes between different cell types and under different stress conditions [80]. High-throughput tRNA sequencing of Saccharomyces cerevisae revealed that oxidative and alkylation stress caused significant changes in the levels of about half of the 76 expressed tRNA species [81].
To better understand the levels of aminoacylation by a particular aaRS, the preference for charging one tRNA isoacceptor/isodecoder over another, the levels of in vivo misaminoacylation, and changes in aminoacylation under stress conditions, high throughput methods to assess the cellular pools of tRNA are necessary.
Methods to investigate cellular tRNAs
3.1. Isolation and Identification of aa-tRNAs from cells
tRNA is the most abundant small non-coding RNA and comprises 10–15% of the total intracellular RNA pool [82]. The total RNA fraction of a cell can first be isolated following lysis by chemical or physical methods [83]. Addition of phenol-chloroform to a cell lysate will result in the separation of nucleic acids (aqueous phase) from lipids (organic phase) and proteins (interphase). Acidic guanidium isothiocyanate-phenol-chloroform sold commercially as “TRIzol” is commonly used to isolate RNA from cells [84]. Under acidic conditions (pH 4–6), DNA is partitioned into the organic phase while RNA remains in the aqueous layer. The acidic conditions also preserve the aminoacylation state of native tRNA [83]. The RNA can then be precipitated using an equal volume of isopropanol. This procedure isolates all cellular RNAs including tRNAs, rRNAs, mRNAs and other small non-coding RNAs.
To obtain a pure tRNA pool free of contaminating larger RNA, lithium chloride (LiCl) precipitation is used. LiCl effectively precipitates RNA molecules of a 100 nt or larger but does not precipitate tRNA molecules that are between 65–94 nt in length [85]. The tRNA pool can be cleaned up further using ion exchange chromatography to remove small non-coding RNAs and/or nucleotides [86]. tRNA molecules are generally eluted from an anion exchange column at NaCl concentrations of 400–600 mM [86,87]. These fractions are collected and precipitated with isopropanol for further analysis.
The fraction containing all cellular tRNAs can be purified further to obtain a single tRNA isoacceptor species using affinity chromatography for downstream applications like in vitro aminoacylation or structural studies. To purify a specific tRNA isoacceptor, a 5′-amino modified DNA oligonucleotide that is complementary to the 5′ 30 nt of the target tRNA is complexed to an N-hydroxysuccimide (NHS)-activated sepharose column [88]. The matrix of this column contains an NHS group that couples with the 5′-amine-containing DNA to produce a stable amide linkage. The tRNA pool that has been partially purified by anion exchange chromatography is introduced into the DNA affinity column. This allows for specific binding of the desired tRNA while the other tRNA species pass through the column. After washing to remove unbound molecules, the desired tRNA isoacceptor is eluted from the column by increasing the temperature of the column to 75°C to denature the tRNA-DNA interaction [88]. The eluant is concentrated and precipitated with isopropanol to obtain pure fractions of specific tRNA isoacceptors.
3.2. Isoacceptor specific aminoacylation profiling (ISAP) of tRNAs in cells
Misaminoacylation by aaRSs leading to altered aa-tRNA pools is a hallmark of several aaRS-associated genetic diseases [16]. While the identity of non-cognate amino acids charged by an aaRS onto a tRNA can be characterized in vitro, it is important to identify whether these misacylated tRNA species exist within the cellular context. The ISAP method allows analysis of global misaminoacylation of any tRNA isoacceptor (Fig. 5A) [89]. Small RNAs including tRNAs are isolated under acidic conditions as described above to prevent deacylation of the tRNA. Biotinylated DNA oligonucleotide probes (20–40 nt in length) are designed to be complementary to the tRNA isoacceptor of interest with minimum off-target complementarity to enable specific pulldown of the desired tRNA isoacceptor. The DNA probe is added to the isolated RNA pool and incubated to allow hybridization. Streptavidin-conjugated paramagnetic particles (SA-PMPs) are used to pull down the desired aa-tRNA/DNA hybrid. The SA-PMPs are then extensively washed to remove all contaminating aa-tRNAs, nucleotides (nt) and amino acids. After washing, aa-tRNA/DNA hybrid-bound SA-PMPs are treated with ammonium formate at pH 10. Under these basic conditions, the bound amino acid is released from the tRNA and identified by mass spectrometry [89]. ISAP can thus be used to identify the amino acids attached to a particular tRNA isoacceptor in cells. ISAP can also be used for the relative quantification of misaminoacylation of a specific tRNA between wild-type cells and cells expressing a mutant aaRS.
Figure 5. Methods to assess tRNA aminoacylation from cells.

(A) Isoacceptor specific aminoacylation profiling (ISAP). Specific tRNA isoacceptors are hybridized with complementary biotinylated DNA oligonucleotides and pulled down with streptavidin-paramagnetic particles (SA-PMPs). The amino acids bound to tRNA are then released and can be detected by mass spectrometry. (B) Oxidation coupled to poly-A polymerase assay (OXOPAP). The tRNA pool isolated from cells is oxidized and deacylated to differentiate between charged and uncharged tRNAs. Poly(A) polymerase then adds a poly(A) tail onto the 3′-end of formerly charged tRNAs. This is followed by reverse transcription to make cDNA, PCR and sequencing to determine the charging levels. (C) High-throughput tRNA sequencing. The tRNA pool isolated from cells is oxidized and subjected to β-elimination and T4 polynucleotide kinase treatment to produce heterogenous 3′-ends. An Illumina adaptor is ligated onto the 3′-end of tRNA with the help of a split oligonucleotide. This is followed by reverse transcription with TGIRT/MarathonRT to make cDNA, PCR, and Illumina sequencing to determine isoacceptor sequence and charging levels.
While ISAP offers many advantages, several caveats must be considered. First, ISAP requires that the sequence of the tRNA is known. It is also difficult to assay rare or low expression tRNA isoacceptors using this method. Proper probe design is also vital for the success of ISAP. Often tRNA isoacceptors are so similar in sequence that it may be impossible to design probes to discriminate between them. Additionally, tRNA modifications may destabilize probe hybridization; when designing the probe, care should be taken to select a probe target sequence that has few tRNA base modifications. Since well-designed probes only recover about 50% of the aa-tRNA, absolute quantification of aminoacylation cannot be achieved using ISAP. Finally, since aa-tRNA undergoes spontaneous deacylation at higher temperatures, the hybridization temperature should be optimized to ensure maximum recovery of the aa-tRNAs [89].
3.3. Oxidation coupled to poly-A polymerase assay (OXOPAP)
The major limitation of ISAP to determine aminoacylation levels in cells is failure of the designed probes to discriminate against tRNA isoacceptors with high sequence similarity [89]. OXOPAP is a PCR-based method to identify the aminoacylation of specific tRNA isoacceptors without the use of a probe. OXOPAP instead uses periodate oxidation coupled with poly(A) polymerization to discriminate between aminoacylated and deacylated tRNA species (Fig. 5B) [90]. Small RNAs are first isolated from cells under acidic conditions to maintain their aminoacylation state. The RNA pool is then treated with sodium m-periodate, which is a strong oxidizer capable of reacting with the 3′-end ribose hydroxyl groups of RNA to produce a dialdehyde. If the tRNA is aminoacylated, the amino acid protects the 3′ ribose from oxidation [91]. The tRNA population is then deacylated by increasing the pH and treated with poly(A) polymerase, which adds adenosines to the 3′ end of RNAs in a sequence-independent manner. The presence of a dialdehyde at the 3′ end of tRNA prevents the addition of adenosines. Poly(A) polymerase is therefore able to discriminate between aminoacylated and deacylated tRNA species and only adds adenosines to the 3′ end of formerly aminoacylated tRNAs. The poly(A) tail on these tRNAs is then used as a template for reverse transcription using an oligo(dT) primer containing a “tag” sequence. Following reverse transcription, PCR is performed with a primer complementary to the “tag” sequence and another primer complementary to the 5′ end of the desired tRNA to determine the concentration of the aminoacylated tRNA isoacceptor [90]. A control reaction is also performed where the isolated cellular tRNAs are deacylated followed by poly(A) adenylation, reverse transcription and PCR to determine the total intracellular concentration of the desired tRNA isoacceptor. Comparing the control reaction to the test reaction will lead to the quantification of the level of aminoacylation of known tRNA isoacceptors in cells.
While the OXOPAP method is used to assess the level of aminoacylation of known tRNA isoacceptors, the assay can be modified to determine the identity of a charged tRNA isoacceptor of unknown sequence. This is accomplished by isolating total tRNA from cells followed by base-mediated deacylation of the tRNA pool. The tRNA pool is then charged with an amino acid of choice in vitro using a purified aaRS. The tRNAs are then oxidized with sodium m-periodate followed by poly(A) polymerization and reverse transcription using a tagged-oligo(dT) primer. Following reverse transcription, cDNAs (above 70 nt) are gel purified and isolated using phenol-chloroform extraction. An anchor oligonucleotide adaptor is ligated to the 3′-end of purified cDNAs using T4 RNA ligase. PCR is then performed as described previously using primers complementary to the 5′ “tag” and the 3′ adaptor sequences followed by sequencing [92]. Since the sequence of the tRNA isoacceptor does not need to be known at the start, the assay allows for the identification of all the tRNA isoacceptors charged with an amino acid of interest. OXOPAP can therefore be used to quantify the cellular levels of aminoacylation of a particular tRNA isoacceptor and also identify novel tRNA isoacceptors for any given amino acid. The major limitation of OXOPAP is that tRNA modifications may interfere with the efficiency of reverse transcription preventing absolute quantification of aminoacylation. Additionally, oxidation of tRNA with sodium m-periodate needs to optimized as increased concentration of the oxidant or increased time of oxidation may lead to degradation of tRNA yielding poor results.
3.4. High-throughput tRNA sequencing (tRNA-seq)
Several methods to measure the aminoacylation levels of tRNAs isolated from cells have been developed. Classical methods include separating the charged and uncharged tRNAs on an acidic denaturing polyacrylamide gel followed by northern blotting to quantify the charged fraction of a specific tRNA species [93]. Other methods like ISAP and OXOPAP allow the identification and/or the estimation of aminoacylation levels of single tRNA isoacceptors. However, these methods have several limitations including insufficient band separation on acidic gels, low sensitivity, cross-hybridization of probes and low throughput [89,90,94]. With the advent of next-generation sequencing, advances have been made in quantifying tRNA abundance and charging levels. High-throughput tRNA sequencing is challenging due to extensive base modifications and the stable three-dimensional structure of tRNAs [95]. Incorporating biochemical steps like demethylation to remove RNA base modifications [96], use of highly processive reverse transcriptases (RTs), splint ligation to improve adaptor ligation bias, better alignment algorithms to reduce errors in read mapping [97] and 3′-end periodate oxidation to differentiate between charged and uncharged tRNA have allowed for quantification of tRNA abundance, aminoacylation levels and base modifications in a single sequencing run (Fig. 5C) [98].
The procedure of tRNA-seq begins with the isolation of total RNA from cells under acidic conditions to maintain the aminoacylation status of the tRNAs. The RNA pool is then treated with sodium m-periodate followed by β-elimination under basic pH conditions resulting in removal of the 3′-A of the oxidized uncharged tRNA and leaving behind a 3′-phosphate at the now terminal 3′-C residue [95]. The 3′ phosphate is removed using T4 polynucleotide kinase, which in addition to 5’ kinase activity possesses 3′ phosphatase activity [99]. For charged tRNAs, the β-elimination results in the removal of the amino acid. Thus, after periodate treatment and β-elimination, the uncharged tRNAs have a 3′-CC end while the charged tRNAs have a 3′-CCA end. Next, the RNAs are treated with a mixture of E. coli wild-type and D135S AlkB demethylases in a ratio of 4:5 to remove methyl groups at the N1 position of A and G and the N3 position of C [96]. These base modifications disrupt Watson-Crick base pairing and can lead to RT stalling, misincorporation or RT fall-off [68]. After the demethylase treatment, a thermostable highly processive RT like TGIRT is used to produce cDNA. A DNA/RNA hybrid containing an Illumina primer binding site and an overhang that binds to the 3′-end of tRNA is added to the reaction to serve as an RT primer for the TGIRT template-switching mechanism [95]. Recently, it has been reported that an adaptor sequence containing the RT and the Illumina primer binding sites can be directly ligated to the 3′-end of tRNA. A splint oligonucleotide is designed to bind to the 3′-CCA/CC overhang on tRNA and to the 5′-end of the adaptor bringing the two in close proximity and ensuring maximum ligation efficiency [97]. After adaptor ligation and RT, the cDNA product is circularized using CircLigase II. MarathonRT, an ultraprocessive and accurate RT may also be employed to increase read depth and capture low expression tRNA isoacceptors [100,101]. Recently, a commercially available group II-intron RT, InduroRT, has been reported to increase efficiency of tRNA profiling by removing RT stops [102]. A final PCR is then performed to attach Illumina barcodes for multiplex sequencing [95]. The sequencing results are analysed using custom Python algorithms available online that remove artifacts, trim primers and adaptors and map the reads to the different tRNA isoacceptor sequences to quantify the abundance of each tRNA [97]. Since the charged tRNAs have a 3′-CCA end and the uncharged tRNAs have a 3′-CC end, the aminoacylation levels of tRNA can also be accurately determined. Some RTs are capable of reading through tRNA base modifications leaving behind a mutation signature when compared to the tRNA reference sequence. Thus, new updates to the algorithms incorporating a single-nucleotide polymorphism-tolerant alignment are being developed to improve read mapping and allow for the identification of base modification positions [98].
4. Summary and Outlook
The increasing prevalence of antimicrobial drug resistance necessitates the need for novel therapeutic targets and the essentiality and unique domain structure in some pathogens makes aaRSs attractive candidates. The in vitro methods for measuring aaRS activity discussed in this review are far less sensitive compared to the traditional radioactive assays and require higher concentrations of the enzyme and substrates. These methods also produce higher background signals compared to the radioactive assays making estimation of kinetic parameters difficult. Advances in fluorophore chemistry to reduce background and increase sensitivity could make these methods more accurate in the future. While traditional radioactive aminoacylation assays are still necessary for the accurate estimation of aaRS kinetic parameters, the coupled and cell-based assays described in this review are scalable and meet the needs of high-throughput drug screening.
Advances in tRNA sequencing enable analysis of aaRS function in the context of particular disease states, cell types, environmental stresses, and in the presence of a potential drug. tRNA sequencing is a high-throughput method limited primarily by read depth and challenges in accurate alignment. The discovery of more processive reverse transcriptases, like MarathonRT, has allowed more complete cDNA synthesis and better read depth, and improvements in computational algorithms to better align the reads has lead to more accurate identification of tRNAs. Taken together, these methods enable a systems-level analysis of the biological functions and dynamics of aaRS and tRNA populations and may be used as diagnostic tools for human diseases.
Acknowledgments
Work on aminoacyl-tRNA synthetases in the K.M.-F. lab is supported by National Institutes of Health grant R35 GM141880.
References
- [1].Ling J, Reynolds N, Ibba M, Annu Rev Microbiol 2009, 63, 61–78. [DOI] [PubMed] [Google Scholar]
- [2].Ibba M, Söll D, Annu Rev Biochem 2000, 69, 617–650. [DOI] [PubMed] [Google Scholar]
- [3].Rubio Gomez MA, Ibba M, RNA 2020, 26, 910–936. [DOI] [PMC free article] [PubMed] [Google Scholar]
- [4].Fersht AR, Biochemistry 1977, 16, 1025–1030. [DOI] [PubMed] [Google Scholar]
- [5].Mascarenhas AP, An S, Rosen AE, Martinis SA, Musier-Forsyth K, in: Köhrer C, RajBhandary UL (eds) Protein Eng. Nucleic Acids and Molecular Biology, vol 22. Springer, Berlin, Heidelberg, 2009, pp. 155–203. [Google Scholar]
- [6].Yadavalli SS, Ibba M, Nucleic Acids Res 2013, 41, 1104–1112. [DOI] [PMC free article] [PubMed] [Google Scholar]
- [7].Zhang C-M, Perona JJ, Ryu K, Francklyn C, Hou Y-M, J Mol Biol 2006, 361, 300–311. [DOI] [PubMed] [Google Scholar]
- [8].An S, Musier-Forsyth K, J Biol Chem 2004, 279, 42359–42362. [DOI] [PubMed] [Google Scholar]
- [9].Ling J, So BR, Yadavalli SS, Roy H, Shoji S, Fredrick K, Musier-Forsyth K, Ibba M, Mol Cell 2009, 33, 654–660. [DOI] [PMC free article] [PubMed] [Google Scholar]
- [10].Liu Z, Vargas-Rodriguez O, Goto Y, Novoa EM, Ribas de Pouplana L, Suga H, Musier-Forsyth K, Proc Natl Acad Sci. U.S.A 2015, 112, 6027–6032. [DOI] [PMC free article] [PubMed] [Google Scholar]
- [11].Kuzmishin Nagy AB, Bakhtina M, Musier-Forsyth K, Enzymes 2020, 69–115. [DOI] [PubMed] [Google Scholar]
- [12].Park SG, Schimmel P, Kim S, Proc Natl Acad Sci. U.S.A 2008, 105, 11043–11049. [DOI] [PMC free article] [PubMed] [Google Scholar]
- [13].Sauter C, Lorber B, Gaudry A, Karim L, Schwenzer H, Wien F, Roblin P, Florentz C, Sissler M, Sci Rep 2015, 5, 17332. [DOI] [PMC free article] [PubMed] [Google Scholar]
- [14].Jin D, Wek SA, Kudlapur NT, Cantara WA, Bakhtina M, Wek RC, Musier-Forsyth K, J Biol Chem 2021, 297, 101203. [DOI] [PMC free article] [PubMed] [Google Scholar]
- [15].Sissler M, J Biol Chem 2021, 297, 101386. [DOI] [PMC free article] [PubMed] [Google Scholar]
- [16].Turvey AK, Horvath GA, Cavalcanti ARO, Front Physiol 2022, 13, 1029218. [DOI] [PMC free article] [PubMed] [Google Scholar]
- [17].Burgess RW, Storkebaum E, Annu Rev Cell Dev Biol 2023, 39, 223–252. [DOI] [PubMed] [Google Scholar]
- [18].Lee JW, Beebe K, Nangle LA, Jang J, Longo-Guess CM, Cook SA, Davisson MT, Sundberg JP, Schimmel P, Ackerman SL, Nature 2006, 443, 50–55. [DOI] [PubMed] [Google Scholar]
- [19].Liu Y, Satz JS, Vo M-N, Nangle LA, Schimmel P, Ackerman SL, Proc Natl Acad Sci. U.S.A 2014, 111, 17570–17575. [DOI] [PMC free article] [PubMed] [Google Scholar]
- [20].Nakayama T, Wu J, Galvin-Parton P, Weiss J, Andriola MR, Hill RS, Vaughan DJ, El-Quessny M, Barry BJ, Partlow JN, Barkovich AJ, Ling J, Mochida GH, Hum Mutat 2017, 38, 1348–1354. [DOI] [PMC free article] [PubMed] [Google Scholar]
- [21].Zhang H, Wu J, Lyu Z, Ling J, Nucleic Acids Res 2021, 49, 9953–9964. [DOI] [PMC free article] [PubMed] [Google Scholar]
- [22].Giegé R, Springer M, EcoSal Plus 2016, 7. [DOI] [PMC free article] [PubMed] [Google Scholar]
- [23].Kwon NH, Fox PL, Kim S, Nat Rev Drug Discov 2019, 18, 629–650. [DOI] [PubMed] [Google Scholar]
- [24].Lukarska M, Palencia A, 2020, 48, 321–350. [DOI] [PubMed] [Google Scholar]
- [25].Parrot C, Moulinier L, Bernard F, Hashem Y, Dupuy D, Sissler M, J Biol Chem 2021, 297, 100913. [DOI] [PMC free article] [PubMed] [Google Scholar]
- [26].Nasim F, Qureshi IA, ACS Omega 2023, 8, 14884–14899. [DOI] [PMC free article] [PubMed] [Google Scholar]
- [27].Gill J, Sharma A, J Biol Chem 2023, 299, 102860. [DOI] [PMC free article] [PubMed] [Google Scholar]
- [28].Hoagland MB, Stephenson ML, Scott JF, Hecht LI, Zamecnik PC, J Biol Chem 1958, 231, 241–57. [PubMed] [Google Scholar]
- [29].Francklyn CS, First EA, Perona JJ, Hou Y-M, Methods 2008, 44, 100–118. [DOI] [PMC free article] [PubMed] [Google Scholar]
- [30].Splan KE, Musier-Forsyth K, Boniecki MT, Martinis SA, Methods 2008, 44, 119–128. [DOI] [PMC free article] [PubMed] [Google Scholar]
- [31].Ledoux S, Uhlenbeck OC, Methods 2008, 44, 74–80. [DOI] [PMC free article] [PubMed] [Google Scholar]
- [32].Murakami H, Ohta A, Goto Y, Sako Y, Suga H, Nucleic Acids Symp Ser 2006, 50, 35–36. [DOI] [PubMed] [Google Scholar]
- [33].Ohuchi M, Murakami H, Suga H, Nucleic Acids Symp Ser 2006, 50, 299–300. [DOI] [PubMed] [Google Scholar]
- [34].Ohuchi M, Murakami H, Suga H, Curr Opin Chem Biol 2007, 11, 537–542. [DOI] [PubMed] [Google Scholar]
- [35].Niwa N, Yamagishi Y, Murakami H, Suga H, Bioorg Med Chem Lett 2009, 19, 3892–3894. [DOI] [PubMed] [Google Scholar]
- [36].Morimoto J, Hayashi Y, Iwasaki K, Suga H, Acc Chem Res 2011, 44, 1359–1368. [DOI] [PubMed] [Google Scholar]
- [37].Coronado JN, Ngo P, Anslyn EV, Ellington AD, Cell Chem Biol 2022, 29, 1071–1112. [DOI] [PubMed] [Google Scholar]
- [38].Das M, Vargas-Rodriguez O, Goto Y, Suga H, Musier-Forsyth K, Nucleic Acids Res 2014, 42, 3943–3953. [DOI] [PMC free article] [PubMed] [Google Scholar]
- [39].Danhart EM, Bakhtina M, Cantara WA, Kuzmishin AB, Ma X, Sanford BL, Vargas-Rodriguez O, Košutić M, Goto Y, Suga H, Nakanishi K, Micura R, Foster MP, Musier-Forsyth K, Proc Natl Acad Sci. U.S.A 2017, 114, E6774–E6783. [DOI] [PMC free article] [PubMed] [Google Scholar]
- [40].Bacusmo JM, Kuzmishin AB, Cantara WA, Goto Y, Suga H, Musier-Forsyth K, RNA Biol 2018, 15, 576–585. [DOI] [PMC free article] [PubMed] [Google Scholar]
- [41].Vargas-Rodriguez O, Bakhtina M, McGowan D, Abid J, Goto Y, Suga H, Musier-Forsyth K, J Biol Chem 2020, 295, 16180–16190. [DOI] [PMC free article] [PubMed] [Google Scholar]
- [42].Ma X, Bakhtina M, Shulgina I, Cantara WA, Kuzmishin Nagy AB, Goto Y, Suga H, Foster MP, Musier-Forsyth K, Nucleic Acids Res 2023, 51, 3988–3999. [DOI] [PMC free article] [PubMed] [Google Scholar]
- [43].Cui Z, Johnston WA, Alexandrov K, Front Bioeng Biotechnol 2020, 8, 1031. [DOI] [PMC free article] [PubMed] [Google Scholar]
- [44].Goto Y, Suga H, Acc Chem Res 2021, 54, 3604–3617. [DOI] [PubMed] [Google Scholar]
- [45].Goto Y, Suga H Methods Mol Biol 2023, 2670, 255–266. [DOI] [PubMed] [Google Scholar]
- [46].Chen J, Chen M, Zhu TF, Chem 2021, 7, 786–798. [Google Scholar]
- [47].Katoh T, Suga H, Nucleic Acids Res 2019, 47, e54–e54. [DOI] [PMC free article] [PubMed] [Google Scholar]
- [48].Lloyd AJ, Thomann H-U, Ibba M, Söll D, Nucleic Acids Res 1995, 23, 2886–2892. [DOI] [PMC free article] [PubMed] [Google Scholar]
- [49].Grube CD, Roy H, RNA Biol 2018, 15, 659–666. [DOI] [PMC free article] [PubMed] [Google Scholar]
- [50].Baykov AA, Evtushenko OA, Avaeva SM, Anal Biochem 1988, 171, 266–270. [DOI] [PubMed] [Google Scholar]
- [51].Cestari I, Stuart K, SLAS Discovery 2013, 18, 490–497. [DOI] [PMC free article] [PubMed] [Google Scholar]
- [52].Grube CD, Roy H, SLAS Discovery 2016, 21, 722–728. [Google Scholar]
- [53].Saint-Léger A, Ribas de Pouplana L, Methods 2017, 113, 34–45. [DOI] [PubMed] [Google Scholar]
- [54].Mondal S, Hsiao K, Goueli SA, Assay Drug Dev Technol 2017, 15, 330–341. [DOI] [PubMed] [Google Scholar]
- [55].Kim S-H, Bae S, Song M, Biomolecules 2020, 10, 1625. [DOI] [PMC free article] [PubMed] [Google Scholar]
- [56].First EA, Richardson CJ, Methods 2017, 113, 3–12. [DOI] [PubMed] [Google Scholar]
- [57].Chen L, Tanimoto A, So BR, Bakhtina M, Magliery TJ, Wysocki VH, Musier-Forsyth K, Nucleic Acids Res 2019, 47, 929–940. [DOI] [PMC free article] [PubMed] [Google Scholar]
- [58].Jani J, Pappachan A, Int J Biol Macromol 2022, 199, 252–263. [DOI] [PubMed] [Google Scholar]
- [59].Gamper H, Hou Y-M, Genes (Basel) 2020, 11, 1173. [DOI] [PMC free article] [PubMed] [Google Scholar]
- [60].Köhrer C, RajBhandary UL, Methods 2008, 44, 129–138. [DOI] [PMC free article] [PubMed] [Google Scholar]
- [61].Finkler M, Brandt J, Boutfol T, Grimm F, Hartz P, Ott A, STAR Protoc 2023, 4, 102504. [DOI] [PMC free article] [PubMed] [Google Scholar]
- [62].Milligan JF, Uhlenbeck OC, Methods Enzymol 1989, 180, 51–62. [DOI] [PubMed] [Google Scholar]
- [63].Brunelle JL, Green R, Methods Enzymol 2013, 530, 101–114. [DOI] [PubMed] [Google Scholar]
- [64].Pleiss JA, Derrick ML, Uhlenbeck OC, RNA 1998, 4, 1313–1317. [DOI] [PMC free article] [PubMed] [Google Scholar]
- [65].Webb C-HT, Lupták A, RNA Biol 2011, 8, 719–727. [DOI] [PMC free article] [PubMed] [Google Scholar]
- [66].Scott WG, Horan LH, Martick M, Prog Mol Biol Transl Sci 2013, 120, 1–23. [DOI] [PMC free article] [PubMed] [Google Scholar]
- [67].Gu C, Begley TJ, Dedon PC, FEBS Lett 2014, 588, 4287–4296. [DOI] [PMC free article] [PubMed] [Google Scholar]
- [68].Jackman JE, Alfonzo JD, WIREs RNA 2013, 4, 35–48. [DOI] [PMC free article] [PubMed] [Google Scholar]
- [69].Madore E, Florentz C, Giegé R, Sekine S, Yokoyama S, Lapointe J, Eur J Biochem 1999, 266, 1128–1135. [DOI] [PubMed] [Google Scholar]
- [70].Suzuki T, Nat Rev Mol Cell Biol 2021, 22, 375–392. [DOI] [PubMed] [Google Scholar]
- [71].Nissen P, Kjeldgaard M, Thirup S, Polekhina G, Reshetnikova L, Clark BFC, Nyborg J, Science 1995, 270, 1464–1472. [DOI] [PubMed] [Google Scholar]
- [72].Burnett BJ, Altman RB, Ferguson A, Wasserman MR, Zhou Z, Blanchard SC, J Biol Chem 2014, 289, 23917–23927. [DOI] [PMC free article] [PubMed] [Google Scholar]
- [73].Maruyama K, Imai H, Kawamura M, Ishino S, Ishino Y, Ito K, Uchiumi T, Sci Rep 2019, 9, 14761. [DOI] [PMC free article] [PubMed] [Google Scholar]
- [74].LaRiviere FJ, Wolfson AD, Uhlenbeck OC, Science 2001, 294, 165–168. [DOI] [PubMed] [Google Scholar]
- [75].Tsui W-C, Fersht AR, Nucleic Acids Res 1981, 9, 4627–4637. [DOI] [PMC free article] [PubMed] [Google Scholar]
- [76].Guo M, Chong YE, Shapiro R, Beebe K, Yang X-L, Schimmel P, Nature 2009, 462, 808–812. [DOI] [PMC free article] [PubMed] [Google Scholar]
- [77].Pawar KI, Suma K, Seenivasan A, Kuncha SK, Routh SB, Kruparani SP, Sankaranarayanan R, Elife 2017, 6, e24001. [DOI] [PMC free article] [PubMed] [Google Scholar]
- [78].Hinnebusch AG, Annu Rev Microbiol 2005, 59, 407–450. [DOI] [PubMed] [Google Scholar]
- [79].Mohler K, Ibba M, Nat Microbiol 2017, 2, 17117. [DOI] [PMC free article] [PubMed] [Google Scholar]
- [80].Rak R, Polonsky M, Eizenberg-Magar I, Mo Y, Sakaguchi Y, Mizrahi O, Nachshon A, Reich-Zeliger S, Stern-Ginossar N, Dahan O, Suzuki T, Friedman N, Pilpel Y, Proc Natl Acad Sci. U.S.A 2021, 118, e2106556118. [DOI] [PMC free article] [PubMed] [Google Scholar]
- [81].Pang YLJ, Abo R, Levine SS, Dedon PC, Nucleic Acids Res 2014, 42, e170–e170. [DOI] [PMC free article] [PubMed] [Google Scholar]
- [82].Grewal SS, Biochim Biophys Acta, Gene Regul Mech 2015, 1849, 898–907. [DOI] [PubMed] [Google Scholar]
- [83].Ali N, de R Rampazzo CP, Costa ADT, Krieger MA, Biomed Res Int 2017, 2017, 1–13. [DOI] [PMC free article] [PubMed] [Google Scholar]
- [84].Chomzynski P, Sacchi N, Anal Biochem 1987, 162, 156–159. [DOI] [PubMed] [Google Scholar]
- [85].Walker SE, Lorsch J, Methods Enzymol 2013, 530, 337–343. [DOI] [PubMed] [Google Scholar]
- [86].Cummins PM, Rochfort KD, O’Connor BF, Methods Mol Biol 2017, 1485, 209–223. [DOI] [PubMed] [Google Scholar]
- [87].Guenther RH, Hara Gopal D, Agris PF, J Chromatogr A 1988, 444, 79–87. [DOI] [PubMed] [Google Scholar]
- [88].Drino A, Oberbauer V, Troger C, Janisiw E, Anrather D, Hartl M, Kaiser S, Kellner S, Schaefer MR, RNA Biol 2020, 17, 1104–1115. [DOI] [PMC free article] [PubMed] [Google Scholar]
- [89].Mohler K, Mann R, Ibba M, Methods 2017, 113, 127–131. [DOI] [PMC free article] [PubMed] [Google Scholar]
- [90].Gaston KW, Rubio MAT, Alfonzo JD, Methods 2008, 44, 170–175. [DOI] [PubMed] [Google Scholar]
- [91].Hunt J, Biochem J 1965, 95, 541–551. [DOI] [PMC free article] [PubMed] [Google Scholar]
- [92].Kapushoc ST, Alfonzo JD, Simpson L, RNA 2002, 8, 57–68. [DOI] [PMC free article] [PubMed] [Google Scholar]
- [93].Varshney U, Lee CP, RajBhandary UL, J Biol Chem 1991, 266, 24712–24718. [PubMed] [Google Scholar]
- [94].Sørensen MA, J Mol Biol 2001, 307, 785–798. [DOI] [PubMed] [Google Scholar]
- [95].Evans ME, Clark WC, Zheng G, Pan T, Nucleic Acids Res 2017, 45, e133–e133. [DOI] [PMC free article] [PubMed] [Google Scholar]
- [96].Zheng G, Qin Y, Clark WC, Dai Q, Yi C, He C, Lambowitz AM, Pan T, Nat Methods 2015, 12, 835–837. [DOI] [PMC free article] [PubMed] [Google Scholar]
- [97].Davidsen K, Sullivan LB, bioRxiv 2023. doi: 10.1101/2023.07.31.551363 [DOI] [Google Scholar]
- [98].Hernandez-Alias X, Katanski CD, Zhang W, Assari M, Watkins CP, Schaefer MH, Serrano L, Pan T, Nucleic Acids Res 2023, 51, e17–e17. [DOI] [PMC free article] [PubMed] [Google Scholar]
- [99].Wang LK, EMBO J 2002, 21, 3873–3880. [DOI] [PMC free article] [PubMed] [Google Scholar]
- [100].Zhao C, Liu F, Pyle AM, RNA 2018, 24, 183–195. [DOI] [PMC free article] [PubMed] [Google Scholar]
- [101].Guo L-T, Adams RL, Wan H, Huston NC, Potapova O, Olson S, Gallardo CM, Graveley BR, Torbett BE, Pyle AM, J Mol Biol 2020, 432, 3338–3352. [DOI] [PMC free article] [PubMed] [Google Scholar]
- [102].Nakano Y, Gamper H, McGuigan H, Maharjan S, Sun Z, Krishnan K, Yigit E, Li N-S, Piccirilli JA, Kleiner R, Nichols N, Hou Y-M, bioRxiv 2023. doi: 10.1101/2023.12.09.569604 [DOI] [PMC free article] [PubMed] [Google Scholar]