

Abstract
Cancer cells frequently alter their lipids to grow and adapt to their environment1–3. Despite the critical functions of lipid metabolism in membrane physiology, signaling, and energy production, how specific lipids contribute to tumorigenesis is incompletely understood. Here, using functional genomics and lipidomic approaches, we identified de novo sphingolipid synthesis as an essential pathway for cancer immune evasion. Synthesis of sphingolipids is surprisingly dispensable for cancer cell proliferation in culture or in immunodeficient mice but required for tumor growth in multiple syngeneic models. Blocking sphingolipid production in cancer cells enhances the anti-proliferative effects of natural killer (NK) and CD8+ T cells partly via interferon gamma (IFNγ) signaling. Mechanistically, depletion of glycosphingolipids increases surface levels of IFNγ receptor subunit 1 (Ifngr1), mediating IFNγ-induced growth arrest and proinflammatory signaling. Finally, pharmacological inhibition of glycosphingolipid synthesis synergizes with checkpoint blockade therapy to enhance anti-tumor immune response. Altogether, our work identifies glycosphingolipids as necessary and limiting metabolites for cancer immune evasion.
Lipids constitute a complex and diverse group of biomolecules critical for membrane homeostasis, signaling, and energy production4,5. Rapidly proliferating cancer cells require a constant supply of lipids to support cell growth and adaptation to their environment. Metabolic genes involved in the synthesis and uptake of lipids are downstream effectors of oncogenic alterations and are commonly upregulated in tumors6. These changes in lipid metabolism are also influenced by the tumor microenvironment (TME) and organismal metabolism. Indeed, hypoxic tumor cells increase lipid scavenging to compensate for reduced fatty acid desaturation2,3,7, and saturated lipids in the TME can protect cancer cells from oxidative damage1. Furthermore, dietary lipids obtained upon high fat feeding promote tumor initiation8,9, metastasis10,11, and immune evasion in mouse models12–14. In some instances, the tumorigenic effects of lipids are mediated by consequential alterations in the function of immune cells in the TME12,15. While excess lipids are often associated with tumor progression, precisely which lipid species contribute to tumorigenesis and immune evasion are poorly understood.
Sphingolipid synthesis promotes immune evasion
To identify lipid pathways involved in cancer immune evasion, we performed parallel in vivo genetic screens using HY15549, a Kras mutant mouse pancreatic ductal adenocarcinoma (PDAC) cell line transduced with a library containing sgRNAs targeting 296 genes involved in lipid metabolism pathways including fatty acid synthesis and oxidation, lipid scavenging, and cholesterol and phospholipid synthesis and salvage (Fig. 1a). These cells were engrafted into the flanks of C57BL/6J immunocompetent mice, myeloablated controls, and NOD-SCID gamma (NSG) mice which lack mature T, B, and natural killer (NK) cells (Fig. 1b). Of note, myeloablated mice were included to account for the metabolic and genetic differences between C57BL/6J and NSG mice (Extended Data Fig. 1a). Gene scores were calculated as the median log2 fold change in the abundance of all sgRNAs targeting each gene and differential gene essentiality was determined by comparing gene scores between the tumors grown in immunocompetent and immunocompromised mice. KEGG pathway analysis of the top 60 differentially essential genes in C57BL/6J compared to myeloablated C57BL/6J or NSG mice revealed synthesis of membrane lipids including sphingolipids, phosphatidylcholine and phosphatidylethanolamine as required for immune evasion (Fig. 1c–d, Extended Data Fig. 1b). An independent lipidomic analysis revealed a significant enrichment for sphingolipids in tumors grown in immunocompetent but not immunodeficient mice (Fig. 1e, Extended Data Fig. 1c–i). Given their upregulation in tumors and distinct roles in oncogenic functions, we focused our attention on understanding how sphingolipids mediate tumor immune evasion.
Figure 1. The essential role of sphingolipid synthesis in cancer immune evasion.

a. Distribution of genes in the focused CRISPR library.
b. HY15549 cells transduced with the lipid metabolism library were injected subcutaneously into C57BL/6J (BL6), myeloablated BL6, or NSG mice. Tumors were collected and guide RNA (sgRNA) abundance was determined. N ≥ 3 mice/ group.
c. KEGG pathway analysis of top 60 essential genes in C57BL/6J mice versus myeolablated C57BL/6J or NSG mice. KEGG terms are ranked by fold enrichment. False Discovery Rate (−log10FDR) is color-coded, and circle size corresponds to total number of genes in the set.
d. Ranks of differential gene scores between C57BL/6J and myeloablated or NSG mice. Highlighted genes are among the top 25 scoring genes.
e. Log2 fold change in ceramide-derived species between HY15549 tumors grown in C57BL/6J or NSG mice. N = 3 mice/ group.
f. Scoring genes (bold) in the sphingolipid metabolism pathway. De novo synthesis begins in the ER. Ceramides are transferred to the Golgi and modified into sphingomyelin or glycosphingolipids which make up cellular membranes. Sphingolipids in membranes or the lysosome are catabolized into ceramides and sphingosine via the salvage pathway.
g. Immunoblot of Sptlc1 in wildtype HY15549 cells or in a knockout and cDNA-expressing clonal pair. Full blot is shown in ED Fig. 2a.
h. Tumor volume of Sptlc1-KO (pink) and Sptlc1-AB (blue) HY15549 cells grown in C57BL/6J, NSG, or Rag1- mice. Mean ± SEM; n = 6 (C57BL/6J) or 7 (NSG, Rag1-) mice/ group. Tumors are shown below, scale bar = 1 cm. X marks tumors that were not detected at the endpoint.
i. Gene essentiality in KP lung adenocarcinoma (LUAD) tumors grown in C57BL/6J versus NSG mice. The dotted line represents P = 0.05. De novo sphingolipid synthesis genes are highlighted. N ≥ 4 mice/ group.
j. Survival of C57BL/6J mice bearing KrasG12D/p53−/− liver tumors generated by hydrodynamic gene delivery expressing sgCtrl (gray, n = 6) or sgSptlc1 (pink, n = 5).
k. Luciferase flux from KrasG12D/p53−/− liver tumors expressing sgCtrl (gray, n = 6) or sgSptlc1 (pink, n = 5) generated by hydrodynamic gene delivery in C57BL/6J. A representative image is shown on the right and tumors below. Mean ± SEM.
l. Weights and image of double-empty vector wildtype (EV) or Sptlc1/Sptlc2 double-overexpression HY15549 tumors grown in C57BL/6J mice. Mean ± SEM; n = 5 mice/ group; scale bar = 1 cm.
Sphingolipids are structural components of cellular membranes, but bioactive sphingolipids such as ceramide- or sphingosine-1-phosphate (C1P, S1P) also have diverse biological roles in growth regulation, migration, cell death and immune responses16. De novo synthesis of sphingolipids begins in the endoplasmic reticulum with the rate-limiting step catalyzed by serine palmitoyl transferase (SPT), an enzyme made up of two subunits, Sptlc1 and Sptlc217. SPT combines palmitoyl-CoA and serine to produce 3-ketosphinganine (KDS), which after a series of steps is converted to ceramides, precursors of more complex membrane sphingolipids such as sphingomyelin and glycosphingolipids18. In addition to being integral parts of cellular membranes, these complex lipids are enriched in membrane lipid nanodomains and caveolae and thereby regulate signal transduction, cell-cell interactions, and membrane structure19. Remarkably, genes encoding the enzymes in the de novo ceramide synthesis pathway (Sptlc1, Sptlc2, Kdsr, Cers, and Degs) and the enzyme that generates the precursor to all glycosphingolipids (Ugcg) scored as essential for tumor growth in immunocompetent mice (Fig. 1d, Extended Data Fig. 1b). In contrast, none of the genes associated with the production of sphingosine or ceramide- or sphingosine-1-phosphate scored in our analysis, raising the possibility that membrane glycosphingolipid production may be particularly relevant for immune evasion (Fig. 1f).
To begin to understand why cancer cells require de novo sphingolipid synthesis for immune evasion, we first generated Sptlc1 or Sptlc2 knockout HY15549 cells and their isogenic counterparts expressing sgRNA resistant Sptlc1 or Sptlc2 cDNA and confirmed depletion of ceramide- and sphingolipid-derived lipid species in knockout cells (Fig. 1g, Extended Data Fig. 2a–f). Notably, the sphingolipid depletion observed in vitro upon SPT loss was partially recapitulated in cells grown as tumors in immunocompetent mice. Differences observed in tumor samples compared to cells grown in culture may be due to the presence of other cell types that contribute to sphingolipid abundance in the TME (Extended Data Fig. 2g). Consistent with the screen results, loss of sphingolipid synthesis severely impaired tumor growth in C57BL/6J but not NSG mice (Fig. 1h, Extended Data Fig. 3a). shRNA and sgRNA mediated knockdown of Sptlc1 or Sptlc2 also blunted tumor growth in immunocompetent mice (Extended Data Fig. 3b–c) and similar results were observed in an orthotopic pancreas cancer model, indicating that the tumoral requirement for sphingolipids is independent of the organ environment (Extended Data Fig. 3d). Sptlc1 loss partially impacted tumor growth in Rag1- mice, which have functional NK cells but lack mature T and B cells, suggesting that both the adaptive and innate immune systems contribute to tumor surveillance of Sptlc1 or Sptlc2-KO tumors (Fig. 1h, Extended Data Fig. 3a). We next asked whether de novo sphingolipid synthesis is necessary for immune escape in other cancer types. To test this in an unbiased way, we performed small-scale screens using a sphingolipid metabolism-focused CRISPR library targeting 82 genes in a Kras mutant C57BL/6J syngeneic lung (KP LUAD, KrasG12D/+/Trp53−/−, Extended Data Fig. 4a). In line with the original screen results, de novo sphingolipid synthesis genes were required for immune evasion in KP LUAD tumors (Fig.1i). Additionally, using a genetically engineered intrahepatic cholangiocarcinoma KrasG12D/Trp53−/− model generated by hydrodynamic gene delivery in C57BL/6J mice, we observed that Sptlc1 loss significantly prolonged survival and impaired the growth of liver tumors (Fig. 1j–k). To test whether SPT function is limiting for immune evasion, we next simultaneously overexpressed Sptlc1 and Sptlc2 in HY15549 cells and compared tumor growth in C57BL/6J and NSG mice (Extended Data Fig. 4b–c). Remarkably, increasing SPT function enhanced tumor growth in immunocompetent, but not immunocompromised mice (Figure 1l, Extended Data Fig. 4d). Consistent with this, high expression of SPTLC1, SPTLC2, and KDSR correlates with poor patient outcomes (Extended Data Fig. 4e). Altogether these data suggest that inhibiting sphingolipid de novo synthesis in the cancer compartment promotes anti-tumor immunity in vivo.
Despite a significant decrease in sphingolipids (Extended Data Fig. 2b–f), SPT deficient cells grew similarly to addback controls in culture (Extended Data Fig. 5a) or as tumors in NSG mice (Fig. 1h). Sphingolipids can be obtained from exogenous sources and metabolized in the lysosomes and other organelles into building blocks used to generate new lipids. We considered whether these cells might depend on the lysosomal salvage pathway to support their growth in culture conditions20 when de novo synthesis is impaired. Indeed, treating Sptlc1-KO cells with bafilomycin-A1, a lysosomal acidification inhibitor, further depleted sphingolipid precursors and impaired proliferation, a defect rescued by supplementation with sphingolipid intermediates in vitro (Extended Data Fig. 5b–f). Thus, our results argue for a model where there are two distinct thresholds of sphingolipid levels required for tumor growth: one for cell proliferation and another for immune escape. While sphingolipids obtained through the salvage pathway are sufficient to sustain cell proliferation, the diversity or quantity of lipids generated via de novo synthesis may be required to achieve immune evasion.
Tumor sphingolipids dampen cytotoxic immunity
Given that sphingolipids are bioactive molecules that regulate diverse processes including cell migration, cell survival and death, and differentiation21, we next asked how inhibition of sphingolipid synthesis in cancer cells impacts immune cell composition in the TME. To address this question in an unbiased way, we performed single-cell RNA sequencing (sc-RNAseq) on isolated CD45+ immune cells from Sptlc1-KO and Sptlc1-AB tumors grown in C57BL/6J mice. After clustering to define major tumor-infiltrating immune cell types, we found no major changes in the proportions of infiltrating lymphocytes despite alterations in that of myeloid cells in Sptlc1-KO tumors (Fig. 2a, Extended Data Fig. 6a–b). Further analysis revealed that NK and CD8+ T cells from Sptlc1-KO tumors exhibited upregulation of genes associated with their enhanced activation and cytotoxic states, such as interferon gamma (IFNγ), compared to those isolated from Sptlc1-AB tumors (Fig. 2b–c, Extended Data Fig. 6c). Flow cytometric analysis of infiltrating NK and CD8+ T cells confirmed their elevated activation states and higher expression of IFNγ upon loss of Sptlc1 in tumors (Fig 2d–f, Extended Data Fig. 6d–g). Collectively, these results suggest that sphingolipid depletion in cancer cells alters the functional state of cytotoxic lymphocytes in the TME. Consistent with this, estimates of infiltrating immune cell fractions in PDAC tumors retrieved from TCGA revealed a correlation between low expression of de novo sphingolipid synthesis genes (SPTLC1, SPTLC2, and KDSR) and increased activation of NK cells (Extended Data Fig. 6h–j).
Figure 2. Sphingolipid synthesis protects cancer cells from the anti-tumor effects of immune cells.

a. UMAP plot of 17,950 CD45+ infiltrating leukocytes isolated from Sptlc1-KO or AB HY15549 tumors grown in C57BL/6J mice.
b. Expression distribution of differentially expressed (Padj <0.0001) activation and cytotoxicity markers in NK and CD8+ T cells isolated from Sptlc1-KO or Sptlc1-AB HY15549 tumors grown in C57BL/6J mice. Mean ± SEM; analyzed by a two-sided Wilcoxon rank sum test with Benjamini-Hochberg correction. N = 5000 cells/ condition. Minima/maxima/center bounds are defined in the source data file.
c. Fold change (log10) of the average Ifng expression of CD45+ leukocytes isolated from Sptlc1-KO or Sptlc1-AB HY15549 tumors grown in C57BL/6J mice.
d. Flow analysis of the expression of IFNγ in NK, CD8+ T, or CD4+ T cells isolated from Sptlc1-KO or Sptlc1-AB HY15549 tumors grown in C57BL/6J mice. Mean ± SEM; n = 8 mice/ group.
e. Flow analysis of the proportion of CD62L+ NK cells among leukocytes isolated from Sptlc1-KO or Sptlc1-AB HY15549 tumors grown in C57BL/6J mice. Mean ± SEM; n = 5 mice/ group.
f. Flow analysis of the proportion of CD44+/ CD62L- CD8+ T cells among leukocytes isolated from Sptlc1-KO or AB HY15549 tumors grown in C57BL/6J mice. Mean ± SEM; n = 5 mice/ group.
g. Proliferation of Sptlc1-KO and AB HY15549 cells supplemented with 3-ketodihydrosphingosine (KO+KDS, 1 µM) or sphingosine (KO+SP, 750nM) left untreated (circle) or cocultured with NK cells (square). The bar graph depicts confluence of indicated conditions at 72 hrs. Representative images are shown on the right. Mean ± SEM; n = 3 biological replicates; scale bar = 200 µm.
h. Proliferation of OVA-expressing Sptlc1-KO and AB HY15549 cells left untreated (circle) or cocultured with OT1 CD8+ T cells (square). The bar graph depicts confluence of indicated conditions at 98 hrs. Representative images are shown on the right. Mean ± SEM; n = 3 biological replicates; scale bar = 200 µm.
To further understand whether NK and CD8+ T cells are directly involved in restricting the growth of cancer cells deficient for sphingolipid synthesis, we cocultured Sptlc1-KO and Sptlc1-AB cells with NK or CD8+ T cells isolated from C57BL/6J or OT-1 mice, respectively. Sptlc1-KO cells were more sensitive to the anti-proliferative effects of NK cells and supplementing them with KDS or sphingosine was sufficient to rescue this effect (Fig. 2g). Of note, coculturing NK cells with sphingolipid depleted or replete cancer cells induced IFNγ expression to a similar extent (Extended Data Fig. 6k–m). Similarly, CD8+ T cells inhibited the growth of Sptlc1-KO cancer cells more effectively compared to Sptlc1-AB controls in an antigen-specific manner (Fig. 2h, Extended Data Fig. 6n). Importantly, antibody-mediated depletion of NK or CD8+ T cells in C57BL/6J mice significantly promoted Sptlc1-KO tumor growth (Extended Data Fig. 6o). Thus, these results suggest that de novo sphingolipid synthesis protects cancer cells from NK and CD8+ T cell immune surveillance.
Sphingolipid depletion enhances IFNγ signaling
We next sought to determine the mechanism by which cancer sphingolipids mediate immune evasion from NK and CD8+ T cells. Upon stimulation, NK and T cells secrete proinflammatory chemokines and kill target cells via the perforin/granzyme pathway, by expressing FasL or TRAIL, or producing cytokines such as interferon-γ (IFNγ), which activate proapoptotic, proinflammatory, and anti-proliferative signaling cascades in target cells. Given that loss of de novo sphingolipid synthesis sensitizes cancer cells to NK and T cells in a tumor-intrinsic manner, we compared the transcriptome of Sptlc1-KO and Sptlc1-AB pancreatic cancer cells cultured in vitro or isolated from tumors grown in C57BL/6J or NSG mice (Fig. 3a, Extended Data Fig 7a). Gene set enrichment analysis revealed that, in the presence of immune surveillance, Sptlc1-KO cells upregulated the expression of genes involved in interferon signaling and response pathways (Fig. 3b). Coculturing Sptlc1-KO cells with NK cells induced similar pro-inflammatory pathways (Extended Data Fig. 7b–c), raising the possibility that loss of de novo sphingolipid synthesis may contribute to tumor cell sensitivity through interferon signaling. Interferons are cytokines that regulate cancer progression by inducing proinflammatory signaling in target cells and activating immune cells. IFNα and IFNβ are produced by most cell types while IFNγ is primarily produced by activated NK and T cells and binds its receptor composed of IFNγ receptor subunits 1 and 2 (Ifngr1/2). Once interferons bind their receptor, the Jak/Stat interferon signaling pathway is activated and induces the transcription of proinflammatory cytokines and antigen presentation machinery in target cells. Consistent with the heightened transcriptional activation of interferon signaling, loss of sphingolipid synthesis increased phosphorylation and expression of Jak1 and Stat1 in pancreatic cancer cells upon their exposure to IFNγ or NK cells (Fig. 3c–d, Extended Data Fig. 7d–e). Moreover, genetic and pharmacological inhibition of sphingolipid synthesis sensitized HY15549 cells to IFNγ-mediated growth arrest (Fig. 3e, Extended Data Fig. 7f). Conversely, overexpression of SPT blunted IFNγ-mediated growth arrest and signaling (Extended Data Fig. 7g–h). Notably, the anti-proliferative effects of IFNγ in Sptlc1-KO cells were rescued by CRISPR-mediated deletion of Ifngr1 or Jak1 (Fig. 3f, Extended Data Fig. 7i–j) and IFNγ deficient NK cells were inefficient at restricting the growth of Sptlc1-KO cells in culture (Fig. 3g). Finally, the anti-tumor effects of Sptlc1 loss were partially abrogated in IFNγ deficient (Ifngtm1Ts) mice, suggesting that tumor sphingolipids protect cancer cells against host IFNγ signaling (Fig. 3h).
Figure 3. Loss of sphingolipid synthesis sensitizes cancer cells to IFNγ.

a. RNAseq analysis from GFP+ Sptlc1-KO and Sptlc1-AB HY15549 cells grown in C57BL/6J (BL6) or NSG mice. After 12 days, tumors were collected, dissociated, and FACS sorted for RNA sequencing.
b. Gene set enrichment analysis of mRNAs significantly enriched in Sptlc1-KO versus Sptlc1-AB HY15549 cells grown in C57BL/6J mice compared to those in NSG mice or cultured in vitro. GO terms are ranked by gene ratio, adjusted P-values (FDR, −log10) are color-coded, and circle size corresponds to the total number of genes in the gene set.
c. Immunoblot of interferon-γ signaling pathway induction in Sptlc1-KO and Sptlc1-AB HY15549 cells left untreated or treated with interferon-γ (IFNγ) for 4 hrs. Gapdh is a loading control.
d. Immunoblot of interferon-γ signaling pathway induction in Sptlc1-KO and Sptlc1-AB HY15549 cells cocultured with NK cells 5 hrs. Gapdh is a loading control.
e. Proliferation of Sptlc1-KO (pink) and Sptlc1-AB (blue) HY15549 cells treated with the indicated concentrations of IFNγ for 92 hrs. Mean ± SD; n = 3 biological replicates.
f. Proliferation of Sptlc1-KO (KO, pink), Sptlc1-AB (AB, blue), Sptlc1/Ifngr1-KO (KO_sgIFNGR1, dark gray) or Sptlc1/Jak1-KO (KO_sgJAK1, light gray) HY15549 cells left untreated (circle) or cocultured with NK cells (square). The bar graph shows confluence after 72 hrs. Mean ± SEM; n = 3 biological replicates.
g. Proliferation of Sptlc1-KO HY15549 cells left untreated (circle) or cocultured with NK cells isolated from C57BL/6J (5:1 E:T, solid square) or Ifngtm1Ts mice (5:1 E:T, open square). The bar graph shows confluence after 84 hrs. Mean ± SEM; n = 3 biological replicates.
h. Weights and image of Sptlc1-KO (pink) and Sptlc1-AB (blue) HY15549 tumors grown in C57BL/6J (circle) or Ifngtm1Ts (square) mice. Mean ± SEM; n = 3 mice/ group; scale bar = 1 cm. X marks tumors that were not detected at the endpoint. Data were analyzed using a one-way ANOVA with Benjamini-Hochberg multiple test correction.
Glycosphingolipids impact Ifngr1 membrane expression
Given that changes in membrane lipid composition may influence the properties of membrane proteins22, we next sought to determine whether loss of sphingolipid synthesis impacts the function or expression of specific membrane proteins. To address this, we performed parallel proteomic analyses on whole cell and plasma membrane proteins isolated from Sptlc1-KO and Sptlc1-AB pancreatic cancer cells (Fig. 4a, Extended Data Fig. 8a–b). While loss of Sptlc1 did not induce profound changes in the whole cell proteome (Extended Data Fig. 8c), we observed substantial alterations in the abundance of membrane proteins of Sptlc1-KO cells compared to those of Sptlc1-AB controls (Fig. 4b). Particularly, Ifngr1 was among the membrane proteins upregulated in Sptlc1-KO cells, as well as proteins involved in receptor-mediated endocytosis (Ap2m1, Eps15, and Cubn). These results are consistent with previous work showing that IFNGR partitions into membrane lipid nanodomains upon activation and impairment of this redistribution blocks the internalization of IFNGR23,24. We therefore asked whether loss of sphingolipid synthesis may sensitize cells to IFNγ by disrupting Ifngr1 surface expression. Immunoblot and flow cytometric analysis of Sptlc1-KO and AB cells revealed a higher abundance of Ifngr1 surface expression in sphingolipid-depleted cells (Fig. 4c–e, Extended Data Fig. 8d–e). Importantly, this difference was sustained upon IFNγ stimulation and correlated with increased sensitivity to IFNγ signaling (Extended Data Fig. 8f). These results were confirmed by immunofluorescence experiments (Extended Data Fig. 8g–i). Furthermore, analysis of tissue samples from Sptlc1-KO and AB tumors grown in C57BL/6J mice showed that loss of sphingolipid synthesis significantly increased Ifngr1 expression in vivo (Fig. 4f).
Figure 4. Glycosphingolipid synthesis impacts cell surface expression of Ifngr1.

a. Sptlc1-KO and Sptlc1-AB HY15549 cells untreated or incubated with a membrane-impermeable biotin tag. Cells were lysed and labeled proteins were affinity purified. Eluted protein and unlabeled whole cell protein lysates were analyzed by LC-MS.
b. Log2 fold change in whole cell and membrane proteins between Sptlc1-KO (KO) versus Sptlc1-AB (AB) HY15549 cells.
c. Immunoblot of whole cell and membrane protein lysates from Sptlc1-KO and Sptlc1-AB HY15549 cells. N = 3 biological replicates.
d. Flow analysis of Ifngr1 surface expression in WT, Sptlc1-KO, and Sptlc1-AB HY15549 cells.
e. Flow analysis of Ifngr1 surface expression in Sptlc1-KO and Sptlc1-AB HY15549 cells treated with 5 ng/mL IFNγ over time. Mean ± SEM; n = 3 biological replicates.
f. Quantification of the number of Ifngr1+/Keratin+ cells in Sptlc1-KO (n = 2) and Sptlc1-AB (n = 3) HY15549 tumors grown in C57BL/6J mice for 12 days. Mean ± SEM, n= 3 images/ tumor. Scale bar = 50 µm.
g. FACS-based screen to determine which sphingolipid metabolism genes impact the stability of Ifngr1 in the plasma membrane of HY15549 and KP LUAD cells. Live transduced cells were incubated with a fluorescent antibody against Ifngr1. High and low fluorescent populations were collected, and their sgRNA abundance was compared.
h. Ranks of differential gene scores between high and low Ifngr1+ HY15549 and KP LUAD cells. De novo glycosphingolipid pathway genes among the top 20 scoring genes are highlighted.
i. Immunoblot of IFNγ signaling pathway induction in sgCTRL-RFP and sgUgcg-RFP HY15549 cells untreated or treated with IFNγ for 2 or 4 hrs.
j. Weights and image of sgCTRL-RFP and sgUgcg-RFP HY15549 tumors grown in C57BL/6J or Ifngtm1Ts mice. Mean ± SEM; n = 5 mice/ group; scale bar = 1 cm. Analyzed using a one-way ANOVA with Tukey’s multiple test correction.
k. Weights and image of wildtype HY15549 tumors grown in C57BL/6J mice treated as indicated. Mean ± SEM; n = 7 (−/−, +/+) or 8 (others) mice/ group; scale bar = 1 cm. Analyzed using a one-way ANOVA with Tukey’s multiple test correction.
l. Survival analysis of TCGA PDAC patients with high or low expression of SPTLC1/SPTLC2/KDSR. N = 177. Error bands = 95% confidence interval.
To determine which ceramide-derived lipid species impact Ifngr1 levels in the plasma membrane, we conducted a FACS-based genetic screen for membrane Ifngr1 expression using a sphingolipid metabolism-focused CRISPR library in HY15549 and KP LUAD cells (Fig. 4g). Among the top scoring genes was UDP-glucose ceramide glucosyltransferase (Ugcg), which catalyzes the first committed step in the conversion of ceramides to glycosphingolipids (Fig. 4h). In contrast, genes involved in sphingomyelin or ceramide- or sphingosine-1-phosphate synthesis did not score (Extended Data Fig. 9a), indicating glycosphingolipid synthesis plays a role in mediating Ifngr1 surface expression. Confirming this, loss of Ugcg resulted in significant depletion of glycosphingolipids and their precursors and significantly increased the levels of plasma membrane Ifngr1 (Extended Data Fig. 9b–f). Additionally, glycosphingolipid depletion increased sensitivity to IFNγ and impaired tumor growth in immunocompetent, but not immunocompromised mice (Fig. 4i, Extended Data Fig. 9g–h). The anti-tumor effects of Ugcg loss were partially abrogated in IFNγ deficient mice, suggesting glycosphingolipids partly protect cancer cells against IFNγ-mediated tumor control (Fig. 4j). While these results suggest a connection between glycosphingolipids and Ifngr1 membrane expression, it should be noted that the availability of sphingolipids in the plasma membrane impacts the localization and function of a number of other membrane proteins22. For example, disruption of lipid nanodomain formation upon Sptlc1 loss correlates with impaired VEGF signaling in endothelial cells25. Similarly, we observed changes in the abundance of other immune receptors in the membrane proteome of Sptlc1 deficient cells, including enrichment of TNF receptor subunits.
Glycosphingolipid depletion enhances immunotherapy
We next sought to determine whether targeting glycosphingolipid synthesis could enhance tumoral responses to immune therapy. Eligustat, a small molecule inhibitor of UGCG, is a well-tolerated clinical drug used to reduce lipid accumulation in Gaucher disease, a lysosomal storage disorder26. Pharmacological inhibition of Ugcg with eliglustat depleted glycosphingolipids and their precursors in cultured HY15549 cells and increased sensitivity to IFNγ-induced growth arrest in both HY15549 and KP LUAD cells (Extended Data Fig. 10a–d). To test whether pharmacological depletion of glycosphingolipids sensitizes Kras-driven tumors to immunotherapy, we treated HY15549 or KP LUAD tumor-bearing immunocompetent mice with a combination of eliglustat and checkpoint blockade therapy (CBT). Strikingly, while dual-CBT with anti-CTLA4 and anti-PD1 did not impair HY15549 tumor growth, eliglustat treatment synergized with CBT to significantly reduce tumor burden. Similarly, eliglustat treatment synergized with anti-PD1 CBT to reduce KP LUAD tumor growth (Fig. 4k, Extended Data Fig. 10e). Tumor burden was not significantly impacted by eliglustat treatment alone, likely due to incomplete target engagement or effects on other cell types in the TME, including immune cells. Finally, consistent with the role of glycosphingolipid synthesis in human cancers, querying the TCGA-PanCanAtlas dataset revealed a significant correlation between high expression of UGCG and disease severity in patients (Fig. 4l, Extended Data Fig. 10f).
Discussion
Alterations in sphingolipid metabolism have been described in tumors since the 1970’s27,28. Our work reveals glycosphingolipid availability as a critical endogenous limitation for immune evasion in Kras-driven cancer cells. Interestingly, increased glycolytic flux into glycosphingolipid synthesis promotes the plasma membrane localization of oncogenic KRAS, which reciprocally upregulates glycosphingolipid synthesis29. Additionally, glycosphingolipids and UGCG expression were recently shown to be upregulated in response to inhibition of lysosomal autophagy30, a critical process involved in immune evasion of Kras mutant tumors31–34. The convergence of multiple immune evasion pathways on glycosphingolipid availability may suggest that KRAS-driven tumors may be particularly vulnerable to immune surveillance upon glycosphingolipid depletion. Recent systematic in vivo CRISPR screens showed that sphingolipid synthesis is not a universal essentiality for tumor growth35. Future work will determine whether this strategy is restricted to KRAS-mutant tumors or can be generalized to other cancer types.
Here, we show that glycosphingolipid synthesis promotes immune evasion by impacting surface expression of Ifngr1, in line with the major role of IFNγ signaling in immune surveillance and immunotherapy efficacy36,37. IFNGR1 has recently been suggested to directly bind sphingolipids upon IFNγ stimulation38, raising the possibility that direct lipid-protein interactions may regulate its stability in the plasma membrane. Given that expression of sphingolipid synthesis enzymes is often upregulated in a wide range of tumor types28 and that pharmacological inhibition of glycosphingolipid synthesis synergizes with immune checkpoint blockade therapy in tumor models, whether an increase in membrane glycosphingolipids predicts cancer progression and response to immunotherapy in patients should be studied. Elevated serum levels of sphingomyelins and glycosphingolipids predict cancer disease progression and patients with Gaucher disease accumulate glycosphingolipids and have an increased risk of developing cancer39. Thus, altering membrane sphingolipid composition pharmacologically or via dietary interventions could be a viable strategy to improve immunotherapy response. Finally, our screens reveal that other membrane lipids such as phosphatidylcholines and phosphatidylethanolamines may also impact tumor immune escape. Further research is needed to understand how cancer cells leverage membrane phospholipids to promote growth in different tumor types and physiological contexts.
MATERIALS AND METHODS
Reagents
Recombinant mouse interferons were purchased from BioLegend: IFNγ (#581302). The following reagents were purchased from Cayman Chemical Company: Myriocin (#63150), 3-ketosphinganine (#24380), C2-ceramide (#62510), C6-ceramide (#62525), sphingosine (#10007907), and sphingosine-1-phosphate (#62570).
Animal Studies
All mouse experiments were conducted in accordance with a protocol approved by the Institutional Animal Care and Use Committee at The Rockefeller University. C57BL/6J (#000664), NSG (#005557), B6.129S7-Rag1tm1Mom/J (#002216), B6.129S7-Ifngtm1Ts/J (#002287), C57BL/6-Tg(TcraTcrb)1100Mjb/J (#003831) were obtained from The Jackson Laboratory. All mice were maintained on a standard light-dark cycle with food and water ad libitum. Mice were euthanized before tumors reached the maximal volume of 2 cm3 and before mice showed any signs of distress (ruffled fur, extensive weight loss, poor body condition, or poor grooming related to debilitation).
Cell lines and Cell Culture
HY15549 cells were obtained from Dr. Nabeel M. Bardeesy and are originally derived from female KPC mice that were backcrossed into a C57BL/6 background (Massachusetts General Hospital Cancer Center)40, KP LUAD cells were obtained from Dr. Thales Papagiannakopoulos (New York University). Cell lines were regularly checked for mycoplasma contamination and were grown in RPMI 1640 medium (Gibco #11875–093) containing 2mM glutamine supplemented with 10% fetal bovine serum (FBS) (Sigma-Aldrich #12306C) and 1% penicillin/streptomycin (Gibco #15140–122). Cells were maintained at 37°C, 21% O2, and 5% CO2.
In Vivo CRISPR Screens
For the lipid metabolism focused screen, a list of 295 genes was curated based on previous metabolism-focused screens and literature review. 7 sgRNAs/ gene were included in the library along with 40 non-targeting sgRNA controls. The library was cloned into lentiCRISPR-v2 puro (Addgene #98290) and used to make virus-containing supernatant as described above. 2.5 million HY15549 cells were infected as above at an MOI of ~0.7 and selected with puromycin. Following selection, an initial pool of 2.5 million cells was harvested for genomic DNA extraction. Transduced cells were prepared for subcutaneous injection at a concentration of 1 million cells/ 100 µL in 30% Matrigel (R&D Systems #BME001–5). Each mouse received one 100 µL injection subcutaneously on each flank. Myeloablation was achieved by exposing C57BL/6J mice to 5.5 Gy radiation 48 hours prior to tumor injections. Depletion of immune cells was confirmed at day 0 and day 18 by determining blood counts on an ElementHT5 (Heska). After 18 days, the tumors were collected and their genomic DNA extracted using a DNeasy Blood & Tissue Kit (Qiagen). For each mouse, gDNA from each tumor was pooled equally and sgRNA inserts were amplified by PCR using unique barcoding primers/ mouse. sgRNA abundance was measured by sequencing (NextSeq 500, Illumina). The gene score for each gene was defined as median log2 fold change in abundance of each sgRNA targeting that gene. The gene score across mice within each group was averaged.
KEGG pathway analysis was performed on the top 60 commonly essential genes between C57BL/6J mice versus myeloablated C57BL/6J or NSG mice using ShinyGO41 (v.0.76.3). Top enriched pathways were selected from the top 50 most significant P-values, pathways comprised of more than 300 genes were excluded, and scoring pathways were ranked by fold enrichment.
For the ceramide metabolism focused screen, a list of 59 genes was curated from the sphingolipid metabolism pathway defined by Kegg (00600) with modifications based on literature review. At least 4 sgRNAs/ gene and 40 non-targeting sgRNA controls were included in the library. The library was cloned into lentiCRISPR-v2 puro (Addgene #982990) and used to make virus-containing supernatant as described above. 1 million cells were infected as above at an MOI of ~0.7 and selected with puromycin. Following selection, an initial pool of 1 million cells was harvested for genomic DNA extraction. KP LUAD cells were prepared at 300,000 cells/ 100 µL in 30% Matrigel. Each mouse (C57BL/6J, NSG, n=4–5/ group) received one 100 µL injection subcutaneously on each flank. Genomic DNA extraction, PCR amplification and quantification of sgRNAs, and gene score analysis was performed as above.
FACS-based CRISPR Screen
2.5 million HY15549 or KP LUAD cells were infected as above at an MOI of ~0.7 and selected with puromycin. Following selection, an initial pool of 2.5 million cells was harvested for genomic DNA extraction and transduced cells were expanded for another 48 hours. 60 million cells were collected and washed once with PBS. Cells were resuspended in 50 µL FACS buffer (PBS, 1% BSA, 5mM EDTA) containing 1:10 antibody (Miltenyi Biotec #130-104-935)/ million cells and incubated in the dark at 4°C for 15 minutes. To wash cells, 10 mL of FACS buffer was added to each sample before centrifugation at 500 X g for 5 minutes at 4°C. Pellets were resuspended in FACS buffer with DAPI and the top 7% and bottom 20% fluorescent cells were sorted and collected using a Sony MA900. Genomic DNA extraction, PCR amplification and quantification of sgRNAs, and gene score analysis was performed as above.
Generation of Knockout, Addback, and Overexpression Cell Lines
sgRNA sequences (listed below) were synthesized by IDT and cloned with T4 ligase (NEB) into lentiCRISPRv2-puro (Addgene #982990) (Sptlc1, Sptlc2, Ugcg_sg5), lentiCRISPRv1-GFP (Addgene #75159) (Ifngr1, Jak1), or lentiCRISPRv1-RFP (Addgene #75162) (sgCTRL, Ugcg_sg4) linearized with BsmBI (NEB). Knockdown was confirmed by Western blot except for Ugcg-KOs, which were verified using ICE analysis (Synthego, Supplemental Information). Guide resistant cDNAs (Sptlc1: NM_009269.2, Sptlc2: NM_011479.4) were codon optimized, synthesized by Twist Biosciences and cloned using Gibson Assembly (NEB) into pMXS-IRES-BLAST (Cell Biolabs #RTV-016) or pMXS-IRES-GFP (Cell Biolabs #RTV-013) linearized with BamHI and NotI. shRNA’s were cloned into pLKO.1 (Addgene #10878). For lentiviral virus production, sgRNA-expressing vectors and packaging vectors (VSV-G and Delta-VPR) were transfected into HEK 293T cells using XtremeGene 9 transfection reagent (Roche). For retroviral virus production, cDNA expressing vectors and packaging vectors (VSV-G and Gag-Pol) were transfected into HEK 293T cells using XtremeGene 9 transfection reagent (Roche). Virus-containing supernatant was collected 48 hours after transfection and passed through a 0.45 µm filter. 18 hours prior to infection, target cells (30,000–50,000 cells/ well) were plated in a 6-well plate. Cells were spin-infected with 300–500 µL of virus and 4 µg/mL polybrene by centrifugation at 2,200 RPM for 80 minutes. 24 hours after infection, media was refreshed. 48 hours after infection, cells were selected by puromycin (lentiCRISPRv2-puro), blasticidin (pMXS-IRES-BLAST), or FACS (lentiCRISPRv1-GFP). Sptlc1 and Sptlc2 knockout cells were single cell cloned. All clonal cell lines were compared to their addback counterparts. For all infections, the matching vector without insert was used as the control.
| Gene_guide | Forward Oligo (5'-3') | Reverse Oligo (5'-3') |
|---|---|---|
| Sptlc1_sg2 | caccGGACTCACCAGTTCTGGAAG | aaacCTTCCAGAACTGGTGAGTCC |
| Sptlc1_sg6 | caccgAGGAAGAACTGATTGAAGAG | aaacCTCTTCAATCAGTTCTTCCTc |
| Sptlc2_sg2 | caccgTGGCAATGAAGACTCCCCGG | aaacCCGGGGAGTCTTCATTGCCAc |
| Sptlc2_sg7 | caccGGAACATTCACAAAGAGCTT | aaacAAGCTCTTTGTGAATGTTCC |
| Ifngr1_sg9 | caccGCCAGAGTTAAAGCTAAGGT | aaacACCTTAGCTTTAACTCTGGC |
| Ifngr1_sg10 | caccgAAACATCTCAGTATCCACAC | aaacGTGTGGATACTGAGATGTTTc |
| Jak1_sg4 | caccGGGGAGCCACATCAGTACAG | aaacCTGTACTGATGTGGCTCCCC |
| Jak1_sg8 | caccGGAGCTTTGGAACCACGCTC | aaacGAGCGTGGTTCCAAAGCTCC |
| Ugcg_sg4 | caccGAAGAGCACGAAGCCGAACA | aaacTGTTCGGCTTCGTGCTCTTC |
| Ugcg_sg5 | caccGAATCAGATGACAGAGAAAG | aaacCTTTCTCTGTCATCTGATTC |
| shLacZ | TRCN0000072224 | |
| shSptlc1 | TRCN0000103400 | |
| shSptlc2 | TRCN0000103174 | |
Immunoblotting
After washing once with PBS, cells were lysed on ice for 10 minutes in RIPA buffer (10mM Tris-HCl pH 7.5, 150mM NaCl, 1mM EDTA, 1% Triton X-100, 0.1% SDS) containing protease inhibitors (Roche #490685001). Lysates were centrifuged at 4°C for 10 minutes at 14,000 RPM. 20 ug of protein/ sample were resolved on 12%, 4–12%, or 10–20% Tris-Glycine gels (Invitrogen #XP00125BOX, #XP04125BOX, #XP10205BOX). Gels were transferred in CAPS buffer (10mM CAPS, 10% ethanol) to PVDF membranes (EMD Millipore #1PVH00010) which were then blocked in 5% BSA at room temperature for 1 hour and incubated with primary antibodies at 4°C overnight (Gapdh (GeneTex #GTX627408), Sptlc1 (Proteintech #15376-1-AP) Sptlc2 (Proteintech 51012-2-AP), Ifngr1 (Proteintech #10808-1-AP), p-Stat1 (R&D Systems #AF2894-SP), Stat1 (Cell Signaling Technology #14994T), Jak1 (Cell Signaling Technology #3344S), p-Jak1 (Cell Signaling Technology #3331S), e-Cadherin (Cell Signaling Technology #14472S), β-actin (GeneTex #GTX109639) and Cav-1 (Cell Signaling Technologies #3238S). After 3 5-minute washes in TBST (0.1% Tween-20 tris buffered saline) membranes were incubated with secondary antibody (anti-mouse IgG-HRP, CST #7076 or anti-rabbit IgGHRP, CST #7074, diluted 1:5000) at room temperature for 1 hour. After 3 5-minute washes in TBST, membranes were developed using ECL chemiluminescence (Perkin Elmer #NEL105001EA or Cytiva #RPN2232). For gel source data, see Supplementary Figure 1.
Lipid Extraction and Profiling
For lipidomic analysis of ceramide-derived lipid species, 500,000 cells were kept on ice and washed 3 times with ice cold saline. Cells were quenched with 667 µL of ice-cold methanol/ well, scraped and collected. For tumor samples, 10 mg of tissue were homogenized in 667 µL of MeOH using a Bead Ruptor (Omni, Inc.). 333 µL ice-cold chloroform was added to the cell lysate and tissue homogenate followed by incubation on a heat block (2,000 RPM) at 48°C for 30 minutes. Samples were centrifuged for 10 minutes at maximum speed and the supernatant transferred to a new tube. 50 µL of 1M methanolic KOH was added to each sample prior to incubation on a shaking heat block (2,000 RPM) at 37°C for 2 hours. The mixture was neutralized with 2 µL of glacial acetic acid followed by centrifugation for 10 minutes at maximum speed (4°C). The supernatant transferred to a new tube, dried under nitrogen, and stored at −80°C until LC-MS analysis was performed.
Dried lipid extracts were reconstituted in 30–50μl of 65:30:5 acetonitrile: isopropanol: water (v/v/v), vortexed for 20 sec, centrifuged for 30 min (20,000 g ,4°C) and 5 μl of the supernatant was injected into the LC-MS in a randomized order, with separate injections for positive and negative ionization modes. Lipid extracts were separated on an Ascentis Express C18 2.1mm × 150mm × 2.7μm particle size column and analyzed with a Q Exactive benchtop orbitrap mass spectrometer (Thermo Fisher Scientific), as described previously42.
The mass spectrometer was operated with the following parameters: spray voltage, 3500V (+/-); heated capillary temperature, 320°C; sheath gas, 60a.u.; auxiliary gas, 20 a.u. External mass calibration was performed every 3–4 days using the standard calibration mixture. Mass spectra were acquired, in both positive and negative ionization modes, using a Top15 data-dependent MS/MS method. The full MS scan was acquired as such; 70,000 resolution, 1×10⁶ AGC target, 250 ms max injection time, scan range 200–2,000 m/z. The data-dependent MS/MS scans were acquired at a resolution of 17,500 AGC target of 1×10⁵, 75ms max injection time, 1.0Da isolation width, stepwise normalized collision energy (NCE) of 10 (+), 20 (+/-), 30 (+/-), 40 (+/-) units and 8 sec dynamic exclusion.
High-throughput identification and relative quantification of lipids was performed using LipidSearch software (v.4.2.27, Thermo Fisher Scientific/Mitsui Knowledge Industries) and the default parameters for Q Exactive product search and alignment. The aligned Lipid Ion report was exported to Microsoft Excel and the lipid ions were filtered down to one main adduct/ lipid using an in-house script. These lipids were then filtered using the following criteria: Rej (“Reject” parameter calculated by LipidSearch) equal to 0; PQ (“Peak Quality” parameter calculated by LipidSearch software) greater than 0.75; “Grade” threshold of A-C (Grade is calculated by LipidSearch software but the specific threshold is dependent on the lipid class and mass spec parameters); Main lipid adduct must be a relevant/common ion for a specific lipid class (predetermined with standards); Background noise < 10–15%. Lipid ion data was further curated using retention time indexing and the filtered dataset was normalized to the total cholesterol content/ sample. All lipidomics results are included in the Supplemental Information.
Cell Proliferation Experiments
For cell counting experiments, cells were plated in triplicate at a concentration of 1,000 cells/ well in 6-well plates. On days 2, 4, and 6 after plating, each well was resuspended and counted. For proliferation experiments in in 96-well plates, cells were plated in triplicate at a concentration of 500 cells/ well with indicated treatments. For proliferation experiments using Cell Titer Glo (Promega) (Bafilomycin-A1 treatment experiments) an initial time point of untreated cells was used for normalization. After 4 days of growth, 40 µL of Cell Titer Glo reagent was added to each well and luminescence was read using a SpectraMax M3 plate reader (Molecular Devices). For Incucyte (Sartorius) proliferation experiments (myriocin, IFNγ, and IFNβ treatment experiments), wells were imaged every 2 hours for up to 5 days.
Tumor experiments
For shRNA-expressing, mixed population, and KO and AB cells, 1 million cells in 100 µL of serum free DMEM with 30% matrigel were injected subcutaneously into the flanks of mice. For SPT dEV, and dOE cells, 0.25 million cells in 100 µL of serum free DMEM with 30% matrigel were injected subcutaneously into the flanks of mice. For NK and CD8+ T-cell depletion, tumor bearing mice were treated with an 200ug IP injection of every third day starting the day of tumor injection.
For eliglustat/ checkpoint blockade synergy experiments, 300,000 wildtype HY15549 or 250,000 KP LUAD wildtype cells in 100 µL of serum free DMEM with 30% matrigel were injected subcutaneously into the flanks of mice. Groups of mice were randomly assigned to the different treatment groups and treatment regimens are described in the corresponding figures. For eliglustat-treated mice, eliglustat hemitartrate (BOC Sciences #B2693–474918; Selleckchem #S4433) was diluted in sterile blood bank saline and administered via IP injection at a dose of 65 mg/ kg in 100 uL. Mice receiving immunotherapy were treated with 200 ug of a-CTLA4 (9H10) (HY15549; Bio X Cell #BE0131) or a-PD1 (29F.1A12) (KP LUAD; Bio X Cell #BE0273). Tumor volume was measured using a caliper and calculated as (LxW2)/2.
For orthotopic pancreas injections, 500,000 cells in 100 µL of serum free DMEM with 50% Matrigel were injected into the pancreatic tail of anesthetized mice using insulin syringes (29-gauge needle, BD). The peritoneum was closed with a 3–0 Vicryl Violet suture (Ethicon), and the skin was closed using the BD AutoClip Wound Closing System (BD). Mice were sacrificed and tumors were dissected after 2 weeks.
Hydrodynamic Tail Vein Injections
pT3-Kras-IRES-Luc-U6-sgRNA vector was generated by cloning KrasG12D cDNA coupled to IRES-Luciferase sequence under EF1a promoter; additionally cloning U6 promoter upstream of sgRNA cloning and scaffold sequence. Control or Sptlc1-targeting sgRNA (sequences below) were cloned into pT3. Plasmid mix containing 6.5 µg of pT3-Kras-IRES-Luc-U6-sgRNA, 1.3 µg of pCMV-SB13 transposase, and 25 µg of pX330 expressing Cas9 cDNA along with p53 sgRNA were prepared in sterile 0.9% NaCl solution. 6-week-old female mice were injected through the lateral tail vein with a volume of plasmid/saline mix corresponding to 10% of body weight within 5–7 seconds as described previously43,44. Taking advantage of luciferase signal, tumor progression was monitored weekly by IVIS. Total luminescence flux was measured by IVIS and plotted to compare tumor progression in control and Spltc1 knockout tumors.
sgTp53: CCTCGAGCTCCCTCTGAGCC
sgCtrl: GTGGGAACAGAGATAAGAAG
Sptlc1_sg6: AGGAAGAACTGATTGAAGAG
Immune Cell Isolation and Expansion
The spleen (and inguinal lymph nodes for OT-1 CD8+ T-cell isolation) of C57BL/6J, B6.129S7-Ifngtm1Ts/J (IFNγ-KO), or C57BL/6-Tg(TcraTcrb)1100Mjb/J (OT-1) mice were collected and dissociated on a 35 mm plate over ice using a scalpel. The tissue was resuspended in cold MACS buffer (PBS, 0.5% BSA, and 2 mM EDTA) and passed through a 70 µm cell strainer. The plunger of a 3 mL syringe was used to push remaining tissue through the strainer, which was then rinsed with MACS buffer. Cells were centrifuged at room temperature for 6 minutes at 1000 RPM. RBC lysis was performed by incubating cells in ACK lysis buffer (Thermo Scientific #A1049201) at room temperature for 4 minutes. An equal volume of MACS buffer was added to the cell suspension and transferred through a 70 µm cell strainer into a new tube. Cells were centrifuged again at room temperature for 6 minutes at 1000 RPM, resuspended in 1 mL of MACS buffer, and counted. NK and CD8+ T-cells were isolated from the cell suspension using negative selection isolation kits following the manufacturer’s protocols (Miltenyi Biotec #130-115-818 and #130-104-075, respectively). NK cells were immediately used for coculture assays. CD8+ T-cells were cultured for 6–7 days at a concentration of 1 million cells/mL in T-cell media (RPMI 1640 medium, 2 mM glutamine, 1 mM pyruvate, 10% FBS, 1% penicillin/streptomycin, 1x MEM amino acids (Thermo Scientific #11130051), 50 µM mercaptoethanol, pH ~7.4) with 20 ng/mL IL-2. T-cell activation was performed by culturing cells with anti-CD3/CD28 Dynabeads (Thermo Fisher Scientific #11456D) at a beads cell ratio of 1:2.
Immune Cell/ Cancer Cell Coculture Assays
To allow for adherence, HY15549 were plated in triplicate at a concentration of 1,000 cells/100 µL/ well in a 96-well plate 18 hours before the addition of NK cells. After NK cells were isolated, they were resuspended in T-cell media supplemented with 1ng/ml IL-15 (R&D Systems #447-ML), 20 ng/ml IL-2 (BioLegend #575404), and 20 ng/ml IL-12 (R&D Systems #419-ML-010). 100 µL of NK cells were added at the respective effector: target (E:T) ratios each well. For CD8+ T-cell coculture assays, HY15549 cells were plated in triplicate at a concentration of 1,000 cells/100 µL/ well in a 96-well plate with 5 ng/mL IFNγ. 100 µL T-cells were immediately added to cancer cells at the respective E:T ratios. HY15549 cell death and proliferation was monitored over 4–5 days using Incucyte.
Membrane Protein Biotinylation and Isolation
HY15549 cells were plated 18 hours prior to the addition of IFNγ so that they would reach 80% confluency on the day of collection. After respective incubation times, all samples were collected at the same time. All steps were performed on ice or at 4°C. Cells were washed 3 times with 10 mL ice cold PBS. 10 mL of 20 mM EZ-Link Sulfo-NHS-LC-Biotin (Thermo Scientific #21335) was added to the cells. Plates were incubated at 4°C for 30 minutes. Plates were washed once with 10 mL ice cold TBS (pH 7.4) and then twice with ice cold PBS. Cells were then scraped off the plate, collected, and centrifuged at 500 X g for 5 minutes at 4°C. Cells were resuspended in RIPA buffer containing protease inhibitors and incubated on ice for 30 minutes. Lysates were sonicated for 5 minutes and then centrifuged at max speed for 10 minutes at 4°C. Lysates were transferred to streptavidin beads (Thermo Scientific #88816) and incubated on a rotor at 4°C for 1 hour. Beads were briefly spun down, magnetized, and washed 3 times with 1 mL of PBS. Protein was eluted off of the beads by resuspending them in 50–100 µL of transmembrane buffer (10mM Tris-HCl pH 7.4, 1mM EDTA, 1% Triton X-100, 2% SDS, 0.1% CHAPS) with 1x SDS loading buffer (20% SDS) and boiling samples for 5 minutes at 95°C. Beads were then magnetized and the lysate collected.
Proteomics
Cysteines were reduced and alkylated with DTT and IAA. Proteins were precipitated with ice-cold acetone and the pellet was dissolved in 200mM EPPs containing 1 µg trypsin. Digestion proceeded overnight at room temperature, at which point 1 µg of trypsin was added and temperature was increased to 50°C for 1 hour. Peptides were labeled with TMTpro, quenched with hydroxylamine and, once stoichiometry was verified, pooled. TMTpro peptides were separated into 8 fractions by high-pH reversed-phase spin columns and analyzed by LC-MSMS using an Easy nLC 1200 HPLC equipped with a 250 mm * 75 µm Easyspray column connected to an orbitrap Fusion Lumos mass spectrometer operating in positive DDA mode.
Spectra were queried against the mus musculus proteome (database downloaded from uniprot.org on 2020/09/22) at 1% FDR using the Sequest HT search engine through Proteome Discoverer v. 2.5 and a spectral purity of 75% was required for quantitation. Protein abundance values were further processed within the Perseus statistical software environment.
Flow Cytometry Analysis of Ifngr1 and Membrane Glycosphingolipids
500,000 cells were collected and washed once with PBS. For extracellular staining, cells were resuspended in 50 µL FACS buffer containing 1:10 antibody (Miltenyi Biotec #130-104-935) and incubated in the dark at 4°C for 15 minutes. To wash cells, 1 mL of FACS buffer (PBS, 1% BSA, 5mM EDTA) was added to each sample before centrifugation at 500 X g for 5 minutes at 4°C. Pellets were resuspended in FACS buffer with DAPI and immediately analyzed on an Attune NxT (Thermo Scientific). For intracellular staining, 500,000 cells were collected and washed once with PBS. To fix and permeabilize the cells, samples were resuspended in 50 µL of PBS and 200 µL of 100% ice cold methanol was added dropwise while gently vortexing. Cells were incubated in 80% methanol on ice for 20 minutes. Then, 1 mL of PBS was added, and cells centrifuged at 500 X g for 5 minutes at 4°C. IFNGR1 staining and acquiring proceeded as above.
For analysis of membrane glycosphingolipids, 500,000 cells were collected and washed once with PBS. Cells were resuspended in 50 µL FACS buffer containing 1:100 Choleratoxin B-AF647 (Invitrogen #C34778) and incubated in the dark at 4°C for 20 minutes. Cells were washed with PBS and resuspended in flow buffer containing DAPI. Samples were acquired as above. An example of the gating strategies used for these experiments is included in the Supplemental Information.
Flow Cytometry Analysis of Tumor Infiltrating Immune Cells
Tumors were excised and digested for 1 hour at 37°C with with 400U/mL of collagenase D (Roche) and 0.2 µg/mL DNase I (Sigma). Digested tumors were filtered through 70 µm filters. Enrichment of hematopoietic cells was achieved by density gradient centrifugation with 40%/90% Percoll (GE Healthcare Life Sciences) for 25 minutes at 2500 RPM at 22°C without breaks. The interphase containing hematopoietic cells was isolated and washed with PBE. Red blood cell lysis was performed with ACK lysis buffer (GIBCO). For cytokine staining, cells were incubated at 37°C for 4 hours in complete RPMI media supplemented with Brefeldin A (Sigma), phorbol 12-myristate 13-acetate (PMA) (Sigma) and Ionomycin (Sigma). Following incubation, cells were washed with PBE. Cells were incubated for 5 minutes with 1 µg/mL of anti-CD16/32 (2.4G2, BioXcell) at room temperature. Cells were washed with PBS and stained with Zombie fixable viability dye (Biolegend) for 15 minutes at room temperature. Cells were washed with PBE and stained with appropriate surface marker antibodies for CD4+ and CD8+ T cells and NK cells for 20 minutes at 4°C. Cells were washed with PBE, fixed, and permeabilized (Cytofix/Cytoperm kit, BD). Intracellular staining for IFNγ was performed for 30 minutes at 4°C. Cells were washed and resuspended in PBE. Samples were acquired on a BD FACSymphony and data were analyzed using FlowJo v.10.6.2 software.
Flow Cytometry Analysis of IFNγ in NK Cells
20,000 GFP-expressing target cells were plated in each well of a round bottom 96-well plate. NK cells were isolated as above and added to target cells at a 3:1 ratio in the presence of IL-15, IL-2, and IL-12. After an overnight incubation, each well was treated with Brefeldin-A (BioLegend 420601) for 4 hours. After, NK cells were collected, washed, and permeabilized using the BD Cytofix/Cytoperm kit (BD BioSciences 554714) following the manufacturer’s instructions. NK cells were stained on ice for 20 minutes with primary antibody (1:200, Thermo Scientific 17-7311-81). Samples were acquired using Attune NxT (Thermo Scientific).
Tumor Dissociation, Cell Isolation, and RNA Sequencing
Tumors were removed from mice 12–13 days after injection and placed into DMEM+ media (DMEM/F-12 (Gibco #11320033, 10% FBS) and kept on ice. Once all tumors were removed, they were washed once with ice cold PBS and placed into a 1.5 mL tube containing dissociation buffer (DMEM+, 1 mg/mL Collagenase D (Sigma-Aldrich #11088858001), 25 ug/mL DNAse (NEB #M0303S)). Tumors were briefly dissociated using scissors and then incubated on a shaking heat block for 35 minutes at 37°C. Each sample was then passed through a 70 µm cell trainer which was rinsed with 5 mL of DMEM+. Cell suspensions were centrifuged at 300 X g for 5 minutes at 4°C. Cells were resuspended in 3 mL of ACK buffer and incubated at room temperature for 4 minutes. Then, 7 mL of DMEM+ was added before centrifuging again at 300 X single g for 5 minutes at 4°C.
For bulk RNA sequencing of GFP-expressing tumor cells, cells were resuspended in FACS buffer with DAPI. 70–100,000 GFP positive/ DAPI negative cells were sorted into Trizol LS (Fisher Scientific #10-296-010). Total RNA was extracted using chloroform and sequenced using Illumina NextSeq.
For isolation of CD45+ tumor-infiltrating immune cells, cells were resuspended in 30 µL of FACS buffer containing Fc-block (1:200, BD BioSciences #553141) and incubated on ice for 10 minutes. 30 µL of CD45 antibody in FACS buffer was added to cells (1:10 final concentration) and incubated on ice for 20 minutes. Cells were washed by adding 1 mL of FACS buffer prior to centrifugation at 1000 X g for 5 minutes at 4°C. Cells were resuspended in 200 µL of DAPI-containing FACS buffer. 10,000 CD45+/ DAPI negative cells/ mouse were sorted into a pre-coated Eppendorf tube for a total of 60,000 cells/ condition. 5,000 cells/ condition were targeted for single-cell RNA-sequencing on a Chromium Single Cell System (10x Genomics). Samples were processed as/ the manufacturer’s instructions (Chromium single cell 3’ reagents, v3.1 chemistry) and libraries were sequenced using Illumina NovaSeq.
For RNA sequencing of cells cocultured with NK cells in vitro HY15549 cells were plated in triplicate at 100,000 cells/ well in a 6-well plate, 18 hours prior to the addition of NK cells. Freshly isolated NK cells were added at an E:T ratio of 2:1 and incubated together for 6 hours. Then, the media was aspirated and adherent cells were thoroughly washed three times with PBS to remove remaining NK cells. HY15549 cells were collected in PBS, pelleted, and snap frozen prior to RNA extraction using chloroform. RNA was sequenced using Illumina NextSeq.
Bulk RNA Sequencing Analysis
Sequence and transcript coordinates for the mouse genome (mm10 UCSC) and gene models were retrieved from the Bsgenome.Hsapiens.UCSC.mm10 (v1.4.0) and TxDb.Hsapiens.UCSC.mm10.knownGene (v3.4.0) Bioconductor libraries, respectively. Transcript expression was calculated using Salmon quantification software45 (v0.8.2) and gene expression levels were expressed as transcripts/ million (TPM). Normalization and rlog transformation of raw read counts in genes were performed using DESeq246 (v1.20.0). Genes significantly differentially expressed between conditions were identified using DESeq2 with a Benjamini Hochberg adjusted p-value cutoff of 0.05. Gene Ontology of analyses of significantly differentially expressed genes was done using AmiGO 247 and the GO Biological Process pathway database. Dot plots were simplified by excluding gene sets comprised of more than 200 genes.
Single-cell RNA-Sequencing Analysis
Single cell datasets for each experiment were independently assessed for data quality following the guidelines described in Luecken and Theis, 2019 and Amezquita et al., 202048,49. Cells with more than 10% mitochondrial transcripts as well as cells that had fewer than 250 feature counts or expressed fewer than 500 genes were removed. After QC, Seurat (v4.0.3) was used for normalization, graph-based clustering and differential expression analysis50. Each dataset was normalized using SCTransform and the 5000 most variable genes were identified with SelectIntegrationFeatures. Both PMXS and AB datasets were integrated into a singular dataset via using the PrepSCTIntegration, FindIntegrationAnchors, and IntegrateData function51. MAGIC imputation was conducted on integrated data to impute missing values and account for technical noise52. RunPCA was implemented on the integrated datasets to identify the top 50 principal components (PCs) that were used for UMAP analysis and clustering. Louvain clustering at a resolution of 1 was implemented. Clusters were labeled in accordance with expression levels of CD45 tumor infiltrating lymphocyte subtype signatures . Differential expression analysis was conducted between PMXS vs AB using the FindMarkers function with the MAST method to evaluate differences within the transcriptome54. Wilcoxon rank-sum tests to determine if gene expression was significant was conducted using the wilcox.test function in stats (v4.1.0, R Core Team 2021). For the density map of the differential expression of Ifng, cells were binned based on proximity in the uniform manifold approximation and Projection (UMAP). Log fold change of Ifng expression (KO versus AB) was calculated using the cells in each bin and transposed back onto the UMAP at the generalized location of the cells.
Immunofluorescence
For immunocytochemistry on HY15549 cells, 100,000 cells were seeded on poly-D-lysine coated coverslips in 6-well plates and grown overnight. After the indicated treatments, cells were washed twice with PBS and incubated at room temperature with cholera toxin B-AF647 conjugate (Invitrogen #C34778) diluted in PBS for 10 minutes. Cells were then washed with PBS and fixed in 4% paraformaldehyde for 20 minutes at room temperature. Fixation was followed by three five-minute washes in PBS prior to mild permeabilization with 0.1% Triton X-100 for 10 minutes at room temperature and another round of three five-minute PBS washes. Coverslips were blocked in 1% BSA for 1 hour at room temperature and incubated in anti-IFNGR1 antibody (1:200, Invitrogen #PA5–27841) diluted in 1% BSA overnight at 4°C. After three five-minute PBS washes, coverslips were incubated with secondary antibody in 1% BSA (1:250, Invitrogen #A-21428) and anti-caveolin CoraLite588 conjugate (1:200, Proteintech #CL488–66067) for 1 hour at room temperature. Cells were washed once with PBS for 10 minutes, then incubated for 10 minutes with DAPI. Coverslips were then rinsed with water and mounted (Invitrogen #P36934). Slides were imaged with Nikon A1R MP multiphoton microscope with confocal modality, using Nikon Plan Apo γ 60X/1.40 oil immersion objective. Images were processed and analyzed with FIJI (ImageJ2, Version 2.3.0)1.
For immunofluorescence staining on formalin-fixed paraffin embedded (FFPE) tissue sections of HY15549 tumors grown subcutaneously in syngeneic mice, tissue was fixed overnight in 10% formalin at room temperature and subsequently stored in 70% ethanol. Tissue was embedded in paraffin and 10 µm sections were cut. Sections were deparaffinized and rehydrated in xylene and ethanol. Antigen retrieval was performed in Tris-EDTA Buffer (10mM Tris, 1mM EDTA, 0.05% Tween-20) for 10 mins in a pressure cooker on low pressure. Tumor sections were blocked with SuperBlock (ThermoFisher) for 2 hours at room temperature, after which sections were incubated with a primary polyclonal antibody against IFNGR1 (1:500, ThermoFisher, PA5–27841) in PBS with 1% BSA overnight at 4°C. Sections were washed three times using PBS with 0.05% Tween-20. Subsequently, sections were exposed to Alexa Fluor 488 conjugated anti-rabbit antibody (1:500, ThermoFisher, A32790) for 1h at room temperature, followed by primary antibody against pan-keratin (1:250, Cell Signaling Technology, #4545T) overnight at 4°C, and Alexa Fluor 647 conjugated anti-mouse antibody (1:500, ThermoFisher, A31573) for 1h at room temperature with intermittent washing steps. Lastly, DAPI solution (0.5μg/ml, ThermoFisher, #62248) was applied to the section and stained at room temperature for 10 mins. Samples were imaged on a Zeiss LSM 710 laser scanning confocal microscope, using a Plan-Apochromat 40x/1.3 Oil DIC M27 Oil immersion lens. Images were processed with FIJI (ImageJ2, Version 2.3.0). After Z-projection and brightness/contrast adjustment, image quantification was manually performed in QuPath55 with surface pan-keratin staining identifying pan-keratin positive cells and IFNGR1 intensity of 1000 or higher identifying IFNGR1 positive cells.
Survival Analysis of TCGA Data
TPM-normalized RNA-Seq count matrices for 177 PDAC tumors from the The Cancer Genome Atlas (TCGA) Pan-cancer dataset56 were retrieved using the cBio Cancer Genomics Portal57. Genes with a coefficient of variation > 0.25 were selected and z-score normalized across samples. Expression scores for each sample were calculated by the average z-score of genes in a gene set. Samples were classified into high and low expression groups based on their respective, thresholded expression scores. Survival analysis was conducted for the TCGA PDAC tumors using the coxph function from the survival R package while controlling for tumor TNM stage, sex, age, grade, and radiation therapy status. 177 PDAC tumors were classified into high and low expressing tumors using the surv_cutpoint() function from the survminer59 R package, which determines the optimal cut point using the maximally selected rank statistic from the ‘maxstat’ R package60.
Statistical Analysis
Each experiment was repeated independently at least twice with similar results. Data was analyzed by unpaired, two-sided Students T-test unless otherwise specified in the figure legend.
Analysis of Tumor Infiltrating Leukocytes in PDAC Patient Samples from TCGA
Relative fractions of immune cell types for each PDAC tumor, estimated using CIBERSORT were retrieved from TCGA62. For a given immune cell type, 177 PDAC tumors were classified into high and low expressing tumors by iteratively testing thresholds in the interquartile range of a gene set’s z-score using an unpaired two-sided Student’s t-Test. Thresholds within the interquartile range that maximized the t-statistic were selected.
Reporting Summary
Further information on research design is available in the Nature Research Reporting Summary linked to this paper.
Extended Data
Extended Data Figure 1. Cancer cell sphingolipid availability mediates immune evasion.

a. Cell count of red blood cells (RBC, left), white blood cells (WBC, middle), lymphocytes (LYM, right), neutrophils (NEU), monocytes (MONO), eosinophils (EOS), and basophils (BAS) in untreated C57BL/6J mice (pink) and myeolablated C57BL/6J mice on the day of tumor injections (d0, 36 hrs after radiation) and at the endpoint (d18). Mean ± SEM; n = 3 mice/ group.
b. Ranks of differential gene scores between C57BL/6J and myeloablated mice (x-axis) or NSG mice (y-axis). The highlighted genes are among the top 60 scoring genes and are involved in sphingolipid biosynthesis.
c. Schematic of wildtype HY15549 cells grown in C57BL/6J or NSG mice for 12 days before tumor collection and lipid extraction. Lipid abundances were determined by LC-MS analysis (right).
d. Abundance of ceramide-derived lipid species in HY15549 cells grown in C57CBL/6J versus NSG mice. Lipid abundance is normalized to cholesterol levels (left) or to total protein (right). Mean ± SEM, n = 3 mice/ group.
e. Abundance of hexosyl-1-ceramides in HY15549 cells grown in C57CBL/6J versus NSG mice. Lipid abundance is normalized to cholesterol levels. Mean ± SEM, n = 3 mice/ group.
f. Abundance of hexosyl-2-ceramides in HY15549 cells grown in C57CBL/6J versus NSG mice. Lipid abundance is normalized to cholesterol levels. Mean ± SEM, n = 3 mice/ group.
g. Abundance of glucosylceramides in HY15549 cells grown in C57CBL/6J versus NSG mice. Lipid abundance is normalized to cholesterol levels. Mean ± SEM, n = 3 mice/ group.
h. Abundance of sphingosines in HY15549 cells grown in C57CBL/6J versus NSG mice. Lipid abundance is normalized to cholesterol levels. Mean ± SEM, n = 3 mice/ group.
i. Abundance of sulfatides in HY15549 cells grown in C57CBL/6J versus NSG mice. Lipid abundance is normalized to cholesterol levels. Mean ± SEM, n = 3 mice/ group.
Extended Data Figure 2. Loss of Sptlc1 or Sptlc2 depletes ceramide-derived lipid species.

a. Immunoblot analysis of Sptlc1 (top) and Sptlc2 (bottom) expression in wildtype HY15549 cells or knockout and cDNA-expressing clonal pairs. Gapdh is used as a loading control.
b. Abundance of ceramide-derived lipid species in empty vector parental, Sptlc1-KO (KO) and Sptlc1-AB (AB) HY15549 cells. Abundance is normalized to cholesterol levels of each sample (left) or to protein (right). Mean ± SEM, n = 2 biological replicates/ cell line.
c. Abundance of ceramide species in empty vector parental, Sptlc1-KO (KO) and Sptlc1-AB (AB) HY15549 cells. Abundance is normalized to cholesterol levels of each sample. Mean ± SEM, n = 2 biological replicates/ cell line.
d. Abundance of hexosyl-1-ceramide species in empty vector parental, Sptlc1-KO (KO) and Sptlc1-AB (AB) HY15549 cells. Abundance is normalized to cholesterol levels of each sample. Mean ± SEM, n = 2 biological replicates/ cell line.
e. Abundance of sphingomyelin species in empty vector parental, Sptlc1-KO (KO) and Sptlc1-AB (AB) HY15549 cells. Abundance is normalized to cholesterol levels of each sample. Mean ± SEM, n = 2 biological replicates/ cell line.
f. Abundance of ceramide-derived lipid species in empty vector parental, Sptlc2-KO (KO) and Sptlc2-AB (AB, blue) HY15549 cells. Abundance is normalized to cholesterol levels of each sample. Mean ± SEM, n = 2 biological replicates/ cell line.
g. Abundance of ceramide-derived lipid species in Sptlc1-KO (KO) and Sptlc1-AB (AB) HY15549 cells grown as tumors in C57BL/6J mice for 12 days. Abundance is normalized to cholesterol levels of each sample (left) or to protein (right). Mean ± SEM, n = 2 biological replicates/ cell line.
Extended Data Figure 3. Loss of SPT impairs tumor growth in immunocompetent mice.

a. Weights of Sptlc1_sg6-KO (KO, pink) and Sptlc1_sg6-AB (AB, blue) HY15549 tumors grown in C57BL/6J, NSG, or Rag- mice corresponding to Figure 1g (left). Weights of Sptlc1_sg2-KO (KO, pink) and Sptlc1_sg2-AB (AB, blue) HY15549 tumors grown in C57BL/6J or NSG mice (middle). Weights of Sptlc2_sg2-KO (KO, pink) and Sptlc2_sg2-AB (AB, blue) HY15549 tumors grown in C57BL/6J or NSG mice (right). Mean ± SEM; n = 6 (C57BL/6J) or 7 (NSG, Rag1-) mice/ group.
b. Weights of HY15549 tumors formed from cells constitutively expressing shRNAs against LacZ (control), Sptlc1, or Sptlc2 and grown in C57BL/6J mice. The tumors measured are shown below. On the right, immunoblot analysis of Sptlc1 (above) and Sptlc2 (below) in lysates from cells kept in culture or grown as tumors. Vinculin is used as a loading control. Mean ± SEM; n = 6 mice/ group.
c. Weights of mixed population sgCTRL (gray) or sgSptlc1-KO (pink) HY15549 tumors grown subcutaneously in C57BL/6J or NSG mice. Mean ± SEM; n = 5 mice/ group. Images of tumors are shown below. Scale bar = 1 cm. Immunoblot analysis of Sptlc1is shown above. Gapdh is used as a loading control.
d. Weights of Sptlc1-KO (KO, pink) and Sptlc1-AB (AB, blue) HY15549 tumors orthotopically grown in the pancreas of C57BL/6J mice. Mean ± SEM; n = 8 mice/ group. Image of tumors is shown below. Scale bar = 1 cm. X marks tumors that were not detected at the endpoint.
Extended Data Figure 4. Sphingolipid abundance mediates tumor control.

a. Schematic of the sphingolipid metabolism focused CRISPR screen. Syngeneic cancer cell lines derived from C57BL/6J mice were transduced with the sphingolipid metabolism library and injected subcutaneously (SQ) into the flanks of C57BL/6J (B6) or NSG mice. Tumors were collected, their genomic DNA extracted, and guide RNA (sgRNA) abundance was determined. N ≥ 3 mice/ group.
b. Immunoblot analysis of Sptlc1 and Sptlc2 in HY15549 cells overexpressing empty vectors or Sptlc1 and Sptlc2 cDNA. Gapdh is used as a loading control.
c. Volcano plot showing log2 fold difference in ceramide-derived lipid species between double-empty vector wildtype (dEV) or Sptlc1/Sptlc2 double-overexpression (dOE) HY15549 cells.
d. Weights (top) and image (bottom) of double-empty vector wildtype (dEV) or Sptlc1/Sptlc2 double-overexpression (Sptlc1/2_dOE) HY15549 tumors grown in NSG mice. Mean ± SEM, n = 6 mice/ group, scale bar = 1 cm.
e. Progression (left) and disease (right) free survival analysis of TCGA PDAC patients with high (blue) or low (pink) expression of SPTLC1, SPTLC2, and KDSR. N = 177. Error bands = 95% confidence interval.
Extended Data Figure 5. Lysosomal sphingolipid salvage is sufficient to sustain cancer cell proliferation upon loss of de novo synthesis.

a. Cell doublings over time of Sptlc1 (left) or Sptlc2 (right) KO (KO, pink) and AB (AB, blue) HY15549 cells grown in vitro. Different shapes are used to distinguish distinct KO/AB clonal pairs. Mean ± SD; n = 3 biological replicates.
b. Abundance of ceramide-derived lipid species in Sptlc1_sg6-KO (KO) left untreated or supplemented with sphingosine or ceramide, and Sptlc1_sg6-AB (AB, blue) HY15549 cells. Abundance is normalized to cholesterol levels of each sample. Mean ± SEM, n = 3 biological replicates.
c. Cell doublings of parental (EV, black), Sptlc1-KO (KO, pink), and KO HY15549 cells supplemented with sphingosine-1-phosphate (S1P, 1 µM, square), sphingosine (SP, 750 nM, triangle), C2-ceramide (Cer2, 5 µM, diamond), 3-ketodihydrosphingosine (KDS, 2 µM, square), C6-ceramide (Cer6, 1 µM, triangle), cholesterol (10 µM, square), arachidonate (10 µM, triangle), or palmitate (10 µM, diamond) and treated with increasing concentrations of Bafilomycin-A1. Mean ± SD; n = 3 biological replicates.
d. Log2 fold change of ceramide-derived lipid species abundance in Sptlc1_sg6-KO (KO) HY15548 cells left untreated or treated with bafilomycin-a1 (Baf-A1) relative to Sptlc1_sg6-AB (AB) cells. N = 3 biological replicates.
e. Abundance of ceramide-derived lipid species in Sptlc1_sg6-KO (KO), left untreated or treated with Bafilomycin-A,1and Sptlc1_sg6-AB (AB, blue) HY15549 cells. Abundance is normalized to cholesterol levels of each sample. Mean ± SEM, n = 3 biological replicates.
f. Abundance of hexosyl-1-ceramide species in Sptlc1_sg6-KO (KO), left untreated or treated with Bafilomycin-A,1and Sptlc1_sg6-AB (AB, blue) HY15549 cells. Abundance is normalized to cholesterol levels of each sample. Mean ± SEM, n = 3 biological replicates.
Extended Data Figure 6. Sphingolipid depletion promotes inflammation in the tumor microenvironment.

a. Differentially expressed genes used to annotate clusters (y-axis) of sequenced CD45+ cells. Average expression is color-coded, and circle size corresponds to the percentage of cells within the cluster expressing the gene (x-axis).
b. Bar plot showing relative differences in leukocyte infiltration in Sptlc1-KO (KO) and Sptlc1-AB (AB) tumors.
c. Distribution of interferon-γ (Ifng) expression across distinct CD45+ leukocyte populations isolated from Sptlc1-KO (pink) or Sptlc1-AB (blue) HY15549 tumors grown in C57BL/6J mice. Data shown as mean ± SEM and analyzed by a two-sided Wilcoxon rank sum test with Benjamini-Hochberg correction. N = 5000 cells/ condition. Minima/maxima/center bounds are defined in the source data file.
d. Flow analysis of relative proportions of NK, CD8+ T, and CD4+ T cells isolated from Sptlc1_sg6-KO (pink) or Sptlc1_sg6-AB (blue) HY15549 tumors grown in C57BL/6J mice. Mean ± SEM; n = 5 mice/ group.
e. Mean fluorescence intensity (MFI) of CD44 in CD8+ T cells isolated from Sptlc1_sg6-KO (pink) or Sptlc1_sg6-AB (blue) HY15549 tumors grown in C57BL/6J mice. Mean ± SEM; n = 5 mice/ group.
f. Flow analysis of relative proportions of CD44+/CD62L- CD4+ T cells isolated from Sptlc1_sg6-KO (pink) or Sptlc1_sg6-AB (blue) HY15549 tumors grown in C57BL/6J mice. Mean ± SEM; n = 5 mice/ group.
g. MFI of CD44 in CD4+ T cells isolated from Sptlc1_sg6-KO (pink) or Sptlc1_sg6-AB (blue) HY15549 tumors grown in C57BL/6J mice. Mean ± SEM; n = 5 mice/ group.
h. CIBERSORT analysis on TCGA expression data for PDAC tumors estimating the fraction of infiltrating NK cells in SPTLC1/SPTLC2/KDSRlow tumors (Low, pink) compared to SPTLC1/SPTLC2/KDSRhigh (High, blue) tumors. N = 177 tumors. Minima/maxima/center bounds are defined in the source data file.
i. CIBERSORT analysis on TCGA expression data for PDAC tumors estimating the fraction of activated infiltrating NK cells in SPTLC1/SPTLC2/KDSRlow tumors (Low, pink) compared to SPTLC1/SPTLC2/KDSRhigh (High, blue) tumors. N = 177 tumors. Minima/maxima/center bounds are defined in the source data file.
j. CIBERSORT analysis on TCGA expression data for PDAC tumors estimating the fraction of infiltrating CD8+ T cells in SPTLC1/ SPTLC2/ KDSRlow tumors (Low, pink) compared to SPTLC1/ SPTLC2/ KDSRhigh (High, blue) tumors. N = 177 tumors. Minima/maxima/center bounds are defined in the source data file.
k. Histogram of IFNγ expression in NK cells monocultured or cocultured with Sptlc1_sg6-KO (pink) or Sptlc1_sg6-AB (blue) HY15549 cells.
l. Percent of IFNγ+ NK cells cocultured with Sptlc1_sg6-KO (pink) or Sptlc1_sg6-AB (blue) HY15549 cells. Mean ± SEM; n = 3 biological replicates.
m. MFI of IFNγ+ NK cells cocultured with Sptlc1_sg6-KO (pink) or Sptlc1_sg6-AB (blue) HY15549 cells. Mean ± SEM; n = 3 biological replicates.
n. Proliferation of OVA-null Sptlc1_sg6-KO (KO_EV, pink) or Sptlc1_sg6-AB (AB_EV, blue) HY15549 cells left untreated or cocultured with OT1 CD8+ T cells at the indicated E:T ratios for 98 hrs. Mean ± SEM; n = 3 biological replicates.
o. Weights and images of Sptlc1-KO HY15549 tumors grown in C57BL/6J mice left untreated (NT), or treated with depleting antibodies for NK cells, CD8+ T cells, or both. Mean ± SEM; n = 4 mice/ group. Scale bar = 1 cm. X marks tumors that were not detected at the endpoint. Analyzed using a one-way ANOVA with Benjamini-Hochberg multiple test correction.
Extended Data Figure 7. Interferon signaling pathways are activated in Sptlc1-KO cells in the presence of immune pressure.

a. PCA plot of RNA-seq from GFP+ Sptlc1_sg6-KO (KO) and Sptlc1_sg6-AB (AB) HY15549 cells grown C57BL/6J, NSG mice, or cultured in vitro (left) or in vivo (right).
b. PCA plot of RNA-seq from Sptlc1_sg6-KO (KO) and Sptlc1_sg6-AB (AB) HY15549 cells left untreated or cocultured with NK cells (2:1 E:T ratio for 5 hrs).
c. Gene set enrichment analysis of genes significantly higher in Sptlc1_sg6-KO versus Sptlc1_sg6-AB HY15549 cells left untreated or cocultured with NK cells (2:1 E:T ratio for 5 hrs). GO terms are ranked by gene ratio, adjusted P-values (FDR, −log10) are color-coded, and the circle size corresponds to the total number of genes in the gene set.
d. Second example of an immunoblot analysis of interferon-γ signaling pathway induction in Sptlc1_sg6-KO and Sptlc1_sg6-AB HY15549 cells left untreated or treated with increasing concentrations of IFNγ for 4 hrs. Gapdh is a loading control.
e. Second example of an immunoblot analysis of interferon-γ signaling pathway induction in Sptlc1_sg6-KO and Sptlc1_sg6-AB HY15549 cells cocultured with NK cells at the indicated E:T ratios for 5 hrs. Gapdh is a loading control.
f. Proliferation of double-empty vector wildtype cells (dEV, gray) and Sptlc1/Sptlc2 double-overexpression (dOE, blue) HY15549 cells treated with the indicated concentrations of IFNγ for 120 hrs. Mean ± SD; n = 3 biological replicates.
g. Immunoblot of interferon-γ signaling pathway induction in double-empty vector wildtype cells (dEV) and Sptlc1/Sptlc2 double-overexpression (dOE) HY15549 cells left untreated or treated with increasing concentrations of IFNγ for 4 hrs. Gapdh is a loading control.
h. Immunoblot of of Jak1 in Sptlc1-KO (KO), Sptlc1-AB (AB) and Sptlc1_sg6/Jak1-KO (sg_4, sg_8) HY15549 cells (top) and Sptlc1 in Sptlc1_sg6-KO (KO), Sptlc1_sg6-AB (AB) and Sptlc1_sg6/Ifngr1-KO (sg_9, sg_10) HY15549 cells (bottom). Gapdh is a loading control.
Extended Data Figure 8. Sphingolipids impact plasma membrane expression of Ifngr1.
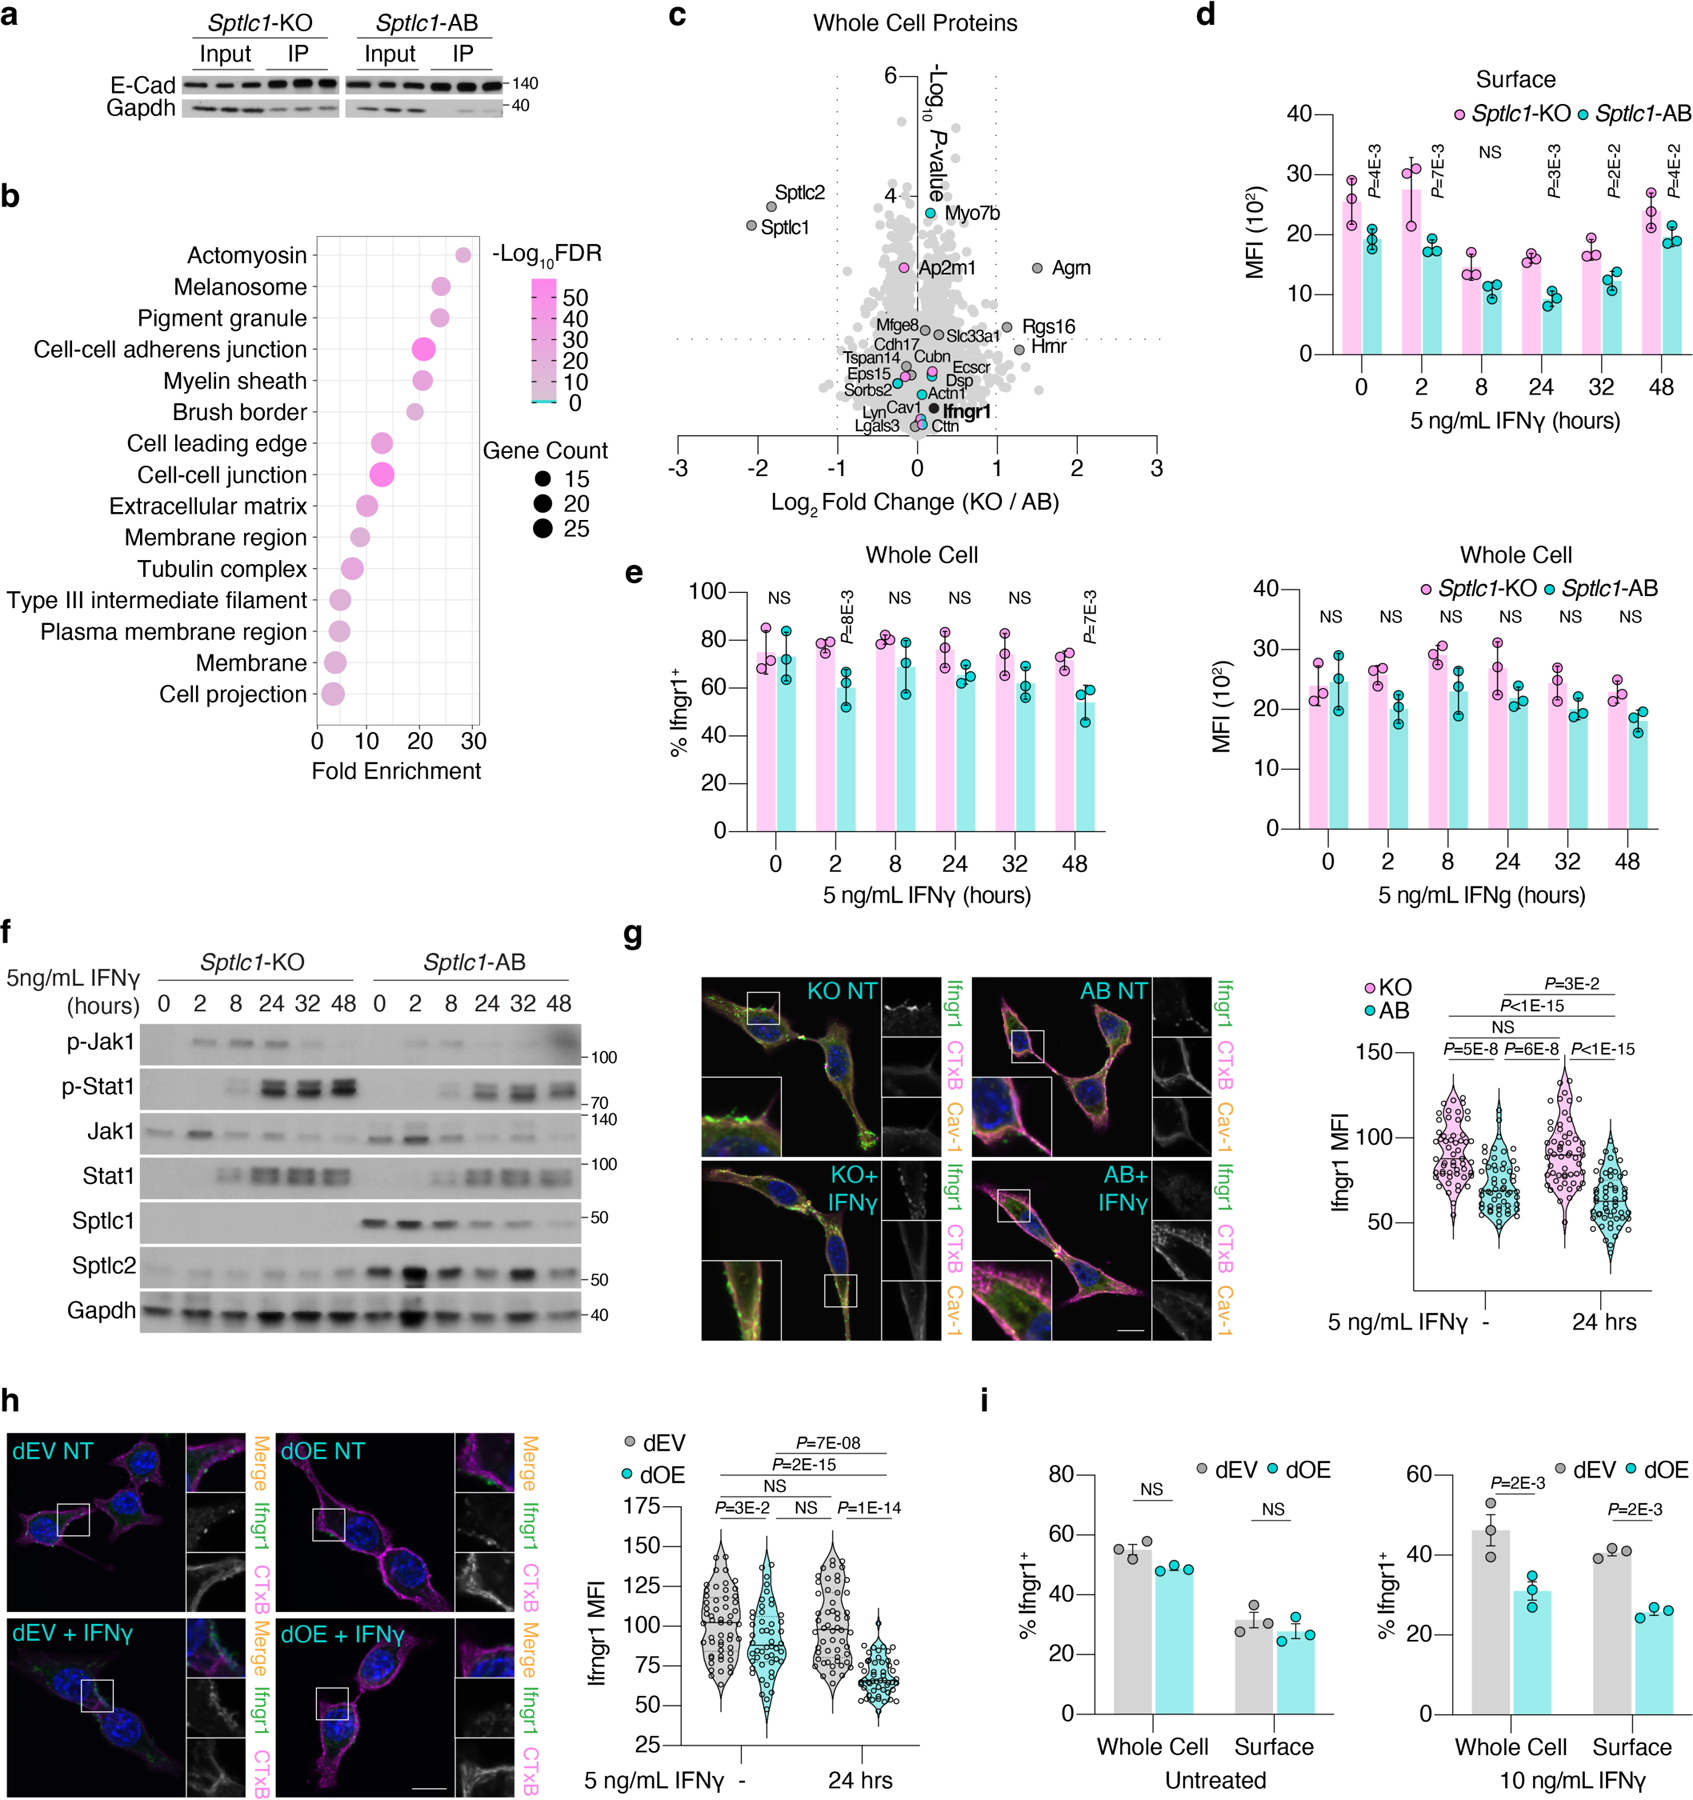
a. Immunoblot of whole cell and biotinylated plasma membrane protein lysates from Sptlc1_sg6-KO and Sptlc1_sg6-AB HY15549 cells used for proteomic analysis. E-cadherin (E-cad) is a control for membrane enrichment and Gapdh is a marker for whole cell proteins.
b. Gene set enrichment analysis of the top 206 (PSM >20) most abundant proteins detected by LC-MS in biotinylated plasma membrane protein lysates. Jensen Compartments Ontology terms are ranked by fold enrichment, adjusted P-values (FDR, −log10) are color-coded, and circle size corresponds to the total number of genes in the gene set.
c. Log2 fold difference in whole cell proteins between Sptlc1_sg6-KO and Sptlc1_sg6-AB HY15549 cells versus −log10 P-value.
d. Median fluorescence intensity of Ifngr1+ Sptlc1_sg6-KO (pink) or Sptlc1_sg6-AB (blue) HY15549 cells treated with 5 ng/mL interferon-γ for the indicated times. Mean ± SD, n = 3 biological replicates.
e. Flow analysis of Ifngr1 (left) and median fluorescence intensity (right) of Ifngr1 in permeabilized Sptlc1_sg6-KO (pink) and Sptlc1_sg6-AB (blue) HY15549 cells left untreated or treated with 5 ng/mL interferon-γ for the indicated times. Mean ± SD, n = 3 biological replicates.
f. Immunoblot of interferon-γ signaling pathway induction in Sptlc1_sg6-KO and Sptlc1_sg6-AB HY15549 cells left untreated or treated with IFNγ for the indicated times. Gapdh is a loading control.
g. Immunocytochemistry analysis of Ifngr1 and Cav1 in Sptlc1-KO (KO) and Sptlc1-AB (AB) HY15549 cells left untreated (top) or treated with 5 ng/mL IFNγ for 24 hrs. Choleratoxin B (CTxB) is used as a plasma membrane and sphingolipid abundance marker. Scale bar = 10 µm. Quantification of plasma membrane bound Ifngr1 is on the right, n = 55 cells/ condition.
h. Immunocytochemistry analysis of Ifngr1 in double-empty vector wildtype cells (dEV) and Sptlc1/Sptlc2 double-overexpression (dOE) HY15549 cells left untreated (top) or treated with 10 ng/mL IFNγ for 24 hrs. CTxB is used as a plasma membrane and sphingolipid abundance marker. Scale bar = 10 µm. Quantification of plasma membrane bound Ifngr1 is on the right, n = 50–54 cells/ condition.
i. Flow analysis of whole cell and plasma membrane expression of Ifngr1 in double-empty vector cells (dEV, gray) and Sptlc1/Sptlc2 double-overexpression (dOE, blue) HY15549 cells left untreated (left) or treated with 10 ng/mL IFNγ (right) for 24 hrs. Mean ± SEM; n = 3 biological replicates.
Extended Data Figure 9. De novo glycosphingolipid synthesis is limiting for cancer immune evasion.

a. Guide scores of genes encoding enzymes at each branchpoint of sphingolipid synthesis. Guide scores of the top 7% (pink) and bottom 20% (blue) Ifngr1+ HY15549 (top) and KP LUAD (bottom) cells transduced with the sphingolipid metabolism-focused sgRNA library are shown.
b. Abundance of ceramide-derived lipid species in Ugcg_sg5-KO (KO) and Ugcg_sg5-AB (AB, blue) HY15549 cells. Signal is normalized to cholesterol levels of each sample. Mean ± SEM, n = 3 biological replicates.
c. Abundance of hexosyl-1-ceramide species in Ugcg_sg5-KO (KO) and Ugcg_sg5-AB (AB, blue) HY15549 cells. Signal is normalized to cholesterol levels of each sample. Mean ± SEM, n = 3 biological replicates.
d. Abundance of hexosyl-2-ceramide species in Ugcg_sg5-KO (KO) and Ugcg_sg5-AB (AB, blue) HY15549 cells. Signal is normalized to cholesterol levels of each sample. Mean ± SEM, n = 3 biological replicates.
e. Flow analysis of plasma membrane glycosphingolipid levels measured by Choleratoxin B fluorescence (CTxB).
f. Flow analysis of plasma membrane expression of Ifngr1 in sgCTRL-RFP and sgUgcg-RFP HY15549 cells. Mean ± SEM; n = 3 biological replicates.
g. Weights of Ugcg_sg5-KO (KO, pink) and Ugcg_sg5-AB (AB, blue) HY15549 tumors grown in NSG mice. Tumors measured are shown below. Mean ± SEM, n = 4 mice/ group.
h. Tumor weights of mixed population HY15549 cells expressing sgCTRL-RFP or sgUgcg-RFP grown in C57BL/6J mice. Tumors measured are shown below. Mean ± SEM, n = 5 mice/ group.
Extended Data Figure 10. Pharmacological depletion of glycosphingolipids impacts immune evasion.

a. Abundance of ceramide-derived lipid species in HY15549 cells left untreated (gray) or treated with 10 µM eliglustat for 24 hours. Signal is normalized to cholesterol levels of each sample. Mean ± SEM, n = 3 biological replicates.
b. Abundance of hexosyl-1-ceramide species in HY15549 cells left untreated (gray) or treated with 10 µM eliglustat for 24 hours. Signal is normalized to cholesterol levels of each sample. Mean ± SEM, n = 3 biological replicates.
c. Abundance of hexosyl-2-ceramide species in HY15549 cells left untreated (gray) or treated with 10 µM eliglustat for 24 hours. Signal is normalized to cholesterol levels of each sample. Mean ± SEM, n = 3 biological replicates.
d. Proliferation of wildtype HY15549 (left) or KP LUAD (right) cells left untreated (gray) or pretreated with eliglustat for 24 hrs (pink) and the indicated concentrations of interferon-γ (IFNγ) for 96 hrs. Mean ± SD; n = 3 biological replicates.
e. Weights (left) and image (right) of wildtype KP LUAD tumors grown in C57BL/6J mice on the indicated treatment regimens. Mean ± SEM; n = 6 (HY15549 −/−, +/−, −/+, KPLUAD −/+) or 7 (others) mice/ group; scale bar = 1 cm. Data were analyzed using a one-way ANOVA with Tukey’s multiple test correction.
f. Survival analysis of TCGA PDAC patients with high (blue) or low (pink) expression of SPTLC1, SPTLC2, and KDSR. N = 177. Error bands = 95% confidence interval.
Supplementary Material
Acknowledgements
We thank all Birsoy Lab members for their thoughtful suggestions. We would like to thank members of the Rockefeller University Genomics Resource Center, Proteomics Resource Center, and the Flow Cytometry Resource Center for their assistance. MS is a Howard Hughes Medical Institute (HHMI) Gilliam Fellow. GU is a Damon Runyon Fellow supported by the Damon Runyon Cancer Research Foundation (DRG-2431-21). We thank Cold Spring Harbor Laboratory (CSHL) Cancer Center Imaging Core Facility supported by NCI Cancer Center Support grant 5P30CA045508. SB acknowledges funding from The Oliver S. and Jennie R. Donaldson Charitable Trust, The G. Harold & Leila Y. Mathers Foundation, STARR Cancer Consortium (I13-0052), The Mark Foundation for Cancer Research (20-028-EDV). KB is supported by the NIH/NIDDK (R01 DK123323-01), NIH/NCI (5U54CA261701-03), the Reem-Kayden award, Black Family Metastasis Research Center, and Mark Foundation Emerging Leader Award. Data was generated by the Proteomics Resource Center at The Rockefeller University (RRID:SCR_017797) using instrumentation funded by the Sohn Conferences Foundation and the Leona M. and Harry B. Helmsley Charitable Trust.
Footnotes
Declaration of Interests
K.B. is a scientific advisor to Nanocare Pharmaceuticals and Atavistik Bio. M.S. is an employee of Lime Therapeutics. The other authors have no competing interests.
Data Availability
Proteomics data have been deposited to the ProteomeXchange Consortium with the dataset identifier PXD052718. Source data have been included with this paper.
REFERENCES
- 1.Ubellacker JM et al. Lymph protects metastasizing melanoma cells from ferroptosis. Nature 585, 113–118 (2020). [DOI] [PMC free article] [PubMed] [Google Scholar]
- 2.Young RM et al. Dysregulated mTORC1 renders cells critically dependent on desaturated lipids for survival under tumor-like stress. Genes Dev 27, 1115–1131 (2013). [DOI] [PMC free article] [PubMed] [Google Scholar]
- 3.Ackerman D et al. Triglycerides Promote Lipid Homeostasis during Hypoxic Stress by Balancing Fatty Acid Saturation. Cell Reports 24, 2596–2605.e5 (2018). [DOI] [PMC free article] [PubMed] [Google Scholar]
- 4.Harayama T & Riezman H Understanding the diversity of membrane lipid composition. Nat Rev Mol Cell Biol 19, 281–296 (2018). [DOI] [PubMed] [Google Scholar]
- 5.Wymann MP & Schneiter R Lipid signalling in disease. Nat Rev Mol Cell Biol 9, 162–176 (2008). [DOI] [PubMed] [Google Scholar]
- 6.Snaebjornsson MT, Janaki-Raman S & Schulze A Greasing the Wheels of the Cancer Machine: The Role of Lipid Metabolism in Cancer. Cell Metabolism 31, 62–76 (2020). [DOI] [PubMed] [Google Scholar]
- 7.Kamphorst JJ et al. Hypoxic and Ras-transformed cells support growth by scavenging unsaturated fatty acids from lysophospholipids. Proceedings of the National Academy of Sciences 110, 8882–8887 (2013). [DOI] [PMC free article] [PubMed] [Google Scholar]
- 8.Beyaz S et al. High-fat diet enhances stemness and tumorigenicity of intestinal progenitors. Nature 531, 53–58 (2016). [DOI] [PMC free article] [PubMed] [Google Scholar]
- 9.Broadfield LA et al. Fat Induces Glucose Metabolism in Nontransformed Liver Cells and Promotes Liver Tumorigenesis. Cancer Research 81, 1988–2001 (2021). [DOI] [PMC free article] [PubMed] [Google Scholar]
- 10.Pascual G et al. Dietary palmitic acid promotes a prometastatic memory via Schwann cells. Nature 599, 485–490 (2021). [DOI] [PubMed] [Google Scholar]
- 11.Altea-Manzano P et al. A palmitate-rich metastatic niche enables metastasis growth via p65 acetylation. bioRxiv 2022.10.24.513556 (2022) doi: 10.1101/2022.10.24.513556. [DOI] [PMC free article] [PubMed] [Google Scholar]
- 12.Ringel AE et al. Obesity Shapes Metabolism in the Tumor Microenvironment to Suppress Anti-Tumor Immunity. Cell 183, 1848–1866.e26 (2020). [DOI] [PMC free article] [PubMed] [Google Scholar]
- 13.Martin-Perez M, Urdiroz-Urricelqui U, Bigas C & Benitah SA The role of lipids in cancer progression and metastasis. Cell Metabolism 34, 1675–1699 (2022). [DOI] [PubMed] [Google Scholar]
- 14.Beyaz S et al. Dietary suppression of MHC class II expression in intestinal epithelial cells enhances intestinal tumorigenesis. Cell Stem Cell 28, 1922–1935.e5 (2021). [DOI] [PMC free article] [PubMed] [Google Scholar]
- 15.Xu S et al. Uptake of oxidized lipids by the scavenger receptor CD36 promotes lipid peroxidation and dysfunction in CD8+ T cells in tumors. Immunity 54, 1561–1577.e7 (2021). [DOI] [PMC free article] [PubMed] [Google Scholar]
- 16.Ogretmen B Sphingolipid metabolism in cancer signalling and therapy. Nat Rev Cancer 18, 33–50 (2018). [DOI] [PMC free article] [PubMed] [Google Scholar]
- 17.Hannun YA & Obeid LM Sphingolipids and their metabolism in physiology and disease. Nat Rev Mol Cell Biol 19, 175–191 (2018). [DOI] [PMC free article] [PubMed] [Google Scholar]
- 18.Gault C, Obeid L & Hannun Y An overview of sphingolipid metabolism: from synthesis to breakdown. Adv Exp Med Biol 688, 1–23 (2010). [DOI] [PMC free article] [PubMed] [Google Scholar]
- 19.Codini M, Garcia-Gil M & Albi E Cholesterol and Sphingolipid Enriched Lipid Rafts as Therapeutic Targets in Cancer. Int J Mol Sci 22, 726 (2021). [DOI] [PMC free article] [PubMed] [Google Scholar]
- 20.Unlu G et al. Metabolic-scale gene activation screens identify SLCO2B1 as a heme transporter that enhances cellular iron availability. Molecular Cell 82, 2832–2843.e7 (2022). [DOI] [PMC free article] [PubMed] [Google Scholar]
- 21.Maceyka M & Spiegel S Sphingolipid metabolites in inflammatory disease. Nature 510, 58–67 (2014). [DOI] [PMC free article] [PubMed] [Google Scholar]
- 22.Corradi V et al. Emerging Diversity in Lipid–Protein Interactions. Chem. Rev 119, 5775–5848 (2019). [DOI] [PMC free article] [PubMed] [Google Scholar]
- 23.Marchetti M et al. Stat-mediated Signaling Induced by Type I and Type II Interferons (IFNs) Is Differentially Controlled through Lipid Microdomain Association and Clathrin-dependent Endocytosis of IFN Receptors. Mol Biol Cell 17, 2896–2909 (2006). [DOI] [PMC free article] [PubMed] [Google Scholar]
- 24.Blouin CM & Lamaze C Interferon Gamma Receptor: The Beginning of the Journey. Front Immunol 4, 267 (2013). [DOI] [PMC free article] [PubMed] [Google Scholar]
- 25.Kuo A et al. Murine endothelial serine palmitoyltransferase 1 (SPTLC1) is required for vascular development and systemic sphingolipid homeostasis. eLife 11, e78861. [DOI] [PMC free article] [PubMed] [Google Scholar]
- 26.Lukina E et al. Outcomes after 8 years of eliglustat therapy for Gaucher disease type 1: Final results from the Phase 2 trial. Am J Hematol 94, 29–38 (2019). [DOI] [PMC free article] [PubMed] [Google Scholar]
- 27.Gahmberg CG & Hakomori SI Altered growth behavior of malignant cells associated with changes in externally labeled glycoprotein and glycolipid. Proc Natl Acad Sci U S A 70, 3329–3333 (1973). [DOI] [PMC free article] [PubMed] [Google Scholar]
- 28.Ryland LK, Fox TE, Liu X, Loughran TP & Kester M Dysregulation of sphingolipid metabolism in cancer. Cancer Biol Ther 11, 138–149 (2011). [DOI] [PubMed] [Google Scholar]
- 29.Liu J et al. Glycolysis regulates KRAS plasma membrane localization and function through defined glycosphingolipids. Nat Commun 14, 465 (2023). [DOI] [PMC free article] [PubMed] [Google Scholar]
- 30.Jain V et al. Targeting UGCG Overcomes Resistance to Lysosomal Autophagy Inhibition. Cancer Discovery OF1–OF20 (2023) doi: 10.1158/2159-8290.CD-22-0535. [DOI] [PMC free article] [PubMed] [Google Scholar]
- 31.Commisso C et al. Macropinocytosis of protein is an amino acid supply route in Ras-transformed cells. Nature 497, 633–637 (2013). [DOI] [PMC free article] [PubMed] [Google Scholar]
- 32.Perera RM et al. Transcriptional control of the autophagy-lysosome system in pancreatic cancer. Nature 524, 361–365 (2015). [DOI] [PMC free article] [PubMed] [Google Scholar]
- 33.Zhu XG et al. Functional Genomics In Vivo Reveal Metabolic Dependencies of Pancreatic Cancer Cells. Cell Metab 33, 211–221.e6 (2021). [DOI] [PMC free article] [PubMed] [Google Scholar]
- 34.Yamamoto K et al. Autophagy promotes immune evasion of pancreatic cancer by degrading MHC-I. Nature 581, 100–105 (2020). [DOI] [PMC free article] [PubMed] [Google Scholar]
- 35.Dubrot J et al. In vivo CRISPR screens reveal the landscape of immune evasion pathways across cancer. Nat Immunol 23, 1495–1506 (2022). [DOI] [PubMed] [Google Scholar]
- 36.Lawson KA et al. Functional genomic landscape of cancer-intrinsic evasion of killing by T cells. Nature 586, 120–126 (2020). [DOI] [PMC free article] [PubMed] [Google Scholar]
- 37.Larson RC et al. CAR T cell killing requires the IFNγR pathway in solid but not liquid tumours. Nature 604, 563–570 (2022). [DOI] [PubMed] [Google Scholar]
- 38.Contreras F-X et al. Molecular recognition of a single sphingolipid species by a protein’s transmembrane domain. Nature 481, 525–529 (2012). [DOI] [PubMed] [Google Scholar]
- 39.Dubot P et al. Are Glucosylceramide-Related Sphingolipids Involved in the Increased Risk for Cancer in Gaucher Disease Patients? Review and Hypotheses. Cancers 12, 475 (2020). [DOI] [PMC free article] [PubMed] [Google Scholar]
- 40.Bardeesy N et al. Both p16Ink4a and the p19Arf-p53 pathway constrain progression of pancreatic adenocarcinoma in the mouse. Proceedings of the National Academy of Sciences 103, 5947–5952 (2006). [DOI] [PMC free article] [PubMed] [Google Scholar]
- 41.Ge SX, Jung D & Yao R ShinyGO: a graphical gene-set enrichment tool for animals and plants. Bioinformatics 36, 2628–2629 (2020). [DOI] [PMC free article] [PubMed] [Google Scholar]
- 42.Soula M et al. Metabolic determinants of cancer cell sensitivity to canonical ferroptosis inducers. Nat Chem Biol 16, 1351–1360 (2020). [DOI] [PMC free article] [PubMed] [Google Scholar]
- 43.Xue W et al. CRISPR-mediated direct mutation of cancer genes in the mouse liver. Nature 514, 380–384 (2014). [DOI] [PMC free article] [PubMed] [Google Scholar]
- 44.CDK9-mediated transcription elongation is required for MYC addiction in hepatocellular carcinoma. http://genesdev.cshlp.org/content/28/16/1800. [DOI] [PMC free article] [PubMed] [Google Scholar]
- 45.Salmon provides fast and bias-aware quantification of transcript expression | Nature Methods. https://www.nature.com/articles/nmeth.4197. [DOI] [PMC free article] [PubMed] [Google Scholar]
- 46.Moderated estimation of fold change and dispersion for RNA-seq data with DESeq2 - PubMed. https://pubmed.ncbi.nlm.nih.gov/25516281/. [DOI] [PMC free article] [PubMed] [Google Scholar]
- 47.Carbon S et al. AmiGO: online access to ontology and annotation data. Bioinformatics 25, 288–289 (2009). [DOI] [PMC free article] [PubMed] [Google Scholar]
- 48.Luecken MD & Theis FJ Current best practices in single-cell RNA-seq analysis: a tutorial. Molecular Systems Biology 15, e8746 (2019). [DOI] [PMC free article] [PubMed] [Google Scholar]
- 49.Orchestrating single-cell analysis with Bioconductor | Nature Methods. https://www.nature.com/articles/s41592-019-0654-x. [DOI] [PMC free article] [PubMed] [Google Scholar]
- 50.Butler A, Hoffman P, Smibert P, Papalexi E & Satija R Integrating single-cell transcriptomic data across different conditions, technologies, and species. Nat Biotechnol 36, 411–420 (2018). [DOI] [PMC free article] [PubMed] [Google Scholar]
- 51.Stuart T et al. Comprehensive integration of single-cell data. Cell 177, 1888–1902.e21 (2019). [DOI] [PMC free article] [PubMed] [Google Scholar]
- 52.van Dijk D et al. Recovering Gene Interactions from Single-Cell Data Using Data Diffusion. Cell 174, 716–729.e27 (2018). [DOI] [PMC free article] [PubMed] [Google Scholar]
- 53.Pan-cancer single-cell landscape of tumor-infiltrating T cells | Science. https://www.science.org/doi/10.1126/science.abe6474. [DOI] [PubMed] [Google Scholar]
- 54.Finak G et al. MAST: a flexible statistical framework for assessing transcriptional changes and characterizing heterogeneity in single-cell RNA sequencing data. Genome Biol 16, 278 (2015). [DOI] [PMC free article] [PubMed] [Google Scholar]
- 55.Bankhead P et al. QuPath: Open source software for digital pathology image analysis. Scientific Reports 7, 16878 (2017). [DOI] [PMC free article] [PubMed] [Google Scholar]
- 56.The Pan-Cancer Atlas. http://www.cell.com/pb-assets/consortium/pancanceratlas/pancani3/index.html. [Google Scholar]
- 57.Cerami1 E. et al. The cBio Cancer Genomics Portal: An Open Platform for Exploring Multidimensional Cancer Genomics Data. Cancer Discov 2, 401–404 (2012). [DOI] [PMC free article] [PubMed] [Google Scholar]
- 58. survival.pdf. [Google Scholar]
- 59.Kassambara A, Kosinski M, Biecek P & Fabian S survminer: Drawing Survival Curves using ‘ggplot2’. (2021). [Google Scholar]
- 60.Hothorn T maxstat: Maximally Selected Rank Statistics. (2017). [Google Scholar]
- 61.Newman AM et al. Robust enumeration of cell subsets from tissue expression profiles. Nature Methods 12, 453–457 (2015). [DOI] [PMC free article] [PubMed] [Google Scholar]
- 62.Thorsson V et al. The Immune Landscape of Cancer. Immunity 48, 812–830.e14 (2018). [DOI] [PMC free article] [PubMed] [Google Scholar]
Associated Data
This section collects any data citations, data availability statements, or supplementary materials included in this article.
Supplementary Materials
Data Availability Statement
Proteomics data have been deposited to the ProteomeXchange Consortium with the dataset identifier PXD052718. Source data have been included with this paper.