

Abstract
Native mass spectrometry (nMS) enables intact non-covalent complexes to be studied in the gas-phase. nMS can provide information on composition, stoichiometry, topology, and when coupled with surface-induced dissociation (SID), subunit connectivity. Here we describe the characterization of protein complexes by nMS and SID. Substructural information obtained using this method is consistent with the solved complex structure, when a structure exists. This provides confidence that the method can also be used to obtain substructural information for unknowns, providing insight into subunit connectivity and arrangements. High energy SID can also provide information on proteoforms present. Previously SID has been limited to a few in-house modified instruments and here we focus on SID implemented within an in-house modified Q Exactive UHMR. However, SID is currently commercially available within the Waters Select Series Cyclic IMS instrument. Projects are underway that involve the NIH-funded native MS resource (nativems.osu.edu), instrument vendors, and third-party vendors, with the hope of bringing the technology to more platforms and labs in the near future. Currently, nMS resource staff can perform SID experiments for interested research groups.
Keywords: Native Mass Spectrometry, Proteoform identification, Protein complex, Surface-induced dissociation, High resolution mass spectrometry, Protein mass spectrometry
1. Introduction
Native mass spectrometry (nMS) has emerged as a powerful tool in the structural biologist’s toolbox, enabling intact non-covalent complexes to be transferred and studied in the gas-phase.[1–3] nMS typically utilizes nano-electrospray ionization (nESI), non-denaturing solution conditions (most commonly ammonium acetate), and soft instrumental conditions, which have enabled protein-protein, protein-ligand and protein-RNA/DNA complexes to be studied.[3–6] nMS is advantageous in such studies as the sample requirements are low, typically microliters of sample at micromolar or lower concentrations. In addition, nMS can handle heterogenous samples and therefore is advantageous in the study of samples with multiple proteoforms.[7–9]
The first stage of a nMS experiment typically involves introducing the intact non-covalent complex into the gas-phase and measuring its mass. However, in order to confirm composition, stoichiometry, determine which proteoforms are present, or to obtain substructural information it is often necessary to dissociate the complex. The most commonly used method of dissociation in nMS is collision-induced dissociation (CID), which is incorporated into almost all tandem mass spectrometers. In CID the analyte ion is accelerated into a neutral collision gas (typically nitrogen or argon), the ion undergoes multiple low energy collisions with the gas molecules resulting in a step-wise buildup of internal energy which results in dissociation. For protein complexes CID typically causes unfolding/restructuring and results in a highly charged monomer being ejected from the complex.[10–12] Hence CID can provide information on the monomeric molecular weights, and often proteoforms, but provides limited information on connectivity. An alternative method of dissociation that has been increasingly applied to study protein complexes is surface-induced dissociation (SID).[13] In SID the analytes are accelerated towards, and collide against, a surface. This is a very rapid energy deposition process and dissociation can occur without unfolding. SID has been shown to be advantageous in protein structural studies as SID typically cleaves the weakest interfaces in protein complexes first, providing substructural information consistent with the solved structures, when available.[14–16] We demonstrate here the use of nMS and SID for protein complex, and proteoform characterization. The discussion in this chapter focuses on the use of the Thermo Scientific Q Exactive UHMR for these studies, while different instrument platforms can be used for SID studies the high resolution, and sensitivity, of this instrument is beneficial in proteoform characterization studies.[17]
2. Equipment and Materials
2.1. SAM surface preparation
Suitable gold coated surface- we use 17-mm × 13-mm ×0.5-mm gold surface slide [the glass surface is coated with a 50 Å layer of Ti and then a 1,000 Å layer of Au] (custom ordered from EMF corp).
1 mM perflourothiol (FC12) in ethanol, synthesis of which has been previously described.[14]
200 proof ethanol
20 mL scintillation vial
Soft tipped tweezers or stainless-steel tweezers with the ends wrapped in Teflon tape
UV cleaner
Sonicator
2.2. Offline sample preparation
Ammonium acetate (≥99.99%)
Ultrapure water
-
Either
Spin column (e.g., Biorad micro bio-spin p6)
Dialysis cassette (e.g., Pierce 96-well microdialysis plates)
Centrifugal concentrator (e.g., Amicon Ultra 0.5 centrifugal filters)
Centrifuge, capable of going to 14,000 × g if using a centrifugal concentrator
Shaker plate for dialysis
2.3. Pulling and loading nESI tips
Glass capillaries (we use glass capillaries with a 1.0 mm OD and 0.78 mm ID with a glass filament)
Tip puller (we use a P97 puller from Sutter instrument Co with a 3.0 mm box filament installed)
Platinum wire 0.25 mm diameter
Gel loader tips or glass syringe
2.4. Calibration of Q Exactive UHMR
Cesium iodide
Isopropanol
Ultrapure water
2.5. SID on a Q Exactive UHMR[18, 19]
Flange for back of HCD cell with Fisher connector feed through
Switch to convert between using onboard power supplies and external power supply to apply the C-trap offset
Two 10-channel power supplies, and appropriate cables to connect one to Fisher connector for SID device and one to control the C-trap offset
Access to control C-trap offset entrance and exit inject voltages
3. Methods
3.1. How is SID implemented in different mass spectrometers?
SID was first developed by Cooks and co-workers and since has been implemented by several groups coupled with multiple different mass analyzers,[20–27] initially for small molecule and peptide fragmentation. In recent years SID has been incorporated by Wysocki and coworkers into several different types of mass spectrometer and applied to the study of protein complexes. These include quadrupole time-of-flight (QTOF),[28, 29] ion mobility Q-TOFs (Q-IM-TOF),[30] Fourier Transform ion cyclotron resonance (FTICR),[31–33] and Orbitrap mass spectrometers.[18, 34] In all cases the instruments were modified in-house to incorporate a SID device, the design of which depends on the instrument in question. In its simplest form the SID device consists of a surface, optics to steer the ion beam towards the surface and optics to collect the fragments after surface collision. In all cases the SID device can be operated either in “transmission mode” where the ion beam passes through the device or “SID” mode where the ion beam is directed towards and collides against the surface.
A schematic representation of an SID device designed by Zhou et. al.,[30] and installed into a Waters Synapt G2 instrument is shown in Figure 1. In this instrument, the SID device can be placed before or after the mobility cell by truncating either the trap or transfer CID cell to make space for the SID device.[30, 35] The truncated CID cells can still be used to perform CID and hence this functionality is not lost through the incorporation of SID. Incorporation of SID before IM allows SID products to be separated by mobility, which is advantageous as species may overlap in m/z (e.g a singly charged monomer and doubly charged dimer would have the same m/z but would be separated in the IM dimension). While incorporation after IM allows mobility separated species to be individually interrogated. Furthermore, SID can be incorporated in both locations in SID-IM-SID studies enabling multistage dissociation experiments to be performed and giving increased information on connectivity.[36] Similar SID devices have been installed in a Bruker 15T FTICR,[31, 32] Thermo Exactive plus EMR[18] and Q Exactive plus UHMR.[34] On the Bruker 15T FTICR the standard collision cell was replaced with a custom designed cell which incorporates both an SID device and a CID cell.[31, 32] In these designs and the device incorporated into the Q Exactive UHMR, discussed below, a fluorocarbon self-assembled monolayer (SAM) was used as the surface and directions for preparing the surface are given in the following section.
Figure 1:
Schematic representation of an SID device incorporated into a Waters Synapt G2.[30]
More recently, a very simple split lens SID device has been reported by Snyder et. al.,[33] reducing the number of electrodes from 10–12 to three, and the device size to several millimeters. This split lens device has been in-house incorporated into multiple mass spectrometers; replacing the entrance lens on the Bruker FT-ICR collision cell, the dynamic range enhancement lens on a Waters Synapt, or the exit lens of a transfer multipole in a Thermo Scientific Extended Mass Range Orbitrap. In this design the surface is a stainless-steel electrode, as opposed to a SAM and therefore users do not need to prepare a surface in the traditional way. This device is now commercially available in the Waters Select Series Cyclic IMS, enabling researchers to perform SID without having to modify their instrument in-house.
3.2. Incorporation of SID into a Thermo Scientific Q Exactive UHMR
In the Q Exactive UHMR, a 4 cm SID device is fabricated and placed between the quadrupole and the C-trap, replacing the transport multipole, as shown in Figure 2. A similar design was previously incorporated in the same location into an Exactive EMR,[18] which was modified to include a quadrupole. To supply the voltages to the SID device a modified flange is installed behind the HCD cell, to provide the necessary feedthrough connections. Voltages are supplied with an external power supply (Ardara Technologies, Ardara, PA). When operating in transmission mode (no surface collision) voltages are applied to the entrance and exit lenses of the device to help with ion focusing and transmission. When operating in SID mode the ion beam is directed towards the surface for collision, and the products are then collected and guided towards the C-trap with the rear electrodes. The SID voltage is defined as the voltage difference between the last optic before the SID device or the SID entrance lens and the surface. In order to increase the SID voltage the post-surface optics in the SID device are made more negative along with the C-trap DC offset during injection. Higher SID energies are achieved by modifying the ion optics board, to enable the C-trap DC offset during the injection step to be applied by an external power supply. This is achieved through the use of a circuit with a switch that allows a user to switch between supplying the C-trap offset from the onboard power-supply (typical for MS experiments when no SID is required) to the external power supply (when SID is desired).[18] More details on tuning the SID device for transmission and SID modes can be found in the following sections.
Figure 2:

A) Schematic representation of a modified Q Exactive UHMR with SID installed in place of the transport multiple (Reproduced from Ref [34] with permission from The Royal Society of Chemistry) and B) photograph of surface assembly.
3.3. Preparing a self-assembled monolayer surface
The majority of protein complex SID studies have been performed using a perfluorothiol (FC12) SAM assembled on a 17-mm × 13-mm ×0.5-mm gold surface slide (1,000 Å of Au on 50 Å of Ti on glass). While preparing a surface care must be taken to avoid scratching or damaging the gold surface, this is best done by handling the surface only by the edges using soft tipped tweezers or tweezers wrapped in Teflon tape.
Perfluorothiol can be synthesized following a previously established protocol.[14]
Prepare a 1 mM solution of perfluorothiol in ethanol. The FC12 stock solution should be stored at 4 °C wrapped in aluminum foil to prevent exposure to light, for long term storage it is recommended to store under nitrogen to reduce oxidation of the thiol.
Clean the surface with ethanol and then dry with nitrogen.
The surface should then be UV cleaned (gold side up) for 15 minutes.
Place the surface into a scintillation vial, gold surface side up, and cover with ~2–3 mL of 1mM FC12. Incubate overnight at room temperature in the dark, best achieved by wrapping the vial in aluminum foil.
Remove the FC12 solution and sonicate in ethanol for 1 minute, repeat the wash step 6 times. If using immediately dry with nitrogen after the final wash step, alternatively the surface can be stored for future use in ethanol.
Once dry the surface can be installed in the surface holder (shown in Figure 2B).
The FC12 SAM surface should be replaced every time the instrument is vented, venting can allow residual oil from turbomolecular pumps to deposit on the surface, changing the surface properties, hence a fresh surface should be installed after every instrument vent.
3.4. Sample preparation for native MS
For native mass spectrometry samples should be prepared in a MS compatible electrolyte solution, typically ammonium acetate (See Note 1), with or without triethyl ammonium acetate for charge reduction, or ethylenediamine diacetate.[37],[38] Prior to analysis samples can be buffer exchanged into the MS compatible electrolyte solutions and non-volatile components are removed (e.g. salts, additives, electrolytes), however low concentrations of some components can be retained in solution if required for activity or stability.[39, 40] Buffer exchange can be performed either offline or online to the MS. Offline buffer exchange typically uses either buffer exchange spin column, dialysis, or diafiltration. Alternatively, during the last stages of protein purification AmAc can be used as the electrolyte solution, avoiding the need for buffer exchange later on.
3.4.1. Buffer exchange spin columns
The quickest offline buffer exchange method is to use a buffer exchange spin column. We typically use the Biorad Micro P6 spin columns. Buffer exchange can be achieved following the manufacturers protocol (See Notes 2–4).
3.4.2. Concentration and Diafiltration
An alternative method of buffer exchange is diafiltration or ultrafiltration, utilizing a molecular weight cut-off (MWCO) filter. This method can be used to concentrate your sample at the same time if required. We typically use Amicon-ultra 0.5 mL concentrators which have a range of MWCOs (See Note 5). The appropriate MWCO is chosen based on the protein of interest. The MWCO is dependent on the hydrodynamic radii rather than the true molecular weight, and therefore care should be taken with proteins which have a small hydrodynamic radii. The MWCO chosen should typically be at most half of the molecular weight of the smallest protein of interest. To perform diafiltration follow the recommended manufacturers protocol (See Note 6).
3.4.3. Dialysis
Dialysis is a more time-consuming method of buffer exchange but is more efficient at removing high concentrations of salts and non-volatiles. There are multiple different dialysis cassettes that can be used, the choice of which will depend both on the MWCO required and sample volumes. We are typically working with sample volumes of 10–100 μL and hence use either the Thermo slide-A-Lyzer mini (see Note 7) or the Pierce 96-well Microdialysis cassettes (See Note 8). For the Pierce 96-well microdialysis cassettes a single cassette can be used and placed in a microcentrifuge tube instead of the 96-well format if desired. In both cases the manufacturers protocol should be followed.
3.4.4. Online buffer exchange
An alternative to the offline buffer exchange methods summarized here is to perform the exchange online to the MS. Online buffer exchange (OBE) utilizes liquid chromatography, with a non-denaturing mobile phase such as ammonium acetate, directly coupled to the MS.[41] In this case samples in MS incompatible buffers are injected onto a short size exclusion column which separates the protein from the small salt molecules, which can be diverted away from the MS to waste. The proteins are eluted in the non-denaturing mobile phase and directly analyzed with MS. A detailed protocol describing how to perform online buffer exchange has been previously reported.[41] More recently, OBE has been coupled with affinity purification online to an MS allowing the rapid screening of his-tagged protein overexpression.[42] In this approach cells can be lysed, clarified and then injected onto the LC first being loaded onto a Ni-NTA column to which the his-tagged proteins will bind. These proteins are then eluted with imidazole and loaded onto the second column, a short SEC column for OBE, before being introduced into the MS. This rapid screening approach is particularly useful when screening overexpression conditions. Finally, when looking at abundant proteins produced from overexpression samples can be lysed with ammonium acetate and then directly analyzed, removing the requirement to exchange into AmAc.[43][44, 45]
3.5. Pulling nanospray needles
The majority of nMS experiments are performed via static nanospray ionization (nESI), using glass or quartz capillaries that have been pulled into a small tip, typically of ~1 μm inner diameter although for some applications much smaller tip sizes are used.[46, 47] In order to apply the spray potential users can either use capillaries which are coated with a conductive material or simply insert a platinum wire into the solution, ensuring the platinum wire is in contact with the sample holder to which the potential is applied (see details below). Coated capillaries are commercially available from multiple vendors including New Objective and Thermo Scientific. With a suitable tip-puller however, capillaries can be made in-house, which can be more cost efficient. A detailed protocol has been previously reported for how to pull, sputter coat in gold, and then clip very small capillaries suitable for use with backing pressure (applying low gas flows or pressure to the back of the capillary to help start or maintain spray).[48] Here we present a protocol for pulling open tips which do not need to be clipped and are used without sputter coating. We use a P97 Sutter Instrument Co. puller with a 3.0 × 3.0 mm box filament puller. While the exact parameters will need to be reoptimized when changing filaments, and between tip pullers, Table 1 below gives some standard settings that can be used as a starting point. It is also important to note that settings will vary for different types of capillaries - we use filaments with a 1.0 mm outer diameter and 0.78 mm inner diameter and a glass filament (Sutter Instrument Co.), (See Note 9).
Loosen the knobs on both puller bars. Place a glass capillary in the groove on one of the puller bars, push glass slowly through the clamp until 1–2 cm of the capillary protrudes through the clamp. Carefully tighten the clamp so the capillary is secure but be sure to not over tighten and risk damaging the glass.
Push the puller release on both puller bars and carefully move the puller bars towards the filament. While holding the two puller bars in place with one hand, use the other hand to slightly loosen the clamp on the glass. Carefully slide the capillary through the filament, until it is roughly centered and then tighten both clamps. Ensure the capillary stays within the groove on the puller bars during this process to avoid damage to the filament.
Press “pull” on your desired program, once the glass has been pulled into two tips remove them from the tip puller (See Note 10). After pulling, needles can be stored in either a petri dish, with a double sided adhesive pad attached to the bottom or a pipette tip box, with the adhesive pad attached to the tip rack. The adhesive pad will hold the needles in place, above the bottom of the container, which will stop them from getting damaged.
Optional: for our set-up the needles pulled in the previous steps are too long, so we cut 2–3 cm of the open end of the capillary using a glass cutter before loading.
Table 1:
Typical puller program values for a 3.0 mm box filament and 1.0 mm outer diameter and 0.78 mm inner diameter borosilicate capillaries containing a glass filament.
| Heat | Pull | Velocity | Time |
|---|---|---|---|
| Ramp test value+5 | 15–40 | 15–40 | 200 |
3.6. Getting spray and tuning the MS
3.6.1. Mass calibration
The Q Exactive UHMR is calibrated using a 2 mg/mL solution of cesium iodide (CsI) prepared in 50:50 water:isopropanol. To calibrate, the heated electrospray ionization (HESI) source should be installed, along with the sweep cone. Fresh CsI solution should be prepared immediately before calibration, and spray and signal allowed to stabilize before attempting calibration. To mass calibrate follow the protocol outlined in the Q Exactive UHMR quickstart guide. The frequency of calibration will depend on the experimental needs. It should be noted that CsI can contaminate the front end of the instrument, typically we use a dedicated ion transfer tube for calibration and switch to a different one for running samples.
3.6.2. Acquiring MS spectra for protein complexes
For an SID in-house modified instrument; set the circuit so that the C-trap offset is being applied by the instrument power supply, turn on the external power supplies and set the voltage to appropriate transmission mode settings. Table 2 below gives typical voltages applied to the front-end instrument optics along with the SID device for transmission mode.
Set your trap gas to the desired value typically we use between 2–9 Arb., with higher pressure and hence higher trap gas being required for larger protein complexes.
- Set an appropriate mass range for the sample being analyzed. The expected average charge state () can be estimated from equation 1 below,[49] we recommend initially setting the mass range so you are scanning from 500 m/z to ~2 times above the expected m/z of your species. For example, if the protein complex is expected to be observed ~6000 m/z acquire from 500 to 12000 m/z initially. This is to ensure you observe any smaller or larger species than may be present in your sample. The mass range can then be narrowed as required.
[1] Remove the peek screw at the back of the sample holder and thread a platinum wire through the sample holder. Make sure that there is contact between the sample holder and the wire by carefully bending the wire to form a loop and covering the loop in aluminum foil to provide extra stability (Figure 3). Replace the peek screw on the back of the sample holder. Once this set up is established the wire can be left in place, and does not need to be removed between samples. To avoid cross contamination the wire can be carefully rinsed with water or methanol between samples.
Load 2–3 μL of your sample (~1 μM concentration or lower) into a pulled needle. For this step you can either use a glass syringe (e.g., a Hamilton 10 μL 1700 series with an N termination) or gel loader tips (e.g., 0.5 – 10 μL Micro gel tips from Genesee Scientific). To remove air bubbles and ensure that the solution is at the bottom of the tip, glass capillaries can be carefully spun down using a mini centrifuge. If using a glass syringe to fill nESI needles, the syringe should be flushed with a 50:50 water:methanol solution several times between samples.
Carefully push the back of the needle onto the platinum wire so the wire is in contact with solution and push the needle through the peek nut (note: if backing pressure is required, a soft ferrule should be installed between the needle holder and the peek nut to allow for proper sealing, a 3 mL syringe can be connected to the sample holder to provide the necessary backing pressure), see Figure 3. Tighten the peek nut so the sample is held securely
Push source bottom into the instrument so the source is sealed, and the interlock is fulfilled. Using the adjustment knobs on the XYZ manipulator of the source adjust the tip position so it is centered with the sample inlet and approximately 5–10 mm away from the inlet.
Optional: If using backing pressure slowly push on the syringe until a droplet appears at the end of the nESI needle.
Turn the instrument into operate and apply a capillary voltage to begin the spray. We find a higher spray voltage (~0.9–1.1 kV) is often needed to start the spray after which the capillary voltage can be dropped to (~0.6–0.9 kV) for analysis. Once you have spray the tip position should be optimized (optimizing both for intensity and spectral quality), typically we find moving further back from the inlet is preferred as well as moving the tip either up or down so it is not directly level with the inlet.
-
Tune the instrument to optimize signal while avoiding activation (see Note 11) and dissociation. Detailed information on the modifications that have been made to the Exactive platform to optimize it for high-mass transmission can be found elsewhere.[50, 51] We typically begin in the front end of the instrument and work our way towards the analyzer, see Figure 2A. Normally, we work with fixed injection times (of 100–200 ms), which are optimized based on signal to avoid overfilling and hence space-charge effects. When tuning for the first time we recommend acquiring the data while you tune so you can easily note any changes (e.g., activation) as you tune.
Source temperature: increasing the source temperature can aid in desolvation however high source temperatures could result in activation. We typically work at 200–250 °C.
In source CID: applying low in source CID voltages can aid desolvation but can also cause activation.
In source trapping: For improved desolvation of protein complexes we typically use in-source trapping as opposed to in source CID, as this gives better kinetic control of the ions. Higher in-source trapping voltages will strip off more adducts, however, can result in dissociation and/or activation and resturcturing (See Note 11).[17] Therefore, we recommend keeping this as low as possible (5–50 V works well for most of our soluble protein complexes prepared in AmAc without additives).
Flatapoles: The voltages on the injection, inter and bent flatapole should be optimized for transmission but care should be taken to minimize the voltages in this region to avoid activation. For SID, the SID voltage is defined as the difference between the bent flatapole and SID surface which is typically ~5 V hence for SID the SID voltage is the surface voltage plus 5 V, significantly higher voltages here will therefore impact the definition of the SID voltage (see section 3.7 Tuning SID for a range of energies).
Ion transfer target m/z: The ion transfer target controls the RF amplitudes on the inject flatapole, bent flatapole, transport multipole, and HCD cell and can be set to high, low or manually set. For the majority of protein complexes we work in high m/z mode, however if smaller peptides or ligands are also present in the sample the RF amplitudes may need to be manually tuned to allow both to be observed.
Detector m/z optimization: This setting changes the voltages and timing by which ions are pulsed into the Orbitrap. In our experience “low” tends to work well for most protein complexes until you reach very large ions (>15,000 m/z)
Extended trapping: Extended trapping allows ions to be transferred into the HCD cell before being transferred into the C-trap and is useful for collisionally cooling large ions.[51]
HCD voltage: Applying low HCD voltages can increase spectral quality by removing any residual adducts. Typically, we prefer to use in-source trapping or in-source CID so the sample is cleaned up before mass selection in the quadrupole when selecting a single species.
Trap gas: The trap gas, which controls the pressure of the HCD cell, should be optimized for each system. Generally increasing the trap gas helps with trapping and collision cooling of larger systems, however, when doing HCD to generate monomers this setting may need to be decreased, as discussed below.
Resolution: The resolution setting is the resolution at 400 m/z, increasing the resolution increases the transient time allowing higher resolution data to be acquired. However, signal decay can be observed using long transients due to collisions of the protein ions with background gas molecules[52] and hence spectral quality may decrease with increased resolution, for intact protein complexes we typically use resolution settings of ≤25K.
Once tuned, long acquisitions are not necessary, with sufficient signal intensity (normalized level of ≥ mid E4). Typical acquisitions for full MS are 50 scans. The length of time will depend on the injection time and resolution setting used. A typical MS spectrum for the 20S proteasome, biochemically purified from rat liver,[7] a ~717 kDa hetero 28-mer acquired at 3,125K resolution, with trap gas 9, and −50 V in source trapping is shown in Figure 4.
Table 2:
Typical voltages applied during transmission mode and SID mode on a Q Exactive UHMR.
| Transmission mode (voltage unless otherwise stated) | SID 45 V (voltage unless otherwise stated) | |
|---|---|---|
| Source temperature | 200–250 °C | 200–250 °C |
| Injection flatapole | 8 | 8 |
| Inter flatapole | 5 | 5 |
| Bent flatapole | 2 | 2 |
| C-trap entrance lens inject | 1.8 | −29 |
| C-trap exit lens inject | 16 | −20 |
| Entrance 1–3 | −5 | −5 |
| Entrance 2 | 5 | 6 |
| Front top | 0 | −23.5 |
| Front bottom | 0 | −9.5 |
| Surface | 0 | −40 |
| Middle Bottom | 0 | −110 |
| Back top | 0 | −154 |
| Back bottom | 0 | −90 |
| Exit 1–3 | −20 | −30 |
| Exit 2 | 2 | −50 |
| C-trap offset | - | −35 |
Note, these voltages should be tuned and optimized for each instrument and after venting and surface replacement.
Figure 3:

Photographs of the static nESI sample holder for a nano-flexspray source with platinum wire inserted. A) Back view with peek screw removed. The piece of aluminum foil, inserted in the metal housing can be observed. B) After assembly of the sample holder, the platinum wire must be in contact with the aluminum inside the metal housing and protrude from the front of the peek nut. The red peek screw is connected to a 3 mL syringe for backing pressure. C) Sample holder with filled nESI needle, ready for analysis. The platinum wire is inserted inside the needle and is in direct contact with the sample.
Figure 4:

Mass spectrum of 1 μM rat 20S proteasome prepared in 150 mM AmAc and acquired with −50 V in-source trapping, trap gas 9 and a resolution of 3,125 K. Measured mass is 719, 173 ± 160 Da
3.6.3. CID for protein complex characterization
Almost all instruments used for native MS are equipped to perform CID. CID involves accelerating the ion of interest into a neutral collision gas, the ions undergo multiple collisions with the collision gas and dissociation typically proceeds via an unfolding/rearrangement mechanism producing unfolded and highly charged monomer and the complementary N-1mer, sometimes with sequential monomer losses. CID is therefore a useful tool for confirming the stoichiometry of the complex, determining the molecular weight of the monomers and identifying proteoforms present.[53]
Optional: it is not necessary to mass select a single charge state to perform CID. Depending on the signal intensity we either select a single charge state of species using a narrow window (width of 2–20 m/z units) or select the entire charge state distribution (CSD) for dissociation. Selecting the entire CSD is beneficial when signal is too low to select a single peak but multiple species are present.
Gradually increase the HCD CE voltage in steps of ~20 V until dissociation is observed. For confirming stoichiometry we aim to achieve balance between monomers and N-1mers. In order to achieve balance between the products, the trap gas should be optimized (Figure 5A), along with the HCD field gradient purge (the electrical field by which ions are ejected from the HCD cell). Resolution can also bias mass distributions with lower resolutions typically providing better balance. For proteoform characterization we aim to produce as abundant monomers as possible, using higher HCD voltages and tuning with lower trap gases to better transmit these species (Figure 5B).
Figure 5:

250 V HCD of 20S proteasome from rat prepared in 150 mM AmAc, acquired with −50 V in-source trapping at 3, 125 K resolution. A) acquired with trap gas 6 B) acquired with trap gas 4. Identity of the monomers observed in B will be discussed below in the section on interpreting the data.
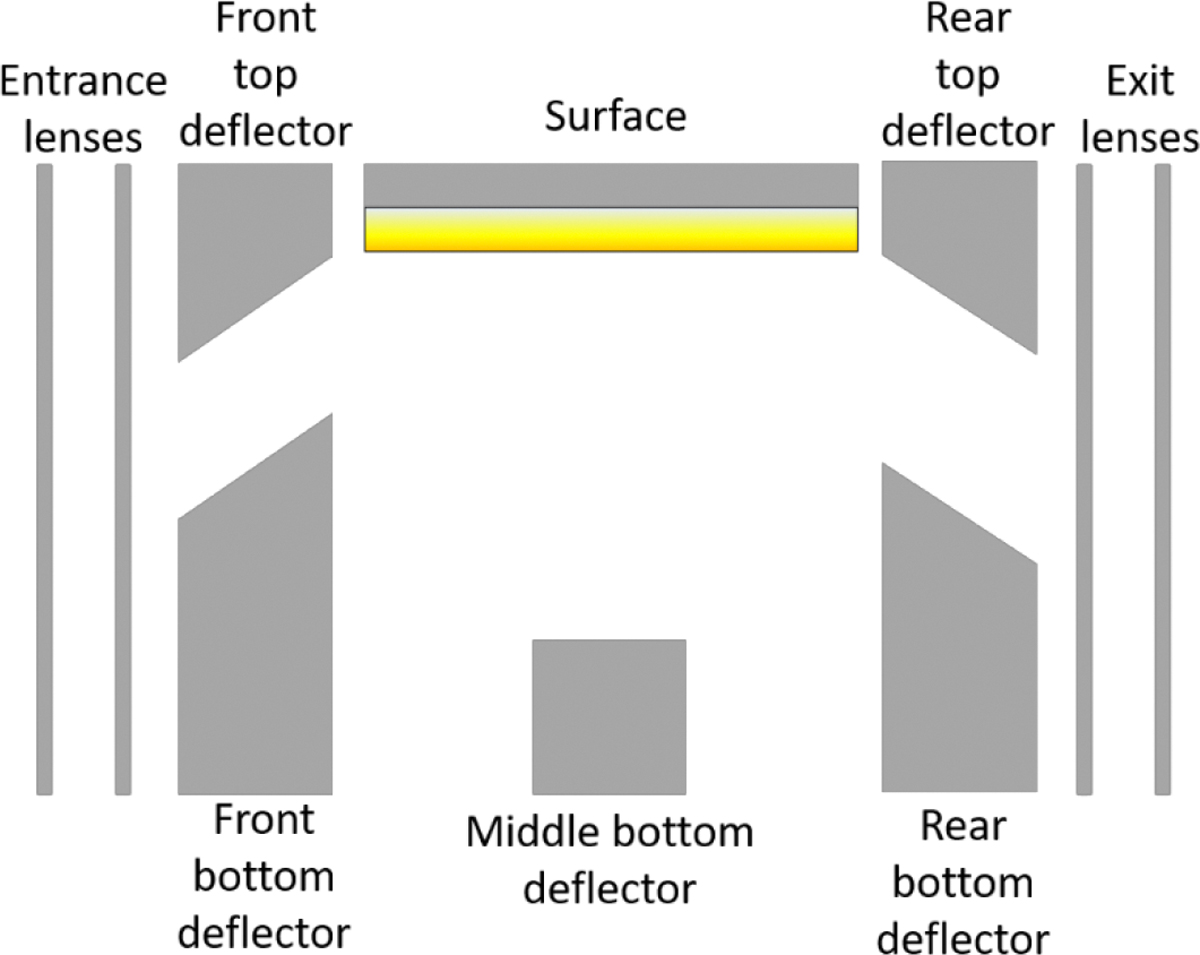
3.7. Tuning SID over a range of energies
In order to perform SID the ion beam has to be guided towards, and collide against, the surface following which the ions need to be collected and transmitted to the rest of the instrument. In the modified Q Exactive UHMR and EMR (See Note 12) this is achieved by tuning the front deflector such that the ions are attracted towards the front top deflector and hence towards the surface and the back deflector more attractive to pull ions off the surface and towards the rest of the instrument (see Table 2). The SID voltage is defined as the difference between the bent flatapole (typically held ~ 5 V) and the surface and hence SID voltage is generally defined as the surface voltage plus 5 V, see Figure 6.[18] The SID energy however is defined as the SID voltage multiplied by the charge state (e.g for an 11+ precursor SID 45 V would equal an SID energy of 495 eV). If multiple charge states are selected for dissociation a single SID energy cannot be defined, however, using the average charge state, the average energy can be determined (average charge state multiplied by the voltage).
Figure 6:

Relative voltage diagram showing how the SID voltage is defined (the difference between the voltage difference between the last optic before the SID device or the SID entrance lens and the surface. Increasing SID voltages are achieved by lowering the C-trap offset (during the injection) and lowering the SID devices from the surface onwards. Adapted with permission from VanAernum et. al., Anal Chem, 2019, 91, 3611.[18] Copyright (2019) American Chemical Society
When initially tuning in SID, it is recommended to use a protein standard, of known structure, which has previously been studied with SID and hence has well known dissociation products, e.g. streptavidin (dimer of dimers produces dimers with SID) or C-reactive protein (cyclic pentamer produces monomer to tetramer with SID).[14, 16, 54] For structural information it is recommended to prepare the sample under charge reducing conditions (typically containing 20% by volume TEAA[11, 55]). Low voltage (or energy) SID is particularly useful for studying the structure of protein complexes as they typically cleave at the weakest interfaces first, particularly when samples are prepared under charge reducing conditions.[14, 54] The rat 20S proteasome was subjected to low voltage SID under both normal charge and charge reduced conditions, as shown in Figure 7A and B. When prepared under charge reducing conditions the dominant product is the 7α ring (Figure 7B), an observation that is consistent with previous SID studies and the cryo-EM structure.[7] When the sample is prepared without a charge reducing agent, the 7α ring is observed, however, competing pathways are also present such as the production of α monomers and the complementary 20S-α (Figure 7A), highlighting the importance of charge reduction in structural studies by SID.
Figure 7:

Lower energy SID of rat 20S proteasome acquired with −50 V in-source trapping at 3,125 K resolution and a trap gas of 9. Prepared in either A) 150 mM AmAc (average charge state of precursor +61, determined from UniDec[59]) and acquired with 85 V SID (corresponding to an average energy of 5,185 eV) or B) 120 mM AmAc + 30 mM TEAA (average charge state of precursor +45, determined from UniDec) and acquired with 105 V SID (corresponding to an average energy of 4,725 eV).
When increasing the SID voltage on the Orbitrap platforms, as the front-end optics cannot be increased to very high voltages, the back end of the SID device and the C-trap entrance are therefore made more negative. Making the voltage on the surface more negative will increase the voltage difference between the bent flatapole and the surface (therefore increasing SID voltage). To collect and transmit the ions the back deflector, exits, C-trap entrance and exit (inject) voltages, and the C-trap offset are also made more negative to aid transmission,[18] as discussed in more detail in the following protocol. High energy SID is particularly useful when proteoform information is required, as it can be used to produce higher intensity of monomer (compared to low energy SID). Given the higher charge states observed in AmAc (and therefore higher SID energies accessible), we have found that the most extensive proteoform characterization by SID is obtained using samples prepared in AmAc without the addition of a charge reducing reagent.[56] During SID, ions are not typically transmitted into the HCD cell, so for proteoform characterization the trap gas does not need to be dropped as low as with HCD, however, the trap gas can still affect the SID spectra observed and therefore should be optimized, for proteoform characterization. Figure 8 below shows a comparison for high energy SID of rat 20S proteasome acquired with trap gas 9, 7 and 5.
Figure 8:

Higher energy SID of rat 20S proteasome acquired with −50 V in-source trapping at 3, 125 K resolution prepared in either 150 mM AmAc (average charge state of precursor +61, determined from UniDec[59]) and acquired with 185 V SID (corresponding to an average energy of 11,346 eV) with A) trap gas 9, B) trap gas 7 and C) trap gas 5. With trap gas 7, greater coverage of the monomers is obtained, as demonstrated with the increased number of peaks in the low mass region, the identity of the monomers is discussed below in the interpreting data section.
The protocol for a typical SID experiment, after achieving spray and optimizing the instrument for MS of the complex of interest (see Acquiring MS spectra for protein complexes) is outlined below.
Switch the instrument into standby and adjust the circuit so that the C-trap offset is being supplied by the external power supply as opposed to the onboard power supply.[18]
Restart spray and check for MS signal (see step 8 Acquiring MS spectra for protein complexes).
Optional: if desired select a single m/z species with a narrow isolation window (typically 5–20 m/z). If signal is low however the entire charge state distribution can be selected instead by applying a wide isolation around the region of interest. If signal is low it is often beneficial to increase the injection time to increase the number of ions.
Set the SID device voltages, C-trap offset and C-trap entrance and exit (inject) voltages as shown in Table 2. SID can then be optimized by fine tuning the device as needed. To fine tune we recommend starting with the front deflectors and then working step wise towards the back of the device. This process may need to be repeated more than once. Care should be taken at this stage to ensure unintentional CID is not occurring along with SID. CID can be distinguished from SID as it typically produces highly charged monomer and complementary N-1mer, whereas SID produces a greater variety of subcomplexes, with more symmetrical charge partitioning.[57] It is recommended to tune the SID device initially with a complex of known structure that has been previously studied with SID.
Optimize injection time and trap gas for signal. Care should be taken when selecting the resolution at which to acquire SID data- higher resolutions will typically bias towards monomers and lower resolutions will typically provide greater balance between product pairs. We typically acquire multiple SID voltages and multiple resolutions to check product distribution before determining final conditions.
To increase SID voltage by 10 V; decrease the C-trap entrance inject, C-trap exit inject, and C-trap offset by 10 V. Increase front top and front bottom deflectors on the C-trap by 0.5 V and decrease the surface, middle bottom, back top deflector, back bottom deflector and exit lenses by 10 V. Typically we acquire SID at 10 V intervals from 45 V to 225 V SID.
3.8. Interpreting the data.
There are multiple software packages that can be used to deconvolute native MS data, aiding in interpretation and reporting. Within our laboratories, the most commonly used packages are UniDec, Intact Mass, and Biopharma Finder. All three allow for mass matching of deconvoluted species which can assist in interpretation. These are briefly introduced below and protocols for nMS data analysis using these three software packages can be found elsewhere.[41, 58]
UniDec (Michael Marty, University of Arizona):
UniDec is a free, open source, software that employs a Bayesian framework.[59] UniDec is well suited to nMS data analysis including ion mobility data, and is well suited to analyze data with overlapping species. MetaUniDec also allows for high-throughput batch processing,[60] assisting in the analysis of large data sets. UniDec can directly read data from Waters and Thermo instruments, as well as opening data from other instruments by converting to a .txt or mzML format.
Intact Mass (Protein Metrics):
Intact Mass is based on a parsimonious algorithm[61] and is well suited to the analysis of protein and protein complex spectra. Intact Mass can be used to interpret data from multiple different instrument vendors and can batch process.
BioPharma Finder (Thermo Scientific):
Biopharma finder is a software package that can be used for deconvolution of data acquired on Thermo instruments. In addition to being able to handle intact mass data it can also be used for top-down data analysis for protein identification.
Manually interpreting SID spectra for complex species, including those with multiple subunits or proteoforms can be a very time-consuming process and therefore using one of the software packages listed above can greatly assist in this process. An example of this is identifying the monomers present in CID or higher-energy SID spectra of the rat 20S proteasome (Figure 5B and Figure 8B respectively). In order to identify the different monomers, dimers, and trimers present in the low m/z region of these spectra we employed the use of UniDec. Data was imported into UniDec and analyzed with the “high-resolution native” preset method, using the automatic m/z peak width option, sampling mass every 1 Da, peak detection range of 1 Da and peak detection threshold of 0.01. Peak peaking was then manually validated. Major proteoforms of the α-subunits were identified with both CID and SID (Figure 9 and Table 3). However under these conditions a greater number of β-subunits were identified by SID. In addition, SID can provide information on the dimers in the 7α ring (Table 4) and therefore increased substructural information than CID here.[7]
Figure 9:

Monomers and dimers identified in A) 250 V CID trap gas 4 and B) 185 V SID with trap gas 7. Data analyzed using UniDec. In both cases data was acquired with – 50 V in source trapping and at 3, 125 K resolution.
Table 3:
Observed rat 20S proteasome α-monomers and β-monomers theoretical and observed molecular weights.
| Theoretical Mass (Da) | CID (250 V trap gas 4) | SID (185 V trap gas 7) | |
|---|---|---|---|
| PSMA1 + Ac | 29, 560 | 29, 560 ± 1 | 29, 558 ± 1 |
| PSMA2 ΔMet + Ac | 25, 838 | 25, 837 ±1 | 25, 836 ±1 |
| PSMA3 ΔMet + Ac + Phos | 28, 410 | 28, 410 ± 1 | 28, 409 ± 3 |
| PSMA4 ΔMet + Ac | 29, 409 | 29, 409 ± 1 | 29, 407 ± 4 |
| PSMA5 + Ac | 26, 453 | 26, 453 ± 1 | 26, 452 ± 1 |
| PSMA6 ΔMet | 27, 268 | 27, 264 ± 2 | -- |
| PSMA6 ΔMet + Ac | 27, 310 | 27, 311 ± 1 | 27, 309 ± 1 |
| PSMA7 minus AS, ΔMet + Ac | 27, 608 | 27, 609 ± 1 | 27, 609 ± 2 |
| PSMB1 (propeptide cleaved 1–27) | 23, 547 | -- | 23, 541 ± 9 |
| PSMB3 ΔMet + Ac | 22, 876 | -- | 22, 875 ± 1 |
| PSMB4 (propeptide cleaved 1–13) | 24,336 | -- | 24, 337 ± 6 |
| PSMB7 (propeptide cleaved 1–43) | 25, 314 | 25, 313 ±1 | 25, 316±4 |
Theoretical molecular weights determined based on the previously observed most abundant proteoform.[7]Observed molecular weights and errors were determined manually.
Table 4:
Observed rat 20S proteasome α-dimers theoretical and observed molecular weights.
| Theoretical Mass (Da) | SID (185 V trap gas 7) | |
|---|---|---|
| PSMA5+PSMA7 | 54, 061 | 54, 061 ± 5 |
| PSMA7+PSMA4 | 57, 017 | 57, 013 ± 4 |
| PSMA2+PSMA6 | 53, 148 | 53, 142 ± 4 |
| PSMA6+PSMA3 | 55, 720 | 55, 719 ± 1 |
| PSMA3+PSMA1 | 57, 970 | 57, 969 ± 4 |
Theoretical molecular weights determined based on the previously observed most abundant proteoform.[7]Observed molecular weights and errors determined manually.
Conclusions
The protocol presented here demonstrates that when coupled with a high-resolution analyzer, SID is a useful tool to study both substructure (using low energy SID) and proteoforms (using high energy SID). Although, demonstrated here for a single system this approach is applicable to systems of different sizes and can be used for soluble and membrane proteins.
4. Notes
Due to the hygroscopic nature of ammonium acetate we typically purchase smaller quantities at a time, and once opened, prepare a 5M stock from the entire bottle. This ensures an accurate concentration can be achieved. The stock can be stored at −20 °C until needed. Prior to sample preparation the stock solution can be diluted to the working concentration, for most of our systems this is 100–200 mM AmAc but concentrations of 10–1000 mM can be used if required.
For buffer exchange we follow the protocol as listed however we perform four washes, which will result in > 99.9% buffer exchange.
If using a fixed rotor centrifuge care should be taken to rotate the spin column between centrifuge steps to keep the column bed as even as possible.
Ensure that the column bed looks dry before loading the sample or you may experience sample dilution.
For Amicon-ultra 0.5 mL concentrators trace amounts of glycerine can remain on the filter and therefore for nMS applications it is recommended to follow the suggested wash step prior to sample loading. Do not let the filter dry out between the wash step and loading your sample.
For the most common biochemistry buffers we find 2–3 buffer exchange (dilution) steps are sufficient to remove the salt and non-volatile components however up to 10 exchanges may be required for some harder to remove components or when samples are prepared with high concentrations of non-volatiles.
For nMS applications we recommend following the optional wash step for Slide-A-lyzer. However, do not let the membrane dry out between the wash and sample loading steps. We also typically change the dialysis buffer at least once (after 1–2 hours) before an overnight dialysis.
The microdialysis casettes can be pre-washed by pipetting 100 μL of water into the cassette and then carefully removing it before loading your sample. Do not let the membrane dry out between the wash and sample loading steps. A typical dialysis for nMS using microdialysis will require changing the dialysis buffer 2–3 times after 1–2 hours for each step. If necessary an overnight dialysis can be performed after the initial exchanges, however an overnight dialysis is typically only needed for removal of very high concentrations of non-volatiles.
The heat value needed to melt the glass will vary for different types of glass and between filaments. To determine the heat value required for the glass/filament combination on a Sutter P97 puller you run a “ramp test”, which systematically raises the temperature until the glass starts to soften and puller bars move apart. The heat is turned off when a factory-set ramp test velocity is achieved. The heat value required to reach this velocity is the ramp test temperature. The ramp test temperature will vary for different types of glass and between filaments it is therefore important to rerun the ramp test when changing the filament or changing glass types.
When pulling tips that are open and do not require clipping we have found that more consistent pulling is achieved when the filament is allowed to cool completely between use. It can take up to five minutes for the filament to completely cool after pulling a capillary.
Care should be taken with all instrument parameters to avoid unintentional activation. It is possible to activate and unfold the complex before dissociation, so even if the complex is intact it may not still be native.[62] Previous reports have shown that it is possible to rearrange the structure with high in-source trapping voltages.[56] It is likely that high voltages, voltages drops and high capillary temperature could also have an effect and therefore care should always be taken to keep instrument conditions as “soft” and low voltage as possible.
Instrument modifications should be made only if the customer and instrument vendor agree on steps to be followed.
Acknowledgements
We gratefully acknowledge the current and former Wysocki group members who have contributed to the development, and understanding of SID. In particular, we would like to acknowledge Zachary VanAernum and Joshua Gilbert for their hard work incorporating SID into the Exactive platforms and optimizing tuning and Benjamin Jones for helpful discussions during the preparation of this protocol. We would like to acknowledge NSF Grants DBI1455654 and DBI0923551 for SID instrument development. We also acknowledge NIH Grant P41GM128577 for the development of an integrated MS-based structural biology workflow and dissemination of SID.
References
- 1.Ben-Nissan G, Sharon M (2018) The application of ion-mobility mass spectrometry for structure/function investigation of protein complexes. Curr Opin Chem Biol 42:25–33. 10.1016/j.cbpa.2017.10.026 [DOI] [PMC free article] [PubMed] [Google Scholar]
- 2.Heck AJR, Heuvel RHH van den (2004) Investigation of intact protein complexes by mass spectrometry. Mass Spectrom Rev 23:368–389. 10.1002/mas.10081 [DOI] [PubMed] [Google Scholar]
- 3.Liko I, Allison TM, Hopper JT, Robinson CV (2016) Mass spectrometry guided structural biology. Curr Opin Struct Biol 40:136–144. 10.1016/j.sbi.2016.09.008 [DOI] [PubMed] [Google Scholar]
- 4.Eschweiler JD, Kerr R, Rabuck-Gibbons J, Ruotolo BT (2017) Sizing Up Protein–Ligand Complexes: The Rise of Structural Mass Spectrometry Approaches in the Pharmaceutical Sciences. Annu Rev Anal Chem 10:25–44. 10.1146/annurev-anchem-061516-045414 [DOI] [PubMed] [Google Scholar]
- 5.Sarni S, Biswas B, Liu S, et al. (2020) HIV-1 Gag protein with or without p6 specifically dimerizes on the viral RNA packaging signal. J Biol Chem 295:14391–14401. 10.1074/jbc.RA120.014835 [DOI] [PMC free article] [PubMed] [Google Scholar]
- 6.Laganowsky A, Reading E, Allison TM, et al. (2014) Membrane proteins bind lipids selectively to modulate their structure and function. Nature 510:172–175. 10.1038/nature13419 [DOI] [PMC free article] [PubMed] [Google Scholar]
- 7.Vimer S, Ben-Nissan G, Morgenstern D, et al. (2020) Comparative Structural Analysis of 20S Proteasome Ortholog Protein Complexes by Native Mass Spectrometry. ACS Cent Sci 6:573–588. 10.1021/acscentsci.0c00080 [DOI] [PMC free article] [PubMed] [Google Scholar]
- 8.Melani RD, Skinner OS, Fornelli L, et al. (2016) Mapping Proteoforms and Protein Complexes From King Cobra Venom Using Both Denaturing and Native Top-down Proteomics. Mol Cell Proteomics 15:2423–2434. 10.1074/mcp.M115.056523 [DOI] [PMC free article] [PubMed] [Google Scholar]
- 9.Franc V, Zhu J, Heck AJR (2018) Comprehensive Proteoform Characterization of Plasma Complement Component C8αβγ by Hybrid Mass Spectrometry Approaches. J Am Soc Mass Spectrom 29:1099–1110. 10.1021/jasms.8b05825 [DOI] [PMC free article] [PubMed] [Google Scholar]
- 10.Schwartz BL, Bruce JE, Anderson GA, et al. (1995) Dissociation of tetrameric ions of noncovalent streptavidin complexes formed by electrospray ionization. J Am Soc Mass Spectrom 6:459–465. 10.1016/1044-0305(95)00191-F [DOI] [PubMed] [Google Scholar]
- 11.Hall Z, Politis A, Bush MF, et al. (2012) Charge-State Dependent Compaction and Dissociation of Protein Complexes: Insights from Ion Mobility and Molecular Dynamics. J Am Chem Soc 134:3429–3438. 10.1021/ja2096859 [DOI] [PubMed] [Google Scholar]
- 12.Popa V, Trecroce DA, McAllister RG, Konermann L (2016) Collision-Induced Dissociation of Electrosprayed Protein Complexes: An All-Atom Molecular Dynamics Model with Mobile Protons. J Phys Chem B 120:5114–5124. 10.1021/acs.jpcb.6b03035 [DOI] [PubMed] [Google Scholar]
- 13.Stiving AQ, VanAernum ZL, Busch F, et al. (2019) Surface-Induced Dissociation: An Effective Method for Characterization of Protein Quaternary Structure. Anal Chem 91:190–209. 10.1021/acs.analchem.8b05071 [DOI] [PMC free article] [PubMed] [Google Scholar]
- 14.Harvey SR, Seffernick JT, Quintyn RS, et al. (2019) Relative interfacial cleavage energetics of protein complexes revealed by surface collisions. Proc Natl Acad Sci 116:8143–8148. 10.1073/pnas.1817632116 [DOI] [PMC free article] [PubMed] [Google Scholar]
- 15.Zhou M, Wysocki VH (2014) Surface Induced Dissociation: Dissecting Noncovalent Protein Complexes in the Gas phase. Acc Chem Res 47:1010–1018. 10.1021/ar400223t [DOI] [PubMed] [Google Scholar]
- 16.Quintyn RS, Yan J, Wysocki VH (2015) Surface-Induced Dissociation of Homotetramers with D2 Symmetry Yields their Assembly Pathways and Characterizes the Effect of Ligand Binding. Chem Biol 22:583–592. 10.1016/j.chembiol.2015.03.019 [DOI] [PubMed] [Google Scholar]
- 17.Harvey SR, VanAernum ZL, Wysocki VH (2021) Surface-Induced Dissociation of Anionic vs Cationic Native-Like Protein Complexes. J Am Chem Soc 143:7698–7706. 10.1021/jacs.1c00855 [DOI] [PMC free article] [PubMed] [Google Scholar]
- 18.VanAernum ZL, Gilbert JD, Belov ME, et al. (2019) Surface-Induced Dissociation of Noncovalent Protein Complexes in an Extended Mass Range Orbitrap Mass Spectrometer. Anal Chem 91:3611–3618. 10.1021/acs.analchem.8b05605 [DOI] [PMC free article] [PubMed] [Google Scholar]
- 19.VanAernum ZL (2020) Novel Native Mass Spectrometry-based Fragmentation and Separation Approaches for the Interrogation of Protein Complexes. Electronic Thesis or Dissertation, The Ohio State University [Google Scholar]
- 20.Cooks RG, Terwilliger DT, Ast T, et al. Surface modified mass spectrometry. 3 [Google Scholar]
- 21.Beck RD, John PS, Homer ML, Whetten RL (1991) Impact-Induced Cleaving and Melting of Alkali-Halide Nanocrystals. Science 253:879–883. 10.1126/science.253.5022.879 [DOI] [PubMed] [Google Scholar]
- 22.Laskin J, Futrell JH (2003) Surface-induced dissociation of peptide ions: Kinetics and dynamics. J Am Soc Mass Spectrom 14:1340–1347. 10.1016/j.jasms.2003.08.004 [DOI] [PubMed] [Google Scholar]
- 23.Stone E, Gillig KJ, Ruotolo B, et al. (2001) Surface-Induced Dissociation on a MALDI-Ion Mobility-Orthogonal Time-of-Flight Mass Spectrometer: Sequencing Peptides from an “In-Solution” Protein Digest. Anal Chem 73:2233–2238. 10.1021/ac001430a [DOI] [PubMed] [Google Scholar]
- 24.Schultz DG, Hanley L (1998) Shattering of SiMe3+ during surface-induced dissociation. J Chem Phys 109:10976–10983. 10.1063/1.477737 [DOI] [Google Scholar]
- 25.Volný M, Elam WT, Ratner BD, Tureček F (2005) Preparative Soft and Reactive Landing of Gas-Phase Ions on Plasma-Treated Metal Surfaces. Anal Chem 77:4846–4853. 10.1021/ac0505019 [DOI] [PubMed] [Google Scholar]
- 26.Mohammed S, Chalmers MJ, Gielbert J, et al. (2001) A novel tandem quadrupole mass spectrometer allowing gaseous collisional activation and surface induced dissociation. J Mass Spectrom 36:1260–1268. 10.1002/jms.217 [DOI] [PubMed] [Google Scholar]
- 27.Castoro JA, Nuwaysir LM, Ijames CF, Wilkins CL (1992) Comparative study of photodissociation and surface-induced dissociation by laser desorption Fourier transform mass spectrometry. Anal Chem 64:2238–2243. 10.1021/ac00043a010 [DOI] [PubMed] [Google Scholar]
- 28.Galhena AS, Dagan S, Jones CM, et al. (2008) Surface-Induced Dissociation of Peptides and Protein Complexes in a Quadrupole/Time-of-Flight Mass Spectrometer. Anal Chem 80:1425–1436. 10.1021/ac701782q [DOI] [PubMed] [Google Scholar]
- 29.Jones CM, Beardsley RL, Galhena AS, et al. (2006) Symmetrical Gas-Phase Dissociation of Noncovalent Protein Complexes via Surface Collisions. J Am Chem Soc 128:15044–15045. 10.1021/ja064586m [DOI] [PubMed] [Google Scholar]
- 30.Zhou M, Huang C, Wysocki VH (2012) Surface-Induced Dissociation of Ion Mobility-Separated Noncovalent Complexes in a Quadrupole/Time-of-Flight Mass Spectrometer. Anal Chem 84:6016–6023. 10.1021/ac300810u [DOI] [PubMed] [Google Scholar]
- 31.Yan J, Zhou M, Gilbert JD, et al. (2017) Surface-Induced Dissociation of Protein Complexes in a Hybrid Fourier Transform Ion Cyclotron Resonance Mass Spectrometer. Anal Chem 89:895–901. 10.1021/acs.analchem.6b03986 [DOI] [PubMed] [Google Scholar]
- 32.Snyder DT, Panczyk E, Stiving AQ, et al. (2019) Design and Performance of a Second-Generation Surface-Induced Dissociation Cell for Fourier Transform Ion Cyclotron Resonance Mass Spectrometry of Native Protein Complexes. Anal Chem 91:14049–14057. 10.1021/acs.analchem.9b03746 [DOI] [PMC free article] [PubMed] [Google Scholar]
- 33.Snyder DT, Panczyk EM, Somogyi A, et al. (2020) Simple and Minimally Invasive SID Devices for Native Mass Spectrometry. Anal Chem 92:11195–11203. 10.1021/acs.analchem.0c01657 [DOI] [PMC free article] [PubMed] [Google Scholar]
- 34.Harvey SR, VanAernum ZL, Kostelic MM, et al. (2020) Probing the structure of nanodiscs using surface-induced dissociation mass spectrometry. Chem Commun. 10.1039/D0CC05531J [DOI] [PMC free article] [PubMed] [Google Scholar]
- 35.Zhou M, Dagan S, Wysocki VH (2012) Protein Subunits Released by Surface Collisions of Noncovalent Complexes: Nativelike Compact Structures Revealed by Ion Mobility Mass Spectrometry. Angew Chem Int Ed 51:4336–4339. 10.1002/anie.201108700 [DOI] [PubMed] [Google Scholar]
- 36.Quintyn RS, Harvey SR, Wysocki VH (2015) Illustration of SID-IM-SID (surface-induced dissociation-ion mobility-SID) mass spectrometry: homo and hetero model protein complexes. 8 [DOI] [PubMed] [Google Scholar]
- 37.Hernández H, Robinson CV (2007) Determining the stoichiometry and interactions of macromolecular assemblies from mass spectrometry. Nat Protoc 2:715–726. 10.1038/nprot.2007.73 [DOI] [PubMed] [Google Scholar]
- 38.Dyachenko A, Gruber R, Shimon L, et al. (2013) Allosteric mechanisms can be distinguished using structural mass spectrometry. Proc Natl Acad Sci 110:7235–7239. 10.1073/pnas.1302395110 [DOI] [PMC free article] [PubMed] [Google Scholar]
- 39.Ma X, Lai LB, Lai SM, et al. (2014) Uncovering the Stoichiometry of Pyrococcus furiosus RNase P, a Multi-Subunit Catalytic Ribonucleoprotein Complex, by Surface-Induced Dissociation and Ion Mobility Mass Spectrometry. Angew Chem Int Ed 53:11483–11487. 10.1002/anie.201405362 [DOI] [PMC free article] [PubMed] [Google Scholar]
- 40.Lorenzen K, Duijn E van (2010) Native Mass Spectrometry as a Tool in Structural Biology. Curr Protoc Protein Sci 62:17.12.1–17.12.17. 10.1002/0471140864.ps1712s62 [DOI] [PubMed] [Google Scholar]
- 41.VanAernum ZL (2020) Rapid online buffer exchange for screening of proteins, protein complexes and cell lysates by native mass spectrometry. Nat Protoc 15:28. [DOI] [PMC free article] [PubMed] [Google Scholar]
- 42.Busch F, VanAernum ZL, Lai SM, et al. (2021) Analysis of Tagged Proteins Using Tandem Affinity-Buffer Exchange Chromatography Online with Native Mass Spectrometry. Biochemistry 60:1876–1884. 10.1021/acs.biochem.1c00138 [DOI] [PMC free article] [PubMed] [Google Scholar]
- 43.Gan J, Ben-Nissan G, Arkind G, et al. (2017) Native Mass Spectrometry of Recombinant Proteins from Crude Cell Lysates. Anal Chem 89:4398–4404. 10.1021/acs.analchem.7b00398 [DOI] [PMC free article] [PubMed] [Google Scholar]
- 44.Vimer S, Ben-Nissan G, Sharon M (2020) Direct characterization of overproduced proteins by native mass spectrometry. Nat Protoc 15:236–265. 10.1038/s41596-019-0233-8 [DOI] [PMC free article] [PubMed] [Google Scholar]
- 45.Ben-Nissan G, Vimer S, Warszawski S, et al. (2018) Rapid characterization of secreted recombinant proteins by native mass spectrometry. Commun Biol 1:1–12. 10.1038/s42003-018-0231-3 [DOI] [PMC free article] [PubMed] [Google Scholar]
- 46.Xia Z, Williams ER (2018) Protein-Glass Surface Interactions and Ion Desalting in Electrospray Ionization with Submicron Emitters. J Am Soc Mass Spectrom 29:194–202. 10.1021/jasms.8b05670 [DOI] [PubMed] [Google Scholar]
- 47.Susa AC, Lippens JL, Xia Z, et al. (2018) Submicrometer Emitter ESI Tips for Native Mass Spectrometry of Membrane Proteins in Ionic and Nonionic Detergents. J Am Soc Mass Spectrom 29:203–206. 10.1021/jasms.8b05656 [DOI] [PMC free article] [PubMed] [Google Scholar]
- 48.Kirshenbaum N, Michaelevski I, Sharon M (2010) Analyzing Large Protein Complexes by Structural Mass Spectrometry. JoVE J Vis Exp e1954. 10.3791/1954 [DOI] [PMC free article] [PubMed] [Google Scholar]
- 49.Fernandez de la Mora J (2000) Electrospray ionization of large multiply charged species proceeds via Dole’s charged residue mechanism. Anal Chim Acta 406:93–104. 10.1016/S0003-2670(99)00601-7 [DOI] [Google Scholar]
- 50.L. Fort K, Waterbeemd M van de, Boll D, et al. (2018) Expanding the structural analysis capabilities on an Orbitrap-based mass spectrometer for large macromolecular complexes. Analyst 143:100–105. 10.1039/C7AN01629H [DOI] [PubMed] [Google Scholar]
- 51.Rose RJ, Damoc E, Denisov E, et al. (2012) High-sensitivity Orbitrap mass analysis of intact macromolecular assemblies. Nat Methods 9:1084–1086. 10.1038/nmeth.2208 [DOI] [PubMed] [Google Scholar]
- 52.Makarov A, Denisov E (2009) Dynamics of ions of intact proteins in the Orbitrap mass analyzer. J Am Soc Mass Spectrom 20:1486–1495. 10.1016/j.jasms.2009.03.024 [DOI] [PubMed] [Google Scholar]
- 53.Benesch JLP, Aquilina JA, Ruotolo BT, et al. (2006) Tandem Mass Spectrometry Reveals the Quaternary Organization of Macromolecular Assemblies. Chem Biol 13:597–605. 10.1016/j.chembiol.2006.04.006 [DOI] [PubMed] [Google Scholar]
- 54.Zhou M, Dagan S, Wysocki VH (2013) Impact of charge state on gas-phase behaviors of noncovalent protein complexes in collision induced dissociation and surface induced dissociation. Analyst 138:1353–1362. 10.1039/C2AN36525A [DOI] [PubMed] [Google Scholar]
- 55.Pagel K, Hyung S-J, Ruotolo BT, Robinson CV (2010) Alternate Dissociation Pathways Identified in Charge-Reduced Protein Complex Ions. Anal Chem 82:5363–5372. 10.1021/ac101121r [DOI] [PubMed] [Google Scholar]
- 56.Harvey S, VanAernum Z, Wysocki V (2021) Surface-Induced Dissociation of Anionic vs Cationic Native-like Protein Complexes. 10.26434/chemrxiv.13547837.v1 [DOI] [PMC free article] [PubMed]
- 57.Beardsley RL, Jones CM, Galhena AS, Wysocki VH (2009) Noncovalent Protein Tetramers and Pentamers with “ n ” Charges Yield Monomers with n /4 and n /5 Charges. Anal Chem 81:1347–1356. 10.1021/ac801883k [DOI] [PMC free article] [PubMed] [Google Scholar]
- 58.Kostelic M, Marty M (2020) Deconvolving Native and Intact Protein Mass Spectra with UniDec. 10.26434/chemrxiv.13417118.v1 [DOI] [PubMed]
- 59.Marty MT, Baldwin AJ, Marklund EG, et al. (2015) Bayesian Deconvolution of Mass and Ion Mobility Spectra: From Binary Interactions to Polydisperse Ensembles. Anal Chem 87:4370–4376. 10.1021/acs.analchem.5b00140 [DOI] [PMC free article] [PubMed] [Google Scholar]
- 60.Reid DJ, Diesing JM, Miller MA, et al. (2019) MetaUniDec: High-Throughput Deconvolution of Native Mass Spectra. J Am Soc Mass Spectrom 30:118–127. 10.1007/s13361-018-1951-9 [DOI] [PMC free article] [PubMed] [Google Scholar]
- 61.Bern M, Caval T, Kil YJ, et al. (2018) Parsimonious Charge Deconvolution for Native Mass Spectrometry. J Proteome Res 17:1216–1226. 10.1021/acs.jproteome.7b00839 [DOI] [PMC free article] [PubMed] [Google Scholar]
- 62.Quintyn RS, Zhou M, Yan J, Wysocki VH (2015) Surface-Induced Dissociation Mass Spectra as a Tool for Distinguishing Different Structural Forms of Gas-Phase Multimeric Protein Complexes. Anal Chem 87:11879–11886. 10.1021/acs.analchem.5b03441 [DOI] [PubMed] [Google Scholar]