Abstract
Brain and muscle Arnt-like protein-1 (BMAL1; also known as MOP3 or Arnt3) is a transcription factor known to regulate circadian rhythm. Here, we established its involvement in the control of adipogenesis and lipid metabolism activity in mature adipocytes. During adipose differentiation in 3T3-L1 cells, the level of BMAL1 mRNA began to increase 4 days after induction and was highly expressed in differentiated cells. In white adipose tissues isolated from C57BL/6J mice, BMAL1 was predominantly expressed in a fraction containing adipocytes, as compared with the stromal-vascular fraction. BMAL1 knockout mice embryonic fibroblast cells failed to be differentiated into adipocytes. Importantly, adding BMAL1 back by adenovirus gene transfer restored the ability of BMAL1 knockout mice embryonic fibroblast cells to differentiate. Knock-down of BMAL1 expression in 3T3-L1 cells by an RNA interference technique allowed the cells to accumulate only minimum amounts of lipid droplets in the cells. Adenovirus-mediated expression of BMAL1 in 3T3-L1 adipocytes resulted in induction of several factors involved in lipogenesis. The promoter activity of these genes was stimulated in a BMAL1-dependent manner. Interestingly, expression of these factors showed clear circadian rhythm in mice adipose tissue. Furthermore, overexpression of BMAL1 in adipocytes increased lipid synthesis activity. These results indicate that BMAL1, a master regulator of circadian rhythm, also plays important roles in the regulation of adipose differentiation and lipogenesis in mature adipocytes.
Keywords: circadian rhythm
Adipocytes play essential metabolic roles not only serving as massive energy reserves but also secreting hormones and cytokines that regulate metabolic activities (1, 2). The link between metabolic activity in adipocytes and circadian rhythm has long been studied; e.g., glucose and lipid homeostasis are well known to exhibit circadian variation (3–6). More recently, circadian expression of adiponectin receptors in adipocytes was reported (7). Therefore, molecular clock may play important roles in the regulation of metabolic activity in adipocytes. In a previous study, we reported that white adipose tissue contains functional molecular clock and that expression of several adipocytokines, including leptin, and plasminogen activator inhibitor-1 display circadian rhythm (8). The diurnal rhythm in the level of these molecules suggests that the molecular clock is at least partly associated with the onset of metabolic syndrome.
The molecular clock is composed of transcriptional feedback loops in organisms ranging from cyanobacteria to humans. Brain and muscle Arnt-like protein-1 [BMAL1; also referred to as MOP3 (9) or Arnt3 (10)] is a transcription factor playing central roles in the regulation of circadian rhythms (11). BMAL1 forms heterodimers with another basic helix–loop–helix/PAS protein, CLOCK, which drives transcription from E-box elements found in the promoter of circadian responsive genes, including period (Per)1 and cryptochrome (Cry). After translation of Per and Cry proteins, the Per/Cry complex translocates to the nucleus, where it inhibits gene expression driven by BMAL1/CLOCK (12–16). In addition to these roles in the control of circadian rhythms, the contribution of BMAL1 to the regulation of adipogenesis and adipocyte functions has been suggested for several reasons. First, BMAL1 is highly induced during adipogenesis (ref. 8 and this study). Second, BMAL1-deficient mice lack diurnal variation in triglyceride level (17). Furthermore, all BMAL1-deficient mice show a symptom of dehydration (18) that is similar to the phenotype observed in Arnt1-deficient mice, whose lipid metabolism is substantially altered (19). More importantly, mice lacking the circadian regulatory system are obese and develop a metabolic syndrome of hyperleptinemia, hyperlipidemia, and hyperglycemia (20).
We show here that the BMAL1-deficient embryonic fibroblast cells and BMAL1 knock-down 3T3-L1 cells failed to differentiate into adipocytes. Adding BMAL1 back into the BMAL1 knockout mice embryonic fibroblast cells (MEFs) and overexpression of BMAL1 in NIH 3T3 cells allowed the cells to accumulate cellular lipids and induction of adipocyte-related genes, such as peroxisome proliferator-activated receptor (PPAR)γ2 and adipocyte fatty acid-binding protein 2 (aP2). The mechanism may involve transcriptional regulation of genes involved in lipogenesis. These results suggest that BMAL1 is an important transcription factor in the regulation of adipocyte functions.
Materials and Methods
Animals. The experimental protocol was approved by the Ethics Review Committee for Animal Experimentation of Nihon University. Male C57BL/6J mice (6 weeks old) were maintained at 23 ± 1°C with 50 ± 10% relative humidity and three to five animals per cage on a 12 h light/12 h dark cycle (light, Zeitgeber time 0–12; dark, Zeitgeber time 12–24). Animals were allowed to adapt to the lighting schedule for several weeks before the experiments. Food and water were available ad libitum. Obese C57BL/6J mice were generated by feeding with a high-fat diet (OYC, Tokyo) for 4 weeks.
Fractionation of Mice Adipose Tissue. Epididymal white adipose tissue was excised from mice and fractionated into an adipocyte and a stromal–vascular fractions as described in ref. 8. Briefly, freshly excised fat pads from C57BL/6J mice were rinsed in PBS, minced, and digested for 45 min at 37°C in Krebs–Ringer bicarbonate, pH 7.4, with 4% BSA and 1.5 mg/ml type I collagenase (Worthington). The digested tissue was filtered through a 250-μm nylon mesh to remove undigested tissue and centrifuged at 500 × g for 5 min. The floating adipocyte fraction was removed, washed in the buffer, and recentrifuged to isolate adipocytes. The stromal–vascular pellet was resuspended in erythrocyte lysis buffer (154 mM NH4Cl/10 mM KHCO3/1 mM EDTA), filtered through 28-μm nylon mesh to remove endothelial cells, and pelleted at 500 × g for 5 min.
Cell Culture. 3T3-L1 cells and NIH 3T3 cells (Human Science Research Resources Bank, Osaka) were maintained in DMEM supplemented with 10% calf serum. Embryonic fibroblast cells from wild-type C57BL/6J mice or BMAL1 knockout mice (kindly provided by M. P. Antoch, Cleveland Clinic Foundation, Cleveland) were maintained in DMEM containing 10% FBS as described in ref. 21. For induction of adipose differentiation, cells were grown to confluence. The cells were then fed with differentiation medium [a 3:1 mixture of DMEM and Ham's F-12 containing 10% FBS, 1.6 μM insulin, 0.0005% transferrin, 180 μM adenine, 20 pM triiodo-thyronine, 0.25 μM dexamethasone (DEX), and 500 μM isobutylmethylxanthine (IBMX)]. For mouse embryonic fibroblast cells, PPARγ ligand was also added to the medium. After 3 days, the cells were refed with fresh differentiation medium without DEX and IBMX and maintained over the following days.
Oil Red O Staining. To judge the states of adipose differentiation by visual inspection, cultures were fixed with 4% formalin in PBS for 2 h, rinsed three times with distilled water, and then air-dried. The fixed cells were stained with 0.5% oil red O solution for 1 h. After staining, the cultures were rinsed several times with 70% ethanol.
Immunoblot Analysis. Cells grown in 60-mm dishes were rinsed with ice-cold PBS. The rinsed cells were scraped off the dish, placed in a microcentrifuge tube, and centrifuged at 5,000 × g for 1 min. The resulting pellets were suspended in lysis buffer (50 mM Hepes-KOH, pH 7.8/420 mM KCl/0.1 mM EDTA/5 mM MgCl2/1 mM DTT/0.5 mM PMSF/0.0002% leupeptin/20% glycerol), vortex mixed, and rocked at 4°C for 60 min. The suspensions were centrifuged for 15 min at 10,000 × g, and the resulting supernatants were then frozen until further analysis. The protein concentration of the extracts was determined according to the Bradford method, using BSA as a standard (22). Protein samples were denatured by heating to 90°C in SDS reducing buffer and were resolved by electrophoresis on 10% SDS/polyacrylamide gels. After transfer to nitrocellulose membranes, the filters were probed with specific antibodies against the protein. Color visualization was performed with secondary antibodies conjugated with alkaline phosphatase and nitroblue tetrazolium chloride/5-bromo-4-chloro-3-indolylphosphate substrate solution (Promega).
Analysis of RNA. Total RNA was extracted from the cells with TRIzol reagent (Invitrogen) according to the manufacturer's instructions and was analyzed by Northern blotting. Probes were prepared by RT-PCR techniques. To perform the quantitative real-time PCR assay, total RNA (1 μg) was reverse-transcribed by using oligo dT primer. A portion of the cDNA (corresponding to 0.1 μg of total RNA) was amplified on an Mx3000P real-time PCR system (Stratagene) using SYBR Premix Ex Taq mix (Takara Bio, Ohtsu, Japan).
Small Interfering RNA (siRNA). Synthetic siRNAs (Invitrogen) were delivered into 3T3-L1 cells by a pulse of electroporation with a Nucleofector (Amaxa, Gaithersburg, MD). After electroporation, cells were immediately mixed with fresh medium for 10 min and then reseeded on plates for further experiments. The efficiency of the introduction of siRNA into cells was ≈80–90% as judged by the fluorescence intensity of Cy3-labeled siRNA. Scrambled siRNA was used for control experiments. The nucleotide sequences of the siRNA were CCACCAACCCAUACACAGAAGCAAA (BMAL1) and CCACCAAAUACACACGAAGCCCAAA (control).
Adenovirus Infection. Adenovirus expressing BMAL1 tagged with the FLAG motif was prepared according to the protocol supplied by the manufacturer (BD Clontech). 3T3-L1 adipocytes were infected with the virus at a multiplicity of infection of ≈30 in OPTI-MEM I (Invitrogen) for 24 h. The cells were then recovered for an additional 24 h before being subjected to the experiments.
Promoter Analysis. The promoter regions of Per1 (–2000 to –1), sterol regulatory element binding protein 1a (SREBP-1a) (–4218 to –1), Rev-erb α (–3942 to –1), fatty acid synthase (FAS) (–2000 to –1), 3-hydroxy-3-methylglutaryl-CoA (HMG-CoA) reductase (–2000 to –1) and acetoacetyl-CoA synthetase (AACS) (–2000 to –1) were amplified by PCR from genomic DNA isolated from either 3T3-L1 cells or Wistar rats. The DNA fragments amplified were subcloned into pGL3 basic vectors. HEK-293 cells were transiently transfected with the appropriate plasmids by using Lipofectoamine 2000 (Invitrogen). Transfected cells were maintained in conventional medium for 48 h; they were then lysed, and the luciferase activity was measured.
Chromatin Immunoprecipitation Assays. 3T3-L1 adipocytes were fixed with formaldehyde for 30 min at room temperature. Chromatin immunoprecipitation analyses were performed by using an assay kit (Upstate Biotechnology, Lake Placid, NY) according to the manufacturer's protocol. The sequences of the PCR primers included the following: primer set A for SREBP-1a promoter (–2424 to –2198), 5′-CGCGTACCCTCAGGTCATAC-3′ and 5′-TCTTGCATTGGAGACAGTCG-3′; primer set B for SREBP-1a promoter (–2947 to –2775), 5′-TATAAGGGCTCTTGACACCT-3′ and 5′-TGGGCTTAGTCTCCTGATCT-3′; primer set A for Rev-erb α promoter (–546 to –325), 5′-TACTTAAGGGAAATCTCCCT-3′ and 5′-CTGAAGAGTCAGGGTGGCGT-3′; primer set B for Rev-erb α promoter (–159 to +66), 5′-GCTGCTGGAAAAGTGTGTCA-3′ and 5′-GGAGAAATGAAGCACCCAGA-3′; primer set A for Per1 promoter (–1391 to –1190), 5′-CCCTGCTTCTGTTTTTCTGG-3′ and 5′-CAAACGTAGGTGGCAAGTGA-3′; and primer set B for Per1 promoter (–2805 to –2600), 5′-AGTCCTACGGTGCTGGAATG-3′ and 5′-GTAAGCCCCCAAACAACTGA-3′.
Lipid Synthesis and Analysis. 3T3-L1 adipocytes were incubated with 0.5 mM [14C]sodium acetate (8.1 μCi/mmol; 1 Ci = 37 GBq) in differentiation medium for 90 min. Cellular lipids were extracted with a mixture of chloroform, methanol, and water (1:2:0.8). The radioactivities in the organic phase and water-soluble phase were determined in a liquid scintillation counter. Part of the organic phase was dried under N2, and the pellet was resuspended in the appropriate volume of chloroform. Extracts were separated by TLC with a mixture of petroleum ether, ethyl ether, and acetic acids (80:20:1) on silica gel plates.
Supporting Information. For further information, see Supporting Results, Figs. 8–11, and Table 1, which are published as supporting information on the PNAS web site.
Results
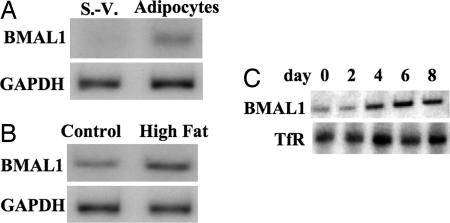
The Level of BMAL1 Increased in Adipose Differentiation. In a first set of experiments, we examined the expression level of BMAL1 in mice adipose tissue. Because the level of BMAL1 displays circadian rhythm in adipose tissue, we isolated white adipose tissue during the dark period (Zeitgeber time 18) when the BMAL1 mRNA is highly expressed. In white adipose tissues isolated from C57BL/6J mice, BMAL1 was more predominantly expressed in the fraction containing adipocytes than in the stromal–vascular fraction (Fig. 1A). The higher level of BMAL1 mRNA expression compared with that in the stromal–vascular fraction is maintained during the day as reported in ref. 8. Also, white adipose tissue in mice fed with a high-fat diet expressed much higher levels of BMAL1 mRNA compared with that in control mice (Fig. 1B). These results suggest that the expression of BMAL1 increases during adipose differentiation in vivo. To further characterize the expression of BMAL1 during adipogenesis, 3T3-L1 preadipose cells were differentiated to adipocytes by the addition of DEX, IBMX, insulin, and FBS, and the expression of the BMAL1 mRNA during adipogenesis was analyzed. As shown in Fig. 1C, the level of BMAL1 mRNA began to increase after 4 days of induction and was markedly expressed in the differentiated cells (8 days).
Fig. 1.
Expression of BMAL1 during adipose differentiation. (A) White adipose tissue was excised from three male C57BL/6J mice (6 weeks old), mixed, and fractionated into adipocyte and a stromal–vascular (S.-V.) fractions. The total RNA was isolated, and the expression of BMAL1 mRNA was determined by Northern blot analysis. (B) Obese C57BL/6J mice were generated by feeding with a high-fat diet for 4 weeks. White adipose tissue was excised from three each of control mice and obese mice, and the expression of BMAL1 mRNA was determined by Northern blot analysis. (C) Differentiation of 3T3-L1 cells was induced by the standard protocol. The expression of BMAL1 mRNA during adipose differentiation in 3T3-L1 cells was determined by Northern blot analysis. TfR, transferrin receptor.
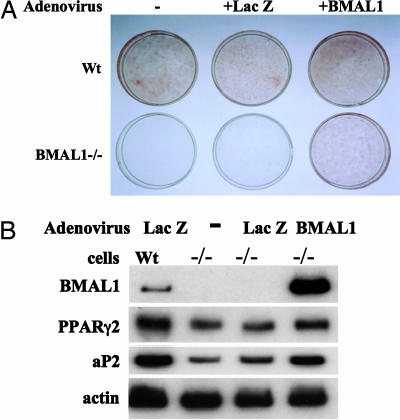
BMAL1 Is Required for Adipogenesis in 3T3-L1 Cells. To directly confirm that BMAL1 is involved in adipogenesis, the differentiation potency of MEFs isolated from BMAL1-deficient mice was compared with that of control MEFs. When MEFs were treated with differentiation medium containing DEX, IBMX, insulin, and PPARγ2 ligand (pioglitazone), ≈10% of control MEFs were differentiated into adipocytes (Fig. 2A). In contrast, BMAL1-deficient MEF exhibited no sign of lipid accumulation (Fig. 2A). Consistent with the morphological observations, the expression level of adipocyte-related genes, such as PPARγ2, and aP2 in BMAL1-deficient cells was substantially lower than that in the control cells (Fig. 2B). Adding BMAL1 expression back to BMAL1-deficient cells by means of adenovirus was shown to restore their ability to accumulate lipids and to activate markers of adipose differentiation (Fig. 2).
Fig. 2.
Comparison of adipose differentiation potency of wild-type (Wt) MEF and BMAL1 knockout MEF. (A) MEFs isolated from C57BL/6J mice (wild-type) or BMAL1 knockout mice (BMAL1–/–) were infected with an adenovirus carrying LacZ or BMAL1 at a multiplicity of infection of ≈10 for 24 h. The cells were then induced to differentiate in the presence of pioglitazone (5 μM) for 10 days and fixed and stained with oil red O. (B) Total RNA was extracted, and the expression of adipocyte-related genes was determined by Northern blot analysis.
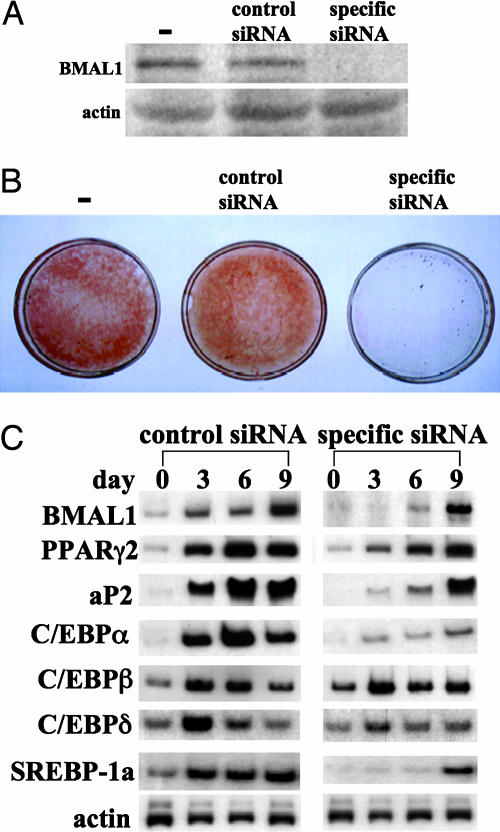
To gain insight into the processes by which BMAL1 regulates adipogenesis, BMAL1 mRNA expression in 3T3-L1 preadipocytes was suppressed by the RNAi technique. After 72 h of electroporation, the level of BMAL1 was examined by Western blotting (Fig. 3A). As shown in Fig. 3A, introduction of siRNA targeted for BMAL1 mRNA into the cells resulted in a substantial decrease of the BMAL1 protein level. Induction of differentiation in the control 3T3-L1 cells led to accumulation of a significant amount of cellular lipid droplets as judged by oil red O staining (Fig. 3B). Conversely, the BMAL1 knock-down cells were allowed to accumulate only minimum amounts of lipid droplets in their interiors (Fig. 3B). These results were confirmed by measuring the expression of adipocyte-related genes, such as aP2, CCAAT/enhancer-binding proteins (C/EBPs), SREBP-1a, and PPARγ2. As expected, expression of these genes was greatly induced in control cells during differentiation (Fig. 3C). In contrast, expression of PPARγ2, aP2, SREBP-1a, and C/EBPα mRNA was less induced in the BMAL1 knock-down cells. With regards to the expression of the C/EBPδ and C/EBPβ, the levels of mRNA in the BMAL1 knock-down cells were almost equal to those in the control cells during the differentiation process (Fig. 3C). These results indicate that BMAL1 plays key roles in the execution of the adipose differentiation program in 3T3-L1 cells.
Fig. 3.
Effects of knock-down of BMAL1 expression on adipogenesis in 3T3-L1 cells. Scrambled siRNA (control) or specific siRNA for BMAL1 was introduced into 3T3-L1 cells by electroporation. One day after transfection, cells were induced to differentiate by standard protocol. (A) The BMAL1 protein level was determined after 72 h of electroporation by Western blot. (B) Cells differentiated for 9 d were fixed and stained with oil red O. (C) Total RNA was extracted at the indicated time points, and the expression of adipocyte-related genes was determined by Northern blot analysis.
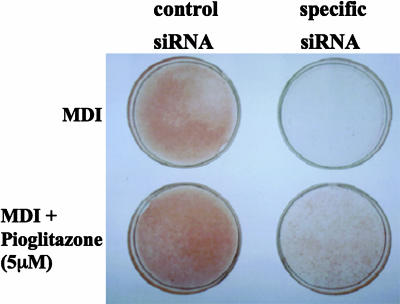
The Combination of PPARγ Activator and Conventional Differentiation Mixture Partly, but Not Fully, Restores the Ability of the BMAL1 Knock-Down Cells to Differentiate. Activation of PPARγ with ligands, such as thiazolidinediones, can promote adipose differentiation. Therefore, we examined whether activation of PPARγ could restore the differentiation potential of the BMAL1 knock-down 3T3-L1 cells. We used indomethacin and two thiazolidinediones, ciglitazone and pioglitazone, as PPARγ activators. In the BMAL1 knock-down cells, a conventional differentiation mixture (IBMX, DEX, and insulin) or pioglitazone alone had no effect on cellular lipid accumulation (Fig. 4). Addition of pioglitazone to the differentiation mixture partly, but not fully, restored the ability of BMAL1 knock-down cells to accumulate lipids (Fig. 4). Similarly, cotreatment with the conventional differentiation mixture and ciglitazone or indomethacin failed to restore the full ability of the cells to store cellular lipids (data not shown).
Fig. 4.
Restoration of the differentiation potential of BMAL1 knock-down cells by treatment with the PPARγ ligand. 3T3-L1 preadipocytes electroporated with scrambled siRNA (control) or specific siRNA for BMAL1 were treated with differentiation medium containing the indicated reagents. On day 7, the cells were fixed and stained with oil red O. M, IBMX. D, DEX. I, insulin.
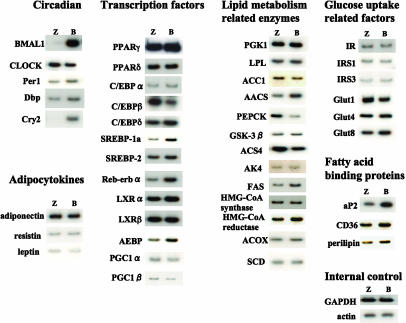
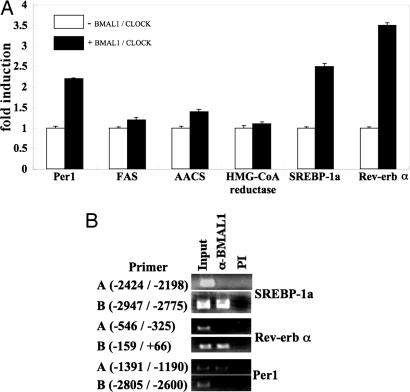
BMAL1 Regulates Gene Expression of Lipogenesis-Related Factors in 3T3-L1 Adipocytes. To understand the roles of the BMAL1 in the accumulation of lipids in cells, 3T3-L1 mature adipocytes were infected with adenovirus expressing LacZ or BMAL1, and expression of several factors involved in lipid metabolism was determined. Significant increases were observed in the level of the mRNA for encoding Cry2 (circadian), Rev-erb α, SREBP-1a, adipocyte enhancer-binding protein (transcription factor), AACS, FAS (enzyme), and aP2 (fatty acid binding protein) (Fig. 5). In addition, mild but substantial induction of Per1, albumin D site-binding protein (circadian), C/EBPα (transcription factor), HMG-CoA reductase (enzyme), CD36, and perilipin (fatty acid binding protein) was observed (Fig. 5). In contrast, the level of phosphoenolpyruvate carboxykinase (enzyme) mRNA was found to decrease in BMAL1-overexpressing cells (Fig. 5). The expression levels of examined adipocytokines and glucose uptake-related factors, such as insulin receptor, insulin receptor substrates, and glucose transporters, were not significantly altered by the overexpression of BMAL1 in 3T3-L1 mature adipocytes (Fig. 5). We then examined the ability of BMAL1 to directly regulate the transcriptional activity of these genes. A luciferase reporter gene driven by promoters/enhancers of the selected genes, including SREBP-1a, Rev-erb α, FAS, AACS, HMG-CoA reductase, and Per1 was constructed and transfected into HEK-293 cells with the BMAL1 expression vector. As reported in refs. 12–16, BMAL1/CLOCK enhanced the promoter activity of Per1 (Fig. 6A). The promoter activity of Rev-erb α and SREBP-1a was increased as much as that of Per1 by BMAL1/CLOCK (Fig. 6A). By contrast, BMAL1/CLOCK had little effect on the luciferase activity driven by promoters of the FAS, AACS, and HMG-CoA reductase genes (Fig. 6A). Chromatin immunoprecipitation assay revealed that BMAL1 is found to associate with the promoter sequence of Rev-erb α, SREBP-1a, and Per1 (Fig. 6B).
Fig. 5.
Effects of BMAL1 overexpression on expression of lipogenesis-related factors in 3T3-L1 adipocytes. 3T3-L1 adipocytes were infected with an adenovirus carrying LacZ (Z) or BMAL1 (B) at a multiplicity of infection of ≈30 for 24 h. Total RNA was extracted, and the expression of genes was determined by Northern blot analysis. The results shown are representative of three independent virus preparations with similar results. Dbp, albumin D site-binding protein; LXR, liver X receptor; AEBP, adipocyte enhancer-binding protein; PGC, PPARγ coactivator; PGK, phosphoglycerate kinase; LPL, lipoprotein lipase; ACC1, acetyl-CoA carboxylase 1; PEPCK, phosphoenolpyruvate carboxykinase; GSK-3β, glycogen synthase kinase-3β; AK4, adenylate kinase 4; ACS4, acyl-CoA synthetase 4; ACOX, acyl-CoA oxidase; SCD, stearoyl-CoA desaturase; IR, insulin receptor; IRS, insulin receptor substrate; Glut, glucose transporter.
Fig. 6.
BMAL1 as activator of the promoter activity of SREBP-1a and Rev-erb α. (A) BMAL1 and CLOCK expression plasmids (50 ng each) were transfected into HEK-293 cells with the reporter plasmid (50 ng) carrying the promoter region of the indicated genes. For all constructs, the pRL-SV40 vector was cotransfected to correct for differences in transfection efficiency. The normalized luciferase activity for the samples with the expression vector of BMAL1 and CLOCK (+) is expressed as n-fold induction relative to that without expression vector of BMAL1 and CLOCK (–). The averages of three independent experiments are shown. (B) Chromatin-associated fragmented DNA from 3T3-L1 adipocytes was immunoprecipitated with preimmune (PI) serum or antibodies to BMAL1. Precipitated DNA fragments were subjected to PCR amplification along with specific primers flanking the putative BMAL1/CLOCK binding site. Primer sets A and B bind to different regions on the genes. The position of the primer binding site in each gene is indicated. In all cases, only the expected single 200-bp PCR product was observed.
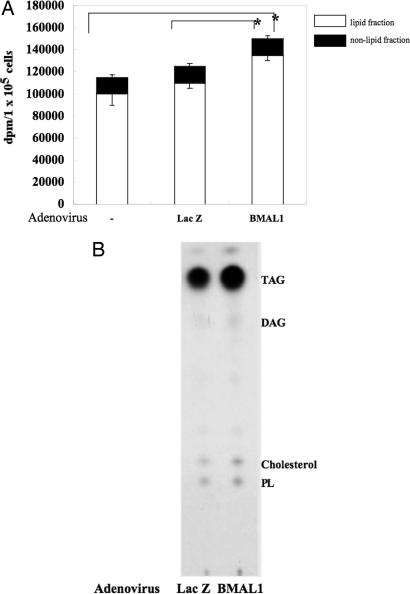
BMAL1 Regulates Lipid Synthesis Activity in 3T3-L1 Adipocytes. To evaluate whether the changes in gene expression led by overexpression of BMAL1 have an effect on lipogenesis, the lipid synthesis activity in BMAL1-overexpressing adipocytes was determined by metabolic labeling of lipids with 14C-acetic acid. The amount of lipid labeled in the BMAL1-overexpressing cells was substantially greater than that in the control cells (Fig. 7A). Further analysis by TLC revealed that the labeling pattern of each type of lipid detected (triacyl glycerol, diacyl glycerol, cholesterol, and phospholipids) appeared to be similar between control cells and the BMAL1-overexpressing cells, but the efficiency of labeling in the BMAL1-overexpressing cells was much higher than that in the control cells (Fig. 7B). Overexpression of BMAL1 had no effect on the amount of acetic acid incorporated into the nonlipid fraction (Fig. 7A).
Fig. 7.
BMAL1 as an enhancer of lipid synthesis activity in 3T3-L1 adipocytes. 3T3-L1 adipocytes were infected with an adenovirus carrying LacZ or BMAL1 at a multiplicity of infection of ≈30 for 24 h. (A) The infected cells were incubated with 0.5 mM [14C]sodium acetate in differentiation medium for 90 min, after which the cells were harvested for measurement of 14C-labeled fatty acids and cholesterol. Values are the means of five different experiments. Asterisks indicate significant differences (P < 0.05) from the value of uninfected cells (–) or LacZ-adenovirus infected cells. (B) 14C-labeled fatty acids and cholesterol extracted from the cells were separated by TLC. Phospholipids (PL), cholesterol, diacylglycerol (DAG), and triacylglycerol (TAG) are indicated.
Discussion
In this study, we demonstrated that BMAL1 is highly induced during adipose differentiation in vivo and in vitro (Figs. 1 A–C and 8). Although little has been known about the role of this factor in adipocytes, the present observations suggest that BMAL1 may play roles in the adipose function. BMAL1-deficient MEF and BMAL1 knock-down 3T3-L1 cells failed to accumulate lipid droplets in cells (Figs. 2, 3, and 9). Importantly, adding BMAL1 back to BMAL1-deficient MEF allowed the cells to accumulate lipids (Fig. 2). Overexpression of BMAL1 in NIH 3T3 cells induced a significant amount of lipid accumulation compared with that of the control cells in the presence of the PPARγ ligand (Fig. 10). Overexpression of BMAL1 in adipocytes increased lipid synthesis activity (Fig. 7). These observations suggest that BMAL1 is involved in regulation of adipogenesis. Although BMAL1 is most likely required for adipose differentiation as described above, the presence of BMAL1 may not be sufficient for adipogenesis: Even after adding BMAL1 back to BMAL1-deficient cells, the cells could not fully differentiate without the PPARγ ligand (data not shown). Also, BMAL1 is expressed in nonlipogeneic cells, although a higher expression level is observed in lipophilic tissues, such as brain and adipose tissue (8, 10, 23). Therefore, one can speculate that BMAL1 appears to play a supporting role in executing PPARγ activity and maintaining the characteristics of adipocytes. This conclusion is supported by the results showing that addition of the potent PPARγ activator partly, but not fully, rescued the ability of BMAL1 knock-down 3T3-L1 cells to accumulate cellular lipids (Fig. 4). Additionally, BMAL1-deficient MEF cannot accumulate lipid in the cells, even in the presence of the PPARγ ligand (Fig. 2). Interestingly, expression of aP2, a known target gene for PPARγ2, is markedly induced by overexpression of BMAL1 without alteration of the PPARγ2 level (Fig. 5).
Overexpression of BMAL1 induced expression of several lipid metabolism-related factors in 3T3-L1 adipocytes (Fig. 5). In particular, enhanced expression of SREBP-1a and Rev-erb α may in part account for a putative mechanism by which BMAL1 promotes lipogenesis and the subsequent maturation of adipocytes (adipogenesis). The roles of SREBP-1a in lipogenesis are well characterized (24–28). SREBP-1a regulates the expression of several factors required for lipogenesis, such as FAS, resulting in the promotion of lipid synthesis and accumulation in cultured 3T3-L1 cells (29) and in vivo (30). In this study, expression of several SREBP-1a target genes, such as FAS, AACS, CD36, and HMG-CoA reductase, was elevated, accompanied with enhanced expression of SREBP-1a, in BMAL1 overexpression cells (Fig. 5). Several findings suggest that the increased expression of SREBP-1a and Rev-erb α is directly regulated by BMAL1. Luciferase activity driven by the promoters of Rev-erb α and SREBP-1a is increased as much as that of Per1, a known target gene of BMAL1, by cotransfection of BMAL1. Also, in mice adipose tissues, the expression of Rev-erb α and SREBP-1a are cycled during the day, with patterns of expression in phase with Per1 and in antiphase with BMAL1 (Fig. 11). Finally, these genes contain functional BMAL1/CLOCK binding sites in their promoter regions (Fig. 6B) (31). The moderately increased expression of SREBP-1a target genes may be a secondary effect of the enhanced expression of SREBP-1a in BMAL1-overexpressing cells, because the promoters of these genes are inactive in the presence of BMAL1 (Fig. 6A), and the expression of these genes in vivo is not cycled during the day (Fig. 11). Expression of another SREBP target gene, phosphoenolpyruvate carboxykinase, is dramatically suppressed in BMAL1-overexpressing cells (Fig. 5). The negative regulatory role of SREBP-1a has been previously reported (32–35). This lower expression of phosphoenolpyruvate carboxykinase by BMAL1, presumably through activation of SREBP, could also be favorable to BMAL1-dependent lipogenesis because carbon may be drawn toward to the tricarboxylic acid cycle rather than to gluconeogenesis. Furthermore, it is suggested that SREBP-1a activates genes that produce a ligand that activates PPARγ (36). Consequently, altered expressions of SREBP target genes resulting from the activation of SREBP by BMAL1 may contribute to higher lipid synthesis activity in adipocytes (Fig. 7). The expression of Rev-erb α is transcriptionally up-regulated during adipocyte differentiation (37). Thus, the participation of Rev-erb α in the adipogenesis program has been speculated (37). Also, direct transcriptional regulations of the Rev-erb α gene by PPARγ (38) and BMAL1 (31) have been reported. A recent study showed that ectopic expression of Rev-erb α increased the expression of PPARγ target genes, such as aP2 and C/EBPα, and as a result significantly promoted adipogenesis, especially in conditions under which differentiation depends on PPARγ activation (38). Taken together, these data lead us to conclude that BMAL1 plays several supporting roles in inducing and maintaining specific aspects of the adipocyte function, such as synthesis of fatty acids and cholesterol through the activation of several key factors, e.g., SREBP-1a and Rev-erb α.
The link between circadian rhythms and metabolic activity has long been studied in vivo (3–6). Recent molecular studies uncovered part of the cross-talk mechanism between circadian rhythms and metabolism (39). The DNA-binding activity of the BMAL1/CLOCK and BMAL1/NPAS2 heterodimers was found to be regulated by the redox state of NAD (39). The reduced forms of the redox cofactors NAD(H) and NADP(H) strongly enhanced DNA binding of the BMAL1/CLOCK and BMAL1/NPAS2 heterodimers, whereas the oxidized forms inhibited it (39). These results suggest the direct coupling of clock genes and the regulation of metabolism. Therefore, the results obtained in this study may prove an excellent opportunity to gain insights into cross-talk between circadian rhythms and lipid metabolism in adipocytes.
Supplementary Material
Acknowledgments
We thank Dr. Antoch for BMAL1 MEFs. This work is supported in part by a grant from the Ministry of Education, Sciences, Sports, and Culture of Japan (to S.S. and M.T.); a General Individual Research grant from Nihon University (to S.S.); a grant from Ono Medical Research Foundation (to S.S.); an Interdisciplinary General Joint Research grant from Nihon University (to M.T.); and the Academic Frontier Project for Private Universities, a matching fund subsidy from the Ministry of Education, Culture, Sports, Science, and Technology 2002–2006.
Author contributions: S.S. and M.T. designed research; S.S., N.I., Y.O., T.O., Y.W., M.H., T.W., and T.A. performed research; S.S. analyzed data; and S.S. wrote the paper.
This paper was submitted directly (Track II) to the PNAS office.
Abbreviations: AACS, acetoacetyl-CoA synthetase; aP2, adipocyte fatty acid-binding protein 2; BMAL1, brain and muscle Arnt like protein 1; C/EBP, CCAAT/enhancer-binding protein; DEX, dexamethasone; FAS, fatty acid synthase; HMG-CoA, 3-hydroxy-3-methylglutaryl-CoA; IBMX, isobutylmethylxanthine; MEF, mice embryonic fibroblast cell; PPAR, peroxisome proliferator-activated receptor; siRNA, small interfering RNA; SREBP, sterol regulatory element binding protein.
References
- 1.Spiegelman, B. M. & Flier, J. S. (2001) Cell 104, 531–543. [DOI] [PubMed] [Google Scholar]
- 2.Ahima, R. S. & Flier, J. S. (2000) Trends Endocrinol. Metab. 11, 327–332. [DOI] [PubMed] [Google Scholar]
- 3.Seaman, G. V., Engel, R., Swank, R. I. & Hissen, W. (1965) Nature 207, 833–835. [DOI] [PubMed] [Google Scholar]
- 4.Malherbe, C., De Gasparo, M., De Hertogh, R. & Hoet, J. J. (1969) Diabetologia 5, 397–404. [DOI] [PubMed] [Google Scholar]
- 5.Gagliardino, J. J. & Hernandez, R. E. (1971) Endocrinology 88, 1532–1534. [PubMed] [Google Scholar]
- 6.Schlief, G. & Dorow, E. (1973) J. Clin. Invest. 52, 732–740. [DOI] [PMC free article] [PubMed] [Google Scholar]
- 7.Bluher, M., Fasshauer, M., Kralisch, S., Schon, M. R., Krohna, K. & Paschke, R. (2005) Biochem. Biophys. Res. Commun. 329, 1127–1132. [DOI] [PubMed] [Google Scholar]
- 8.Aoyagi, T., Shimba, S. & Tezuka, M. (2005) J. Health Sci. 51, 21–32. [Google Scholar]
- 9.Hogenesch, J. B., Gu, Y. Z., Jain, S. & Bradfield, C. A. (1998) Proc. Natl. Acad. Sci. USA 95, 5474–5479. [DOI] [PMC free article] [PubMed] [Google Scholar]
- 10.Takahata, S., Sogawa, K., Kobayashi, A., Ema, M., Mimura, J., Ozaki, N. & Fujii-Kuriyama, Y. (1998) Biochem. Biophys. Res. Commun. 248, 789–794. [DOI] [PubMed] [Google Scholar]
- 11.Bunger, M. K., Wilsbacher, L. D., Moran, S. M., Clendenin, C., Radcliffe, L. A., Hogenesch, J. B., Simon, M. C., Takahashi, J. S. & Bradfield, C. A. (2000) Cell 103, 1009–1017. [DOI] [PMC free article] [PubMed] [Google Scholar]
- 12.Dunlap, J. C. (1999) Cell 96, 271–290. [DOI] [PubMed] [Google Scholar]
- 13.Young, M. W. & Kay, S. A. (2001) Nat. Rev. Genet. 2, 702–715. [DOI] [PubMed] [Google Scholar]
- 14.Reppert, S. M. & Weaver, D. R. (2002) Nature 418, 935–941. [DOI] [PubMed] [Google Scholar]
- 15.Lowrey, P. L. & Takahashi, J. S. (2004) Annu. Rev. Genomics Hum. Genet. 5, 407–441. [DOI] [PMC free article] [PubMed] [Google Scholar]
- 16.Hardin, P. E. (2004) J. Biol. Rhythms. 19, 348–360. [DOI] [PubMed] [Google Scholar]
- 17.Rudic, R. D., McNamara, P., Curtis, A.-M., Boston, R. C., Panda, S., Hogenesch, J. B. & FitGerald, G. A. (2004) PLoS Biol. 2, 1893–1899. [DOI] [PMC free article] [PubMed] [Google Scholar]
- 18.Bunger, M. K., Walisser, J. A., Sullivan, R., Manley, P. A., Moran, S. M., Kalscheur, V. L., Colman, R. J. & Bradfield, C. A. (2005) Genesis 41, 122–132. [DOI] [PubMed] [Google Scholar]
- 19.Takagi, S., Tojo, H., Tomita, S., Sano, S., Itami, S., Hara, M., Inoue, S., Horie, K., Kondoh, G., Hosokawa, K., et al. (2003) J. Clin. Invest. 112, 1372–1382. [DOI] [PMC free article] [PubMed] [Google Scholar]
- 20.Turek, F. W., Joshu, C., Kohsaka, A., Lin, E., Ivanova, G., McDearmon, E., Laposky, A., Losee-Olson, S., Easton, A., Jensen, D. R., et al. (2005) Science 308, 1043–1045. [DOI] [PMC free article] [PubMed] [Google Scholar]
- 21.Kondratov, R. V., Chernov, M. V., Kondratova, A. A., Gorbacheva, V. Y., Gudkov, A. V. & Antoch, M. P. (2003) Genes Dev. 17, 1921–1932. [DOI] [PMC free article] [PubMed] [Google Scholar]
- 22.Bradford, M. M. (1976) Anal. Biochem. 72, 248–254. [DOI] [PubMed] [Google Scholar]
- 23.Ikeda, M. & Nomura, M. (1997) Biochem. Biophys. Res. Commun. 233, 258–264. [DOI] [PubMed] [Google Scholar]
- 24.Kim, J. B. & Spiegelman, B. M. (1996) Genes Dev. 10, 1096–1107. [DOI] [PubMed] [Google Scholar]
- 25.Magana, M. M. & Osborne, T. F. (1996) J. Biol. Chem. 271, 32689–32694. [DOI] [PubMed] [Google Scholar]
- 26.Shimano, H., Horton, J. D., Hammer, R. E., Shimomura, I., Brown, M. S. & Goldstein, J. L. (1996) J. Clin. Invest. 98, 1575–1584. [DOI] [PMC free article] [PubMed] [Google Scholar]
- 27.Magana, M. M., Lin, S. S., Dooley, K. A. & Osborne, T. F. (1997) J. Lipid Res. 38, 1630–1638. [PubMed] [Google Scholar]
- 28.Ericsson, J., Jackson, S. M., Kim, J. B., Spiegelman, B. M. & Edwards, P. A. (1997) J. Biol. Chem. 272, 7298–7305. [DOI] [PubMed] [Google Scholar]
- 29.Shimomura, I., Shimano, H., Horton, J. D., Goldstein, J. L. & Brown, M. S. (1997) J. Clin. Invest. 99, 838–845. [DOI] [PMC free article] [PubMed] [Google Scholar]
- 30.Horton, J. D., Shimomura, I., Ikemoto, S., Bashmakov, Y. & Hammer, R. E. (2003) J. Biol. Chem. 278, 36652–36660. [DOI] [PubMed] [Google Scholar]
- 31.Triqueneaux, G., Thenot, S., Kakizawa, T., Antoch, M. P., Safi, R., Takahashi, J. S., Delaunay, F. & Laudet, V. (2004) J. Mol. Endocrinol. 33, 585–608. [DOI] [PMC free article] [PubMed] [Google Scholar]
- 32.Chakravarty, K., Leahy, P., Becard, D., Hakimi, P., Foretz, M., Ferre, P., Foufelle, F. & Hanson, R. W. (2001) J. Biol. Chem. 276, 34816–34823. [DOI] [PubMed] [Google Scholar]
- 33.Becard, D., Hainault, I., Azzout-Marniche, D., Bertry-Coussot, L., Ferre, P. & Foufelle, F. (2001) Diabetes 50, 2425–2430. [DOI] [PubMed] [Google Scholar]
- 34.Yamamoto, T., Shimano, H., Nakagawa, Y., Ide, T., Yahagi, N., Matsuzaka, T., Nakakuki, M., Takahashi, A., Suzuki, H., Sone, H., et al. (2004) J. Biol. Chem. 279, 12027–12035. [DOI] [PubMed] [Google Scholar]
- 35.Chakravarty, K., Wu, S.-Y., Chiang, C.-M., Samols, D. & Hanson, R. W. (2004) J. Biol. Chem. 279, 15385–15395. [DOI] [PubMed] [Google Scholar]
- 36.Kim, J. B., Wright, H. M., Wright, M. & Spiegelman, B. M. (1998) Proc. Natl. Acad. Sci. USA 95, 4333–4337. [DOI] [PMC free article] [PubMed] [Google Scholar]
- 37.Chawla, A. & Lazar, M. A. (1993) J. Biol. Chem. 268, 16265–16269. [PubMed] [Google Scholar]
- 38.Fontaine, C., Dubois, G., Duguay, Y., Helledie, T., Vu-Dac, N., Gervois, P., Soncin, F., Mandrup, S., Fruchart, J.-C., Fruchart-Najib, J. & Staels, B. (2003) J. Biol. Chem. 278, 37672–37680. [DOI] [PubMed] [Google Scholar]
- 39.Rutter, J., Reick, M., Wu, L. C. & McKnight, S. L. (2001) Science 293, 510–514. [DOI] [PubMed] [Google Scholar]
Associated Data
This section collects any data citations, data availability statements, or supplementary materials included in this article.


