

Abstract
Music can effectively influence human emotions, with different melodies and rhythms eliciting varying emotional responses. Among these, tempo is one of the most important parameters affecting emotions. This study explores the impact of music tempo on emotional states and the associated brain functional networks. A total of 26 participants without any history of neurological or psychiatric disorders and music training took part in the experiment, using classical piano music clips at different tempi (56, 106, 156 bpm) as stimuli. The study was conducted using emotional scales and electroencephalogram (EEG) analysis. The results showed that the valence level of emotions significantly increased with music tempo, while the arousal level exhibited a “V” shape relationship. EEG analysis revealed significant changes in brainwave signals across different frequency bands under different tempi. For instance, slow tempo induced higher Theta and Alpha power in the frontal region, while fast tempo increased Beta and Gamma band power. Moreover, fast tempo enhanced the average connectivity strength in the frontal, temporal, and occipital regions, and increased phase synchrony value (PLV) between the frontal and parietal regions. However, slow tempo improves PLV between the occipital and parietal regions. The findings of this study elucidate the effects of music tempo on the brain functional networks related to emotion regulation, providing a theoretical basis for music-assisted diagnosis and treatment of mood disorders. Furthermore, these results suggest potential applications in emotion robotics, emotion-based human-computer interaction, and emotion-based intelligent control.
Keywords: Music, Tempo, Emotional States, Electroencephalogram (EEG), Brain functional network
Subject terms: Electroencephalography - EEG, Psychology, Emotion
Introduction
Music, as a complex auditory stimulus, significantly affects the emotional and cognitive functions of the brain1,2. Music is closely related to human emotions, with various melodies and rhythms eliciting different emotional experiences. For example, some music evokes happiness3,4, while other pieces may evoke sadness5,6. Music pieces may also provoke anxiety7, while others may help alleviate it8–10. Music reaches the body through auditory channels, producing subtle and harmonious vibrations that increase the excitability of neurons in the cerebral cortex, thus enhancing emotional experiences. By manipulating different acoustic parameters in music, such as tempo, loudness, pitch, key, melody, rhythm, harmony, etc., it is possible to convey the rhythmic character of the emotional message. Among these, however, tempo is one of the most important factors due to its potential to induce effective emotional responses5,11–14.
Research has shown that the tempo of music can significantly affect human emotions. Fast-tempo music is commonly associated with excitement, liveliness, happiness, joy, and pleasure, while slow-tempo music is often linked to calmness, dignity, sadness, tenderness, boredom, and disgust15. For example, Vieillard et al. found that fast-tempo music can evoke positive emotions. In contrast, slow tempo is generally thought to express negative emotions16. Trochidis et al. investigated the effects of three melodies (major, minor, and bass) and three tempi (slow, medium, and fast) on mood scores and EEG responses. It was found that tempo moderated emotional valence and arousal levels. Fast tempo is strongly associated with angry and happy emotions. Meanwhile, slow tempo triggered stronger feelings of sadness and calmness17. On top of that, evidence suggests that when evaluating the valence of musical stimuli, tempo can be influential enough to overshadow mode, particularly among non-musicians18.
In examining the therapeutic effects of music, Mofredj et al. emphasized the importance of tempo, as its modulatory impact on the nervous system is considered central to these effects19. Music tempo can structure behavior by influencing mood and altering physiological functions such as heart rate, muscle tone, blood pressure, and respiration20,21, influencing the neural modulation of both physiological and psychological responses. Soft, slow, non-lyrical music with harmonies and a lack of percussion can significantly reduce systolic blood pressure, heart rate, respiratory rate, and oxygen saturation20,22. Additionally, Morreale et al. demonstrated that increased tempo results in higher arousal levels18. Conversely, Krabs et al. (2015) found that tempo alone did not affect physiological parameters when stimuli matched subjectively experienced arousal23, suggesting that the therapeutic effects attributed to tempo may derive from different arousal experiences.
Music regulates emotions by influencing neuronal activity in the brain24: Music with a specific rhythm causes activation or inhibition of neurons in different brain regions, and the changes in a person’s emotional state can lead to corresponding changes in the frequency components of brainwaves, which are reflected in the electroencephalography (EEG). It has been demonstrated that music can evoke changes in the activity of core brain regions that underlie emotion, including the superficial and laterobasal nuclei groups of the amygdala, the hippocampal formation, the right ventral striatum (including the nucleus accumbens) extending into the ventral pallidum, the head of the left caudate nucleus, the auditory cortex, the pre-supplementary motor area (SMA), the cingulate cortex and the orbitofrontal cortex25,26. On the contrary, the pleasure one feels cannot be separated from the activity of the basal nucleus and lentiform nucleus27. However, emotional activity is not a single brain activity behavior; it is often accompanied by other cognitive activities such as attention, memory, and high-level language processing. Previous studies have focused on the effects of musical tempo on individuals’ emotional experiences as well as psychological and physiological activities. However, there has been a lack of exploration integrating subjective emotional experiences with objective neural brain network activities related to emotions. Additionally, studies on the relationship between musical tempo and emotional processing have been insufficient, and the functional connectivity of brain network structures involved in emotion regulation remains unclear.
In this paper, we focus on exploring the effects of tempo on brain activities in different emotional states. We use musical clips with varying tempi as stimuli to evoke emotions. We employ power spectral density analysis to examine the distribution of EEG signal frequencies, providing insights into predominant brainwave rhythms associated with specific emotions. Discrete entropy is used to assess the complexity and variability of brain activity, indicating how predictable or chaotic these signals are during different emotional states. Furthermore, we analyze brain functional networks using Covariance (COV) and Phase Locking Value (PLV) to explore connectivity patterns among different brain regions, providing insight into how musical tempo influences neural communication.
By integrating these analytical techniques, this study helps to elucidate the intricate dynamics between tempo, emotional processing, and brain activity. It offers a new perspective for emotion research—regulating emotions by manipulating tempo—which can be used for the diagnosis and treatment of emotional disorders, offering strong evidence for the psychological health benefits of music. Furthermore, it has potential applications in emotional robots, affective human-computer interaction, and emotion-based intelligent control.
Materials and methods
Participants
A total of 26 participants (13 females, mean age = 23.2 years, ranging from 17 to 38 years; right-handed; all native Chinese) were involved in the study. None of the participants have reported a history of neurological or psychiatric disorders, and none had received musical training. All of the participants should not experience extreme negative or positive emotions during the week prior to the experiment and must avoid intense emotional activities (such as arguments or strenuous exercise) in the 24 h before the experiment. Participants were de-identified and indexed as S00 ~ S26. This study has been approved by the Biomedical Ethics Committee of Xi’an Jiaotong University (No. 2023−1552), and informed consent was obtained from all participants. Additionally, we confirm that all methods in this study were conducted in accordance with the relevant guidelines and regulations.
Stimuli and experimental conditions
This study uses high-quality pure music in WAV format as the EEG stimulation material. Considering that participants must easily perceive the tempo of the music, the selected musical stimuli must meet the following conditions: a clear, unsyncopated beat, constant tempo, few harmonic or melodic changes, and low familiarity28. Based on these criteria, we selected “Sonata for 2 Pianos in D major, K.448/375a” by Wolfgang Amadeus Mozart as the stimulus material. Considering the audibility of the music segments, we chose a complete measure of the climax part of this piece as the stimulation unit (referred to as Classical Piano). Figure 1 shows the preparation process of the stimulus. The original tempo of Classical Piano is 126 bpm (a). Using professional audio software Adobe Audition, the two units were adjusted to 56 bpm (slow tempo), 106 bpm (medium tempo), and 156 bpm (fast tempo), respectively. Each of the three different tempo units was looped 6 times to arrange into three new musical stimuli (c).
Fig. 1.

The original music clip was edited at gradients of 50 to 56 bpm, 106, and 156 bpm. Each edited music unit was then looped 6 times to form new musical stimuli.
Based on the strict selection and processing of the musical stimuli materials mentioned above, we need a suitable theoretical model and assessment method to measure the impact of these stimuli on the participants’ emotions. Mehrabian proposed the PAD emotional model in 1974, which posits that emotions have three dimensions: valence, arousal, and dominance29,30. P stands for valence (Pleasure-Displeasure), indicating the positive or negative nature of an individual’s emotional state; A represents arousal (Arousal-Nonarousal), reflecting the level of neurophysiological activation of an individual; and D stands for dominance (Dominance-Submissiveness), representing the level of control an individual has over situations and others. This experiment focuses only on valence and arousal to evaluate the participants’ emotional state. There are multiple assessment methods, and one of the most common measurement methods of psychological data is the self-report Likert scale(Clark and Watson, 2019), which provides a convenient way to measure unobservable constructs. Therefore, we used two seven-point Likert scales to assess the valence and arousal levels of the participants.
Experiment procedure
Participants sat approximately 40 centimeters away from a 22-inch monitor (Dell, USA) and wore headphones during the experiment. Before the start of the experiment, participants were told to minimize actions such as blinking and swallowing. At the beginning of the experiment, participants had a 30-second rest period. The three musical stimuli of different tempi were played randomly in each experiment. Before each musical stimulus, to minimize the interference caused by eye movements and to stabilize the participants’ emotions, a “+” sign was displayed at the center of the screen for 15 s, during which participants were required to focus their attention and then listen to the music. After each musical stimulus was played, participants were asked to rate the arousal and valence levels based on the emotions evoked by the music, using two 7-point Likert scales (1 = very negative or low arousal, 7 = very positive or high arousal) within 4 s. Additionally, between two music stimuli, participants were asked to complete ten arithmetic problems to minimize the influence of the previous state on subsequent sessions. The experimental procedure is shown in (Fig. 2).
Fig. 2.

In each experiment, the three musical stimuli were played randomly. After each musical stimulus, participants were asked to rate the arousal and valence levels based on the emotions evoked by the music on two 7-point scales (1 = very negative or low arousal, 7 = very positive or high arousal) within 4 s.
EEG recording and preprocessing
EEG data were recorded using a wireless EEG system (NeuSen.W32, Neuracle, China) at an original sampling rate of 1000 Hz and then preprocessed for offline analysis with the EEGLAB toolbox (version 2024.0) in MATLAB environment (version R2023b). The EEG signals were referenced to a common average reference (CAR) before further processing, and EEG electrodes were referenced to the 10–10 international standard system. First, EEG segments with large amplitude artifacts were identified and removed, and channels with poor signal quality were excluded through a visual inspection. Next, an adaptive notch filter was employed to remove 50 Hz power line noise. Afterwards, a fourth-order Butterworth band-pass filter, which is known for its smooth frequency response, was applied to isolate the EEG signal within the frequency range of 0.1 Hz to 90 Hz31. This approach allowed us to retain meaningful brain activity signals while minimizing noise and extraneous frequencies. The signal was then resampled to a sampling rate of 1000 Hz by executing the resample function in MATLAB. Finally, components associated with artifacts, such as those from electromyography (EMG) and ocular movements, were detected and eliminated using independent component analysis (ICA). The EEG data from each participant and each music condition were decomposed into independent components using the runica algorithm. The resulting components were visually inspected and analyzed for periodicity, as components with clear repetitive patterns—often indicative of artifacts—were identified for removal. A predefined threshold for periodicity was used, where components exhibiting periodicity above a certain value (100ms) were flagged as artifacts. These artifact components were then removed, and the remaining independent components were used to reconstruct the cleaned EEG signals. To ensure consistency in the data format across subjects, strict criteria were applied: channels were only excluded if they showed significant signal degradation (e.g., excessive noise or electrode disconnection). If more than two channels were excluded for a given subject, that subject’s data were excluded from the analysis to maintain consistency across all subjects. This ensured that the remaining data for all subjects were comparable in terms of the number of usable channels, thus minimizing potential confounds related to data quality variations. The EEG raw data and preprocessed comparison graphs are shown in (Fig. 3).
Fig. 3.

The comparison of EEG raw data and EEG preprocessed data. We selected three electrodes, Fp1, Fp2, FpZ, for comparative analysis before and after preprocessing.
Since EEG features in the frontal, temporal, parietal, hand occipital regions are highly correlated with changes in emotion, and the temporal region includes auditory cortex areas associated with normal music listening, we focused on analyzing EEG features in these regions32. As seen in Fig. 4, channels from each region (frontal: Fp1, Fp2, AF3, AF4, AF7, AF8, Fpz; parietal: P5, P6, P3, P4, P1, P2, Pz; temporal: T7, T8; occipital: PO3, PO4, PO7, PO8, O1, O2, Oz) were utilized for the extraction of indices.
Fig. 4.

EEG electrodes in the 10–10 system. The red circled area represents the frontal lobe (Fp1, Fp2, AF3, AF4, AF7, AF8, and Fpz), yellow represents temporal lobe (P5, P6, P3, P4, P1, P2 and Pz), and blue represents occipital lobe (PO3, PO4, PO7, PO8, O1, O2, and Oz).
For the analysis of these specific brain regions, signals from all channels within each region were averaged to create a single representative signal. This approach ensures consistent contribution from each region, despite variations in channel number per subset. It can also help improve signal stability and signal-to-noise ratio. At the same time, we also recognized that different channels may carry different physiological or physical information, therefore, specific channels exhibiting prominent activity were selected for individual analysis. This dual approach allows for a detailed examination of significant neural responses while maintaining a comprehensive view of regional brain activity.
EEG feature extraction
The selection of features in EEG feature extraction was based on two key aspects: region-specific characteristics, which include both energy features and complexity measures of the brain regions, and the interaction between different brain regions, captured through linear coherence (COV) and non-linear phase-locking value (PLV).
These features were chosen because they allow us to capture both the intrinsic activity within specific brain regions and the inter-regional coordination. Energy and complexity features reflect the local brain dynamics, while COV and PLV provide insights into how different brain regions cooperate, capturing both linear and non-linear aspects of brain connectivity. Together, these features offer complementary information that enhances the comprehensiveness of the analysis.”
Power spectrum analysis
In this study, we employed Power Spectrum Analysis to explore the frequency domain characteristics of EEG signals. The power spectrum quantifies how variance is distributed over frequencies and is useful for identifying periodic behavior in time series33. We analyzed the power spectrum of the EEG during the experiment with window lengths of T = 0.5s with 0.25s overlap. In this period, we computed the frequency bands of delta (1–4 Hz), theta (4–8 Hz), alpha (8–12 Hz), beta (12–32 Hz), and gamma (32–45 Hz). Also, we analyzed the energy intensity of the brain regions.
The basic step of Power Spectrum Analysis involves transforming the signal from the time domain to the frequency domain using the Fourier Transform. For a discrete signal , its Discrete Fourier Transform (DFT) is defined as Eq. (1):
 |
1 |
Where represents the complex amplitude of the signal at the k-th frequency component, and N is the number of samples. The power spectral density (PSD) is defined as Eq. (2):
 |
2 |
Dispersion entropy analysis
This study uses dispersion entropy (DE) to analyze the complexity of non-linear time series data such as EEG signals. This entropy measure provides insights into the average unpredictability or disorder within a system, which is crucial for understanding dynamic processes34. Dispersion entropy, introduced by Rostaghi and Azami, is especially adept at capturing variations due to noise and simultaneous changes in frequency and amplitude35. To calculate DE for a univariate time series, the following steps are employed:
First, we employ the normal cumulative distribution function (NCDF) to map x into
 from 0 to 1. Then, a linear algorithm is used to assign each
  to an integer from 1 to
  do so,
  round
round ,where
  shows the jth member of the classified time series, and rounding involves either increasing or decreasing a number to the next digit.
Each embedding vector
 with embedding dimension m and time delay d is created according to
 , and is mapped to a dispersion pattern
 . The specific mapping is defined by Eq. (3):
 |
3 |
-
(3)
For each potential dispersion pattern
 , relative frequency is calculated as Eq. (4):
 |
4 |
-
(4)
Based on the Shannon’s definition of entropy, the DE value is computed as Eq. (5):
 |
5 |
We computed the dispersion entropy of the EEG during the experiment with delay of  , the embedding dimension of dispersion entropy of
  , and the number of classes of
  . In this period, we analyzed the changes and differences in dispersion entropy after being stimulated by music stimuli of different tempi.
Covariance (COV) analysis
In probability theory and statistics, covariance (COV) measures the overall error of two variables. At the same time, covariance (COV) analysis is of great significance in the field of EEG, which is used to deal with noise in EEG data and estimate the spatial distribution of signal and source localization. sample covariance is one of the forms of covariance. This study used COV analysis to explore various network properties, including node strength, clustering coefficient, and degree distribution, which provide insights into brain connectivity and functionality.
Node strength
Node strength can be regarded as a measure of the importance or centrality of nodes within the weighted network36. Its calculation includes information about connection weights and the number of connections. Node strength is defined as inflow and outflow weights summed from a node37. The mathematical formulation for node strength is as Eq. (6):
 |
6 |
where si is the strength of node i, and  is the covariance between the time series of nodes i and j38. Node strength provides insights into the level of activity and connectivity a specific region has with other regions, indicating potential hubs in the brain network.
Clustering coefficient
The local clustering coefficient can be quantified by using the so-called local clustering coefficient, which is simply the ratio between the number of actually existing connections between all neighbor nodes and the maximum number of such connections between these neighbor nodes39. The size of the local clustering coefficient ranges between 0 and 1. For an undirected network, the local clustering coefficient of node i is defined as Eq. (7):
 |
7 |
where  is the number of connections between the neighbors of node i, and
  is the number of neighbors of node i40. A high clustering coefficient for a particular region may indicate a propensity for specialized processing and synchronous activity in EEG studies.
The triangle of a network means a subgraph consisting of three nodes and three links41. The clustering coefficient of the network is the mean of the local clustering coefficient of all nodes. It is usually considered as a measure of functional segregation of the brain network. For an undirected network, the clustering coefficient is calculated as Eq. (8):
 |
8 |
where N is the number of nodes in a network. In a directed network, clustering coefficient is defined by Eq. (9):
 |
9 |
where  is the number of triangles around node i for a directed network,
  and
and  represent the in-degree and out-degree of node i, respectively. For a binary connection matrix,
  represents the connection state between node j and node i, and a value of 1 indicates that there is a connection, otherwise there is no connection.
Degree distribution
The degree of a node in a network (sometimes referred to incorrectly as the connectivity) is the number of connections or edges the node has to other nodes. If a network is directed, meaning that edges point in one direction from one node to another, nodes have two different degrees: the in-degree, which is the number of incoming edges, and the out-degree, which is the number of outgoing edges. In EEG networks, degree distribution can highlight the presence of highly connected nodes (hubs) and help analyze the efficiency and robustness of brain networks32. The degree distribution P(k) of a network is then defined as Eq. (10):
 |
10 |
Phase locking value (PLV) analysis
As the brain is a non-linear dynamical system, Phase Locking Value (PLV)is a suitable method to quantify the interaction42–44. The PLV is advantageous for analyzing brain connectivity as it focuses on the consistency of phase differences over time rather than amplitude, making it robust against common-mode artifacts and signal power variations. To compute the PLV between two signals,  and
and  , the process typically involves the following steps:
Phase Extraction: Extract the instantaneous phase of these filtered signals using a method such as the Hilbert transform on wavelet transform.
Phase Difference is calculated as Eq. (11):
 |
11 |
where  and
and  are the instantaneous phases of signals
  and
and , respectively.
-
(3)
PLV Computation:
The PLV is computed as the absolute value of the average of the complex phase differences over time, as Eq. (12):
 |
12 |
Where N is the number of sampled points in time, and j is the imaginary unit  . Each term
  represents a unit vector on the complex plane with a direction given by the phase difference. High PLV Indicates that the phase difference between the two signals remains consistent across time, suggesting synchrony or coupling between the two brain areas being analyzed.
Results
Scale analysis of Valence and arousal
We used a one-way ANOVA to examine the effects of different music tempi on individuals’ emotional valence and arousal. Means and standard deviations of valence and arousal were calculated. Valence significantly increased with rising music tempo (F = 222.27, p < 0.001, Tukey test). Additionally, changes in arousal were significant (F = 330.89, p < 0.001, Tukey test): the arousal-tempo relationship exhibited a “V” shape, with the lowest arousal at 106 bpm (1.88 ± 0.54), followed by 56 bpm (3.52 ± 0.78), and the highest at 156 bpm (6.62 ± 0.50) (all data are presented as mean ± standard deviation (SD) throughout the article), as shown in (Fig. 5).
Fig. 5.

The average scores of valence and arousal changing with music tempo measured on scales from 1 to 7. The valence scores significantly increase as the music tempo increases, while the arousal-tempo relationship exhibits a “V” shape.
In addition, to further verify the accuracy and reliability of the above results, we analyzed the changes of Valence and Arouse levels under different Tempo situations for each subject, as shown in (Fig. 6). We can see that different participants’ assessments of Valence and Arouse differed at different Tempo, especially at 56 bpm, 106 bpm (e.g., S8, S16, S25, etc.). Such differences may stem from a variety of factors such as an individual’s musical preference, physiological response, and psychological state. However, despite these differences, the picture still clearly corroborates out the overall trend indicated in (Fig. 5): Valence significantly increased with rising music tempo, while the arousal-tempo relationship exhibited a “V” shape.
Fig. 6.

The scores of valence and arousal changing with music tempo measured on scales from 1 to 7 in 26 subjects.
EEG analysis
The characteristics of power spectrum between different music tempi
This study investigated the influence of varying musical tempo on the brain power spectrum in the frontal, parietal, temporal, and occipital regions. We examined the brain topography of the power across various frequency bands in response to different music tempi. Subsequently, we performed a one-way ANOVA to evaluate the mean power of these frequency bands across each brain region. Our research demonstrated that different regions of the brain exhibit varying responses to music tempo, as illustrated in (Fig. 7) (see Supplementary Table S2–S6 for detailed ANOVA results).
Fig. 7.
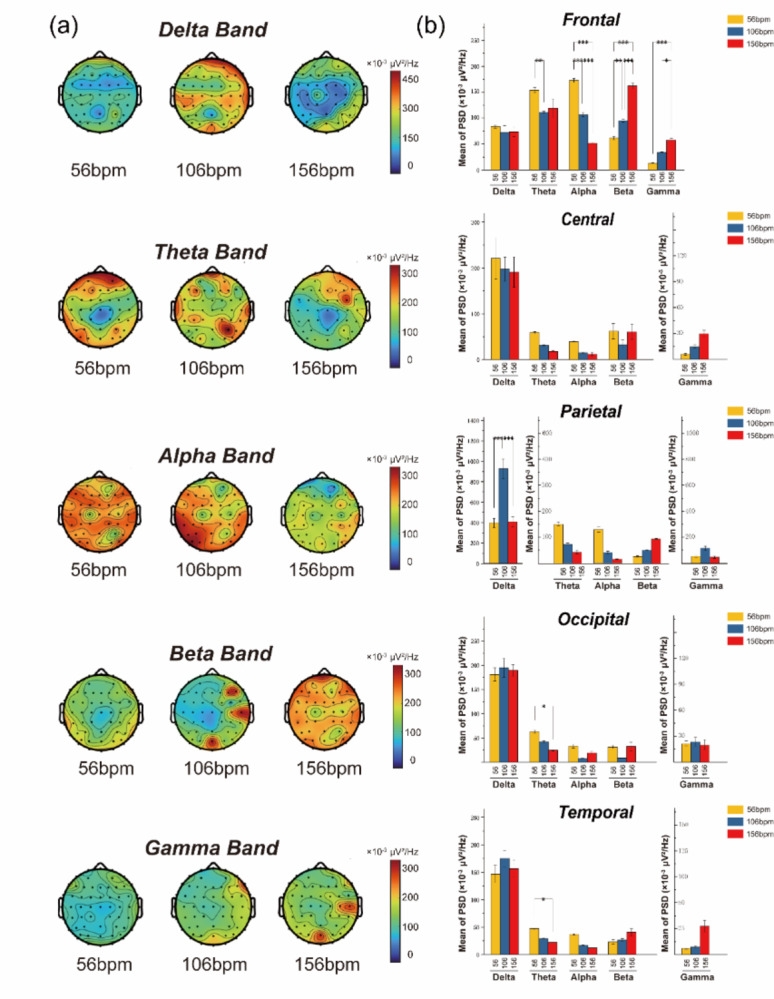
(a) Shows the power spectral analysis of brain topography across different frequency bands under various music tempi. (b) The diagram illustrates the average power spectral density (×10− 3 µV²/Hz) of these frequency bands in each brain region for different music tempi, with yellow indicating slow tempo (56 bpm), blue indicating medium tempo (106 bpm), and red indicating fast tempo (156 bpm).
In the frontal region, the power of the theta band is highest during slow tempo (154.02 ± 9.76). In contrast, the alpha band power significantly decreases as the music tempo increases (P < 0.001, Tukey test). This suggests that slow tempo may reduce attention and trigger brain activities associated with relaxation or soothing states. On the other hand, the beta band power significantly increases with higher tempo (P < 0.001, Tukey test), while the gamma band exhibits power characteristics similar to beta but with a lower average. In the parietal region, the average power of the delta band (266.32 ± 32.56) is significantly higher than that of the other four bands (P < 0.001, Tukey test), with delta activity being most prominent at a moderate tempo of 106 bpm (407.22 ± 14.19). In the temporal and occipital regions, which are similar to the parietal region, the average power of the delta band is significantly higher than that of the other bands. However, the power of the theta band significantly decreases as tempo increases (P < 0.05, Tukey test), with slow tempo inducing the highest theta power values (temporal: 21.43 ± 2.47; occipital: 24.65 ± 2.95).
The frontal region shows the most significant brain response to fast tempo, especially in the theta, alpha, and beta bands. Specifically, slow music induces the highest theta and alpha power, while fast tempo induces the highest beta power. In the parietal, occipital, and temporal regions, the average power value of the delta band is significantly higher than that of the other bands. It shows the highest power under medium tempo, particularly in the occipital region. Meanwhile, the occipital and temporal regions display increasing theta power with increasing music tempo.
The characteristics of dispersion entropy (DE) between different music tempi
We further applied a three-way ANOVA to explore the effects of brain region, frequency band, and music tempo on dispersion entropy. As shown in (Table 1), the factor of brain region did not have a significant impact on DE (F = 0.760, p = 0.551 > 0.05, Tukey test). However, both frequency band (F = 12108.87, p < 0.0001, Tukey test) and music tempo (F = 35650.88, p < 0.0001, Tukey test) exhibited significant effects on DE ( see Supplementary Table S7-S12 for detailed ANOVA results).
Table 1.
Results of three-way ANOVA on the effects of brain region, frequency band, and music tempo on dispersion entropy.
| DF | SS | MS | F | P-value | |
|---|---|---|---|---|---|
| Brain region | 4 | 0.03 | 0.0076 | 0.77 | 0.55 |
| Frequency band | 4 | 480.61 | 120.15 | 12108.87 | < 0.0001 |
| Music tempo | 2 | 707.50 | 353.75 | 35650.88 | < 0.0001 |
| Brain region * frequency band | 16 | 0.26 | 0.02 | 1.68 | 0.05 |
| Brain region * music tempo | 8 | 0.0061 | 7.63E-4 | 0.08 | 0.9997 |
| Frequency band * music tempo | 8 | 0.48 | 0.06 | 5.99 | < 0.0001 |
| Brain region * frequency band * music tempo | 32 | 0.03 | 0.0011 | 0.11 | 1 |
| Total | 74 | 1188.92 | 16.07 | 1619.18 | < 0.0001 |
| Error | 1725 | 17.12 | 0.01 | ||
| Modified total | 1799 | 1206.04 |
To further investigate the effect of music tempo on DE, we selected EEG signals from different frequency bands in the frontal, parietal, temporal, and occipital regions under varying music tempo. As indicated in (Fig. 8), DE for all three music tempi increases with the frequency band rises. Specifically, the average DE across three music tempo follows the order: Gamma (3.91 ± 0.63) > Beta (3.50 ± 0.63) > Alpha (3.01 ± 0.63) > Theta (2.77 ± 0.63) > Delta (2.46 ± 0.65), reaching a significance level of 0.001 (F = 297.30, p < 0.001, Tukey test).
Fig. 8.

The average dispersion entropy (DE) values across the five frequency bands under different music tempi. Yellow represents slow tempo (56 bpm), blue represents medium tempo (106 bpm), and red represents fast tempo (156 bpm). The results show that as the music tempo increases, the average DE increase. Additionally, as the frequency band rises, the DE induced by all three music tempi also increases.
Covariance (COV) analysis
The covariance analysis examined the connectivity among the 59 channels and the overall connectivity of five major brain regions. This analysis included the average connection strength and clustering coefficient between different brain regions, revealing changes in brain network connectivity under different music tempi (Fig. 9). Additionally, we focused on nodes that showed statistically significant differences in node strength across the three music tempi for further analysis (Fig. 10) (see Supplementary Table S13, S14 for detailed ANOVA results).
Fig. 9.

(a) illustrates the average connectivity status between 59 brain channels under different music tempi. (b) displays the average clustering density among these 59 channels under varying music tempi. (c) shows the average connection strength of five different brain regions under different music tempi. (d) represents the average clustering coefficient of five different brain regions under various music tempi. In diagrams (c) and (d), yellow indicates slow tempo (56 bpm), blue indicates medium tempo (106 bpm), and red indicates fast tempo (156 bpm).
Fig. 10.

The strength of nodes F7, T7, T8, P4, P6, Poz PO4, and FCz varies with music tempo. Gray indicates slow tempo (56 bpm), blue indicates medium tempo (106 bpm), and pink indicates fast tempo (156 bpm).
When examining the average connection strength between different brain regions, it is evident from Fig. 9a, c that, as music tempo increases, the average connection strength in the frontal, occipital, and temporal regions shows an upward trend. Specifically, under fast tempo conditions (frontal: 21.91 ± 2.55; temporal: 21.40 ± 2.80; occipital: 14.94 ± 1.95), these regions exhibit significantly higher average connection strength compared to slow-tempo music (frontal: 19.35 ± 2.85; temporal: 16.30 ± 3.31; occipital: 10.61 ± 2.27) (frontal: P < 0.05, Tukey test; temporal: P < 0.001, Tukey test; occipital: P < 0.001, Tukey test). Meanwhile, the parietal Region displays the lowest connectivity among channels during medium-tempo music (16.94 ± 3.75, P < 0.05, Tukey test).
We selected relevant channels of different brain regions for further exploration, as shown in (Fig. 10). In the frontal region, the node connectivity strength of the F7 channel increases with music tempo, aligning with the overall trend of average connection strength in the frontal region. We specifically focused on the T7 and T8 channels in the temporal region. The node connectivity strength of the T8 channel increases with faster music tempo. It is significantly higher under fast-tempo music compared to medium and slow-tempo music (P < 0.001, Tukey test), consistent with the overall average connection strength analysis in the temporal region. Interestingly, the T7 channel’s node connectivity strength shows the opposite trend, significantly decreasing with faster music tempo (P < 0.001, Tukey test). This could indicate that the T7 channel employs different brain functional networks when processing fast tempo or involves other cognitive processes not synchronized with increased connectivity strength during rapid tempo. We also analyzed the P4 and P6 channels in the parietal region and the POz and PO4 channels in the occipital region, all showing the highest node connectivity strength under fast-tempo music.
The FCz channel is a significant channel in auditory EEG response45.The FCz channel exhibited a significant increase in node strength at 156 bpm compared to both 56 bpm (p < 0.01, Turkey Test) and 106 bpm (p < 0.01, Turkey Test), as shown in (Fig. 10). This suggests that faster tempo enhances functional connectivity in the frontal-central region, possibly due to increased auditory-motor synchronization and cognitive load required for tempo tracking.
Regarding the clustering coefficient, as shown in (Fig. 9b, d), different music tempi do not significantly affect the frontal region. However, a high clustering coefficient is consistently maintained in the frontal region, particularly at channels FPz, FP1, FP2, APZ, AF3, and AF4. The temporal region exhibits the highest clustering coefficient under fast-tempo music (0.89 ± 0.08, P < 0.001), consistent with earlier results from the average connection strength analysis. However, the results for the occipital and parietal regions differ between clustering coefficient and average connection strength analyses: in the parietal region, the clustering coefficient is highest under medium tempo (0.87 ± 0.05, P < 0.05, Tukey test), and in the occipital region, the clustering coefficient is highest under slow tempo (0.91 ± 0.14) and lowest under medium tempo (0.78 ± 0.017, P < 0.001, Tukey test).
Figure 11 illustrates the strength comparison of different frequency bands within the covariance network under three music tempo conditions. The analysis shows that the Delta, Theta, and Alpha bands exhibit the highest strength at slow tempo (Delta: 512.36 ± 22.68; Theta: 507.79 ± 14.67; Alpha: 32.29 ± 152.24), indicating a more significant synchronization or interaction among different brain regions in these frequency ranges at this tempo. The strength of these bands significantly decreases with increasing music tempo (P < 0.05, Tukey test), particularly in the Delta band. This may suggest that as the music tempo increases, the brain experiences reduced synchronization or interaction in these low-frequency bands.
Fig. 11.

The comparison of the mean connection strength of the Delta, Theta, Alpha, and Beta frequency bands within the covariance network under three music tempo conditions. Yellow indicates slow-tempo music (56 bpm), blue indicates medium-tempo music (106 bpm), and red indicates fast-tempo music (156 bpm). The strength of each frequency band decreases as the music tempo increases.
In contrast, the Beta band shows comparatively lower overall covariance strength that changes little across different music tempi conditions, displaying a consistent pattern. This might indicate that the brain functional connectivity in these bands is relatively stable amid variations in music tempo, or that their role in brain processing of musical tempo is less pronounced compared to low-frequency bands. The illustration clearly indicates that slow tempo enhances the strength of low-frequency bands (Delta, Theta, Alpha) within the covariance network, and fast tempo diminishes their influence. This suggests that slower music might evoke processes related to these frequencies, such as relaxation and stability in cognitive processing. The decline in overall strength with increasing tempo may suggest that slower tempo can promote neural connectivity and synchronization. Additionally, the sensitivity of different frequency bands to changes in music tempo varies, which might relate to the mechanisms by which the brain processes musical tempo across different frequency ranges.
Finally, we analyzed the degree distribution of brain networks under three different music tempi to explore the impact of music tempo on brain network connectivity, as shown in (Fig. 12). These results reflect that with the increase in the tempo of music, the degree distribution of the brain network shifts towards higher values. This might reflect the brain’s adjustment to the connection pattern while processing fast-tempo music: a denser network with more frequent interactions between nodes to handle more complex tasks. These findings expose the dynamic adaptability of brain networks to varied musical tempo, suggesting that changes in the tempo of music can significantly alter the pattern of connectivity in the brain, thereby modulating cognitive and emotional processing.
Fig. 12.

The degree distribution of brain networks in the covariance analysis. Gray represents slow tempo (56 bpm), blue represents medium tempo (106 bpm), and pink represents fast tempo (156 bpm). As the music tempo increases, the degree distribution of the brain network gradually shifts to higher levels.
Phase locking value (PLV) analysis
In the investigation of the impact of music tempo on brain functional connectivity, phase locking value (PLV) was used to measure the synchronization of the phases of an EEG signal, which might give a more direct measure of temporal coordination between individuals in musical tasks46. The functional connectivity among five main brain regions under different musical tempi was investigated. A Detailed analysis of the heatmaps revealed that music tempo significantly influenced phase synchronization between brain regions, as shown in (Fig. 13) (see Supplementary Table S15–S17 for detailed ANOVA results).
Fig. 13.

The PLV between the five brain regions (frontal, Central, temporal, parietal, and occipital) and 59 channels under different music tempi. (a–c) correspond to the music tempo of 56, 106, and 156 bpm, respectively.
Under the low-tempo music condition, PLV values were generally lower, reflecting weaker phase synchronization between brain regions, with the most prominent negative synchronization observed between the frontal and occipital regions (PLV = 0.56, P < 0.01, Tukey test). Additionally, the central region exhibited varying degrees of synchronization with other brain areas, suggesting inconsistency in the involvement of brain regions related to autonomic and emotional processing under low-tempo music stimulation.
As the music tempo increased to 106 bpm, the synchronization between the occipital and frontal regions persisted. However, a significant synchronization between the central and temporal regions strengthened (PLV = 0.69, P < 0.01, Tukey test), indicating that medium-tempo music may enhance collaboration between sensory and cognitive processing areas.
With a further increase to 156 bpm, the temporal lobe exhibited a marked synchronization with other regions, particularly the frontal lobe (PLV = 0.76, P < 0.01, Tukey test). At the same time, the synchronization between the occipital and temporal regions also increased (PLV = 0.93). This shift in patterns suggests that high-tempo music may impose greater cognitive load on brain regions associated with auditory processing and emotional regulation, leading to altered connectivity between these regions.
Specifically, the frontal region displayed the highest PLV at 156 bpm, while the central and temporal regions had the highest values at 106 bpm. The parietal and occipital regions exhibited their peak PLV values at 156 bpm.
Discussion
This study investigates the effects of music tempo on emotional states and brain functional networks using emotion scales and electroencephalogram (EEG) analysis. The results from the emotion scales indicate that valence levels significantly increase with faster music tempo, while arousal levels demonstrate a “V” shape pattern, with medium-tempo music eliciting the lowest arousal levels. This suggests that fast tempo can evoke more positive emotional experiences, while medium tempo may promote a more tranquil emotional state.
In EEG analyses, discrete entropy and power spectral analysis show noticeable changes in brain signals across different frequency bands under various music tempi: slow tempo induces higher Theta and Alpha power in the frontal region, suggesting a relaxed state; As the increase of the music tempo, there is an increase in Beta and Gamma band power, reflecting higher neural activation levels. Furthermore, brain network analysis based on graph theory reveals the impact of music tempo on inter-regional brain connectivity characteristics, with node strength and clustering coefficients significantly increasing in the frontal and temporal regions under fast tempo, indicating enhanced connectivity and synchrony in these regions. Phase-locking value (PLV) analysis shows significant differences in phase synchrony between brain regions under different tempi: under slow-tempo conditions, the synchronization between the frontal and occipital regions is most pronounced. Under fast-tempo condition, the synchronization between the temporal region and other regions increases significantly, especially the frontal region. This is possibly related to increased demands for emotional and cognitive processing with fast tempo47,48.
In summary, the results suggest that changes in music tempo not only significantly modulate arousal levels but also affect how the brain processes emotions and cognition, as reflected in changes in neural activity across different frequency bands and alterations in inter-regional connectivity patterns.
The relationship between music tempo, emotional Valence, and arousal
Scale analysis shows that music tempo significantly affects emotional valence and arousal. In this study, the characteristics of fast tempo align with existing research findings, indicating that a faster tempo typically results in higher valence ratings and is considered more exciting, which may enhance positive emotional states49–51. However, an interesting phenomenon is that fast tempo induces the highest arousal levels, while medium tempo elicits the lowest arousal levels. There is less exploration in existing research regarding the emotional characteristics of medium and slow tempo. The weakest arousal intensity induced by medium tempo may be due to the fact that medium tempo (106 bpm) closely matches individuals’ breathing and heart rate rhythms. This physiological rhythm similarity somewhat enhances individuals’ adaptation to medium-tempo music, thereby inducing a lower arousal experience. The “Medium Tempo Attraction Theory” was proposed by Allan (1994) and Schab (1988) to explain the characteristics of human temporal perception in music. Their investigations found that the time interval of beats between 500ms and 700ms, equivalent to a tempo of 85 bpm to 120 bpm, is a time window where there is no perceptual bias in listeners and is also the music tempo range most suitable for human auditory experience52,53. The medium-tempo music selected in this study fits precisely into the most suitable music tempo described in the “Medium Tempo Attraction Theory”, which is why medium-tempo music exhibits lower arousal scores compared to fast and slow music.
Given the association between high tempo and more positive perceptions of valence and arousal, it might be a strong positive correlation between valence and arousal levels54. However, the relationship between valence and arousal is still debated. Some emotional theoretical models describe arousal and valence as orthogonal55. However, evidence suggests a “V” shape relationship56, which is consistent with the existence of low arousal, high valence (“happy” or “satisfied”) music and high arousal, low valence (“angry” or “anxious”) music, and also aligns with the conclusions of this study. Previous studies have primarily focused on the superficial effects of music tempo on emotional valence and arousal, often using subjective scales for assessment. However, our study goes beyond these methods by incorporating objective electroencephalogram (EEG) analysis to delve deeper into the brain functional networks underlying emotional state changes induced by music tempo, including discrete entropy, power spectral analysis, and graph theory analysis.
Changes in EEG intensity and breadth induced by music tempo
The impact of music tempo on the power spectrum
Power spectrum analysis reveals a significant association between brain activity across different frequency bands and the music tempo. In the frontal region, as the music tempo increases (e.g., transitioning from slow to fast), Beta band power shows a notable rise. Many studies have improved that beta band activity has a great relation to focused attention and cognitive processing. For example, Bigliassi et al. have stated that music increases Beta band activity so that emotional responses can be facilitated along with the level of arousal. This effect is evident with fast-tempo music and in tasks related to physical exertion57. The study of Schalles and Pineda also revealed that during the listening of familiar music sequences, Beta wave suppression decreased, while attention and cognitive reaction to these sequences increased. This is an indication of the critical nature of Beta waves in cognitive processing58. Moreover, Fujioka et al. showed Beta activity in the auditory and motor Cortical areas is vital for the processing of musical beats, especially in fast-tempo music, because it allows the brain to make rhythm predictions and synchronization59. Thus, the rise of Beta band power at a faster tempo in music may indicate the increase in cognitive activity, neural activity that parallels the rise in arousal.
Meanwhile, under the condition of fast tempo, the reduction in Alpha band power in the frontal region also suggests a change in brain state. The Alpha band is associated with relaxation, attention, working memory, and cognitive control60–62 and is related to the brain’s resting or sleep state. The decrease in Alpha band power with fast-tempo music physiologically supports that slow tempo is more likely to induce negative emotions and a calmer feeling. In contrast, fast music can evoke more positive emotions. These EEG findings align with behavior studies on tempo, explaining how music tempo influences individual neural activity.
In the temporal and occipital regions, changes in the average Delta and Theta band power across different music tempi may also be related to emotional changes. The delta band is connected to motor planning, cognitive control, and sensory processing63,64. Meanwhile, the Theta band is related to cognitive load, particularly episodic and working memory, as Theta event-related synchronization (ERS) increases with working memory load and persists during the retention period65,66. Under medium tempo, the highest delta band power is observed, suggesting that the slower tempo may facilitate deeper cognitive processing and motor control, potentially due to a more relaxed mental state. Conversely, as the tempo increases, the theta band power tends to decrease, which could reflect a shift in cognitive load or attentional demands. Faster tempo may reduce the need for sustained working memory involvement, allowing the brain to process music more rhythmically and instinctively, with less reliance on the episodic and working memory systems. These dynamics might indicate a complex interaction between tempo, cognitive load, and emotional responses, with changes in brainwave activity reflecting the varying demands of both processing and emotional engagement across different music tempos. Furthermore, this could suggest that tempo plays a key role in modulating both the cognitive and emotional aspects of music perception, with each frequency band responding differently to the temporal characteristics of the music.
The impact of music tempo on interregional brain connectivity
Through covariance (COV) analysis, we discovered significant differences in connectivity between brain channels under varying music tempo. Increasing music tempo leads to a rise in average connectivity strength in the frontal, occipital and temporal regions. This enhanced connectivity may indicate that the brain requires more inter-regional collaboration to process fast-tempo music, addressing higher cognitive and emotional demands, which aligns with heightened levels of arousal. However, fast-tempo music may cause desynchronization or a reallocation of functional connections in specific frequency bands or regions to support brain functionality under high cognitive load conditions. On the other hand, slow-tempo music typically reduces synchronization in the frontal, temporal, and occipital regions while enhancing low-frequency band activity, improving the integration capacity of these areas.
Current neuroscience research suggests that brain regions demonstrating notable synchronization during musical activities are primarily in the frontal, parietal, and temporal lobes. The clustering coefficient reflects the local connectivity or clustering degree of nodes within a brain network and serves as a crucial measure of local functional integration in the brain. Variations in the clustering coefficient across different brain regions under varying music tempo can indicate their different roles in music processing. The temporal lobe is fundamental for processing auditory information, language comprehension, and interaction67,68. Results indicate that the temporal region has the highest clustering coefficient in fast tempo, probably due to neurons becoming more integrated in this region for better processing of complex auditory information presented by fast tempo. One interesting phenomenon in this study is that the T7 channel has its nodal connectivity strength significantly decrease against the main trend with increased music tempo, which probably suggests that when processing fast tempo, the left temporal lobe engages different neural mechanisms. That is, compared to fast-tempo conditions, the reduced strength of connectivity in the left temporal lobe may suggest lesser involvement in processing as the tempo increases. Thaut et al. mentioned that the right superior temporal cortex is mainly responsible for the processing of musical tempo and functions separately from regions involved in processing rhythm or pattern47. This supports the results of this experiment, suggesting a dominant role of the right temporal lobe in tempo processing, while under fast tempo, the involvement of the left temporal lobe decreases. Additionally, Liu et al. found that slow-tempo music activated the left middle temporal gyrus (MTG) more strongly than fast-tempo music69, indicating that the left temporal lobe might be more inclined to process information related to rhythm or pattern under slower music conditions. This agrees with the result of this experiment, pointing out that the left temporal lobe may be more prone to the processing of information concerning rhythm or pattern under conditions of slower tempo. Whereas under a fast tempo of conditions, it shifts to other neural mechanisms or reduces the direct tempo processing. These findings together suggest that different music tempi may activate separate neural circuits in the temporal lobes, reflecting the division of labor and differences between the left and right temporal lobes in processing music tempo and patterns.
In particular, the highest clustering coefficient in medium-tempo music stimulation suggests that the parietal region might enable a more effective neural link within the parietal region. The lowest clustering coefficient for the occipital region with medium-tempo music stimulation means that the occipital region can integrate the internal flow of visual information and communicate more effectively with other parts of the brain while processing slow music.
Also, our findings indicate that FCz node strength increases significantly at higher tempo conditions (156 BPM). This result aligns with previous studies showing that the frontal-central region plays a crucial role in rhythm perception and auditory-motor coupling70. The heightened activity at faster tempos may reflect increased cognitive demands for rhythm tracking and predictive timing mechanisms.
There is a close relationship between the clustering coefficient and connectivity strength, reflecting the dynamic adaptability of the brain to different music tempi. Changes in average connectivity strength reflect changes in information transmission efficiency and intensity between different brain regions when music tempo is varied. The alteration in the clustering coefficient reflects changes in the closeness of the interneuronal links within brain regions. For example, under fast-tempo music, the average connectivity strength of the temporal region increases, and so does the clustering coefficient. This thus suggests that the temporal region not only exchanges information more frequently with other brain regions under fast-tempo stimulation but that internally its neuronal connections become tighter, cooperating in handling the high cognitive load induced by fast rhythms. On the other hand, under slow-tempo music, although the average connectivity strength in the occipital region is relatively low, the increased clustering coefficient indicates that the brain pays more attention to the integration and processing of internal information to adapt to a more relaxed tempo.
In a nutshell, the interplay between clustering coefficient and connectivity strength shows the dynamic variations in brain networks under different music tempi, hence casting a wider view on understanding how music affects the brain.
The impact of music tempo on interregional phase synchronization
PLV analysis reflects the level of phase synchronization between brain regions: the higher the PLV, the stronger the phase synchronization. In response to fast-tempo stimuli, PLV increases in frontal, occipital, and parietal regions, which reflects better synchronization between these regions. Such increased synchronization could reflect the adaptive response of the brain in the case of a high level of arousal and cognitive load connected with the fast tempo of music. The frontal lobe plays a primary role in regulating and expressing emotions, facilitating social interactions, and exercising executive control during musical activities71,72. Frontoparietal network topology can act as a neural marker of musical perceptual abilities, with a significant positive relationship between perceptual abilities and the efficiency of integration of key frontoparietal regions73. In this aspect, the dlPFC may play a critical role in cognitive control and attentional control in rapid music and hence support the coordinating role of the brain during improvisation74,75. This study found that fast-tempo music may enhance arousal levels by increasing cognitive control and attention, as manifested by the heightened synchronization between the frontal and parietal regions.
On the other hand, under the slow-tempo music conditions, PLV results show that the occipital and parietal region show higher synchronization with the frontal region. This indicates that the internal thought and emotional activity is kept stable within the brain during slow-tempo music. The study by Liu et al. indicated that different music tempi have a widespread effect on the various emotional states and connectivity patterns of the brain. Slow-tempo music could enhance functional connectivity of the default mode network (DMN) and the sensorimotor network (SMN), thereby increasing emotional stability48. This agrees with the high synchronization observed in the occipital-parietal regions under slow-tempo conditions in this experiment, which may indicate that slow-tempo music can enhance emotional stability and induce relaxation through low-frequency connection activation within the DMN.
In conclusion, PLV results indicate that different music tempi significantly regulate the synchronization of brain regions. Fast-tempo music enhances emotional and cognitive arousal through increased synchronization between the frontal and parietal regions, while slow-tempo music supports emotional stability and relaxation via synchronization between the parietal and occipital regions. These findings suggest that music tempo influences emotional and cognitive states by modulating synchronization across various brain regions, providing support for the brain functional networks through which music regulates emotion and cognition.
Future directions
Regarding material selection, this study used neutral music, which alters emotions purely through tempo changes without relying on the emotional content of the music itself. However, existing research indicates that fast speech often conveys tense and negative emotional experiences76–78. This characteristic can easily interfere with the perceived qualities of music tempo, making it challenging to discern whether positive effects are truly attributable to tempo or related to the emotional quality of the stimulus48,79. For future research, to eliminate the influence of the stimulus’s emotional valence on participants, it is necessary to independently analyze the two factors of music tempo and the stimulus’s emotional valence. This requires evaluating both congruent (fast-positive and slow-negative) and incongruent (slow-positive and fast-negative) stimuli12,80. Regarding material selection, this research utilized musical stimuli solely from the classical genre. Future studies could incorporate a more diverse range of music styles, such as pop, jazz, and electronic music, to examine how music tempo affects emotional processing across different music genres81,82.
Conclusion
This study investigated the effects of music tempo on emotional experiences and brain functional networks, with a focus on the relationship between different music tempi and brain activity. The results showed that fast music tempo is associated with higher arousal level, while medium tempo elicited the lowest arousal level. From the perspective of electroencephalogram (EEG) analysis, different music tempi significantly affected brain wave activity, particularly in the frontal, parietal, temporal, and occipital regions. Specifically, slow music activated higher Theta and Alpha power in the frontal region, reflecting a relaxed state. As the tempo increased, Beta and Gamma band power rose, indicating higher levels of neural activation. This frequency-specific neural activity suggests that different music tempi may evoke distinct cognitive and emotional responses, with fast tempo requiring higher attention and cognitive resource investment. COV network connectivity analysis showed that fast tempo enhanced the average connectivity strength in the frontal, temporal, and occipital regions, indicating that the brain’s adaptive response to fast-tempo music is manifested as stronger connectivity. PLV analysis further confirmed that fast tempo significantly increased phase synchronization between the frontal and parietal regions, providing physiological evidence for enhanced valence and arousal level, while slow tempo promoted synchronization between the occipital and parietal regions, suggesting its contribution to emotional stability and relaxation.
In conclusion, this study demonstrates that music tempo influences brain activity and emotional experiences through various brain functional networks. This finding offers new insights for fields such as music therapy and the treatment of emotional disorders, highlighting the practical potential of regulating music tempo to modulate emotions. Future research could introduce diverse music styles to further distinguish the impact of music tempo from the emotional valence of the music stimulus itself on emotional experience, thereby validating the generalizability of the findings and exploring their applicability across different cultural and musical contexts.
Electronic supplementary material
Below is the link to the electronic supplementary material.
Acknowledgements
This research work was funded by Innovation Capability Support Program of Shaanxi (Program No. 2024GH-GHJD-26), the “Scientist and Engineer” Team Construction Project of QinChuangYuan Platform (Grant 2022KXJ-129), the Science and Technology Plan Project of Xi’an (23ZDCYJSGG0005-2023) and Supported by the Fundamental Research Funds for the Central Universities (xzd012023015). We would like to thank all my collaborators for their selfless help and guidance in research.
Author contributions
Zengyao Yang: Conceptualization, Methodology and Validation, Writing—Review & Editing; Qiruo Su: Formal analysis, Data Curation, Writing—Original Draft; Jieren Xie: Software, Formal analysis, Data Curation; Hechong Su: Software, Formal analysis; Tianrun Huang: Writing—Original Draft; Chengcheng Han: Data Curation; Sicong Zhang: Project administration, Funding acquisition; Kai Zhang: Project administration, Funding acquisition; Guanghua Xu: Supervision, Project administration, Funding acquisition;
Funding
This research was funded by: (1) The “Scientist and Engineer” Team Construction Project of QinChuangYuan Platform, Shaanxi, under Grant 2022KXJ-129. (2) Innovation Capability Support Program of Shaanxi (Program No.2024GH-GHJD-26). (3) The Fundamental Research Funds for the Central Universities (xzd012023015). (4) The Science and Technology Plan Project of Xi’an (23ZDCYJSGG0005-2023).
Data availability
The raw data supporting the conclusions of this article will be made available by the authors, without under reservation, to any qualified researcher. For further information, please contact Dr. Xie at xjr_mirror@foxmail.com.
Competing interests
The authors declare no competing interests.
Ethics declarations
This study has been approved by the Biomedical Ethics Committee of Xi’an Jiaotong University (No. 2023−1552).
Approval for human experiments
Informed consent was obtained from all participants.
Footnotes
Publisher’s note
Springer Nature remains neutral with regard to jurisdictional claims in published maps and institutional affiliations.
Supplementary Information
The online version contains supplementary material available at 10.1038/s41598-025-92679-1.
References
- 1.Daly, I. Neural decoding of music from the EEG. Sci. Rep.13, 624 (2023). [DOI] [PMC free article] [PubMed] [Google Scholar]
- 2.Naser, D. S. & Saha, G. Influence of music liking on EEG based emotion recognition. Biomed. Signal. Process. Control64, 102251 (2021). [Google Scholar]
- 3.Koelsch, S. et al. The roles of superficial amygdala and auditory cortex in music-evoked fear and joy. NeuroImage81, 49–60 (2013). [DOI] [PubMed] [Google Scholar]
- 4.Salimpoor, V. N., Benovoy, M., Larcher, K., Dagher, A. & Zatorre, R. J. Anatomically distinct dopamine release during anticipation and experience of peak emotion to music. Nat. Neurosci.14, 257–262 (2011). [DOI] [PubMed] [Google Scholar]
- 5.Gagnon, L. & Peretz, I. Mode and tempo relative contributions to happy-sad judgements in equitone melodies. Cogn. Emot.17, 25–40 (2003). [DOI] [PubMed] [Google Scholar]
- 6.Khalfa, S., Schon, D., Anton, J. L. & Liégeois-Chauvel, C. Brain regions involved in the recognition of happiness and sadness in music: NeuroReport16, 1981–1984 (2005). [DOI] [PubMed]
- 7.Lehne, M., Rohrmeier, M. & Koelsch, S. Tension-related activity in the orbitofrontal cortex and amygdala: an fMRI study with music. Soc. Cogn. Affect. Neurosci.9, 1515–1523 (2014). [DOI] [PMC free article] [PubMed] [Google Scholar]
- 8.Cordoba-Silva, J. et al. Music therapy with adult burn patients in the intensive care unit: short-term analysis of electrophysiological signals during music-assisted relaxation. Sci. Rep.14, 23592 (2024). [DOI] [PMC free article] [PubMed] [Google Scholar]
- 9.Rossi, E., Marrosu, F. & Saba, L. Music therapy as a complementary treatment in patients with dementia associated to Alzheimer’s disease: A systematic review. J. Alzheimers Dis.98, 33–51 (2024). [DOI] [PubMed] [Google Scholar]
- 10.Spaccavento, S. et al. Musical and electrical stimulation as intervention in disorder of consciousness (DOC) patients: A randomised cross-over trial. PLoS One19, e0304642 (2024). [DOI] [PMC free article] [PubMed] [Google Scholar]
- 11.de Witte, M., Lindelauf, E., Moonen, X., Stams, G. J. & van Hooren Music therapy interventions for stress reduction in adults with mild intellectual disabilities: perspectives from clinical practice. Front. Psychol.11, 572549 (2020). [DOI] [PMC free article] [PubMed] [Google Scholar]
- 12.Fernández-Sotos, A., Fernández-Caballero, A. & Latorre, J. M. Influence of tempo and rhythmic unit in musical emotion regulation. Front. Comput. Neurosci.10, 80 (2016). [DOI] [PMC free article] [PubMed] [Google Scholar]
- 13.Droit-Volet, S., Ramos, D., Bueno, J. L. O. & Bigand, E. Music, emotion, and time perception: the influence of subjective emotional valence and arousal? Front. Psychol.4, (2013). [DOI] [PMC free article] [PubMed]
- 14.Mollakazemi, M. J. & Biswal, D. & Patwardhan, A. Target frequency band of cognition and tempo of music: cardiac synchronous EEG. in IEEE International Symposium on Signal Processing and Information Technology (ISSPIT) 696–700 10.1109/ISSPIT.2018.8642709 (2018).
- 15.Juslin, P. & Sloboda, J. Music and emotion: Theory and research. 10.1093/oso/9780192631886.001.0001 (2023).
- 16.Vieillard, S., Didierjean, A. & Maquestiaux, F. Changes in the perception and the psychological structure of musical emotions with advancing age. Exp. Aging Res.38, 422–441 (2012). [DOI] [PubMed] [Google Scholar]
- 17.Trochidis, K. & Bigand, E. Investigation of the effect of mode and tempo on emotional responses to music using EEG power asymmetry. J. Psychophysiol.27, 142–148 (2013). [Google Scholar]
- 18.Morreale, F., Masu, R., De Angeli, A. & Fava, P. The effect of expertise in evaluating emotions in music. (2013).
- 19.Mofredj, A., Alaya, S., Tassaioust, K., Bahloul, H. & Mrabet, A. Music therapy, a review of the potential therapeutic benefits for the critically ill. J. Crit. Care35, 195–199 (2016). [DOI] [PubMed] [Google Scholar]
- 20.Nizamie, S. & Tikka, S. Psychiatry and music. Indian J. Psychiatr.56, 128–140 (2014). [DOI] [PMC free article] [PubMed] [Google Scholar]
- 21.Solanki, M. S., Zafar, M. & Rastogi, R. Music as a therapy: role in psychiatry. This Issue Incl. Spec. Sect. Classif. Psychoses6, 193–199 (2013). [DOI] [PubMed] [Google Scholar]
- 22.Hetland, B., Lindquist, R. & Chlan, L. L. The influence of music during mechanical ventilation and weaning from mechanical ventilation: A review. Heart Lung44, 416–425 (2015). [DOI] [PMC free article] [PubMed] [Google Scholar]
- 23.Krabs, R. U., Enk, R., Teich, N. & Koelsch, S. Autonomic effects of music in health and Crohn’s disease: the impact of isochronicity, emotional Valence, and tempo. PLoS One. 10, e0126224 (2015). [DOI] [PMC free article] [PubMed] [Google Scholar]
- 24.Koelsch, S. Brain correlates of music-evoked emotions. Nat. Rev. Neurosci.15, 170–180 (2014). [DOI] [PubMed] [Google Scholar]
- 25.Brannan, S. et al. Neuroimaging of cerebral activations and deactivations associated with hypercapnia and hunger for air. Proc. Natl. Acad. Sci.98, 2029–2034 (2001). [DOI] [PMC free article] [PubMed] [Google Scholar]
- 26.LeDoux, J. The emotional brain, fear, and the amygdala. Cell. Mol. Neurobiol.23, 727–738 (2003). [DOI] [PMC free article] [PubMed] [Google Scholar]
- 27.Phan, K. L., Wager, T. D., Taylor, S. F. & Liberzon, I. Functional neuroanatomy of emotion: A meta-analysis of emotion activation studies in PET and fMRI. NeuroImage16, 331–348 (2002). [DOI] [PubMed]
- 28.Rivera-Tello, S., Romo-Vázquez, R., González-Garrido, A. A. & Ramos-Loyo, J. Musical tempo affects EEG spectral dynamics during subsequent time Estimation. Biol. Psychol.178, 108517 (2023). [DOI] [PubMed] [Google Scholar]
- 29.Mehrabian, A. Pleasure-arousal-dominance: A general framework for describing and measuring individual differences in temperament. Curr. Psychol.14, 261–292 (1996). [Google Scholar]
- 30.Mehrabian, A. Framework for a comprehensive description and measurement of emotional States. Genet. Soc. Gen. Psychol. Monogr.121, 339–361 (1995). [PubMed] [Google Scholar]
- 31.Cohen, M. X. Analyzing neural time series data: theory and practice. 10.7551/mitpress/9609.001.0001 (The MIT Press, 2014). [Google Scholar]
- 32.Barabási, A. L. & Albert, R. Emergence of scaling in random networks. Science286, 509–512 (1999). [DOI] [PubMed] [Google Scholar]
- 33.The Power Spectrum. Statistical Methods for Climate Scientists. 126–155 (eds Tippett, M. & DelSole, T.) 10.1017/9781108659055.007 (Cambridge University Press, 2022).
- 34.Shannon, C. E. A mathematical theory of communication. [PubMed]
- 35.Rostaghi, M. Azami. Dispersion entropy: A measure for time-series analysis. IEEE Signal. Process. Lett.23, 610–614 (2016). [Google Scholar]
- 36.Barrat, A., Barthélemy, M., Pastor-Satorras, R. & Vespignani, A. The architecture of complex weighted networks. Proc. Natl. Acad. Sci.101, 3747–3752 (2004). [DOI] [PMC free article] [PubMed] [Google Scholar]
- 37.D, I. Graph theory at the service of electroencephalograms. Brain Connect.10.1089/brain.2016.0426 (2017). [DOI] [PubMed] [Google Scholar]
- 38.Rubinov, M. & Sporns, O. Complex network measures of brain connectivity: uses and interpretations. NeuroImage52, 1059–1069 (2010). [DOI] [PubMed] [Google Scholar]
- 39.Kaiser, M. A tutorial in connectome analysis: topological and Spatial features of brain networks. NeuroImage57, 892–907 (2011). [DOI] [PubMed] [Google Scholar]
- 40.Watts, D. J. & Strogatz, S. H. Collective dynamics of ‘small-world’ networks. Nature393, 440–442 (1998). [DOI] [PubMed] [Google Scholar]
- 41.Liu, J. et al. Complex brain network analysis and its applications to brain disorders: A survey. Complexity 8362741 (2017).
- 42.Kayhan, E. et al. DEEP: A dual EEG pipeline for developmental hyperscanning studies. Dev. Cogn. Neurosci.54, 101104 (2022). [DOI] [PMC free article] [PubMed] [Google Scholar]
- 43.Network of phase-locking oscillators. and a possible model for neural synchronization—ScienceDirect. https://www.sciencedirect.com/science/article/pii/S1007570411000025
- 44.Wang, Z. M., Chen, Z. Y. & Zhang, J. EEG emotion recognition based on PLV-rich-club dynamic brain function network. Appl. Intell.53, 17327–17345 (2023). [Google Scholar]
- 45.Lei, X. & Liao, K. Understanding the influences of EEG reference: A large-scale brain network perspective. Front. Neurosci.11, (2017). [DOI] [PMC free article] [PubMed]
- 46.Cheng, S., Wang, J., Luo, R. & Hao, N. Brain to brain musical interaction: A systematic review of neural synchrony in musical activities. Neurosci. Biobehav. Rev.164, 105812 (2024). [DOI] [PubMed] [Google Scholar]
- 47.Thaut, M. H., Trimarchi, P. D. & Parsons, L. M. Human brain basis of musical rhythm perception: common and distinct neural substrates for meter, tempo, and pattern. Brain Sci.4, 428–452 (2014). [DOI] [PMC free article] [PubMed] [Google Scholar]
- 48.Liu, Y., Lian, W., Zhao, X., Tang, Q. & Liu, G. Spatial connectivity and Temporal dynamic functional network connectivity of musical emotions evoked by dynamically changing tempo. Front. Neurosci.15, (2021). [DOI] [PMC free article] [PubMed]
- 49.Gomez, P. & Danuser, B. Affective and physiological responses to environmental noises and music. Int. J. Psychophysiol. Off J. Int. Organ. Psychophysiol.53, 91–103 (2004). [DOI] [PubMed] [Google Scholar]
- 50.Juslin, P. N. Cue utilization in communication of emotion in music performance: relating performance to perception. J. Exp. Psychol. Hum. Percept. Perform.26, 1797–1812 (2000). [DOI] [PubMed] [Google Scholar]
- 51.Liu, Y. et al. Effects of musical tempo on musicians’ and non-musicians’ emotional experience when listening to music. Front. Psychol.9, 2118 (2018). [DOI] [PMC free article] [PubMed] [Google Scholar]
- 52.Allan, L. G. & Gibbon, J. A new temporal illusion or the TOE once again? Percept. Psychophys.55, 227–229 (1994). [DOI] [PubMed] [Google Scholar]
- 53.Schab, F. R. & Crowder, R. G. The role of succession in temporal cognition: is the time-order error a recency effect of memory? Percept. Psychophys.44, 233–242 (1988). [DOI] [PubMed] [Google Scholar]
- 54.Bradley, M. M. & Lang, P. J. Affective reactions to acoustic stimuli. Psychophysiology37, 204–215 (2000). [PubMed] [Google Scholar]
- 55.Posner, J., Russell, J. A. & Peterson, B. S. The circumplex model of affect: an integrative approach to affective neuroscience, cognitive development, and psychopathology. Dev. Psychopathol.17, 715–734 (2005). [DOI] [PMC free article] [PubMed] [Google Scholar]
- 56.Yik, M. et al. On the relationship between Valence and arousal in samples across the Globe. Emotion23, 332–344 (2023). [DOI] [PubMed] [Google Scholar]
- 57.Bigliassi, M., Karageorghis, C. I., Hoy, G. K. & Layne, G. S. The way you make me feel: psychological and cerebral responses to music during real-life physical activity. Psychol. Sport Exerc.41, 211–217 (2019). [Google Scholar]
- 58.Schalles, M. D. & Pineda, J. Musical sequence learning and EEG correlates of audiomotor processing. Behav. Neurol. (2015). [DOI] [PMC free article] [PubMed]
- 59.Fujioka, T., Ross, B. & Trainor, L. Beta-band oscillations represent auditory beat and its metrical hierarchy in perception and imagery. J. Neurosci.35, 15187–15198 (2015). [DOI] [PMC free article] [PubMed] [Google Scholar]
- 60.Henz, D. & Schöllhorn, W. I. EEG brain activity in dynamic health qigong training: same effects for mental practice and physical training? Front. Psychol.8, (2017). [DOI] [PMC free article] [PubMed]
- 61.Klimesch, W. Alpha-band oscillations, attention, and controlled access to stored information. Trends Cogn. Sci.16, 606–617 (2012). [DOI] [PMC free article] [PubMed] [Google Scholar]
- 62.Palva, S. & Palva, J. M. New vistas for α-frequency band oscillations. Trends Neurosci.30, 150–158 (2007). [DOI] [PubMed] [Google Scholar]
- 63.Riddle, J., McFerren, A. & Frohlich, F. Causal role of cross-frequency coupling in distinct components of cognitive control. Prog Neurobiol.202, 102033 (2021). [DOI] [PMC free article] [PubMed] [Google Scholar]
- 64.Morillon, B., Arnal, L. H., Schroeder, C. E. & Keitel, A. Prominence of delta oscillatory rhythms in the motor cortex and their relevance for auditory and speech perception. Neurosci. Biobehav Rev.107, 136–142 (2019). [DOI] [PubMed] [Google Scholar]
- 65.Burgess, A. P. & Gruzelier, J. H. Short duration power changes in the EEG during recognition memory for words and faces. Psychophysiology37, 596–606 (2000). [PubMed] [Google Scholar]
- 66.Krause, C. M. et al. The effects of memory load on event-related EEG desynchronization and synchronization. Clin. Neurophysiol. Off J. Int. Fed. Clin. Neurophysiol.111, 2071–2078 (2000). [DOI] [PubMed] [Google Scholar]
- 67.Friederici, A. D. Towards a neural basis of auditory sentence processing. Trends Cogn. Sci.6, 78–84 (2002). [DOI] [PubMed] [Google Scholar]
- 68.Zatorre, R. J. & Belin, P. Spectral and Temporal processing in human auditory cortex. Cereb. Cortex11, 946–953 (2001). [DOI] [PubMed] [Google Scholar]
- 69.Liu, Y., Zhao, X., Tang, Q., Li, W. & Liu, G. Dynamic functional network connectivity associated with musical emotions evoked by different tempi. Brain Connect.12, 584–597 (2022). [DOI] [PubMed] [Google Scholar]
- 70.When the brain. Plays music: auditory–motor interactions in music perception and production. Nat. Rev. Neurosci.https://www.nature.com/articles/nrn2152 [DOI] [PubMed]
- 71.Green, A. C. et al. Music in minor activates limbic structures: a relationship with dissonance? NeuroReport 19, (2008). [DOI] [PubMed]
- 72.Zatorre, R. J., Chen, J. L. & Penhune, V. B. When the brain plays music: auditory–motor interactions in music perception and production. Nat. Rev. Neurosci.8, 547–558 (2007). [DOI] [PubMed] [Google Scholar]
- 73.Lumaca, M. et al. Frontoparietal network topology as a neural marker of musical perceptual abilities. Nat. Commun.15, 8160 (2024). [DOI] [PMC free article] [PubMed] [Google Scholar]
- 74.Abiru, M., Sakai, H., Sawada, Y. & Yamane, H. The effect of the challenging two handed rhythm tapping task to DLPFC activation. Asian J. Occup. Ther.12, 75–83 (2016). [Google Scholar]
- 75.Tachibana, A., Noah, J. A., Ono, Y., Taguchi, D. & Ueda, S. Prefrontal activation related to spontaneous creativity with rock music improvisation: A functional near-infrared spectroscopy study. Sci. Rep.9, 16044 (2019). [DOI] [PMC free article] [PubMed] [Google Scholar]
- 76.M, K. M., Begum, N., Priya, N. & Motkur, R. S, N. Emotion analysis using speech. Int. Res. J. Adv. Sci. Hub. (2023).
- 77.Bertels, J. & Kolinsky, R. Disentangling fast and slow attentional influences of negative and taboo spoken words in the emotional Stroop paradigm. Cogn. Emot.30, 1137–1148 (2016). [DOI] [PubMed] [Google Scholar]
- 78.Ilie, G. & Thompson, W. F. A comparison of acoustic cues in music and speech for three dimensions of affect. Music Percept.23, 319–330 (2006). [Google Scholar]
- 79.Meng, Q., Jiang, J., Liu, F. & Xu, X. Effects of the musical sound environment on communicating emotion. Int. J. Environ. Res. Public. Health17, (2020). [DOI] [PMC free article] [PubMed]
- 80.Grimaud, A. M. & Eerola, T. An interactive approach to emotional expression through musical cues. Music Sci. (2022).
- 81.Nolt, A. & Elwonger, J. Emotional and psychological effect of music on people. J. Emerg. Investig. (2019).
- 82.Tay, R. Y. L. & Ng, B. C. Effects of affective priming through music on the use of emotion words. PLoS One14, (2019). [DOI] [PMC free article] [PubMed]
Associated Data
This section collects any data citations, data availability statements, or supplementary materials included in this article.
Supplementary Materials
Data Availability Statement
The raw data supporting the conclusions of this article will be made available by the authors, without under reservation, to any qualified researcher. For further information, please contact Dr. Xie at xjr_mirror@foxmail.com.