

Abstract
Insulin receptor substrate 1 and 2 (IRS1/2) have been found involved in many cancers development and their inhibitors exert significant tumor‐suppressive effects. Here, we tried to explore the function of NT157, an IGF1R‐IRS1/2 inhibitor, in ovarian cancer. We treated ovarian cancer cells with varying doses of NT157. The MTT assay was employed to evaluate cell proliferation and colony formation assay was used for detecting colony‐forming ability. TUNEL assay was adopted to test cell apoptosis. Cell invasion was checked by the Transwell assay. The expression of apoptosis‐related proteins, autophagy markers, IRS1/2, and PI3K/AKT/mTOR pathway was compared by Western blot, immunofluorescence, or qRT‐PCR. As indicated by the data, NT157 abated the viability, proliferation, and induced autophagy of ovarian cancer cells. Overexpressing IRS1/2 attenuated the tumor‐suppressive effect of NT157 and heightened the PI3K/AKT/mTOR pathway activation. Inhibition of the PI3K/AKT/mTOR pathway enhanced the tumor‐suppressive effect of NT157 and facilitated NT157‐mediated autophagy. However, the autophagy inhibitor 3‐MA partly reversed NT‐157‐mediated antitumor effects. In conclusion, this study disclosed that NT157 suppressed the malignant phenotypes of ovarian cancer cells by inducing autophagy and hampering the expression of IRS1/2 and PI3K/AKT/mTOR pathway.
Keywords: autophagy, IRS1/2, NT157, ovarian cancer
1. INTRODUCTION
Ovarian cancer ranks as the most fatal gynecologic malignancy, a disease with only 50% 5‐year survival. Poorer survival of ovarian cancer patients is often found clinically due to failed early diagnosis and a high rate of recurrence. 1 Some studies have demonstrated that peritoneal effusion/ascites, as a marker of ovarian cancer, can facilitate tumor cell metastasis and drug resistance to accelerate tumor progression. 2 According to statistics, the 5‐year survival rate of ovarian cancer patients diagnosed at an early stage is higher than 90%, while that of the patients diagnosed at a late stage is less than 20%. 3 However, the overall survival rate of ovarian cancer remains miserable due to the absence of effective screening tools and inconspicuous early symptoms. 4 Therefore, it is crucial to explore new treatments for ovarian cancer.
Insulin receptor substrate 1/2 (IRS1/2) is the main substrate of insulin receptor tyrosine kinase, which is involved in modulating many diseases, including tumor. 5 For example, overexpression of miRNA‐7 represses the expression of IRS‐1 and IRS‐2, thereby restraining glioblastoma cell proliferation and facilitating their apoptosis and sensitivity to erlotinib, 6 which suggests that IRS‐1 and IRS‐2 may act as oncogenes in glioblastoma. Besides, Sun et al. have found that IRS‐1 is down‐regulated in nasopharyngeal carcinoma (NPC), and a high level of IRS‐1 expression in serum improves the sensitivity and accuracy of NPC diagnosis. 7 In addition, low IRS‐1 expression and high IRS‐2 expression were found to be associated with poor prognosis in lung adenocarcinoma and squamous cell carcinoma, implying that IRS‐1/2 serves as a potential target in the treatment of non‐small cell lung cancer (NSCLC). 8 Notably, some scholars have claimed that the up‐regulation of distal‐less homeobox gene 5 heightens ovarian cancer cell proliferation by facilitating the IRS‐2‐AKT signaling. 9 Moreover, the study by Ravikumar et al. uncovered that IRS‐1 is up‐regulated in most malignant epithelial ovarian tumors, and all‐trans retinoic acid chokes ovarian cancer cell growth by down‐regulating IRS‐1. 10 These data indicate that IRS1 and IRS2 are essential links affecting the progression of ovarian cancer.
Emerging studies have confirmed that NT157 impedes the malignant behaviors of a variety of cancer cells. For instance, Flashner‐Abramson et al. discovered that NT157 exerts anti‐tumor effects in human melanoma cells (A375) and metastatic melanoma models in mice by targeting and blocking the Stat3 and IGF1R signaling. 11 NT157 is a small molecule tyrosine phosphorylation inhibitor that attenuates the expression of IRS proteins. 12 NT157 hampers the proliferation of JAK2 V617F cells and induces apoptosis and cell cycle arrest by blocking the IRS1/2 and JAK2/STAT pathways. 13 Additionally, NT157 shows anticancer activity in castrate‐resistant prostate cancer (CRPC) cells, and it suppresses CRPC progression both in LNCaP (androgen‐responsive) xenograft and PC3 (androgen‐independent) xenograft in vivo. 12 These studies have demonstrated the anti‐tumor effect of NT157, but the effect of NT157 on ovarian cancer cells has not been evaluated.
Autophagy is a biological behavior of eukaryotic cells, and its lysosomal degradation pathway contributes to maintaining cell survival. 14 , 15 As a conserved self‐degradation system, autophagy disorder is related to disease occurrence and development. In cancer, autophagy has a dichotomous role by hindering tumorigenesis and expediting tumor progression. 16 miR‐29c‐3p cisplatin resistance of ovarian cancer by impeding autophagy and repressing the expression of FOXP1/ATG14, 17 which suggests that autophagy is involved in ovarian cancer cell growth. It has been found that the level of autophagy in ovarian cancer cells is associated with the regulation of cellular metabolism by the tumor microenvironment. The early onset of OC is implicated in insufficient autophagy, the activation of which protects against cellular damage caused by chemotherapy and radiotherapy in tumors. 18 Nevertheless, the effect and mechanism of NT157 on autophagy in ovarian cancer cells remain elusive.
Overall, this study aims to investigate the functions of NT157 in ovarian cancer, with a view to providing a reliable basis for clinical research and treatment of ovarian cancer. Our results demonstrated that NT157 represses ovarian cancer cell growth, enhances autophagy, and restrains the PI3K/AKT/mTOR pathway.
2. MATERIALS AND METHODS
2.1. Cell culture
Two human‐derived ovarian cancer cell lines OVCAR3 and OVCA433 were provided by the Shanghai Type Culture Collection of the Chinese Academy of Sciences. The above cells were inoculated into the complete RPMI1640 medium (containing 10% bovine serum [FBS, Thermo Scientific Hyclone, UT]) at a density of 5 × 10⁵ cells/mL in 60‐mm culture dishes (each dish contained 4 ml complete medium). The cells were maintained at 37°C with 5% CO2 and completely saturated humidity for routine culture, and the medium was altered every 2–3 days. OVCAR3 and OVCA433 cells were dealt with different concentrations of NT157 (0.1, 0.2, 0.4, 0.8, 1.6, and 3.2 μM) (Selleck, Houston, TX) diluted in dimethyl sulfoxide (DMSO) for 24 h to investigate the effect of NT157. Then, Hederacolchiside A1 (Hcol A1) (10 μM, Cat. No. HY‐N6950) or autophagy inhibitor 3‐methyladenine (3‐MA) (5 mM, Cat. No. HY‐19312) provided by Medchemexpress (NJ) was applied to the cells.
2.2. Cell transfection
The negative control pcDNA vector (NC) and IRS1/2 overexpression plasmids pcDNA‐IRS1/2 (IRS1/2) were purchased from GenePharma (Shanghai, China). OVCAR3 and OVCA433 cells were seeded in 24‐well plates with 3 × 10⁵ cells/well (each well contained 1 ml complete medium). After conventional culture for 24 h, the cells were transfected with NC or pcDNA‐IRS1/2 suspended by the transfection reagent Lipofectamine™ 3000 (Thermo Fisher Scientific, Shanghai, China) at a concentration of 50 nM. After a 24‐h incubation, the primary medium was exchanged with a new complete medium. qRT‐PCR was performed to detect the IRS1/2 level for testing the transfection efficiency.
2.3. qRT‐PCR
The primers were designed according to the human IRS1 and IRS2 mRNA sequences in GeneBank using the Primer 3.0 software and synthesized by Shanghai Sangon Biotech Co., Ltd. Total cellular RNA in the cells was extracted by TRIzol (Invitrogen). Detecting the purity and concentration of the extracted total RNA was achieved by a UV spectrophotometer (NanoDrop 2000, Thermo). RevertAid First Strand cDNA Synthesis Kit (Thermo) was utilized for reverse transcription for the synthesis of cDNA of total RNA. Using this strand as a template, the IRS1 and IRS2 DNA fragments were amplified with the use of an ABI 7300 fluorescent quantitative PCR instrument. The internal reference gene was GAPDH. The 2−∆∆CT method was used for evaluating the relative level of aimed genes. 19 The primer sequences for the genes are as follows: IRS1, CGTTTGTCCACAGCTTTCCA (Forward), ACTATATGCCCATGAGCCCC (Reverse); IRS2, AGGTACCTGCACTGGAATCC (Forward), AGAGTGCACCCGTACCTATG (Reverse); ATG5, TTCTCAAAATATACTGTTTC (Forward), TATTATGTATCACAAATGG (Reverse); ATG7, TGGGAGAAGAACCAGAAAGG (Forward), CAGGCACTTGACAGACACGA (Reverse), and BECLIN1, CAGGAACTCACAGCTCCATT (Forward), CATCAGATGCCTCCCCAATC (Reverse); GAPDH, TGGTTGAGCACAGGGTACTT (Forward), CCAAGGAGTAAGACCCCTG (Reverse). The above steps were repeated three times. Each time has three independent repeats at least and the average value was taken.
2.4. Cell proliferation detection
OVCAR3 and OVCA433 cells were collected and seeded into 96‐well plates (5 × 10³ cells per well, each well had 0.1 ml medium), and the plates were put in an incubator for 24 h. After different time points of NT157 treatment at the 24th, 48th, and 72nd h, 20 μl MTT (5 g/L, Beyotime Biotechnology, Shanghai, China) was added into each well, and the cells were kept in the incubator for 4 h. Then 150 μl DMSO was added into each well after the culture medium was removed. The plates were successively shaken for 10 min, then the absorbance (450 nm) was measured with a microplate reader (TECAN, Switzerland). The above steps were repeated three times. Each time has three independent repeats at least and the average value was taken.
2.5. Colony formation assay
OVCAR3 and OVCA433 cells treated with different factors were inoculated in 30‐mm culture dishes containing a complete culture medium (2.5 ml) with 800 cells per dish. The culture medium was exchanged every 3 days. After 2 weeks of culture, the medium was removed, and the cells were carefully rinsed twice with PBS. The cells were fixed with 4% paraformaldehyde for 10 min. After 2.5% crystal violet staining, the number of colonies (over 50 cells each cell colony) was observed and counted by the naked eye. The above steps were repeated three times. Each time has three independent repeats at least and the average value was taken.
2.6. Cell apoptosis detection using TUNEL assay
Cell apoptosis was verified by the TUNEL staining kit (Beyotime Biotechnology, Shanghai, China). OVCAR3 and OVCA433 cells seeded in 96‐well plates (3 × 10³ cells per well) were treated with NT157. The medium was removed, and the cells were rinsed twice with PBS, fixed with 4% paraformaldehyde for 15 min, and permeabilized in 0.25% Triton‐X 100 (Thermo Fisher, MA) for 20 min. 50 μl TUNEL solution for each well was added. After incubating for 60 min at 37°C in the dark, PBS was taken for washing the cells. The nuclei were stained with DAPI, followed by three more washes in PBS. The slides were sealed with anti‐fluorescence quenching blocking solution, examined, and photographed using a Leica (DM2500) fluorescence microscope.
2.7. Western blot (WB)
OVCAR3 and OVCA433 cells were seeded in 6‐well plates at 2 × 10⁶ cells/well (each well contained 2 ml culture medium). RIPA lysis buffer (200 μl/well) (Beyotime Biotechnology, Shanghai, China) was added to cells. After lysing on the ice for 30 min, the lysates were collected and centrifugated at 7500g for 15 min at 4°C. Then the supernatant was collected, and the protein content was measured with the BCA Protein Assay Kit (ab102536, Abcam, MA). The same amount of total protein (50 μg) was added to each line and separated by electrophoresis using 12.5% SDS‐polyacrylamide gels. Afterward, the protein was transferred to the PVDF membranes (Millipore, Bedford, MA), which were blocked with 5% skim milk at RT for 1 h. Next, the primary antibodies of Caspase‐8 (1:1000, ab32397), Caspase‐9 (1:2000, ab202068), Mcl1 (1:2000, ab32087), BCL‐XL (1:1000, ab32370), LC3B (1:2000, ab192890), SQSTM1/p62 (1: 1000, ab207305), IRS1 (phospho Y632) (1:1000, ab138456), IRS1 (1:2000, ab40777), IRS2 (phospho‐Ser731) antibody (1:500, orb501796), IRS2 (1:2000, ab134101), PI3K p85 alpha (phospho Y607) (1:1000, ab182651), PI3K (1:1000, ab191606), AKT (phospho T308) (1:1000, ab38449), AKT(1:1000, ab8805), phosphorylated‐mTOR (1:2000, ab109268), mTOR (1:2000, ab32028), and β‐actin (1:2000, ab8227) were added and incubated overnight at 4°C. After TBST washing, the HRP‐labeled goat anti‐rabbit IgG (1:2500) was added and incubated for 1 h at RT. The images were developed with an ECL kit (Amersham Pharmacia Biotech, Little Chalfont, UK) and saved. The ImageJ software (v1.8.0, National Institutes of Health, Bethesda, MD) was utilized to analyze the gray intensity. All tests were repeated three times, with β‐actin as an internal reference. The p‐IRS2 antibody was provided by Biorbyt (Cambridge, UK). Other antibodies were provided by Abcam (MA).
2.8. Transwell assay
Transwell assay was used for evaluating the invasive abilities of ovarian cells. Matrigel (BD, San Jose) was diluted 4:1 with the DMEM medium, and the transwell chamber (8 μm, Corning, NY) was coated by 60 μl of the Matrigel medium overnight. After treatment with NT157 for 24 h, OVCAR3 and OVCA433 cells were collected and added to the upper chamber of the Transwell at 2 × 10⁴ cells/well. In contrast, 600 μl medium with 20% FBS was added to the lower chamber and incubated at 37°C. Twelve hours later, the upper cells in the chambers were removed using a cotton swab. The cells at the lower chamber were fixed with 4% paraformaldehyde (PFA) for 15 min at room temperature. Then the cells were stained with 0.1% crystal violet for 10 min. Followed by water washing and drying, the mitigated cells were photographed and counted.
2.9. Cellular immunofluorescence
The OVCAR3 and OVCA433 cells treated with different factors were taken for cell growth on the glass slides (14 mm in diameter, Corning, NY), which were then cleaned with PBS three times (3 min/time) in the 24‐well plates (Corning, NY) with 1 ml culture medium. Cells were fixed with 4% PFA for 15 min, soaked with PBS three times (3 min each time), and permeabilized with 0.5% Triton X‐100 (Thermo Fisher Scientific, Shanghai, China) prepared with PBS for 20 min at RT. Next, they were flushed with PBS three times (3 min each time), and PBS was dried with absorbent paper. Normal goat serum was added to the slides and blocked at RT for 30 min, and then the blocking solution was absorbed. Subsequently, the primary LC3B antibody (1:200, ab192890) and Anti‐alpha Tubulin antibody (ab7291) were added dropwise to each slide and maintained in a wet box overnight at 4°C. The next morning, the slides were soaked and washed by PBST 3 times (3 min/time). After the excess liquid was absorbed, the fluorescent secondary antibodies [including Goat Anti‐Rabbit IgG H&L (Alexa Fluor® 488) (ab150077) and Goat Anti‐Mouse IgG H&L (Alexa Fluor® 594) preadsorbed (ab150120)] were added and incubated in a wet box at RT for 1 h. After soaking with PBST three times (5 min/time), DAPI was used for staining the nuclei. After that, the excess staining solution was rinsed off with PBST, and the slides were mounted with the anti‐fade mounting medium. The photograph was taken under a fluorescence microscope.
2.10. Transmission electron microscope (TEM)
Followed by NT157 treatment, OVCAR3, and OVCA433 cells were harvested and fixed with Glutaraldehyde (2.5%, Electron microscope Grade) (Solarbio, Beijing, China) for 1 h at 4°C. Next, 1% osmium tetroxide was used for fixing the cells in the EM fixation buffer for 1 h at 25°C. Then the cells received dehydration by a graded series of ethanol and were embedded in Epon. Ultrathin sections were stained with 2% uranyl acetate and lead citrate. A HITACHI, H‐7500 Transmission Electron Microscope (HITACHI, H‐7500, Japan) was used for performing TEM analysis.
2.11. Statistical analysis
GraphPad Prism 8 (GraphPad Software, USA) was used for data analysis. The measurement data were expressed as mean ± standard deviation (x ± s). The unpaired t‐test was applied for comparing the difference of data from two groups, and a one‐way analysis of variance was used for the comparison of multiple groups followed by post hoc Tukey analysis. p < 0.05 represented statistical significance.
3. RESULTS
3.1. NT157 repressed ovarian cancer cell growth in vitro
OVCAR3 and OVCA433 cells were treated with varying concentrations of NT157. As shown in Figure 1A, NT157 at a concentration of 1.6 and 3.2 μM significantly attenuated the survival of OVCAR3 and OVCA433 cells, exhibiting significant cytotoxic effects. Therefore, we chose NT157 at concentrations of 0.4 and 0.8 μM for cell experiments. MTT assay results illustrated that NT157 (0.4 and 0.8 μM) notably abated the proliferation of OVCAR3 and OVCA433 cells (Figure 1B). The colony formation assay outcomes demonstrated that NT157 (0.4 and 0.8 μM) significantly reduced the colony number of OVCAR3 and OVCA433 cells (Figure 1C). TUNEL was implemented to examine apoptosis. As a result, compared with the control group, NT157 (0.4 and 0.8 μM) significantly heightened the apoptotic level of OVCAR3 and OVCA433 cells, and the effect was more pronounced as the concentrations increased (Figure 1D,E). WB was implemented to further test the profiles of apoptosis‐related proteins. The results revealed that NT157 (0.4 and 0.8 μM) elevated the expression of cleaved Caspase‐8 and cleaved Caspase‐9, whereas reduced the expression of anti‐apoptotic proteins (Mcl1 and BCL‐XL) in OVCAR3 and OVCA433 cells versus the control group (Figure 1F,G). Transwell assay results illustrated that cell invasion (Figure 1H) was significantly decreased after treatment with NT157 (0.1 and 0.2 μM) versus the control group. These results suggested that NT157 impeded the proliferation and invasion of OVCAR3 and OVCA433 cells and induced cell apoptosis in vitro.
FIGURE 1.

NT157 attenuated ovarian cancer cell growth in vitro. Different concentrations of NT157 (0.1 0, 0.2, 0.4, 0.8, 1.6, 3.2 μM) were adopted to treat OVCAR3 and OVCA433 cells for 24 h, respectively. (A,B). MTT assay was employed to test the cell proliferation. (C) The colony‐forming ability of OVCAR3 and OVCA433 cells was examined. (D,E) Cell apoptosis was monitored by TUNEL. (F,G) WB was performed to verify the alteration of proteins, including cleaved Caspase‐8, cleaved Caspase‐9, MCL1, and BCL‐XL. (H) OVCAR3 and OVCA433 cells were dealt with 0.1 or 0.2 μM NT157. Transwell assay was implemented to measure cell invasion. Scale bar = 200 μm. ns, *, **, and *** represent p > 0.05, p < 0.05, p < 0.01, and p < 0.001, respectively (vs. control group). N = 3
3.2. NT157 induced autophagy of ovarian cancer cells
OVCAR3 and OVCA433 cells were treated with varying concentrations of NT157. qRT‐PCR was conducted for testing autophagy‐related genes, including ATG5, ATG7, and BECLIN1. As shown by the result, NT157 treatment significantly promoted their mRNA levels (compared with the con group, Figure 2A,B). LC3B puncta formation was tested by immunofluorescence. It was found that NT157 addition marked enhanced the number of LC3B puncta in two ovarian cells (Figure 2C–F). We also performed TEM for testing morphological changes of autophagosomes. The result showed that NT157 increased autophagosome accumulation (Figure 2G). As displayed by WB results, the LC3B‐II/LC3B‐I level was increased while the p62 expression was decreased following the NT157 treatment (0.4, 0.8 μM; vs. the control group; Figure 2H). These results confirmed that NT157 intensified autophagy in ovarian cancer cells.
FIGURE 2.
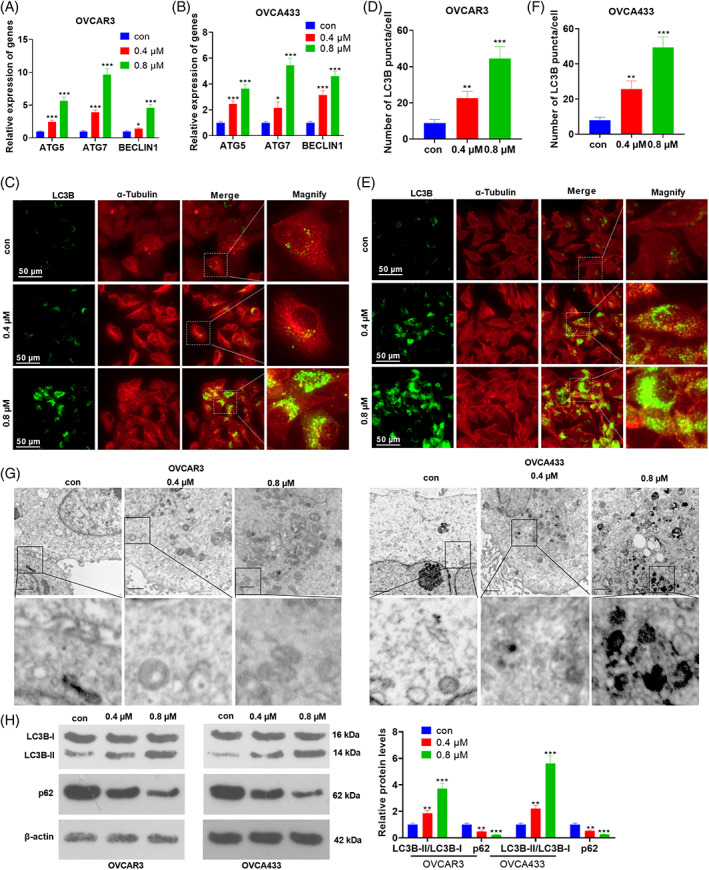
NT157 promoted autophagy in ovarian cancer cells. OVCAR3 and OVCA433 cells were treated with NT157 (0.4, 0.8 μM). (A,B) qRT‐PCR was conducted for testing autophagy‐related genes, including ATG5, ATG7, and BECLIN1. (C–F) Immunofluorescence was conducted for detecting LC3B puncta and the LC3B puncta number per cell was quantified using the ImageJ software. Scale bar = 50 μm. (G) TEM was conducted for evaluating autophagosomes/autolysosomes in OVCAR3 and OVCA433 cells. Scale bar = 1 μm. (H) The expression of LC3B‐II, LC3B‐I, and p62 was determined by WB. ns, *, **, and *** represent p > 0.05, p < 0.05, p < 0.01, and p < 0.001, respectively (vs. con group). N = 3
3.3. Overexpressing IRS1/2 attenuated the tumor‐suppressive effect of NT157
After treatment with NT157 (0.8 μM), OVCAR3 cells were transfected with IRS1/2 overexpression plasmids. qRT‐PCR showed that NT157 distinctly hampered the expression of IRS1 and IRS2 mRNA, and WB data indicated that phosphorylated levels and total protein levels of IRS1 and IRS2 were suppressed by NT157 (vs. the control group), which were significantly promoted by overexpression of IRS1/2 (vs. the NT157 group; Figure 3A,B). MTT and colony formation assay results illustrated that overexpressing IRS1/2 attenuated the inhibitory effect of NT157 on the proliferation and colony formation of OVCAR3 cells (Figure 3C,D). TUNEL results elaborated that overexpressing IRS1/2 markedly suppressed NT157‐induced OVCAR3 apoptosis compared to the NT157 group (Figure 3E). The detection results of apoptosis‐related proteins exhibited that the expression of Caspase‐8 and Caspase‐9 was decreased, while the expression of Mcl1 and BCL‐XL was increased after IRS1/2 overexpression on the basis of NT157 treatment (Figure 3F,G). Transwell assay results demonstrated that overexpressing IRS1/2 distinctly abated the invasion of OVCAR3 cells versus the NT157 group (Figure 3H). These results indicated that overexpression of IRS1/2 weakened the inhibitory effect of NT157 on OVCAR3 cell growth in vitro.
FIGURE 3.

Overexpressing IRS1/2 weakened the antitumor effects of NT157. OVCAR3 cells were transfected with IRS1/2 overexpression plasmids and/or treated with NT157 (0.8 μM). (A) The mRNA expression of overall and phosphorylated protein expression of IRS1 and IRS2 was monitored by qRT‐PCR. (B) Protein expression of phosphorylated IRS1 and IRS2 was verified by WB. (C) MTT assay was conducted to test cell proliferation. (D) The colony formation assay was adopted to count cell colonies. (E) Cell apoptosis was determined by TUNEL. Scale bar = 50 μm. (F,G) The profiles of cleaved Caspase‐8, cleaved Caspase‐9, Mcl1, and BCL‐XL were tested by WB. (H) OVCAR3 cells were dealt with 0.2 μM NT157. The Transwell experiment assayed cell migration and invasion. Scale bar = 200 μm. ** and *** stand for p < 0.01 and p < 0.001, respectively (vs. con group). #, ##, and ### are used for representing p < 0.05, p < 0.01, and p < 0.001, respectively (vs. NT157 group). N = 3
3.4. Overexpressing IRS1/2 hampered autophagy and activated PI3K/AKT/mTOR in ovarian cancer cells
After treatment with NT157 (0.8 μM), OVCAR3 cells were transfected with IRS1/2 overexpression plasmids. The results of qRT‐PCR showed that ATG5, ATG7, and BECLIN1 mRNA levels were reduced followed by IRS1/2 overexpression (vs. the NT157 group, Figure 4A). Cell immunofluorescence showed that the number of LC3B puncta was reduced after IRS1/2 overexpression (vs. the NT157 group; Figure 4B,C). WB results revealed that overexpressing IRS1/2 significantly suppressed the LC3B‐II/LC3B‐I level and heightened the p62 expression versus the NT157 group (Figure 4D). Additionally, overexpressing IRS1/2 significantly reduced the inhibitory effect of NT157 on the levels of p‐PI3K, p‐AKT, and p‐mTOR (Figure 4E). Thus, overexpressing IRS1/2 repressed autophagy and elevated the PI3K/AKT/mTOR pathway expression at protein and mRNA levels in OVCAR3 cells.
FIGURE 4.

Overexpressing IRS1/2 suppressed autophagy in ovarian cancer cells and activated the PI3K/AKT/mTOR pathway. After treatment with NT157 (0.8 μM), OVCAR3 cells were transfected with IRS1/2 overexpression plasmids. (A) qRT‐PCR was conducted for testing autophagy‐related genes, including ATG5, ATG7, and BECLIN1. (B,C) Immunofluorescence was conducted for detecting LC3B puncta and the LC3B puncta number per cell was quantified using the ImageJ software. Scale bar = 50 μm. (D) WB was implemented to compare the expression of LC3B‐II, LC3B‐I, and p62. (E) The expression of p‐PI3K, p‐AKT, and p‐mTOR was examined by WB. ** and *** stand for p < 0.01 and p < 0.001, respectively (vs. control group). ## and ### are used for marking p < 0.01 and p < 0.001, respectively (vs. NT157 group). N = 3
3.5. Inhibiting PI3K/AKT/mTOR enhanced the tumor‐suppressive effect of NT157
MTT was employed to test the cytotoxicity of Hcol A1 (the PI3K/AKT/mTOR pathway inhibitor) at different concentrations (0, 1, 2. 5, 5,10, 20 μM). As a result, the OVCAR3 cell viability was dramatically weakened by 20 μM of Hcol A1 treatment (Figure 5A). Therefore, we treated OVCAR3 cells with Hcol A1 (10 μM) for 24 h with or without NT157 treatment (0.4 μM). The results of MTT and colony formation assays illustrated that Hcol A1+ NT157 showed enhanced inhibition of the proliferation and colony formation of OVCAR3 cells versus the control or NT157 groups (Figure 5B,C). TUNEL results demonstrated that Hcol A1 accelerated OVCAR3 cell apoptosis vs. the control/NT157 group (Figure 5D). WB analysis showed that the expression of cleaved Caspase‐8 and cleaved Caspase‐9 was elevated while the expression of Mcl1 and BCL‐XL was decreased after the use of Hcol A1 (vs. the control/NT157 group) (Figure 5E). Cell invasions were monitored by the Transwell assay. The outcomes demonstrated that Hcol A1 heightened the invasive ability (vs. the control/NT157 group) (Figure 5F). These results showed that inhibiting PI3K/AKT/mTOR enhanced the inhibitory effect of NT157 on OVCAR3 cell survival in vitro.
FIGURE 5.

Inhibition of PI3K/AKT/mTOR enhanced the tumor‐suppressive effect of NT157. MTT was adopted to verify the toxicity of Hcol A1 on OVCAR3 cells at different concentrations (0, 1, 2.5, 5, 10, 20 μM). Therefore, we treated OVCAR3 cells with Hcol A1 (10 μM) for 24 h with or without NT157 treatment (0.2 or 0.4 μM). (B) Cell proliferation was tested by MTT assay. (C) The colony formation assay was implemented to detect the number of cell colonies. (D) Apoptosis was examined by TUNEL staining assay. Scale bar = 50 μm. (E) WB was employed to compare the levels of cleaved Caspase‐8, cleaved Caspase‐9, MCL1, and BCL‐XL. (F) Transwell assay was utilized for evaluating the invasive ability of the cells. Scale bar = 200 μm. *, **, and *** stand for P <0.05, p < 0.01, and p < 0.001, respectively (vs. control group). #, ##, and ### represent p < 0.05, p < 0.01, and p < 0.001, respectively (vs. NT157 group). N = 3
3.6. Inhibiting PI3K/AKT/mTOR stimulated NT157‐mediated autophagy
We treated OVCAR3 cells with Hcol A1 (10 μM) for 24 h with or without NT157 treatment (0.4 μM). qRT‐PCR showed that ATG5, ATG7, and BECLIN1 mRNA levels were promoted by Hcol A1 and NT157 treatment, and their combination further enhanced ATG5, ATG7, and BECLIN1 mRNA levels (vs. NT157 group, Figure 6A). The results of cell immunofluorescence detection revealed that Hcol A1 significantly enhanced the number of LC3B puncta in OVCAR3 cells (vs. the control group), and NT157 and Hcol A1 combination showed a more significant increase in the number of LC3B puncta (vs. the control group, Figure 6B,C). WB results revealed that the LC3B‐II/LC3B‐I level increased and the p62 expression decreased after Hcol A1 treatment versus the control/NT157 group (Figure 6D). Hcol A1 had no impact on the expression of phosphorylated and total protein levels in IRS1 and IRS2 versus the control/NT157 group (Figure 6E). Moreover, the expression of phosphorylated PI3K, phosphorylated AKT and phosphorylated mTOR proteins was dramatically reduced with the use of Hcol A1 versus the control group. Meanwhile, Hcol A1 enhanced the inhibitory effect of NT157 on the expression of PI3K, AKT, and mTOR phosphorylated proteins (Figure 6F). These findings confirmed that attenuating PI3K/AKT/mTOR facilitated NT157‐mediated autophagy.
FIGURE 6.

Inhibiting PI3K/AKT/mTOR facilitated NT157‐mediated autophagy. We treated OVCAR3 cells with Hcol A1(10 μM) for 24 h after with or without NT157 treatment (0.4 μM). (A) qRT‐PCR was conducted for testing autophagy‐related genes, including ATG5, ATG7, and BECLIN1. (B,C) Immunofluorescence was conducted for detecting LC3B puncta and the LC3B puncta number per cell was quantified using the ImageJ software. Scale bar = 50 μm. (D) WB was conducted to monitor the expression of LC3B‐II, LC3B‐I, and p62. (E) The expression of phosphorylated IRS1 and IRS2 was compared by WB. (F) WB was performed to test the profiles of phosphorylated PI3K, AKT, and mTOR. ns, *, **, and *** stand for p > 0.05, p < 0.05, p < 0.01, and p < 0.001, respectively (vs. control group). ns, ##, and ### represent p > 0.05, p < 0.01, and p < 0.001, respectively (vs. NT157 group). N = 3
3.7. Inhibiting autophagy partly reduced the anti‐tumor effects of NT157
To further confirm the role of autophagy in NT157‐mediated effects in ovarian cells, we treated OVCAR3 cells with autophagy inhibitor 3‐MA (10 μM) with or without NT157. MTT assay showed the proliferation of OVCAR3 cells was enhanced in the 3‐MA + NT157 group (compared with the NT157 group, Figure 7A). TUNEL staining and WB results indicated that the apoptosis of OVCAR3 cells was inhibited with 3‐MA addition (compared with the NT157 group, Figure 7B,C). Furthermore, autophagy‐related genes and the number of LC3B puncta of OVCAR3 cells were reduced by 3‐MA (compared with NT157 group, Figure 7D–F). As a result, the above data suggested that 3‐MA mitigated the inhibitive effects of NT157 in ovarian cells.
FIGURE 7.

Inhibition of autophagy reduced the tumor‐suppressive effect of NT157. OVCAR3 cells were treated by 3‐MA (5 mM) and/or NT157 (0.8 μM). (A) MTT assay was adopted to test the proliferation of OVCAR3 cells. (B) Apoptosis was examined by TUNEL assay. Scale bar = 50 μm. (C) WB was employed to compare the levels of cleaved Caspase‐8, cleaved Caspase‐9, MCL1, and BCL‐XL. (D) qRT‐PCR was conducted for testing autophagy‐related genes, including ATG5, ATG7, and BECLIN1. (E,F) Immunofluorescence was conducted for detecting LC3B puncta and the LC3B puncta number per cell was quantified using the ImageJ software. Scale bar = 50 μm. NS, **, and *** stand for p > 0.05, p < 0.01, and p < 0.001, respectively (vs. con group). #, ##, and ### represent p < 0.05, p < 0.01, and p < 0.001, respectively (vs. NT157 group). N = 3
4. DISCUSSION
Molecular targeted therapy is expected to be a promising strategy in treating ovarian cancer due to its effectiveness and low toxicity. 20 is the primary reason for death in gynecological malignancies. 20 Our study shows that NT157 dampens the growth of commercially available cancer cell lines in vitro. Mechanistic studies showed that this effect is achieved in part by down‐regulating the IRS1/2 pathway to suppress the PI3K/AKT/mTOR pathway expression and promote autophagy in tumor cells.
Multiple studies have demonstrated that NT157 has significant anti‐tumor effects. For example, several studies have illustrated that NT157 impedes the proliferation and migration of osteosarcoma cells in vitro and induces cell cycle arrest, and it also exerts tumor‐suppressive effects in synergy with other anti‐tumor agents such as methotrexate and cisplatin as well as adriamycin. 21 Another study has shown that NT157 attenuates the proliferation and inflammation of colon cancer cells, induces apoptosis, and abates tumor formation in vivo. 22 In this study, through drug toxicity detection, 0.4 and 0.8 μM NT157 were selected for the cell experiment. Our data revealed that the use of NT157 repressed the proliferation, migration, and invasion of OVCAR3 and OVCA433 cells in vitro and induced apoptosis. These results suggested that NT157 had an inhibitory effect on ovarian cancer cell survival in vitro. The Caspase cascade system plays an important role in the induction, transduction, and amplification of intracellular apoptotic signals. 23 Caspase‐8, a cysteine‐aspartate‐specific protease, is the promoter of exogenous apoptosis that has been found to be involved in autophagy and pyroptosis. 24 In parallel, Caspase‐9 is a promoter that triggers endogenous apoptosis and has also been identified as being responsible for cellular autophagy. 25 The Bcl‐2 family is key protein involved in the regulation of cell death, and Bcl‐XL is one of these anti‐apoptotic proteins. Bcl‐XL can impede apoptosis by isolating death‐driving cysteine proteases or by blocking the release of mitochondrial apoptotic factors in the cytoplasm. 26 Similarly, MCL1 is an anti‐apoptotic member of the BCL‐2 family, and overexpression of MCL1 is beneficial for cancer cell survival and cellular drug resistance. 27 Here, we discovered that NT157 promoted the levels of Caspase‐8 and Caspase‐9 and dampened the expression of Mcl1 and BCL‐XL through WB. To some extent, this suggested that the pro‐apoptotic effect of NT157 on ovarian cancer cells was achieved by regulating the expression of cleaved Caspase‐8, cleaved Caspase‐9, Mcl1, and BCL‐XL.
It is well known that autophagy contributes to the occurrence and development of tumors. 28 LC3B is an autophagy marker, and the ratio of LC3B‐II to LC3B‐I can reflect the level of autophagy. 29 The lipidated form of LC3B, LC3B‐II, has been demonstrated to be a mammalian marker of autophagosomes. 30 An increased LC3B‐II/LC3B‐I ratio is one of the assessment criteria indicative of increased autophagosome content. 31 Multiple studies have shown that p62 contributes to the regulation of autophagy, and the decrease of autophagy leads to the accumulation of p62. 32 , 33 In this study, we found that NT157 promoted the increase of LC3B, heightened the level of LC3B‐II/LC3B‐I, and suppressed the p62 expression. These results showed that NT157 induced autophagy in ovarian cancer cells. Further experiments confirmed that inhibiting autophagy by 3‐MA reversed the antitumor effects of NT157. Scopim‐Ribeiro et al. have shown that NT157, an IGF1R‐IRS1/2 inhibitor, attenuates cell proliferation and colony formation and induces apoptosis in chronic myelogenous leukemia cells, thereby exacting an anti‐tumor effect. 34 Consistent with previous studies, this study showed that NT157 down‐regulated IRS1/2, and overexpressing IRS1/2 weakened the inhibitory effect of NT157 on ovarian cancer cells and the promoting effect of autophagy. These findings illustrated that NT157 exerted its anti‐tumor effect at least in part by inhibiting the IRS1/2 pathway.
The PI3K/AKT/mTOR pathway is a downstream pathway of IRS1/2 whose expression is elevated. 35 The PI3K/Akt/mTOR pathway has been reported to be closely associated with the development and progression of NSCLC. Multiple specific inhibitors of PI3K, Akt, and mTOR are in various stages of preclinical studies and early clinical trials. 36 Wang et al. have found that curcumin represses the migration and invasion of NSCLC cells by up‐regulating miR‐206 and inhibiting the PI3K/AKT/mTOR pathway. 37 Other scholars have claimed that knocking down methyltransferase‐like 3 (METTL3) abates the promotion of miR‐126‐5p on PTEN, thus inactivating the PI3K/AKT/mTOR pathway and slowing the development of ovarian cancer. 38 Here, we found that the PI3K/AKT/mTOR pathway was attenuated by NT157. To further clarify the mechanism of action of NT157, we introduced Hcol A1, an inhibitor of the PI3K/AKT/mTOR pathway. Hcol A1 isolated from the classical Chinese herbal medicine Pulsatilla Chinensis has been confirmed to repress the proliferation and facilitate apoptosis of A549, SMMC‐7721, BEL‐7402, and MCF‐7 cells and also curbs tumor weight in a xenograft tumor model constructed with H22 and MCF‐7 cells in nude mice. Mechanistic studies have established that the anti‐cancer activity of Hcol A1 is mediated by inhibition of the PI3K/AKT/mTOR pathway. 39 Our findings revealed that Hcol A1 enhanced the NT157‐mediated tumor‐suppressive effect. In addition, we discovered that inhibition of PI3K/AKT/mTOR had no significant impact on the IRS1/2 expression while overexpressing IRS1/2 heightened the PI3K/AKT/mTOR pathway expression. These findings confirmed that PI3K/AKT/mTOR is the pathway through which NT157 exerts anti‐oncogenic effects in ovarian cancer cell lines and a downstream pathway of IRS1/2.
Overall, our study reveals that NT157 exerts anti‐oncogenic effects in ovarian cancer cell lines. NT157 impedes the expression of the PI3K/AKT/mTOR pathway and activates autophagy by inhibiting IRS1/2, thereby suppressing ovarian cancer cell survival in vitro. However, further tumor formation in vivo needs to be carried out in future studies. This article provides a reliable basis for clinical research and treatment of ovarian cancer.
CONFLICT OF INTEREST
All authors declare no conflict of interest.
ETHICS STATEMENT
Our study was approved by the Ethics Committee in the Shanghai Tenth People's Hospital Affiliated to Tongji University.
Li C‐X, Men C‐D, Yang W‐H, Chen R, Zhu J‐H, Cheng Z‐P. Repressing IRS1/2 by NT157 inhibits the malignant behaviors of ovarian cancer through inactivating PI3K/AKT/mTOR pathway and inducing autophagy. Kaohsiung J Med Sci. 2023;39(4):377–389. 10.1002/kjm2.12652
Cai‐Xia Li and Chuan‐Di Men contributed equally to this study.
REFERENCES
- 1. Elsherif S, Javadi S, Viswanathan C, Faria S, Bhosale P. Low‐grade epithelial ovarian cancer: what a radiologist should know. Br J Radiol. 2019;92(1095):20180571. [DOI] [PMC free article] [PubMed] [Google Scholar]
- 2. Ford CE, Werner B, Hacker NF, Warton K. The untapped potential of ascites in ovarian cancer research and treatment. Br J Cancer. 2020;123(1):9–16. [DOI] [PMC free article] [PubMed] [Google Scholar]
- 3. Langhe R. microRNA and ovarian cancer. Adv Exp Med Biol. 2015;889:119–51. [DOI] [PubMed] [Google Scholar]
- 4. Wei P, Li L, Zhang Z, Zhang W, Liu M, Sheng X. A genetic variant of miR‐335 binding site in the ERBB4 3′‐UTR is associated with prognosis of ovary cancer. J Cell Biochem. 2018;119(7):5135–42. [DOI] [PubMed] [Google Scholar]
- 5. White MF. The IRS‐1 signaling system. Curr Opin Genet Dev. 1994;4(1):47–54. [DOI] [PubMed] [Google Scholar]
- 6. Alamdari‐Palangi V, Amini R, Karami H. MiRNA‐7 enhances erlotinib sensitivity of glioblastoma cells by blocking the IRS‐1 and IRS‐2 expression. J Pharm Pharmacol. 2020;72(4):531–8. [DOI] [PubMed] [Google Scholar]
- 7. Sun X, Chen Y, Tan J, Qi X. Serum IRS‐1 acts as a novel biomarker for diagnosis in patients with nasopharyngeal carcinoma. Int J Clin Exp Pathol. 2018;11(7):3685–90. [PMC free article] [PubMed] [Google Scholar]
- 8. Piper AJ, Clark JL, Mercado‐Matos J, Matthew‐Onabanjo AN, Hsieh CC, Akalin A, et al. Insulin receptor substrate‐1 (IRS‐1) and IRS‐2 expression levels are associated with prognosis in non‐small cell lung cancer (NSCLC). PLoS One. 2019;14(8):e0220567. [DOI] [PMC free article] [PubMed] [Google Scholar]
- 9. Tan Y, Cheung M, Pei J, Menges CW, Godwin AK, Testa JR. Upregulation of DLX5 promotes ovarian cancer cell proliferation by enhancing IRS‐2‐AKT signaling. Cancer Res. 2010;70(22):9197–206. [DOI] [PMC free article] [PubMed] [Google Scholar]
- 10. Ravikumar S, Perez‐Liz G, Del Vale L, Soprano DR, Soprano KJ. Insulin receptor substrate‐1 is an important mediator of ovarian cancer cell growth suppression by all‐trans retinoic acid. Cancer Res. 2007;67(19):9266–75. [DOI] [PubMed] [Google Scholar]
- 11. Flashner‐Abramson E, Klein S, Mullin G, Shoshan E, Song R, Shir A, et al. Targeting melanoma with NT157 by blocking Stat3 and IGF1R signaling. Oncogene. 2016;35(20):2675–80. [DOI] [PubMed] [Google Scholar]
- 12. Ibuki N, Ghaffari M, Reuveni H, Pandey M, Fazli L, Azuma H, et al. The tyrphostin NT157 suppresses insulin receptor substrates and augments therapeutic response of prostate cancer. Mol Cancer Ther. 2014;13(12):2827–39. [DOI] [PubMed] [Google Scholar]
- 13. Fenerich BA, Fernandes JC, Rodrigues Alves APN, Coelho‐Silva JL, Scopim‐Ribeiro R, Scheucher PS, et al. NT157 has antineoplastic effects and inhibits IRS1/2 and STAT3/5 in JAK2V617F‐positive myeloproliferative neoplasm cells. Signal Transduct Target Ther. 2020;5(1):5. [DOI] [PMC free article] [PubMed] [Google Scholar]
- 14. Parzych KR, Klionsky DJ. An overview of autophagy: morphology, mechanism, and regulation. Antioxid Redox Signal. 2014;20(3):460–73. [DOI] [PMC free article] [PubMed] [Google Scholar]
- 15. Levine B, Kroemer G. Biological functions of autophagy genes: a disease perspective. Cell. 2019;176(1–2):11–42. [DOI] [PMC free article] [PubMed] [Google Scholar]
- 16. Onorati AV, Dyczynski M, Ojha R, Amaravadi RK. Targeting autophagy in cancer. Cancer. 2018;124(16):3307–18. [DOI] [PMC free article] [PubMed] [Google Scholar]
- 17. Hu Z, Cai M, Zhang Y, Tao L, Guo R. miR‐29c‐3p inhibits autophagy and cisplatin resistance in ovarian cancer by regulating FOXP1/ATG14 pathway. Cell Cycle. 2020;19(2):193–206. [DOI] [PMC free article] [PubMed] [Google Scholar]
- 18. Ferraresi A, Girone C, Esposito A, Vidoni C, Vallino L, Secomandi E, et al. How autophagy shapes the tumor microenvironment in ovarian cancer. Front Oncol. 2020;10:599915. [DOI] [PMC free article] [PubMed] [Google Scholar]
- 19. Annaratone L, Volante M, Asioli S, Rangel N, Bussolati G. Characterization of neuroendocrine tumors of the pancreas by real‐time quantitative polymerase chain reaction. A methodological approach. Endocr Pathol. 2013;24(2):83–91. [DOI] [PubMed] [Google Scholar]
- 20. Morand S, Devanaboyina M, Staats H, Stanbery L, Nemunaitis J. Ovarian cancer immunotherapy and personalized medicine. Int J Mol Sci. 2021;22(12):6532. [DOI] [PMC free article] [PubMed] [Google Scholar]
- 21. Garofalo C, Capristo M, Mancarella C, Reunevi H, Picci P, Scotlandi K. Preclinical effectiveness of selective inhibitor of IRS‐1/2 NT157 in osteosarcoma cell lines. Front Endocrinol. 2015;6:74. [DOI] [PMC free article] [PubMed] [Google Scholar]
- 22. Sanchez‐Lopez E, Flashner‐Abramson E, Shalapour S, Zhong Z, Taniguchi K, Levitzki A, et al. Targeting colorectal cancer via its microenvironment by inhibiting IGF‐1 receptor‐insulin receptor substrate and STAT3 signaling. Oncogene. 2016;35(20):2634–44. [DOI] [PMC free article] [PubMed] [Google Scholar]
- 23. Fan TJ, Han LH, Cong RS, Liang J. Caspase family proteases and apoptosis. Acta Biochim Biophys Sin. 2005;37(11):719–27. [DOI] [PubMed] [Google Scholar]
- 24. Mandal R, Barrón JC, Kostova I, Becker S, Strebhardt K. Caspase‐8: the double‐edged sword. Biochim Biophys Acta Rev Cancer. 2020;1873(2):188357. [DOI] [PubMed] [Google Scholar]
- 25. An HK, Chung KM, Park H, Hong J, Gim JE, Choi H, et al. CASP9 (caspase 9) is essential for autophagosome maturation through regulation of mitochondrial homeostasis. Autophagy. 2020;16(9):1598–617. [DOI] [PMC free article] [PubMed] [Google Scholar]
- 26. Tsujimoto Y. Role of Bcl‐2 family proteins in apoptosis: apoptosomes or mitochondria? Genes Cells. 1998;3(11):697–707. [DOI] [PubMed] [Google Scholar]
- 27. Sancho M, Leiva D, Lucendo E, Orzáez M. Understanding MCL1: from cellular function and regulation to pharmacological inhibition. FEBS J. 2022;289(20):6209–34. [DOI] [PMC free article] [PubMed] [Google Scholar]
- 28. White E. The role for autophagy in cancer. J Clin Invest. 2015;125(1):42–6. [DOI] [PMC free article] [PubMed] [Google Scholar]
- 29. Tanida I, Ueno T, Kominami E. LC3 and autophagy. Methods Mol Biol. 2008;445:77–88. [DOI] [PubMed] [Google Scholar]
- 30. Tanida I, Ueno T, Kominami E. LC3 conjugation system in mammalian autophagy. Int J Biochem Cell Biol. 2004;36(12):2503–18. [DOI] [PMC free article] [PubMed] [Google Scholar]
- 31. Martin‐Rincon M, Morales‐Alamo D, Calbet JAL. Exercise‐mediated modulation of autophagy in skeletal muscle. Scand J Med Sci Sports. 2018;28(3):772–81. [DOI] [PubMed] [Google Scholar]
- 32. Islam MA, Sooro MA, Zhang P. Autophagic regulation of p62 is critical for cancer therapy. Int J Mol Sci. 2018;19(5):1405. [DOI] [PMC free article] [PubMed] [Google Scholar]
- 33. Bjørkøy G, Lamark T, Pankiv S, Øvervatn A, Brech A, Johansen T. Monitoring autophagic degradation of p62/SQSTM1. Methods Enzymol. 2009;452:181–97. [DOI] [PubMed] [Google Scholar]
- 34. Scopim‐Ribeiro R, Machado‐Neto JA, Eide CA, Coelho‐Silva JL, Fenerich BA, Fernandes JC, et al. NT157, an IGF1R‐IRS1/2 inhibitor, exhibits antineoplastic effects in pre‐clinical models of chronic myeloid leukemia. Invest New Drugs. 2021;39(3):736–46. [DOI] [PubMed] [Google Scholar]
- 35. Aoki M, Fujishita T. Oncogenic roles of the PI3K/AKT/mTOR Axis. Curr Top Microbiol Immunol. 2017;407:153–89. [DOI] [PubMed] [Google Scholar]
- 36. Tan AC. Targeting the PI3K/Akt/mTOR pathway in non‐small cell lung cancer (NSCLC). Thorac Cancer. 2020;11(3):511–8. [DOI] [PMC free article] [PubMed] [Google Scholar]
- 37. Wang N, Feng T, Liu X, Liu Q. Curcumin inhibits migration and invasion of non‐small cell lung cancer cells through up‐regulation of miR‐206 and suppression of PI3K/AKT/mTOR signaling pathway. Acta Pharm. 2020;70(3):399–409. [DOI] [PubMed] [Google Scholar]
- 38. Bi X, Lv X, Liu D, Guo H, Yao G, Wang L, et al. METTL3‐mediated maturation of miR‐126‐5p promotes ovarian cancer progression via PTEN‐mediated PI3K/Akt/mTOR pathway. Cancer Gene Ther. 2021;28(3–4):335–49. [DOI] [PubMed] [Google Scholar]
- 39. Wang YE, Xu K, Yue WH, Xu QM, You BG, Zhang MY, et al. Hederacolchiside A1 suppresses proliferation of tumor cells by inducing apoptosis through modulating PI3K/Akt/mTOR signaling pathway. Chin Herb Med. 2018;10(2):215–21. [Google Scholar]