

Abstract
Cholangiocarcinoma (CCA) is a highly aggressive and malignant tumor. In this study, the effect and molecular mechanism of nuclear enriched abundant transcript 1 (NEAT1) in CCA were elucidated. The expressions of NEAT1, microRNA‐186‐5p (miR‐186‐5p), and PTP4A1 were measured by quantitative real‐time PCR. The protein levels were measured by Western blotting. Kaplan–Meier analysis was performed to create survival curves. The interactions between NEAT1, miR‐186‐5p, and PTP4A1 were assessed through the dual luciferase reporter assay. Additionally, the cell proliferation, apoptosis, migration, and invasion were measured by colony formation, flow cytometry, the Transwell assay, and the wound healing assay, respectively. NEAT1 and PTP4A1 were significantly upregulated in CCA tissues and cells, but miR‐186‐5p was downregulated. NEAT1 expression was negatively correlated with the survival of CCA patients and has remarkable correlation with serum CA199 levels and lymph node metastasis. Besides, NEAT1 could act as a molecular sponge for miR‐186‐5p to upregulate PTP4A1 expression. More importantly, the knockdown of NEAT1 or overexpression of miR‐186‐5p inhibited the proliferation, migration and invasion of CCA cells, and the inhibition of miR‐186‐5p reversed the effects of the knockdown of NEAT1. In addition, NEAT1 could also activate the PI3K/AKT signaling pathway and regulate the epithelial‐mesenchymal transition (EMT) through the miR‐186‐5p/PTP4A1 axis. In conclusion, NEAT1 was involved in cell proliferation, migration and invasion in CCA, and the NEAT1/miR‐186‐5p/PTP4A1/PI3K/AKT axis indicated novel regulatory mechanisms and therapeutics for the treatment of CCA.
Keywords: cholangiocarcinoma, miR‐186‐5p, NEAT1, PI3K/AKT, PTP4A1
Abbreviations
- CCA
cholangiocarcinoma
- LncRNAs
long noncoding RNAs
- miRNAs
microRNAs
- 3′UTR
3′‐ untranslated regions
- EMT
epithelial‐mesenchymal transition
- PTP
protein tyrosine phosphatase
- NEAT 1
nuclear enriched abundant transcript 1
- ceRNAs
competing endogenous RNAs
- qRT‐PCR
quantitative real‐time PCR
- MREs
miRNA response elements
- NSCLC
non‐small cell lung cancer
- VEGF
vascular endothelial growth factor
- ICC
intrahepatic cholangiocarcinoma
1. INTRODUCTION
Cholangiocarcinoma (CCA), a common cancer with highly aggressive and malignant symptoms, accounts for approximately 2–3% of digestive tract tumors, and the incidence and mortality of CCA have been increasing worldwide. 1 Although considerable progress has been made in developing many pharmacological interventions for CCA, the mortality rate for patients with CCA still increased by 39%. 2 , 3 , 4 Therefore, it is essential to elucidate the physiological and molecular mechanisms of CCA in order to develop novel and effective therapeutic targets.
It is well studied that long noncoding RNAs (lncRNAs, ~200 nt) are a class of endogenous RNAs that do not encode proteins. They usually regulate the expression levels of targeted genes by sponging microRNAs (miRNAs), and they are involved in a wide variety of biological processes including cell growth, differentiation, proliferation, and apoptosis. Moreover, recent studies have indicated that several lncRNAs were dysregulated in human diseases including cancer. For example, lnc‐AL355149.1–1 and lnc‐STXBP5‐1 were deregulated in tongue squamous cell carcinoma. 5 , 6 Nuclear enriched abundant transcript 1 (NEAT1) was reported as a nuclear‐restricted lncRNA and was involved in cancers, such as androgen receptor‐associated prostate cancer, non‐small cell lung cancer (NSCLC), and gastric cancer. 7 , 8 , 9 NEAT1 is responsible for tumor initiation and progression, and its frequent dysregulation in cancers correlates with clinical features, such as metastasis, the recurrence rate, and patient survival. 10 Additionally, NEAT1 expression exerts a positive correlation with the malignant status and prognosis in gastric cancer patients. 11 An emerging study showed that NEAT1 was also essentially involved in CCA and exerted oncogenic effects. For example, the study revealed that NEAT1 expression was higher in CCA tumor tissues and cell lines, and the knockdown of NEAT1 reduced the cell proliferation, metastasis and invasiveness of CCA cells. 12 It was reported that NEAT1 could exert its oncogenic effect through at least three different molecular mechanisms. 13 However, not much is known about the detailed molecular mechanisms underlying the involvement of NEAT1 in CCA.
It is well known that miRNAs (~22 nt) are a group of small non‐coding RNAs, and they negatively regulate target gene expression by binding to the 3′‐untranslated regions (3′‐UTRs) of mRNA. 14 These miRNAs have been reported to be involved in many tumors. For example, miR‐199a could inhibit the incidence of ovarian cancer. 15 Additionally, miR‐146b‐5p attenuated the migration of glioma cells through suppressing the expression of EGFR. 16 Previous studies suggested that miR‐186‐5p, a cancer type‐specific microRNA, played a critical role in tumorigenesis and cancer progression. 17 The knockdown of miR‐186‐5p suppressed cell proliferation, growth and invasion in metastatic cancer cells. 18 A current study found that miR‐186‐5p expression was obviously downregulated in CCA specimens and cell lines. 19 Moreover, miR‐186‐5p could suppress CCA cell proliferation, migration and metastasis by downregulating microrchidia family CW‐type zinc finger 2 and Twist1. 20 , 21 Interestingly, bioinformatics analysis (Starbase database: http://starbase.sysu.edu.cn) predicted the potential binding sites between miR‐186‐5p and NEAT1. Additionally, miR‐186‐5p was a downstream target of NEAT1 in osteosarcoma. 21 However, to date, whether the NEAT1/miR‐186‐5p axis is involved in CCA remains unclear. PTP4A1, a key protein tyrosine phosphatase (PTP) that activates tyrosine phosphorylation, plays an important function in different pathological developments, especially in carcinogenesis. Recently, studies showed that PTP4A1 could dramatically enhance CCA cell growth, migration, and invasion both in vitro and in vivo through regulating the PI3K/AKT signaling pathway, including GSK3β and CyclinD1. 22 In addition, PTP4A1 promoted the CCA cell epithelial‐mesenchymal transition (EMT) process through increasing the expressions of Zeb1 and Snail. 22 Moreover, bioinformatics analysis (Starbase database: http://starbase.sysu.edu.cn) predicted that PTP4A1 may be a target of miR‐186‐5p. However, whether PTP4A1 is regulated by miR‐186‐5p in CCA remains largely unclear.
In our work, we investigated the potential role and underlying molecular mechanism of NEAT1 in CCA. Our results demonstrated that NEAT1 promoted the cell growth, migration and invasion of CCA through targeting miR‐186‐5p, which further regulated the expression of PTP4A1 and is involved in the PI3K/AKT signaling pathway. Therefore, our study clarified a new NEAT1/miR‐186‐5p/PTP4A1/PI3K/AKT axis in CCA, thus providing new targets and therapies for CCA treatment.
2. MATERIALS AND METHODS
2.1. Tumor tissue samples
The collection and manipulation of samples in our research was approved by the Ethics Committee of the Hunan Provincial People's Hospital and was carried out in accordance with the Declaration of Helsinki. All the patients signed the informed consent. Human CCA samples and adjacent peritumoural tissues were obtained from 50 patients who were diagnosed with CCA. The diagnosis of CCA was according to previous research. 23 All the patients did not receive preoperative anticancer treatment before recruitment to this research. After removal from the patient, tissues specimens were immediately snap‐frozen in liquid nitrogen and stored at −80°C until use. The detailed characteristics of patients can be obtained from the Table 1.
TABLE 1.
The correlation of NEAT1 expression with the clinicopathological characteristics of CCA patients
| Clinical characteristics | Total | NEAT1 expression level | p‐value | |
|---|---|---|---|---|
| Low | High | |||
| Age | 0.571 | |||
| ≤ 60 | 26 | 14 | 12 | |
| >60 | 24 | 11 | 13 | |
| Gender | 0.586 | |||
| Male | 27 | 15 | 12 | |
| Female | 23 | 11 | 12 | |
| Serum CA199 level | 0.041 | |||
| >40 U/ml | 32 | 7 | 25 | |
| ≤40 U/ml | 18 | 9 | 9 | |
| TNM stage | 0.569 | |||
| I‐II | 28 | 15 | 13 | |
| III‐IV | 22 | 10 | 12 | |
| Histologic differentiation | 0.292 | |||
| Well | 21 | 7 | 14 | |
| Moderate | 11 | 6 | 5 | |
| Poor | 18 | 9 | 9 | |
| Lymphatic invasion | 0.140 | |||
| Negative | 29 | 17 | 12 | |
| Positive | 21 | 9 | 12 | |
| Lymph node metastasis | 0.011 | |||
| No | 23 | 16 | 7 | |
| Yes | 27 | 9 | 18 | |
Abbreviations: CCA, cholangiocarcinoma; NEAT1, nuclear enriched abundant transcript 1.
2.2. Cell culture
All CCA cell lines (HuCCT1, RBE, HCCC‐9810, and HCCCT‐1), one human intrahepatic biliary epithelial cell line (HIBEC) and HEK‐293 T cells were purchased from the Cell Bank of the Chinese Academy of Sciences (Shanghai, China). Cells were cultured in the foetal calf serum (10%) including DMEM (HyClone, USA) and 1% penicillin/streptomycin at 37°C in an incubator filled with 5% CO2 and 95% O2.
2.3. Cell transfection
The miR‐186‐5p mimic, miR‐186‐5p inhibitor and their negative control (NC) were obtained from the GenePharma Co., Ltd. (Shanghai, China). The sh‐NEAT1 vector targeting NEAT1 transcription and sh‐NC were bought from Vigenebio (Shanghai, China). For transfections, CCA cells were cultured in medium under 5% CO2 at 37°C for 24 h and then transfected according to the protocols of Lipofectamie2000 (Invitrogen, Carlsbad, CA, USA).
2.4. Luciferase reporter assays
The Starbase analysis (http://starbase.sysu.edu.cn) showed that the binding site of miR‐186‐5p on NEAT1 was at chr11:65195493–65195515[+], and the binding site of miR‐186‐5p on the 3′‐UTR of PTP4A1 was at chr6:64293108–64293113[+]. The wild type (WT) sequences or mutant (MUT) sequences of the binding sites with miR‐186‐5p in NEAT1 or PTP4A1 3′‐UTR were cloned into the downstream to luciferase gene on pGL3‐promoter vector (Promega, USA). Point mutations of the miR‐186‐5p targeting sites were directly synthesized using the QuickChange Multiple Site‐directed Mutagenesis Kit (Stratagene, La Jolla, CA). HEK‐293 T, HCCC‐9810 and HuCCT1 cells were seeded into 24‐well plates. Then, cells were co‐transfected with the luciferase reporter plasmid and corresponding plasmids. After 48 h of transfection, the cells were collected and lysed. The luciferase activities were analyzed with the Dual‐Luciferase Reporter Assay System (Promega, Madison, WI, USA). In the studies, each transfection was performed in triplicate.
2.5. Cell proliferation assays
For colony formation assays, untreated HuCCT1 and HCCC‐9810 cells (1000 cells/well) were planted into 6‐well plates in triplicate and cultured at 37°C and 5% CO2 in a humidified chamber for 2 weeks. Then, colonies were fixed using 4% paraformaldehyde and stained with 1% crystal violet and counted.
2.6. Cell apoptosis analysis
The cell apoptosis of treated HuCCT1 and HCCC‐9810 cells was explored using flow cytometry analysis. In brief, cells were harvested and washed with pre‐cooled PBS three times. Then, the cells were stained with Annexin V‐FITC (R&D Systems Inc., Minneapolis, USA) and propidium iodide (R&D Systems Inc., USA) at room temperature away from light for 15 min. Finally, the apoptosis ratio was evaluated by a Becton‐Dickinson FACS Calibur Flow Cytometer.
2.7. Transwell assay
The invasion abilities of treated HuCCT1 and HCCC‐9810 cells were examined by a Transwell assay (pore size, 8 μm, Corning Incorporated, USA) coated on the lower side with 8 μg/μl Matrigel and placed on a 24‐well plate containing DMEM. Briefly, cells were seeded into the upper side of the Transwell chamber and left to migrate for 24 h at 37°C. Then, the cells were collected and resuspended with DMEM. After 24 h, cells were added onto the upper chamber and utilized as an attractant in the bottom chamber. After being cultured at 37°C for 48 h, cells were fixed with 4% paraformaldehyde in PBS and then stained using 1% crystal violet for 15 min at room temperature. Finally, cell invasion was determined by counting the number of cells in the three inserts.
2.8. Wound healing assay
Cells were harvested and seeded into in 35 mm dishes at a concentration of 1 x 10³ per well and cultured at 37 °C until confluence. An artificial “wound” was made on the cell surface by a sterile pipette tip. Then, images were taken immediately after 0 and 24 h post‐wounding of the creation of a scratch by an IX71 inverted microscope (Olympus Corp).
2.9. Quantitative real‐time PCR assay
The total RNA from cultured CCA cell lines and tissues was extracted with using TRIzol reagent (Invitrogen, Carlsbad, CA, USA) and then transcribed into cDNA using TRIzol reagent (Takara, Japan) according to the manufacturer's protocol. A Maxima SYBR Green qPCR Master Mix Kit (Thermo Fisher Scientific, MA) was utilized for cDNA amplification. To detect the expressions of miR‐186‐5p and U6, reverse transcription and quantitative PCR were conducted by a TaqMan MicroRNA Reverse Transcription Kit and TaqMan Universal Master Mix II (Applied Biosystems, CA, USA). Quantitative real‐time PCR (qRT‐PCR) was then carried out using a miScript SYBR® Green PCR Kit (Qiagen, Inc.) and a StepOnePlus Real‐Time PCR System (Applied Biosystems, CA, USA). The reaction conditions were as follows: hot start at 94°C for 5 min; 40 cycles of 30 s at 95°C, 30 s at 60°C and 30 s at 72°C, and 10 min at 72°C. The sequences of primers used in the present research were as follows: NEAT1: forward 5′‐GAGTTAAGGCGCCATCCTCA‐3′; reverse 5′‐AGCACTGCCACCTGGAAAAT‐3′; PTP4A1: forward 5′‐CCACCATCCAACCAGATTGT‐3′ and reverse 5′‐GCCGCATTTTAGGACGATAC‐3′; miR‐186‐5p: forward 5′‐CGCCGCAAAGAATTCTCCTTT‐3′ and reverse 5′‐GTCGTATCCAGTGCAGGGTCCGAGGTATTCGCACTGGATACGACAGCCCA‐3′. GAPDH: forward 5′‐CCAGGTGGTCTCCTCTGA‐3′; reverse 5′‐GCTGTAGCCAAATCGTTGT‐3′; and U6: forward 5′‐CTCGCTTCGGCAGCACA‐3′; reverse 5′‐AACGCTTCACGAATTTGCGT‐3′. The relative changes in mRNA expression were calculated using the 2−ΔΔCT method.
2.10. Western blotting
CCA cells and clinical tissues for immunoblotting were harvested and lysed with RIPA buffer on ice, and the total proteins and their concentrations were determined by a BCA protein kit (#23225, Pierce). In all, the total proteins (25 μg) of each sample were loaded into and resolved on 10% SDS‐PAGE. Subsequently, the separated proteins were transferred onto PVDF membranes. After incubation with 5% non‐fat dry milk for 2 h, the target proteins were detected by primary antibodies at 4°C overnight. Then, the membranes were incubated with corresponding HRP‐conjugated secondary antibodies (1:1000, Abcam). The proteins were visualized using an enhanced chemiluminescence detection kit reagent (Millipore, Billerica, USA). The following primary antibodies were purchased from Abcam (Cambridge, MA, USA): anti‐E‐cadherin (1:1000, ab40772), anti‐N‐cadherin (1:1000, ab76057), anti‐Akt (1:1000, ab8805), anti‐PI3K (1:1000, ab32089), anti‐p‐PI3K(Tyr458/Tyr199) (1:1000, ab140307), anti‐CyclinD1 (1:1000, ab134175), anti‐Snail (1:1000, ab229701), anti‐p‐Akt (Thr308/Ser473) (1:1000, ab38449), anti‐PTP4A1 (1:1000, ab121185) and anti‐Bcl‐2 (1:1000, ab59348). GAPDH (ab9485, 1:5000) was regarded as the internal control.
2.11. Statistical analysis
Data of this study are presented as the mean value ± SD, and a p value less than 0.05 was considered significant. Kaplan–Meier analysis was used to investigate the overall survival curves in CCA patients. The median value of NEAT1 in CCA was used as the cut‐off value, the above‐median value as the high expression group, and the below‐median value as the low expression group. The Pearson correlation coefficient was used for statistical correlation. The correlations between NEAT1 expression and the clinicopathological characteristics of CCA patients were assessed by the chi‐squar test. Differences between two groups of data were analyzed by the student t‐test, and differences between multiple groups of data were analyzed by analysis of variance (ANOVA). Statistical analysis was determined by one‐way ANOVA analysis using GraphPad Prism 7.0.
3. RESULTS
3.1. NEAT1, miR‐186‐5p, and PTP4A1 were dysregulated in CCA tissues and cell lines
To investigate the potential roles of NEAT1, miR‐186‐5p, and PTP4A1 in CCA, their levels in CCA tissues were determined using qRT‐PCR. The results showed that the relative expression levels of NEAT1 (Figure 1(A)) and PTP4A1 (Figure 1(C)) were significantly increased; however, the miR‐186‐5p expression level (Figure 1(B)) was markedly suppressed in CCA tissues compared with adjacent peritumoural tissues. Moreover, qRT‐PCR analysis showed that NEAT1 (Figure 1(D)) and PTP4A1 (Figure 1(F)) expression levels were significantly upregulated in the CCA cell lines, such as HUCCT1, RBE, HCCC‐9810, and HCCCT‐1 compared to human HIBEC cells, whereas, the expression of miR‐186‐5p was markedly inhibited (Figure 1(E)). In addition, Western blot results showed that the protein level of PTP4A1 was markedly increased in the CCA cell lines compared with the human HIBEC cells (Figure 1(G)). As shown in Table 1, the expression of NEAT1 was significantly associated with the serum CA199 level (p = 0.041) and lymph node invasion (p = 0.011). Furthermore, Kaplan–Meier analysis revealed that the CCA patients with high NEAT1 expression had shorter survival compared to patients with lowNEAT1 expression (Figure 1(H)). Additionally, low survival rates were associated with low miR‐186‐5p expression and high PTP4A1 expression (Figure 1(I),(J)). These results demonstrated that NEAT1, miR‐186‐5p, and PTP4A1 were dysregulated in CCA tissues and cell lines and indicated that NEAT1 may play a key role in the development and progression of CCA patients.
FIGURE 1.

Relative nuclear enriched abundant transcript 1 (NEAT1), miR‐186‐5p, and PTP4A1 expressions in cholangiocarcinoma (CCA) tissues and cell lines. (A)‐(C) The expression levels of NEAT1 (A), miR‐186‐5p (B), and PTP4A1 (C) in CCA tissues and the normal tissues were examined by quantitative real‐time PCR (qRT‐PCR). (D)‐(F) The expression levels of NEAT1 (D), miR‐186‐5p (E), and PTP4A1 (F) in CCA cells lines were examined by qRT‐PCR. (G) The protein levels of PTP4A1 in different CCA cell lines were examined by Western blotting. (H)‐(J) Kaplan–Meier analysis was used to test the correlation between the expression levels of NEAT1, miR‐186‐5p, and PTP4A1 and the overall survival of CCA patients. Data represent the mean ± SD. *p < 0.05, **p < 0.01, ***p < 0.001
3.2. The knockdown of NEAT1 promoted the expression of miR‐186‐5p and inhibited PTP4A1 expression in CCA
To further investigate the specific role of NEAT1 in CCA, we then constructed NEAT1‐konckdown CCA cells using a shRNA that targets NEAT1 transcription (NEAT1‐1 and NEAT1‐2). The qRT‐PCR results demonstrated that the expression of NEAT1was significantly decreased in both HCCC‐9810 and HuCCT1 cells infected with sh‐NEAT1 compared with those infected with the negative control vector (Figure 2(A)). Then, we examined the miR‐186‐5p and PTP4A1 expressions, and the results showed that the knockdown of NEAT1 expression remarkably upregulated the miR‐186‐5p expression (Figure 2(B)), while it decreased the PTP4A1 expression (Figure 2(C)). Next, the results of Western blotting also showed that the knockdown of NEAT1 expression significantly suppressed the PTP4A1 protein level (Figure 2(D)). Additionally, the studies in CCA tissues indicated that the expressions of NEAT1 and miR‐186‐5p presented a remarkable negative correlation (R2 = 0.16) (Figure 2(E), p < 0.001). In contrast, the expressions of NEAT1 and PTP4A1 presented a remarkable positive correlation (R2 = 0.33) (Figure 2(F), p < 0.001). These results indicated NEAT1 could regulate miR‐186‐5p and PTP4A1 expressions in CCA cell lines.
FIGURE 2.

The knockdown of nuclear enriched abundant transcript 1 (NEAT1) regulates the expressions of miR‐186‐5p and PTP4A1 in cholangiocarcinoma (CCA) cell lines. HCCC‐9810 and HuCCT1 cells were transfected with sh‐NEAT orsh‐NC. (A)‐(C) the expression levels of NEAT (A), miR‐186‐5p (B), and PTP4A1 (C) were examined by quantitative real‐time PCR (qRT‐PCR). (D) The protein level of PTP4A1 was examined by Western blotting. (E) and (F) The correlation analysis between NEAT and miR‐186‐5p (E) and PTP4A1 (F) was tested by Spearman's correlation. Data represent the mean ± SD. *p < 0.05, **p < 0.01, ***p < 0.001
3.3. NEAT1 acted as a sponge for miR‐186‐5p to promote PTP4A1 expression in CCA cell lines
Since lncRNAs can act as miRNA sponges that compete with mRNA for binding to miRNAs, we further investigated whether there is targeted relationship between NEAT1, miR‐186‐5p and PTP4A1. First, miR‐186‐5p mimics and inhibitor indeed remarkably increased and decreased the relative miR‐186‐5p expressions, respectively, as analyzed by qRT‐PCR in HCCC‐9810 and HuCCT1 cells (Figure 3(A)). Interestingly, miR‐186‐5p mimics significantly reduced the PTP4A1 mRNA level; however, miR‐186‐5p inhibitor significantly increased the PTP4A1 mRNA level (Figure 3(B)). The results of Western blotting also showed that the protein level of PTP4A1 was decreased in HCCC‐9810 and HuCCT1 cells transfected with miR‐186‐5p mimics but was increased in cells transfected with miR‐186‐5p inhibitor (Figure 3(C)). The potential binding sites between NEAT1, miR‐186‐5p, and PTP4A1 were explored by bioinformatics analysis (Figure 3(D)). To validate the binding relationship between NEAT1, PTP4A1 and miR‐186‐5p, HEK‐293 T, HCCC‐9810, and HuCCT1 cells were cotransfected with luciferase reporter plasmids and miR‐186‐5p mimics, miR‐186‐5p inhibitor or negative control and assayed for their luciferase activity. We found that the transfection of NEAT1‐WT and PTP4A1‐WT cells with miR‐186‐5p mimics significantly impaired the luciferase activity compared with the negative control vectors, and those transfected with miR‐186‐5p inhibitor exhibited remarkably increased luciferase activity (Figure 3(E),(F)). However, cells transfected with either NEAT1‐MUT or PTP4A1‐MUT exhibited no difference in luciferase activity (Figure 3(E),(F)). These results provided strong evidence that NEAT1 promotes PTP4A1 expression by targeting miR‐186‐5p.
FIGURE 3.

Nuclear enriched abundant transcript 1 (NEAT1) promoted PTP4A1 expression by targeting miR‐186‐5p. (A) and (B) the expression levels of miR‐186‐5p (A) and PTP4A1 (B) were measured by quantitative real‐time PCR (qRT‐PCR). (C) The protein levels of PTP4A1 in HCCC‐9810 and HuCCT1 cells transfected with miR‐186‐5p mimic or miR‐186‐5p inhibitors were examined by Western blotting. (D) StarBase analysis showed the potential binding sites for NEAT1 and miR‐186‐5p, miR‐186‐5p, and PTP4A1. (E) The relevance among miR‐186‐5p and NEAT1 was certified by a luciferase reporter assay. HEK‐293T, HCCC‐9810, and HuCCT1 cells were cotransfected with miR‐186‐5p mimics, miR‐186‐5p inhibitor or miR‐186‐5p negative control together with NEAT1‐WT or NEAT1‐MUT luciferase reporter and assayed for their luciferase activity. (F) The relevance among miR‐186‐5p and PTP4A1 was certified by the luciferase reporter assay. HEK‐293T, HCCC‐9810, and HuCCT1 cells were cotransfected with miR‐186‐5p mimic, miR‐186‐5p inhibitor, or miR‐186‐5p negative control together with PTP4A1‐WT or PTP4A1‐MUT luciferase reporter and assayed for their luciferase activity. Data represent the mean ± SD. *p < 0.05, **p < 0.01, ***p < 0.001
3.4. The knockdown of NEAT1 inhibited tumor proliferation and promoted apoptosis through the upregulation of miR‐186‐5p in CCA cell lines
Next, we investigated whether NEAT1 regulated the tumor proliferation and apoptosis by sponging miR‐186‐5p. The cell proliferation of CCA cells transfected with the corresponding vectors was tested by colony formation (Figure 4(A)). The data suggested that the cell colony formation was remarkably decreased in HCCC‐9810 and HuCCT1 cells after transfection with miR‐186‐5p mimics or co‐transfected with sh‐NEAT1 and inhibitor NC (Figure 4(B)). Moreover, miR‐186‐5p inhibitor attenuated the inhibitory effect of sh‐NEAT1 on cell proliferation (Figure 4(B)). Then, we explored the effect of NEAT1 on CCA cell apoptosis (Figure 4(C)). Flow cytometric analysis demonstrated that the transfection of miR‐186‐5p mimics or sh‐NEAT1+inhibitorNC increased the apoptotic cells of HCCC‐9810 and HuCCT1 cells (Figure 4(D)), while miR‐186‐5p inhibitor attenuated the promotion of apoptosis mediated by sh‐NEAT1 (Figure 4(D)). These results demonstrated that the knockdown of NEAT1 inhibited proliferation and promoted apoptosis by sponging miR‐186‐5p in CCA.
FIGURE 4.

The knockdown of nuclear enriched abundant transcript 1 (NEAT1) inhibited tumor proliferation and promoted apoptosis through the upregulation of miR‐186‐5p in cholangiocarcinoma (CCA) cell lines. HCCC‐9810 and HuCCT1 cells were transfected with mimics NC, miR‐186‐5p mimics, sh‐NC + inhibitor NC, sh‐NEAT1 + inhibitor NC or sh‐NEAT1 + miR‐186‐5p inhibitor for 24 h. (A),(B) The cell proliferation was tested by colony formation. (C),(D) Flow cytometry analysis was performed to examine the apoptosis rates. Data represent the mean ± SD. *p < 0.05, **p < 0.01, ***p < 0.001
3.5. The knockdown of NEAT1 suppressed the migration and invasion through the upregulation of miR‐186‐5p in CCA cell lines
We further researched the roles of NEAT1 in cell migration and invasion. The Transwell assay showed that the number of migrated cells in both miR‐186‐5p mimics and sh‐NEAT1+inhibitorNC groups were significantly decreased (Figure 5(A),(B)). In addition, miR‐186‐5p inhibitor attenuated the inhibitory effect of sh‐NEAT1 on cell migration (Figure 5(A),(B)). In parallel, we examined the influence on cell invasion using a Transwell assay. Compared with CCA cells transfected with the negative control, CCA cells transfected with miR‐186‐5p mimics and sh‐NEAT1 + inhibitor NC showed significantly reduced invasiveness (Figure 5(C),(D)). Moreover, after transfection with sh‐NEAT1 and miR‐186‐5p inhibitor, miR‐186‐5p inhibitor could partially reverse the inhibitory effect of sh‐NEAT1 on cell invasion (Figure 5(C),(D)). Our results suggested that the knockdown of NEAT1 inhibits migration and invasion through the upregulation of miR‐186‐5p in CCA cell lines.
FIGURE 5.
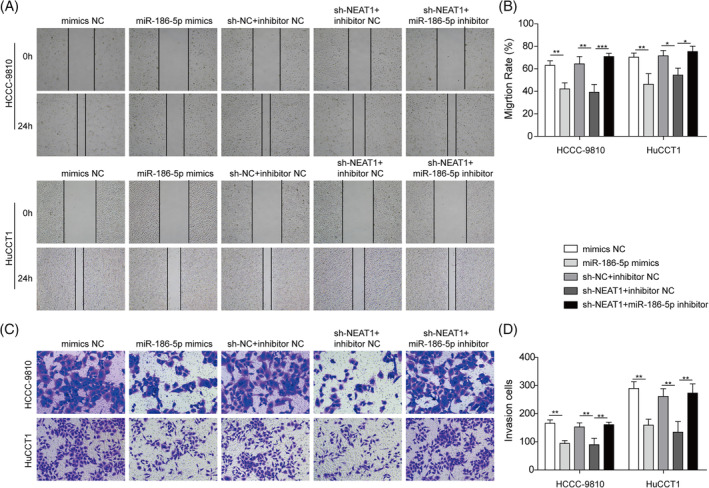
The knockdown of nuclear enriched abundant transcript 1 (NEAT1) inhibited migration and invasion through the upregulation of miR‐186‐5p in cholangiocarcinoma (CCA) cell lines. HCCC‐9810and HuCCT1 cells were transfected with mimics NC, miR‐186‐5p mimics, sh‐NC + inhibitor NC, sh‐NEAT1 + inhibitor NC, or sh‐NEAT1 + miR‐186‐5p inhibitor for 24 h. (A) and (B) Representative images (left) and relevant migration rates (right) determined by the wound healing assay. (C) and (D) The Transwell assay was performed to determine the ability of cell invasion. Data represent the mean ± SD. *p < 0.05, **p < 0.01, ***p < 0.001
3.6. NEAT1 activated the PI3K/AKT signaling pathway via regulating PTP4A1
Mounting studies reported that PTP4A1 inhibited E‐cadherin expression via activating the PI3K/AKT signaling pathway in hepatocellular carcinoma (HCC) cells. 24 In addition, our present data indicated that NEAT1 promotes PTP4A1 expression by targeting miR‐186‐5p. Thus, we presumed that NEAT1 regulates CCA cell proliferation, migration, and invasion through activating PI3K/AKT signaling. To confirm our speculation, we examined the levels of PTP4A1 and PI3K/AKT signaling pathway‐associated proteins by Western blotting in HCCC‐9810 and HuCCT1 cells transfected with the indicated vectors (Figure 6(A)). We found that the protein levels of PTP4A1, p‐PI3K (Tyr458, Tyr199) and p‐AKT (Thr308, Ser473) in the miR‐186‐5p mimics and sh‐NEAT1 + inhibitor NC groups were significantly decreased (Figure 6(A),(B)). In addition, the protein levels of cell‐cycle regulator CyclinD1, Bcl‐2, and Snail were also obviously decreased (Figure 6(B)). Moreover, CCA cells cotransfected with sh‐NEAT1 and miR‐186‐5p inhibitor showed no significant differences in the protein levels of PTP4A1, p‐PI3K (Tyr458, Tyr199), p‐AKT (Thr308, Ser473), CyclinD1 and Bcl‐2 and Snail. These results showed that the NEAT1 may promote CCA cell proliferation by sponging miR‐186‐5p to upregulate PTP4A1 and activate the PI3K/AKT signaling pathway.
FIGURE 6.

Nuclear enriched abundant transcript 1 (NEAT1) regulates cholangiocarcinoma (CCA) cell proliferation, migration, and invasion involved in the PI3K/AKT signaling pathway and epithelial‐mesenchymal transition (EMT). HCCC‐9810 and HuCCT1 cells were transfected with mimics NC, miR‐186‐5p mimics, sh‐NC + inhibitor NC, sh‐NEAT1 + inhibitor NC, or sh‐NEAT1 + miR‐186‐5p inhibitor for 24 h. (A) and (B) The protein levels of PTP4A1,p‐PI3K (Tyr458, Tyr199), p‐AKT (Thr308, Ser473), CyclinD1, Bcl‐2, snail, E‐cadherin, and N‐cadherin were measured by Western blotting. Data represent the mean ± SD. *p < 0.05, **p < 0.01, ***p < 0.001
As is well known, the EMT may promote the migration and invasion of cancer cells, 25 and the PI3K/AKT signaling pathway is involved in the process of EMT. Thus, we measured the expressions of the key molecules of EMT in HCCC‐9810 and HuCCT1 cells. The upregulation of E‐cadherin expression but downregulation of N‐cadherin expression were found in cells transfected with miR‐186‐5p mimics and sh‐NEAT1 + inhibitorNC (Figure 6(B)). In addition, the cotransfection of sh‐NEAT1 and miR‐186‐5p inhibitor abolished the sh‐NEAT1‐mediated changes of E‐cadherin and N‐cadherin expressions. Therefore, our results showed that NEAT1 regulated EMT through sponged miR‐186‐5p to regulate the migration and invasion of CCA cells.
4. DISCUSSION
CCA, originating from bile duct epithelial cells, is one of the most aggressive diseases worldwide. Even worse, rapid tumor growth and distant metastasis makes it extremely difficult to obtain effective treatments for CCA patients. Thus, it is urgent to investigate the novel molecular targets to control the cancer growth and metastasis and improve the survival of CCA patients. In the present study, our data indicated that NEAT1 upregulated PTP4A1 through sponging miR‐186‐5p to activate the PI3K/AKT signaling pathway and EMT, leading to CCA cell growth, migration and invasion.
Plenty of investigations have revealed that lncRNAs play significant roles in CCA, as lncRNAs promote the growth and metastasis of CCA cells. In addition, lncRNAs act as an unfavorable prognostic factor and play a key role in regulating migration and invasion in cancer. 11 , 12 Recently, NEAT1 has been shown to have oncogenic roles and facilitate tumorigenesis in various human cancers. Studies showed that NEAT1 is upregulated in many cancer entities resulting in an unfavorable prognosis as well as poor overall survival. 26 , 27 For example, NEAT1 negatively regulated miR‐129‐5p resulting in augmented WNT4 expression and activated oncogenic WNT signaling, which contributes to breast cancer tumorigenesis. 28 The NEAT1 gene is transcribed into two isoforms, NEAT1_1 (3.7 kb) and NEAT1_2 (23 kb). 29 Recent studies indicated that the two isoforms have distinct physiological functions, and recently, it was shown that NEAT1_2, but not NEAT1_1, was associated with aggressive cancers. 30 , 31 Here, we have specifically analyzed the expression and effect of NEAT1_2 in CCA. Our results indicated that NEAT1 was over‐expressed in CCA tissues and cell lines. We further analyzed the correlation between the expression of NEAT1 and clinicopathological characteristics of CCA patients. NEAT1 expression was negatively correlated with survival of CCA patients and had remarkable correlations with the serum CA199 levels and lymph node metastasis. Our data was consistent with previous studies in colorectal cancer. 32 In addition, we found that the knockdown of NEAT1 inhibited the growth and invasion of CCA cells. These studies provided evidence that NEAT1 might be a potential therapeutic target for CCA.
Previous investigations have reported that dysregulated miRNAs promote the modulation of different tumor progressions. For example, miR‐101 could inhibit CCA angiogenesis by targeting vascular endothelial growth factor directly and indirectly via the inhibition of and cyclooxygenase‐2‐derived PGE2 signaling. 33 MiR‐186‐5p plays a regulatory role in various cancers. For example, the overexpression of miR‐186‐5p in hepatocellular carcinoma cells inhibited viability and induced apoptosis and autophagy. 34 Additionally, miR‐186‐5p could target PI3KR3 to negatively regulate the cell migration, invasion, and EMT of ovarian cancer cells. 35 In our current research, we demonstrated that miR‐186‐5p expression was decreased in cancer tissues and cancer cells, and its expression was negatively correlated with NEAT1. The overexpression of miR‐186‐5p inhibited the growth and invasion of CCA cells, and the inhibition of its expression reversed the effect of sh‐NEAT1.
Increasing investigations have indicated that PTP4A1 is important for cancer progression and metastasis. The downregulation of PTP4A1 in lung cancer cells results in reduced proliferation and suppressed cell motility. 36 Moreover, PTP4A1 promoted ICC cell proliferation, colony formation, migration, and EMT via the PI3K/AKT pathway. 22 As is well known, EMT plays a vital role in tumor progression, and an essential EMT step is the downregulation of E‐cadherin. 37 Our data showed that in CCA cell lines, PTP4A1 could activate PI3K/AKT signaling to control the EMT process by the upregulation of E‐cadherin but downregulation of N‐cadherin. Meanwhile, our finding showed that NEAT1 promoted PTP4A1 expression through the targeted inhibition of miR‐186‐5p in CCA cell lines. Together, these results indicated that NEAT1 promoted cell growth, migration, invasion and EMT through sponging miR‐186‐5p to upregulate PTP4A1 and activate the PI3K/AKT signaling pathway.
In conclusion, our study demonstrated that NEAT1 directly interacted with miR‐186‐5p to promote the cell growth, migration and invasion of CCA. Furthermore, miR‐186‐5p inhibited tumor growth by regulating the PI3K/AKT signaling pathway and EMT via targeting PTP4A1. Thus, our results provide strong evidence that NEAT1 may be a valuable therapeutic target for CCA.
CONFLICT OF INTEREST
The authors declare no competing financial interest.
Li O, Jiang B, Yi W‐M, et al. LncRNA NEAT1 promotes cell proliferation, migration, and invasion via the miR‐186‐5p/PTP4A1 axis in cholangiocarcinoma. Kaohsiung J Med Sci. 2021;37:379–391. 10.1002/kjm2.12354
Funding information Fund of Science and Technology Department of Hunan Province, Grant/Award Number: 2018SK50726; The Project of Improving the Diagnosis and Treatment Capacity of Hepatobiliary, Pancreas and Intestine diseases in Hunan Province, Grant/Award Number: (Xiangwei [2019] No. 118)
REFERENCE
- 1. Bergquist A, von Seth E. Epidemiology of cholangiocarcinoma. Best Pract Res Clin Gastroenterol. 2015;29(2):221–232. [DOI] [PubMed] [Google Scholar]
- 2. Khan SA, Tavolari S, Brandi G. Cholangiocarcinoma: epidemiology and risk factors. Liver Int. 2019;39(Suppl 1):19–31. [DOI] [PubMed] [Google Scholar]
- 3. O'Morain N, O'Morain C. The burden of digestive disease across Europe: facts and policies. Dig Liver Dis. 2019;51(1):1–3. [DOI] [PubMed] [Google Scholar]
- 4. Everhart JE, Ruhl CE. Burden of digestive diseases in the United States part III: liver, biliary tract, and pancreas. Gastroenterology. 2009;136(4):1134–1144. [DOI] [PubMed] [Google Scholar]
- 5. Ding C, Cheng S, Yang Z, Lv Z, Xiao H, Du C, et al. Long non‐coding RNA HOTAIR promotes cell migration and invasion via down‐regulation of RNA binding motif protein 38 in hepatocellular carcinoma cells. Int J Mol Sci. 2014;15(3):4060–4076. [DOI] [PMC free article] [PubMed] [Google Scholar]
- 6. Gao W, Chan JY, Wong TS. Long non‐coding RNA deregulation in tongue squamous cell carcinoma. Biomed Res Int. 2014;2014:405860. [DOI] [PMC free article] [PubMed] [Google Scholar]
- 7. Clemson CM, Hutchinson JN, Sara SA, Ensminger AW, Fox AH, Chess A, et al. An architectural role for a nuclear noncoding RNA: NEAT1 RNA is essential for the structure of paraspeckles. Mol Cell. 2009;33(6):717–726. [DOI] [PMC free article] [PubMed] [Google Scholar]
- 8. Sun C, Li S, Zhang F, Xi Y, Wang L, Bi Y, et al. Long non‐coding RNA NEAT1 promotes non‐small cell lung cancer progression through regulation of miR‐377‐3p‐E2F3 pathway. Oncotarget. 2016;7(32):51784–51814. [DOI] [PMC free article] [PubMed] [Google Scholar]
- 9. Chakravarty D, Sboner A, Nair SS, Giannopoulou E, Li R, Hennig S, et al. The oestrogen receptor alpha‐regulated lncRNA NEAT1 is a critical modulator of prostate cancer. Nat Commun. 2014;5:5383. [DOI] [PMC free article] [PubMed] [Google Scholar]
- 10. Li S, Li J, Chen C, Zhang R, Wang K. Pan‐cancer analysis of long non‐coding RNA NEAT1 in various cancers. Genes Dis. 2018;5(1):27–35. [DOI] [PMC free article] [PubMed] [Google Scholar]
- 11. Fu JW, Kong Y, Sun X. Long noncoding RNA NEAT1 is an unfavorable prognostic factor and regulates migration and invasion in gastric cancer. J Cancer Res Clin Oncol. 2016;142(7):1571–1579. [DOI] [PMC free article] [PubMed] [Google Scholar]
- 12. Zhang C, Li JY, Tian FZ, Zhao G, Hu H, Ma YF, et al. Long noncoding RNA NEAT1 promotes growth and metastasis of Cholangiocarcinoma cells. Oncol Res. 2018;26(6):879–888. [DOI] [PMC free article] [PubMed] [Google Scholar]
- 13. Dong P, Xiong Y, Yue J, Hanley SJB, Kobayashi N, Todo Y, et al. Long non‐coding RNA NEAT1: a novel target for diagnosis and therapy in human tumors. Front Genet. 2018;9:471. [DOI] [PMC free article] [PubMed] [Google Scholar]
- 14. Lee S, Yu KR, Ryu YS, Oh YS, Hong IS, Kim HS, et al. miR‐543 and miR‐590‐3p regulate human mesenchymal stem cell aging via direct targeting of AIMP3/p18. Age (Dordr). 2014;36(6):9724. [DOI] [PMC free article] [PubMed] [Google Scholar]
- 15. Cheng W, Liu T, Wan X, Gao Y, Wang H. MicroRNA‐199a targets CD44 to suppress the tumorigenicity and multidrug resistance of ovarian cancer‐initiating cells. FEBS J. 2012;279(11):2047–2059. [DOI] [PubMed] [Google Scholar]
- 16. Katakowski M, Zheng X, Jiang F, Rogers T, Szalad A, Chopp M. MiR‐146b‐5p suppresses EGFR expression and reduces in vitro migration and invasion of glioma. Cancer Invest. 2010;28(10):1024–1030. [DOI] [PMC free article] [PubMed] [Google Scholar]
- 17. Esquela‐Kerscher A, Slack FJ. Oncomirs ‐ microRNAs with a role in cancer. Nat Rev Cancer. 2006;6(4):259–269. [DOI] [PubMed] [Google Scholar]
- 18. Jones DZ, Schmidt ML, Suman S, Hobbing KR, Barve SS, Gobejishvili L, et al. Micro‐RNA‐186‐5p inhibition attenuates proliferation, anchorage independent growth and invasion in metastatic prostate cancer cells. BMC Cancer. 2018;18(1):421. [DOI] [PMC free article] [PubMed] [Google Scholar]
- 19. Feng H, Zhang Z, Qing X, French SW, Liu D. miR‐186‐5p promotes cell growth, migration and invasion of lung adenocarcinoma by targeting PTEN. Exp Mol Pathol. 2019;108:105–113. [DOI] [PubMed] [Google Scholar]
- 20. Liao G, Liu X, Wu D, Duan F, Xie X, Wen S, et al. MORC2 promotes cell growth and metastasis in human cholangiocarcinoma and is negatively regulated by miR‐186‐5p. Aging (Albany NY). 2019;11(11):3639–3649. [DOI] [PMC free article] [PubMed] [Google Scholar]
- 21. Zhang M, Shi B, Zhang K. miR‐186 suppresses the progression of Cholangiocarcinoma cells through inhibition of Twist1. Oncol Res. 2019;27(9):1061–1068. [DOI] [PMC free article] [PubMed] [Google Scholar]
- 22. Liu LZ, He YZ, Dong PP, Ma LJ, Wang ZC, Liu XY, et al. Protein tyrosine phosphatase PTP4A1 promotes proliferation and epithelial‐mesenchymal transition in intrahepatic cholangiocarcinoma via the PI3K/AKT pathway. Oncotarget. 2016;7(46):75210–75220. [DOI] [PMC free article] [PubMed] [Google Scholar]
- 23. Rizvi S, Khan SA, Hallemeier CL, Kelley RK, Gores GJ. Cholangiocarcinoma ‐ evolving concepts and therapeutic strategies. Nat Rev Clin Oncol. 2018;15(2):95–111. [DOI] [PMC free article] [PubMed] [Google Scholar]
- 24. Jin S, Wang K, Xu K, Xu J, Sun J, Chu Z, et al. Oncogenic function and prognostic significance of protein tyrosine phosphatase PRL‐1 in hepatocellular carcinoma. Oncotarget. 2014;5(11):3685–3696. [DOI] [PMC free article] [PubMed] [Google Scholar]
- 25. Lamouille S, Xu J, Derynck R. Molecular mechanisms of epithelial‐mesenchymal transition. Nat Rev Mol Cell Biol. 2014;15(3):178–196. [DOI] [PMC free article] [PubMed] [Google Scholar]
- 26. Chen T, Wang H, Yang P, He ZY. Prognostic role of long noncoding RNA NEAT1 in various carcinomas: a meta‐analysis. Onco Targets Ther. 2017;10:993–1000. [DOI] [PMC free article] [PubMed] [Google Scholar]
- 27. Yang C, Li Z, Li Y, Xu R, Wang Y, Tian Y, et al. Long non‐coding RNA NEAT1 overexpression is associated with poor prognosis in cancer patients: a systematic review and meta‐analysis. Oncotarget. 2017;8(2):2672–2680. [DOI] [PMC free article] [PubMed] [Google Scholar]
- 28. Lo PK, Zhang Y, Wolfson B, Gernapudi R, Yao Y, Duru N, et al. Dysregulation of the BRCA1/long non‐coding RNA NEAT1 signaling axis contributes to breast tumorigenesis. Oncotarget. 2016;7(40):65067–65089. [DOI] [PMC free article] [PubMed] [Google Scholar]
- 29. Hutchinson JN, Ensminger AW, Clemson CM, Lynch CR, Lawrence JB, Chess A. A screen for nuclear transcripts identifies two linked noncoding RNAs associated with SC35 splicing domains. BMC Genomics. 2007;8:39. [DOI] [PMC free article] [PubMed] [Google Scholar]
- 30. Knutsen E, Lellahi SM, Aure MR, Nord S, Fismen S, Larsen KB, et al. The expression of the long NEAT1_2 isoform is associated with human epidermal growth factor receptor 2‐positive breast cancers. Sci Rep. 2020;10(1):1277. [DOI] [PMC free article] [PubMed] [Google Scholar]
- 31. Sun W, Lan X, Zhang H, Wang Z, Dong W, He L, et al. NEAT1_2 functions as a competing endogenous RNA to regulate ATAD2 expression by sponging microRNA‐106b‐5p in papillary thyroid cancer. Cell Death Dis. 2018;9(3):380. [DOI] [PMC free article] [PubMed] [Google Scholar]
- 32. Yu HM, Wang C, Yuan Z, Chen GL, Ye T, Yang BW. LncRNA NEAT1 promotes the tumorigenesis of colorectal cancer by sponging miR‐193a‐3p. Cell Prolif. 2019;52(1):e12526. [DOI] [PMC free article] [PubMed] [Google Scholar]
- 33. Zhang J, Han C, Zhu H, Song K, Wu T. miR‐101 inhibits cholangiocarcinoma angiogenesis through targeting vascular endothelial growth factor (VEGF). Am J Pathol. 2013;182(5):1629–1639. [DOI] [PMC free article] [PubMed] [Google Scholar]
- 34. Shan Y, Li P. Long Intergenic non‐protein coding RNA 665 regulates viability, apoptosis, and autophagy via the MiR‐186‐5p/MAP4K3 axis in hepatocellular carcinoma. Yonsei Med J. 2019;60(9):842–853. [DOI] [PMC free article] [PubMed] [Google Scholar]
- 35. Dong S, Wang R, Wang H, Ding Q, Zhou X, Wang J, et al. HOXD‐AS1 promotes the epithelial to mesenchymal transition of ovarian cancer cells by regulating miR‐186‐5p and PIK3R3. J Exp Clin Cancer Res. 2019;38(1):110. [DOI] [PMC free article] [PubMed] [Google Scholar]
- 36. Achiwa H, Lazo JS. PRL‐1 tyrosine phosphatase regulates c‐Src levels, adherence, and invasion in human lung cancer cells. Cancer Res. 2007;67(2):643–650. [DOI] [PubMed] [Google Scholar]
- 37. Harris TJ, Tepass U. Adherens junctions: from molecules to morphogenesis. Nat Rev Mol Cell Biol. 2010;11(7):502–514. [DOI] [PubMed] [Google Scholar]