

Abstract
Hereditary spherocytosis (HS) is often misdiagnosed due to lack of specific diagnostic methods. Our study summarized clinical characteristics and described the diagnostic workflow for mild and moderate HS in Chinese individuals, using data from 20 adults, 8 of whom presented a familial history for HS. We used scanning electron microscopy (SEM) to diagnose HS. We observed reduced eosin maleimide fluorescence activity (5.50 mean channel fluorescence (MCF) units) in the 10 cases of HS, which differed significantly when compared with 10 normal adults (15.50 units), iron deficiency anemia (15.50 MCF units), and megaloblastic anemia (12.00 MCF units) values (P < .05). Next generation sequencing results revealed that 9 out of 10 patients were found to have mutations in the spectrin alpha chain (SPTB), anchor protein (ANK1), and SLC4A1 genes. These mutations were not reported in the Human Gene Mutation Database (HGMD), 1000 human genome, ExAC, and dbSNP147 databases. Splenectomy proved to be beneficial in alleviating HS symptoms in 10 cases. It was found that for the diagnosis of HS, SEM and next generation gene sequencing method proved to be more ideal than red blood cell membrane protein analysis using sodium dodecyl sulfate polyacrylamide gel electrophoresis and western blotting.
Keywords: ankyrin, hereditary spherocytosis, SLC4A1, spectrin, splenectomy
1. INTRODUCTION
Hereditary spherocytosis (HS) is one of the most common hemolytic disease among hereditary erythrocytic membrane diseases, characterized by spherical erythrocytes without their normal biconcave disc shape, observed in peripheral blood smears. Its clinical manifestations are clinically and genetically heterogeneous and include chronic extravascular hemolysis, jaundice and splenomegaly, anemia (when bone marrow is unable to compensate), and acute hemolysis attack during the course of the disease.1 The morbidity rate of HS in Northern Europe and North America is 1/2000,2 and it is less common among Asians.3, 4 The incidence of HS in China is 1.27 cases per 100 000 people in males and 1.49 cases per 100 000 people in females,5 making HS a rare disease in China.
HS displays considerable heterogeneity in clinical manifestations with respect to the inheritance and the molecular basis of the disease. Laboratory diagnosis of HS mainly relies on certain tests such as examination of red blood cell (RBC) morphology, osmotic fragility (OF) test, acidified glycerol hemolysis test (AGLT50), and eosin maleimide (EMA) binding test with a negative direct antiglobulin test (Coombs' test), each with their own advantages and disadvantages. In the past, the OF test was considered as the gold standard for the diagnosis of HS, but the detection rate was low and there was no obvious specificity.4 Although the EMA test and erythrocyte membrane protein analysis can be used to screen for HS, their laboratory methods are complicated and lack standardization. Owing to varied clinical phenotypes, there exist no experimental methods to directly confirm HS.6, 7, 8 In Europe, the International Council for Standardization in Haematology published guidelines for HS diagnosis and treatment in 2004,9 whereas in Korea, the Korean Hereditary Hemolytic Anemia Working Party also issued HS‐related guidelines in 2010. Currently, China has no such mechanism in place.10
Although nondominant and autosomal recessive inheritance have also been reported, autosomal dominant inheritance is the most common mode of inheritance in HS. Studies conducted on HS patients showed that structure‐related proteins of erythrocyte membranes were abnormal not only qualitatively but also quantitatively. The known HS gene mutations (and their related proteins) are SPTA1 gene (spectrin alpha chain), SPTB gene (spectrin beta chain), ANK1 gene (anchor protein), SLC4A1 gene (band 3 protein), EPB4.1 gene (band 4.1 protein), and EPB4.2 gene (band 4.2 protein). In the past, it was difficult to diagnose HS clinically due to the nonspecificity of spherocyte RBCs and unreliability of screening tests.11 Currently, molecular detection is used for differential diagnosis and confirmation of HS. Genome‐wide sequencing, exon sequencing, and gene panels are gene‐sequencing technologies based on the next generation sequencing (NGS) technique.12 NGS surpasses the limitations of current experimental diagnostic methods and provides additional information through comprehensive molecular bioinformatic analysis to evaluate the pathogenicity of identified genetic variations.
In the present study, we studied case reports of patients with unexplained hemolytic anemia to optimize the use of existing laboratory test indicators, and formulate a comprehensive index analysis method. It is also the first instance of use of scanning electron microscopy (SEM) in the diagnosis of HS. Here, we report the clinical data of 20 adult patients who were diagnosed with HS in our hospital from January 2006 to December 2017. Our aim was to summarize the characteristics of HS patients in China, reduce the rates of misdiagnosis, and discover a simple and practical diagnostic approach.
2. MATERIALS AND METHODS
2.1. Patients and sample collection
A total of 20 HS patients (11 males and 9 females, median age 40.5 years, 14‐67 years) from six unrelated families were studied. During the study period, 10 out of these 20 patients underwent splenectomy. Blood samples of the patients were obtained from the Nanjing First Hospital Affiliated to Nanjing Medical University from January 2006 to December 2017. All blood samples were stored in a refrigerator at −80°C for further examination, using Ethylene Diamine Tetraacetic Acid (EDTA) as an anticoagulant. None of the patients had received blood transfusion 3 months prior to the study. The number of spherical RBCs in peripheral blood of each patient was counted by two lab assistants and their average values were calculated. Detailed genetic family histories were obtained from all patients. The patients were examined for gallstones and splenomegaly via ultrasonography. This study was conducted in accordance with the declaration of Helsinki. This study was conducted with approval from the Ethics Committee of Nanjing Medical University. Written informed consent was obtained from all participants.
2.2. Hematologic assays
All patients underwent the following systematic laboratory tests: (a) Routine physical and chemical examinations: blood and urine routine; reticulocyte count; blood smear examination; assays of total, direct, and indirect bilirubin concentrations; and liver, gallbladder, and spleen examination using B‐ultrasonic, (b) Hemolytic screening tests: Coombs' test; screening for abnormal or unstable hemoglobins; hemoglobin electrophoresis; high iron hemoglobin reduction test; and glucose 6‐phosphate dehydrogenase fluorescence spot test and (c) HS screening experiments: OF test on fresh and incubated blood; AGLT50; and SEM to observe the morphology of RBCs. Some samples were analyzed using sodium dodecyl sulfate polyacrylamide gel electrophoresis (SDS‐PAGE), western blotting, and EMA binding test to detect erythrocyte membrane skeleton protein deficiency.
2.3. Flow cytometry
EMA binding test was performed as described by King et al,13 with minor modifications. In total,15 000 RBCs were collected to calculate the average fluorescence intensity using the FL1 channel. Median fluorescent intensities (at least 4 mice/strain) were measured using the Fluorescence Activated Cell Sorting (FACS) Vantage SE/DiVA (BD BioSciences) flow cytometer. A small amount of EMA dye reserve solution was stored in a refrigerator at −80°C for less than 6 months.
2.4. Scanning electron microscopy
Heparinized RBCs were rapidly fixed in 4% glutaraldehyde prepared in 0.2 mol/L phosphate buffer (pH 7.2), centrifuged at low speed, and washed with phosphate buffer. RBCs were dehydrated using the following ethanol gradient: 30%, 50%, 70%, 90%, and 100%, 15 minutes at a time. After drying at critical point and spraying with gold (current: 15 mA, time: 60 seconds), the slide glass was observed under the FEI QUANTA 200 SEM (Dutch FEI Company).
2.5. Separation and identification of red cell membrane proteins
Freshly obtained blood (3 mL) from HS patients and healthy individuals was placed in tubes containing heparin. Red cell ghosts were prepared via the low permeability method (10 mmol/L Tris HCl, pH = 7.4) and protein content was determined using the Bradford assay. Red cell membrane proteins were analyzed via SDS‐PAGE using a 4% to 12% gradient concentration in accordance with a procedure mentioned by Fairbanks et al.14
2.6. Molecular analysis for HS
Whole genomic DNA was extracted from 5 mL of peripheral blood of the patients. After the dilution of 3 to 5 μg DNA solution, the Covaris 2 ultrasonicator was used to obtain 150 bp long fragments. The whole genomic library was prepared using the NEBNext DNA library preparation kit (Illumina NEB Company). The size selected product was amplified via Polymerase Chain Reaction (PCR) (each sample was tagged with a unique index during this procedure), purified using magnetic beads (Beckman Company) and the final product was validated using the Agilent Bioanalyzer. The molecular analysis was conducted at MyGenostics Inc., Beijing, China.
2.7. Enrichment and sequencing of target genes
We used GenCap gene sequence capture technology (MyGenostics Company, Beijing), wherein the capture probes of RBC‐related pathogenic genes were hybridized with the whole genomic library of patients and bound and adsorbed using magnetic beads encapsulating biotin and streptavidin. The DNA fragments of nontarget regions were eluted and high throughput sequencing analysis was carried out using the Illumina Hiseq 2000 next generation sequencer.
2.8. Bioinformatic analysis
After sequencing the target area, the readout was filtered and processed to remove the connection and low quality data (quality value > 20) and low coverage data (depth > 10) from the sequencing data. Using the SOAPaligner software to compare with the reference genome, the data obtained were analyzed via standard process information, and the results of single nucleotide polymorphism and interpolation deletion mutation were obtained. At the same time, effective data such as sequencing depth, coverage, and homogeneity were estimated. Nonsynonymous variants were evaluated using four algorithms: PolyPhen, SIFT, PANTHER, and Pmut, to determine pathogenicity, as described previously.
2.9. Therapeutic approach and follow‐up
Ten patients underwent splenectomy and cholecystectomy by means of laparoscopy and laparotomy methods. Clinical follow‐ups were carried out for 2 weeks or longer after the respective operations.
2.10. Statistical analysis
All statistical calculations were carried out using the SPSS software version 19.0. Nonparametric test of two independent samples (Mann‐Whitney U test) were used to measure the significant difference between normal (healthy individuals) and experimental (HS, iron deficiency anemia [IDA], megaloblastic anemia [MA], immune hemolytic anemia [AIHA], myelodysplastic syndrome [MDS] patients) group (P < .05) (represented by rank mean).
3. RESULTS
3.1. Clinical characteristics
The 20 cases of HS comprised 11 males and 9 females. The age of the patients ranged from 14 to 67 years (mean 40.5 years). These patients had long course, mild clinical symptoms, and nonspecific signs. They were in consultation with the multidepartment of Internal Medicine throughout their treatment. The main symptoms and signs of HS were as follows: anemia, sclera and (or) skin jaundice, splenomegaly, and gallstones, occurring in 85%, 90%, 95%, and 100% patients, respectively. In conclusion, HS patients had hemolytic anemia, sclera and (or) skin jaundice, splenomegaly, and gallstones which are considered the “tetralogy of HS.” Of the 20 cases, 15 cases tested positive for urobilinogen. All patients, except patient no. 14, had splenomegaly, whereas all 20 had gallstones.
3.2. Laboratory results
3.2.1. Erythrocyte parameters and erythrocyte morphology
Laboratory findings at the time of diagnosis are shown in Table 1. A total of 17 patients presented with reduced hemoglobin levels (except patient nos. 11, 16, and 18). Furthermore, all patients (except patient no. 14) showed elevated reticulocyte count and indirect bilirubin values. In the 20 cases of HS patients, 20% (4/20), 60% (12/20), and 20% (4/20) presented mild, moderate, and severe anemia, respectively (mild: 11‐15, moderate: 8‐12, and severe: 6‐8 g/dL). The proportion of spherical erythrocytes varied from 14% to 68%, while the proportion of concentrated RBCs varied between 36% and 89%, leading us to infer that the rate of concentrated red cells was higher than that of spherical red cells. It also indicates that HS patients could be screened using the concentration of erythrocyte count. Three types of RBCs were observed in the peripheral blood smear: (a) densely dyed red cells; (b) microspherocytes; and (c) irregularly shaped red cells that were mushroom‐shaped, helmet and oval shaped, acanthocytes, or spiculated red cells (Figure 1).
Table 1.
Laboratory characteristics of 20 patients with HS
| Patient | Sex | Age | Family history | Hb (g/L) | Ret (%) | MCV (fl) | MCH (pg) | MCHC (g/L) | Spherocytes (%) | Hyperdense cells (%) | AGLT50 (s) | OF(g/L) (start‐complete hemolysis) | EMA | IBIL (μmol/L) | Urobilinogen | Gallstone | Length*thickness of spleen (mm) |
|---|---|---|---|---|---|---|---|---|---|---|---|---|---|---|---|---|---|
| 1 | F | 32 | Y | 55 | 19 | 97 | 34 | 331 | 16 | 46 | 69 |
4.4‐3.4 6.0‐4.6(incubated) |
4.5 | 68.7 | + | + | 135*46 |
| 2 | M | 60 | y | 107 | 15.6 | 102 | 35 | 339 | 18 | 36 | 76 |
4.4‐3.4 6.0‐4.6(incubated) |
No | 113.8 | − | + | 168*60 |
| 3 | M | 21 | N | 119 | 16 | 85 | 33 | 390 | 20 | 89 | 65 | 5.2‐4.4 | No | 154.7 | + | + | 129*45 |
| 4 | F | 63 | N | 100 | 3.2 | 90 | 30 | 315 | 17 | 64 | 90 | 5.0‐3.8 | 6.69 | 94.7 | ++ | + | 188*69 |
| 5 | F | 67 | N | 54 | 9.8 | 100 | 31 | 314 | 15 | 45 | 120 |
4.2‐3.2 4.6‐3.4(incubated) |
No | 46 | − | + | 188*67 |
| 6 | F | 58 | N | 88 | 7.2 | 103 | 25 | 320 | 14 | 35 | 150 |
4.4‐3.6 4.6‐3.4(incubated) |
No | 36 | − | + | 144*40 |
| 7 | M | 30 | Y | 90 | 8.6 | 89 | 28 | 345 | 28 | 52 | 78 |
4.4‐3.4 6.0‐4.6(incubated) |
No | 78 | + | + | 154*68 |
| 8 | F | 67 | N | 63 | 17.6 | 90 | 30 | 320 | 30 | 54 | 220 |
4.2‐3.4 4.6‐3.4(incubated) |
No | 108 | ++ | + | 158*57 |
| 9 | M | 46 | N | 90 | 8.9 | 102 | 33 | 320 | 68 | 80 | 160 |
4.4‐3.4 6.0‐4.6(incubated) |
No | 58 | + | + | 172*68 |
| 10 | F | 67 | Y | 94 | 5.6 | 98 | 33 | 337 | 30 | 48 | 200 |
4.2‐3.4 4.6‐3.4(incubated) |
4.5 | 45 | + | + | 150*45 |
| 11 | M | 40 | Y | 136 | 3,2 | 88 | 31 | 352 | 38 | 50 | 220 |
4.2‐3.4 4.6‐3.4(incubated) |
6.6 | 32 | − | + | 145*52 |
| 12 | F | 14 | N | 92 | 12 | 80 | 38 | 320 | 50 | 64 | 190 |
4.4‐3.4 6.0‐4.6(incubated) |
No | 55 | + | + | 156*64 |
| 13 | F | 29 | N | 83 | 23 | 90 | 30 | 330 | 60 | 68 | 120 |
4.4‐3.4 6.0‐4.6(incubated) |
No | 68 | + | + | 168*74 |
| 14 | M | 48 | N | 85 | 1.1 | 85 | 27 | 318 | 18 | 38 | 200 |
4.2‐3.4 4.6‐3.4(incubated) |
5.86 | 2.6 | − | + | 138*35 |
| 15 | F | 55 | N | 98 | 5.6 | 92 | 28 | 340 | 16 | 30 | 180 |
4.2‐3.4 4.6‐3.4(incubated) |
No | 48 | + | + | 158*60 |
| 16 | M | 22 | N | 126 | 3.7 | 90 | 30 | 345 | 58 | 80 | 60 | 6.4‐4.8 | 5.36 | 86 | ++ | + | 180*79 |
| 17 | M | 61 | Y | 68 | 8.6 | 91 | 29 | 319 | 46 | 60 | 98 |
4.4‐3.4 6.0‐4.6(incubated) |
5.84 | 37 | − | + | 210*88 |
| 18 | M | 67 | y | 143 | 9.2 | 97 | 35 | 355 | 32 | 40 | 120 |
4.4‐3.4 6.0‐4.6(incubated) |
7.52 | 74.6 | − | + | 176*65 |
| 19 | M | 65 | Y | 108 | 4.3 | 90 | 28 | 330 | 24 | 38 | 180 |
4.2‐3.4 4.6‐3.4(incubated) |
3.94 | 38 | + | + | 162*50 |
| 20 | M | 61 | N | 75 | 6.2 | 114 | 39 | 336 | 20 | 32 | 200 |
4.2‐3.4 4.6‐3.4(incubated) |
9.94 | 20 | + | + | 148*51 |
Abbreviations: Hb, hemoglobin; IBIL, indirect bilirubin; MCH, mean corpuscular hemoglobin; MCHC, mean corpuscular hemoglobin concentration; MCV, mean corpuscular volume; Ret, reticulocyte.
Figure 1.
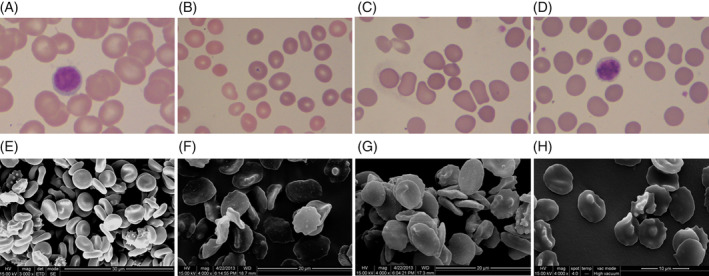
Peripheral blood morphology of red blood cells (RBCs) with hereditary spherocytosis (HS) (Wright‐Giemsa stain, ×1000). A, Normal RBCs. B, Spherocytes RBCs. C, Hyperchromic RBCs. D, Irregular RBCs. Scanning electron images of RBCs with HS (×4000; scale bar = 10 μm). E, Biconcave‐disk shape of the normal RBCs. F, Irregular shape of RBCs. G, Spherocytes and acanthocytes RBCs. H, Echinocyte RBCs
We used SEM to observe the morphology of RBCs more clearly. Erythrocytes were spiculated on the cell surface or displayed single or many acanthocytes. The red cell morphology was of an irregular dish‐shape or flower‐shape and the biconcave discoid shape was absent (Figure 1).
3.3. OF test, AGLT50, and EMA binding test results
OF test was positive in three cases (15%) and negative in 17 cases (85%), of which eight cases turned positive after the incubation test was performed (47%). AGLT50 was positive for all 20 patients. The fluorescence intensity of samples from 10 HS patients was found to be diminished during flow cytometry. The total 95% of the remaining 10 HS patients was 5.50 MCF units, while the 95% of 10 normal adults was 15.50 MCF units (z = −3.784, P = .000). In summary, the dye results of healthy individuals were significantly different from those of HS patients. We observed that the dye test was not affected by the decrease in RBC volume without known cytoskeletal protein deficiency. The MCF results of IDA patients were similar to those of normal adults (15.50). However, patients with high mean corpuscular volume (MCV) (MA, 12.00) showed increase in fluorescence intensity. The cause of enhanced fluorescence is not yet clear. The fluorescence results of AIHA, (12.00, z = −2.539, P = .011) were normal, although they could also mean presence of spherocytes and reticulocytosis (Figure 2).
Figure 2.
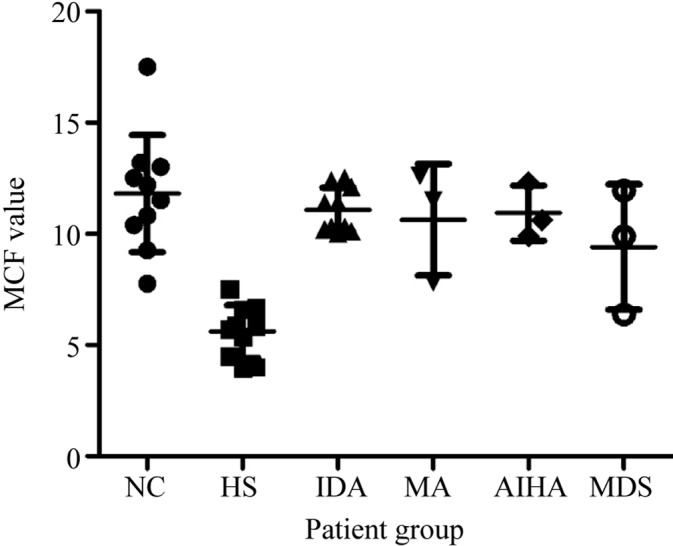
Mean channel fluorescence for normal controls and patient groups. AIHA, immune hemolytic anemia; HS, hereditary spherocytosis; IDA, iron deficiency anemia; NC, normal control; MA, megaloblastic anemia; MDS, myelodysplastic syndrome
3.4. SDS‐PAGE and western blot analyses
Erythrocyte membrane proteins from samples of seven patients were analyzed using SDS‐PAGE. The results confirmed the presence of spectrin and ankyrin proteins. Band 3, band 4.1, and band 4.2 proteins were absent in varying degrees. Accordingly, we selected band 3 and band 4.2 proteins as target proteins and attempted to precisely ascertain the erythrocyte membrane protein deficiency using western blotting. The results showed that band 3 protein of patient nos. 13 and 14 was significantly reduced as compared with that of normal individuals, via semiquantitative comparison with gray value, but there was no obvious change in band 4.2 protein of any patient. Other membrane skeleton proteins were not detected due to unavailability of samples (Figure 3).
Figure 3.
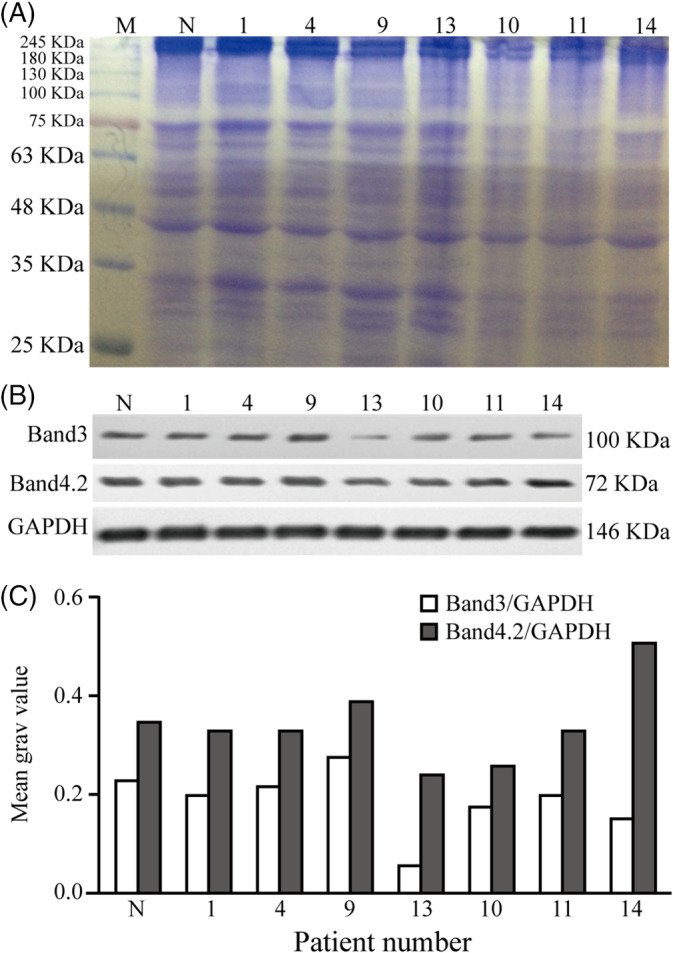
Sodium dodecyl sulfate polyacrylamide gel electrophoresis (SDS‐PAGE) and western blotting analysis of the red cell membrane proteins with hereditary spherocytosis (1‐14 represents the patient number). A, Spectrin and ankyrin protein existed in SDS‐PAGE electrophoresis. It seemed to be absence of band 3, band 4.1, and band 4.2 protein in varying degrees. B,C, Western blotting analysis showed band 3 protein of patients #13, 14 were significantly reduced compared with normal persons by semi quantitative comparison with gray value, but there is no obvious change in band 4.2 protein of all patients. M, mark; N, normal control
3.5. Next generation sequencing results
A total of 9 out of 10 patients were identified with mutations in the SPTB, ANK1, and SLC4A1 genes based on results from the high throughput target gene capture sequencing (Table 2). All identified mutations were verified again using Sanger sequencing. The results confirmed SPTB gene mutation in patients 9, 14, 17, and 18; ANK1 gene mutation in patients 1, 4, and 7; and SLC4A1 gene mutation in patients 10 and 11. These mutations have not been reported before and appear to be novel discoveries. None of these mutations were reported in the HGMD, 1000 human genome, the ExAC, the dbSNP147, and 1000 normal Han Population databases. Three software programs (SIFT, PolyPhen2, and Mutation Taster) predicted that these mutations were pathogenic variations and were the cause of the disease. It is also possible that the inheritance of pathogenic mutations could be determined by detection in immediate relatives. Additionally, four types of mutated forms exist, that is, nonsense mutation, missense mutation, shear mutation, and code shift mutation, all of which are heterozygous mutations.
Table 2.
Mutation gene sequencing results with 10 cases of HS
| Patient | Gene | Exon | Nucleotide | Amino acid | Het/Hom | Mutation type |
|---|---|---|---|---|---|---|
| 1 | ANK1 | 8 | c.824C>G | p.P275R | het | Missense mutation |
| 2 | TET2 | 3 | c.1712G>A | p.R571H | — | Missense mutation |
| 4 | ANK1 | 8 | c.824C>G | p.P275R | het | Missense mutation |
| 7 | ANK1 | 8 | c.824C>G | p.P275R | het | Missense mutation |
| 9 | SPTB | 19 | c.4181G>A | p.W1394X | het | Nonsense mutation |
| 10 | SLC4A1 | 5 | c.256‐258GAG>TTCTC | p.E86Ffs | het | Frameshift mutation |
| 11 | SLC4A1 | 5 | c.256‐258GAG>TTCTC | p.E86Ffs | het | Frameshift mutation |
| 14 | SPTB | 2 | c.211G>A | p.V71M | het | Missense mutation |
| 17 | SPTB | 23 | c.4973 + 5G>A | Splicing | het | Splice mutation |
| 18 | SPTB | 23 | c.4973 + 5G>A | Splicing | het | Splice mutation |
Abbreviations: Het, heterozygous; hom, homozygote.
An ANK1 heterozygous mutation was detected in the first family, comprising patients 1, 4, and 7. The mutation was c.824C>G (the 824th nucleotide of the coding region was mutated from cytosine to guanine), a kind of missense mutation, resulting in amino acid change p.P275R (the 275th amino acid was mutated from proline to arginine). The mutations in patient no. 1 (daughter) and patient no. 7 (son) were in accordance with the mutation of patient no. 4 (father). Thus, HS showed autosomal dominant inheritance pattern in this family.
Through pedigree verification analysis, a heterozygous mutation of the SLC4A1 gene (c.256_258GAG>TTCTC) was detected in the second family, consisting of patient no. 10 (son) and patient no. 11 (mother), resulting in an amino acid change p.E86Ffs (frameshift mutation). DNA from the father was not available whereas the sister of patient no. 10 did not have this mutation.
Familial inheritance history was not found in patient nos. 9 and 14, but a heterozygous mutation of the SPTB gene was detected. Patient no. 9 showed a change of c.4181G>A (the 4181st nucleotide of the coding region mutated from guanine to adenine), resulting in a nonsense mutation and an amino acid change of p.W1394X. The MutationTaster software predicted the presence of a pathogenic variation that leads to the early termination of the SPTB gene transcription and the inability to synthesize a complete protein product. Patient no. 14 showed a change of c.211G>A (the 211th nucleotide changed from guanine to adenine), resulting in a missense mutation and an amino acid change of p.V71M (the 71st amino acid mutated from valine to methionine). Although we were unable to detect any pathogenic mutations in patient no. 2, the clinical manifestations were fully consistent with those of HS. This could be attributed to the technical limitations of current sequencing analysis.
3.6. Splenectomy and postoperative observation
Splenectomy and cholecystectomy was performed in 10 out of 20 (50%) patients via laparotomy and clinical follow‐ups were conducted. Out of these 10, five cases were of moderate and severe patients (based on hemoglobin level). Hemoglobin, total bilirubin, direct, and indirect bilirubin were the four parameters measured as observation indices of therapeutic effect. Two weeks after the operation, the hemoglobin levels of all patients' increased and almost reached normal levels and their physical discomfort was fully eased. In a long‐term follow‐up, patient no. 3 was followed up for 2 years after operation. His total bilirubin, direct, and indirect bilirubin levels were 60.5 μmol/L, 10.5 μmol/L, and 49.6 μmol/L, respectively. Patient no. 4 was followed up for a year postoperation. Her hemoglobin level reached 145 g/L and indirect bilirubin value was normal. Patient no. 5 was followed up for six years after surgery. Her hemoglobin level had risen to 112 g/L and bilirubin value was normal (Table 3). These results showed that splenectomy could abrogate or markedly decrease hemolysis.
Table 3.
Comparison of preoperative and postoperative related indexes in 10 cases of HS
| Patient | Preoperative | Postoperative (2 week) | ||||||
|---|---|---|---|---|---|---|---|---|
| Hb | TBIL | DBIL | IBIL | Hb | TBIL | DBIL | IBIL | |
| (g/L) | (μmol/L) | (μmol/L) | (μmol/L) | (g/L) | (μmol/L) | (μmol/L) | (μmol/L) | |
| 1 | 54 | 66 | 20 | 46 | 112 | 20.4 | 3.8 | 16.6 |
| 3 | 82 | 169.8 | 15.1 | 154.7 | 185 | 60.5 | 10.5 | 49.6 |
| 4 | 87 | 110.3 | 15.6 | 94.7 | 145 | 22.2 | 6.5 | 15.7 |
| 5 | 55 | 80.7 | 12.1 | 68.7 | 105 | 36.9 | 8.7 | 28.2 |
| 6 | 78 | 77.1 | 20.3 | 56.8 | 115 | 33.0 | 10.0 | 23.0 |
| 7 | 84 | 68.2 | 21.6 | 46.6 | 136 | 27.3 | 8.5 | 18.8 |
| 12 | 90 | 61.4 | 12.6 | 48.8 | 124 | 28.8 | 10.2 | 18.6 |
| 13 | 56 | 133.8 | 21.4 | 112.4 | 115 | 35.0 | 12.4 | 22.6 |
| 17 | 70 | 57.0 | 10.5 | 46.5 | 105 | 9.9 | 4.7 | 5.2 |
| 19 | 98 | 41.4 | 8.9 | 32.5 | 110 | 16.0 | 3.6 | 12.4 |
Abbreviations: BIL: indirect bilirubin; DBIL: direct bilirubin; Hb, hemoglobin; TBIL, total bilirubin.
4. DISCUSSION
The prevalence of HS is very high in North European populations, whereas it is considered to be a rare disease in China. HS has also been documented in other countries such as Algeria, Tunisia, Egypt, Japan, North India, and Brazil, with sparse medical records available for African races. Its incidence in East Asia is not clear. A survey of 195 cases of hereditary hemolytic anemia (HHA) from South Korea revealed that RBC membranopathies, hemoglobinopathies, and RBC enzymopathies accounted for 127 (64%), 39 (19.9%), and 26 cases (13.3%), respectively,15 in line with clinical data from the Changhai Hospital in China.16 With the development of next generation gene sequencing diagnostic technology, the number of patients diagnosed with HHA has significantly increased. Wang et al. summarized the number of HS cases reported in Chinese Medical Journal from 1978 to 2013.5 Chinese statistical data of clinical records show that the prevalence in China is estimated to be 127 males per 100 000 and 149 females per 100 000. Since 1994, there has been a significant increase in the number of reported cases of HS. In the past 10 years, 979 cases of HS have been reported, accounting for nearly half of the total (2043 cases). Furthermore, 71% of the cases were diagnosed by affiliated hospitals of medical colleges, 22% by municipal hospitals, 4% by provincial hospitals, and the rest (3%) by state‐level hospitals or community hospitals. Due to the lack of a registration system for HS in China, the exact rate of incidence is currently unknown.
The clinical manifestation of HS is widely variable and the severity of the disease is directly related to extent of membrane surface area reduction. In our study, about 20% of the patients had mild HS with compensatory hemolysis, slight increase in spherical cells, near normal hemoglobin levels, slight reticulocytosis (<6%), and mild splenomegaly. Many patients were not suspected of HS until adulthood when they showed chronic hemolytic complications. Moderate HS comprises the largest group of patients, accounting for about 60%. The hemoglobin levels of patients in this group are between 80 g/L and 110 g/L and reticulocytosis in most cases exceeds 8%, in line with our clinical data. In our study of 20 patients with HS, mild, moderate, and severe anemia accounted for 20%, 60%, and 20% of the patients, respectively, and six cases had a family history of HS. Hemoglobin levels, reticulocyte count, bilirubin, and urinary bilirubin levels varied according to the degree of hemolysis observed in the patient. All patients had gallstones. Mild to moderate splenomegaly was observed in most adults with HS. Although patient no. 14 did not present enlargement of spleen, his clinical characteristics pointed towards the diagnosis of HS. Therefore, splenomegaly is not a necessary condition for HS diagnosis. There are many reasons for the delay in diagnosis or misdiagnosis: (a) lack of understanding of the disease, (b) vast variation in manifestation of HS symptoms, (c) lack of specific experimental methods. Therefore, we speculate that many individuals with HS—particularly those with mild HS—may remain undiagnosed, suggesting that more attention needs to be paid towards the identification of hemolytic anemia patients. To achieve this, countries should pay more attention to medical reform and improve the detection level at hospitals. Concurrently, a stronger diagnosis and treatment network, including hospitals at all levels, should be established to improve medical care for HS and other rare diseases.
Our laboratory examination results showed that RBC parameters (MCV, MCH, and MCHC) had no clinical significance. A hematology analyzer based on the principle of flow cytometry was found to measure MCV and MCHC more accurately than the general hematology analyzer.17 Peripheral blood smear is the simplest method for HS screening. Our results showed that three kinds of morphologies of RBCs could be seen in peripheral smears. Observation of erythrocyte morphology via SEM provides a very useful tool for screening HS. Although the equipment is expensive and the experimental method is special, it enriches the observation of the morphology of RBCs. It is recommended that SEM should be included in the diagnostic guidelines for HS.
Our screening results (including AGLT50, OF, and EMA) did not lead to a definite diagnosis. In the past, OF test was used as the gold standard for HS diagnosis. Compared with a large number of samples, the sensitivity to fresh blood samples was 68%, and the sensitivity of HS to hemolytic compensation was only 30%, which could not distinguish between mild HS patients and normal individuals, and was not sensitive to neonatal HS. In 10% to 20% of HS cases, OF results are negative for HS, therefore normal OF test results do not definitively exclude the diagnosis of HS.18 Moreover, OF positive results can also be seen in AIHA, hereditary persistence of fetal hemoglobin, folic acid deficiency, severe erythrocyte enzyme deficiency, some dialysis patients, some pregnant women, and MDS.19 EMA binding test is a rapid and sensitive diagnostic method, with a sensitivity of 89% to 96%.20 Bianchi et al.21 recently assessed the sensitivity and specificity of EMA binding tests in 108 HS patients and 42 other hemolytic anemia patients; the sensitivity was 87% and the specificity was 98%. Our study showed that HS samples had reduced EMA fluorescence activity that differed significantly when compared with 10 normal adults, IDA, and MA values. These data suggest that EMA test can provide additional information for the differential diagnosis of hemolytic anemia with spherocytosis. The British Haematological Standards Committee strongly recommends EMA binding tests for differential diagnosis of HS.22
Our experiments showed that the results of protein deficiency test were not consistent with the types of gene mutation that caused the misjudgment. SDS‐PAGE is less sensitive to mild and asymptomatic carriers of HS. It is also complicated, time‐consuming, and prone to regular misinterpretation. The deficiency of a membrane protein caused by a gene mutation often results in a secondary deficiency associated with its protein. Analysis of SDS‐PAGE results of 300 cases of HS by Xue et al12 revealed that band 3 and spectrin deficiency were the most common protein abnormalities (54% and 31%, respectively) but 11% of the cases were not identified by SDS‐PAGE analysis.
In our experiment, 9 out of 10 (90%) patients with clinically diagnosed HS were identified with mutations in the SPTB, ANK1, and SLC4A1 genes, ascertained using high throughput target gene capture sequencing. Statistical reports showed that ANK1 mutation (50%) was the most common, followed by spectrin mutation (SPTB 20% and SPTA1 5%), SLC4A1 (15%), and EPB4.2 (10%) mutations.23 In the past 2 years, systematic research reports have been published in China. The results of two of these reports show that ANK1 and SPTB are the most common mutant genes in Chinese HS patients. There was no significant correlation found between the mutation of HS related genes and the severity of HS.24 De novo mutations in ANK1 or SPTB often occur with an unexpectedly high frequency (87.5% and 64.2%, respectively),25 corroborated by a South Korean study yielding similar results,10 thus suggesting a close correlation between clinical diagnosis and gene mutations. Collectively, our results suggest that mutation analyses will complement other conventional tests for accurate diagnosis of HS. We propose that molecular testing should be integrated into the diagnostic criteria for HS.
Splenectomy is a primary course of treatment for HS patients with moderate‐to‐severe anemia. Our observation of 10 patients who underwent splenectomy showed that their hemoglobin levels had normalized along with complete mitigation of physical discomfort. Results of long‐term follow‐up were the same, with no complications occurring in clinical follow‐ups. The therapeutic effect of splenectomy also indirectly proved the diagnosis of HS.
In summary, despite the use of many experimental methods, no single test can provide a definitive diagnosis of HS. Diagnostic means should be comprehensive and exclusive, for which we advocate the need for a standardized diagnostic procedure (Figure 4). Due to the complexity and instability of erythrocyte membrane protein electrophoresis, this method was ruled out as a diagnostic procedure for HS. Considering the difference between clinical diagnosis and routine experimental diagnosis, application of molecular genetic analysis may contribute towards improving the accuracy of HS diagnosis.
Figure 4.
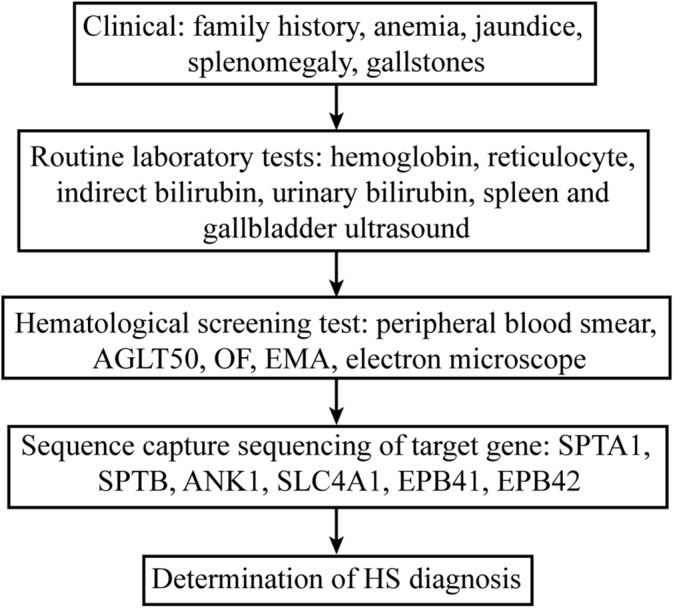
HS diagnostic stepwise process
CONFLICT OF INTEREST
The authors declare no potential conflict of interest.
ACKNOWLEDGMENTS
The authors thank the unselfish cooperation of all patients and also thank for referring their patients to us or helping us in the diagnosis in one way or another. MyGenostics Inc. helped us finish the work of genetic sequence capture sequencing. The laparoscopic surgery and laparotomy of all patients were performed by our excellent general surgeon. This work is the result of collective cooperation. All authors reviewed the manuscript and approved the final version.
Xue J, He Q, Xie X‐J, Su A‐L, Cao S‐B. A clinical and experimental study of adult hereditary spherocytosis in the Chinese population. Kaohsiung J Med Sci. 2020;36:552–560. 10.1002/kjm2.12198
Funding information Key projects of Nanjing Commission of Health, Grant/Award Number: ZKX17025
REFERENCES
- 1. Perrotta S, Gallagher PG, Mohandas N. Hereditary spherocytosis. Lancet. 2008;372(9647):1411–1426. [DOI] [PubMed] [Google Scholar]
- 2. Mohandas N, Gallagher PG. Red cell membrane: Past, present, and future. Blood. 2008;112(10):3939–3948. [DOI] [PMC free article] [PubMed] [Google Scholar]
- 3. Da Costa L, Galimand J, Fenneteau O, Mohandas N. Hereditary spherocytosis, elliptocytosis, and other red cell membrane disorders. Blood Rev. 2013;27(4):167–178. [DOI] [PubMed] [Google Scholar]
- 4. Barcellini W, Bianchi P, Fermo E, Imperiali FG, Marcello AP, Vercellati C, et al. Hereditary red cell membrane defects: Diagnostic and clinical aspects. Blood Transfus. 2011;9(3):274–277. [DOI] [PMC free article] [PubMed] [Google Scholar]
- 5. Wang C, Cui Y, Li Y, Liu X, Han J. A systematic review of hereditary spherocytosis reported in Chinese biomedical journals from 1978 to 2013 and estimation of the prevalence of the disease using a disease model. Intract Rare Dis Res. 2015;4(2):76–81. [DOI] [PMC free article] [PubMed] [Google Scholar]
- 6. King MJ, Garçon L, Hoyer JD, Iolascon A, Picard V, Stewart G, et al. ICSH guidelines for the laboratory diagnosis of nonimmune hereditary red cell membrane disorders. Int J Lab Hematol. 2015;37(3):304–325. [DOI] [PubMed] [Google Scholar]
- 7. Mayeur‐Rousse C, Gentil M, Botton J, Thibaut MF, Guitton C, Picard V. Testing for hereditary spherocytosis: A French experience. Haematologica. 2012;97(12):48–49. [DOI] [PMC free article] [PubMed] [Google Scholar]
- 8. Farias MG. Advances in laboratory diagnosis of hereditary spherocytosis. Clin Chem Lab Med. 2017;55(7):944–948. [DOI] [PubMed] [Google Scholar]
- 9. Bolton‐Maggs PHB, Stevens RF, Dodd NJ, Lamont G, Tittensor P, King MJ, et al. Guidelines for the diagnosis and management of hereditary spherocytosis. Br J Haematol. 2004;126(4):455–474. [DOI] [PubMed] [Google Scholar]
- 10. Choi HS, Choi Q, Kim JA, Im KO, Park SN, Park Y, et al. Molecular diagnosis of hereditary spherocytosis by multi‐gene target sequencing in Korea: Matching with osmotic fragility test and presence of spherocyte. Orphanet J Rare Dis. 2019;14(1):114. [DOI] [PMC free article] [PubMed] [Google Scholar]
- 11. Russo R, Andolfo I, Manna F, Gambale A, Marra R, Rosato BE, et al. Multi‐gene panel testing improves diagnosis and management of patients with hereditary anemias. Am J Hematol. 2018;93(5):672–682. [DOI] [PubMed] [Google Scholar]
- 12. Xue Y, Ankala A, Wilcox WR, Hegde MR. Solving the molecular diagnostic testing conundrum for Mendelian disorders in the era of next‐generation sequencing: Single‐gene, gene panel, or exome/genome sequencing. Genet Med. 2015;17(6):444–451. [DOI] [PubMed] [Google Scholar]
- 13. King MJ, Behrens J, Rogers C, Flynn C, Greenwood D, Chambers K. Rapid flow cytometric test for the diagnosis of membrane cytoskeleton‐associated haemolytic anaemia. Br J Haematol. 2000;111(3):924–933. [PubMed] [Google Scholar]
- 14. Fairbanks G, Steck TL, Wallach DF. Electrophoretic analysis of the major polypeptides of the human erythrocyte membrane. Biochemistry. 1971;10(13):2606–2617. [DOI] [PubMed] [Google Scholar]
- 15. Park ES, Jung HL, Kim HJ, Park SS, Bae SH, Shin HY, et al. Hereditary hemolytic anemia in Korea from 2007 to 2011: A study by the Korean hereditary hemolytic anemia working party of the Korean Society of Hematology. Blood Res. 2013;48(3):211–216. [DOI] [PMC free article] [PubMed] [Google Scholar]
- 16. Li J, Huang Z, Xu Y, Zhou H, Han F, Gong S, et al. Compound heterozygote factor and clinical significance of hemolysis system analysis in the diagnosis of congenital hemolytic anemia: Etiological analysis of 506 cases of anemia and jaundice. J Clin Hematol. 2005;18(4):204–206. [Google Scholar]
- 17. Higgins JM. Red blood cell population dynamics. Clin Lab Med. 2015;35(1):43–57. [DOI] [PMC free article] [PubMed] [Google Scholar]
- 18. Dacie JV, Lewis SM, Luzatto L. Investigation of the hereditary haemolytic anaemias: Membrane and enzyme abnormalities. In: Dacie JV, Lewis SM, editors. Practical Haematology. Edinburgh: Churchill Livingstone, 1991; p. 195–225. [Google Scholar]
- 19. Kedar PS, Colah RB, Kulkarni S, Ghosh K, Mohanty D. Experience with eosin‐5′‐maleimide as a diagnostic tool for red cell membrane cytoskeleton disorders. Clin Lab Haematol. 2003;25(6):373–376. [DOI] [PubMed] [Google Scholar]
- 20. Arora RD, Dass J, Maydeo S, Arya V, Radhakrishnan N, Sachdeva A, et al. Flow cytometric osmotic fragility test and eosin‐5′‐maleimide dye‐binding tests are better than conventional osmotic fragility tests for the diagnosis of hereditary spherocytosis. Int J Lab Hematol. 2018;40(3):335–342. [DOI] [PubMed] [Google Scholar]
- 21. Bianchi P, Fermo E, Vercellati C, Marcello AP, Porretti L, Cortelezzi A, et al. Diagnostic power of laboratory tests for hereditary spherocytosis: A comparison study in 150 patients grouped according to molecular and clinical characteristics. Haematologica. 2012;94(4):516–523. [DOI] [PMC free article] [PubMed] [Google Scholar]
- 22. Bolton‐Maggs PHB, Langer JC, Iolascon A, Tittensor P, King MJ. Guidelines for the diagnosis and management of hereditary spherocytosis – 2011 update. Br J Haematol. 2012;156(1):37–49. [DOI] [PubMed] [Google Scholar]
- 23. An X, Mohandas N. Disorders of red cell membrane. Br J Haematol. 2008;141(3):367–375. [DOI] [PubMed] [Google Scholar]
- 24. Peng GX, Yang WR, Zhao X, Jin LP, Zhang L, Zhou K, et al. The characteristic of hereditary spherocytosis related gene mutation in 37 Chinese hereditary spherocytisis patients. Zhonghua Xue Ye Xue Za Zhi. 2018;39(11):898–903. [DOI] [PMC free article] [PubMed] [Google Scholar]
- 25. Wang R, Yang S, Xu M, Huang J, Liu H, Gu W, et al. Exome sequencing confirms molecular diagnoses in 38 Chinese families with hereditary spherocytosis. Sci China Life Sci. 2018;61(8):947–953. [DOI] [PubMed] [Google Scholar]