



Abstract
In this paper, the authors describe an experimental study carried out on biological samples consisting of a 96-h mature Methicillin-Resistant-Staphylococcus-Aureus biofilm. The initial objective was to electrically characterize the biofilm using impedance spectroscopy, by scanning a wide range of frequencies [1 Hz ÷ 10 MHz]. Concurrently, confocal microscopy observations, XTT assays, crystal violet staining method and colony-forming unit assay were performed to characterize the biological activity. The experimental investigation unexpectedly demonstrated that the reproducibility of measurement data was significantly affected by the destructive interaction between the electric field and the biofilm. This interaction was found to be strongly dependent on both the amplitude of the field and the exposure time. Moreover, a significative reduction of total biomass of the biofilm was found in a specific frequency range [10 kHz ÷ 100 kHz]. The results suggest several limitations of impedance spectroscopy as a tool for biofilm identification, since the “sample under test” must not be altered during the measurement process. Conversely, they demonstrate the deleterious impact of the electric field on the biofilm, thereby unveiling a potentially efficacious therapeutic paradigm for biofilm treatment. We expect that the open issues highlighted in this paper will be a source of inspiration for further understanding of the mechanism of interaction between the electric field and biofilm, both in terms of treatment and diagnosis.
Subject terms: Biofilms, Diseases, Engineering
Introduction
Bacterial infections drastically affect human health, accounting for 65% and 80% of microbial and chronic infections, respectively1. Over recent decades, the dramatic increase in nosocomial diseases sustained by Multi-Drug-Resistant (MDR) bacteria has gravely impacted all aspects of modern medicine, by reducing the success rate of surgical procedures and by increasing patient morbidity and mortality2,3. The severity of these medical conditions is worsened by the ability of bacteria or fungi to produce a biofilm, a community of micro-organisms irreversibly attached to a biological or inert surface and encased into a slime produced by the micro-organisms themselves4,5, that allows them to resist to host immune responses, common antibiotics, and decontamination methods6. Furthermore, biofilm reduces the diagnostic accuracy of the available tools to detect the septic process, thus transforming this condition into a difficult-to-diagnose and treat disease7. The interaction between an appropriate electric field and a biofilm is widely studied to overcome this issue. Electrochemical Impedance Spectroscopy (EIS) may represent a promising solution for the non-invasive detection of microbial biofilm (biofilm electrical sensing). EIS is based on testing an electrochemical system in equilibrium by applying a sinusoidal signal (AC voltage or AC current) over a wide range of frequencies and monitoring the sinusoidal response (current or voltage) of the system to the applied perturbation8–14. However, the impedance spectrum resulting from the EIS procedure can only be trusted if the system under test is time-invariant, which means that its state does not change during the measurement process. In biofilm sensing, “time-invariant” is synonymous of “non-destructive” interaction between the electric field and the biofilm. Unfortunately, the electric field exposure time, amplitude, and frequency range may strongly influence biofilm characteristics, thus resulting in questionable identification of the biofilm electrical features15–22. Furthermore, most papers focus on the relationship between the electric field and the different biofilm phases, but none evaluates the effect on the 96-h mature biofilm, which is the real challenge in medicine as it is involved in all chronic infections23. In clinical practice, an immature biofilm is responsible for acute infections23 and it has typically a higher metabolic activity and a less robust extracellular matrix. For this reason, it is more susceptible to debridement, either mechanical or chemical and antibiotic treatment, making the treatment more effective in eradicating the infection. Conversely, in the case of chronic infections, removal of all devitalized material and foreign bodies containing mature biofilm in conjunction with antibiotic treatment may be insufficient, resulting in a high risk of recurrent infection. It is thus clear that a deep investigation on the effects of electric fields on biofilms may facilitate the design of technological applications to improve the management of infection processes. In such a context, a suitable experimental setup was designed and built to study the effects of electric fields on 96-h mature biofilm of Methicillin-Resistant Staphylococcus aureus (MRSA). The decision to evaluate the effect of the electric field on bacterial biofilms, focusing exclusively on staphylococci, derives from two main reasons. The primary objective was to evaluate the role of different parameters of the electric field, including frequencies, amplitudes, and exposure times, in the interaction between electric field and biofilm, precluding the incorporation of additional bacterial strains that might introduce new variables affecting the results and their interpretation. The second reason is more clinical-related. Staphylococci are the most frequently identified strains in surgical site infections and biofilm infections in the orthopedic field (peri-prosthetic joint infection). Furthermore, S. aureus strains are the most prevalent microorganisms associated with worse outcomes in terms of disease recurrence, thus representing a significant challenge for antibiotic prophylaxis24–26. The present paper is dedicated to illustrate the proposed setup and comment the results obtained during the experimental study in order to evaluate: i) the effect of two different applied rms electric field amplitudes (1250 mV/cm vs. 12.5 mV/cm) in a wide frequency range from 10 Hz to 10 MHz; ii) the effect of three different electric field exposure times for each rms value considered. In addition, preliminary tests were carried out to identify a narrower frequency range where the effects of the electric field application are particularly evident. The interaction between the electric field and the 96-h mature S. aureus biofilm was quantified by a combination of quantitative and qualitative methods. In particular: i) residual microbial metabolic activity through the XTT reduction assay; ii) biofilm biomass through crystal violet (CV) staining method; iii) live bacterial density by the colony-forming unit (CFU) assay. In addition, the biofilm growth was evaluated using Confocal Laser Scanning Microscope (CLSM) analysis.
Methods
Experimental setup
With the aim of exploring the biofilm electrical response, the experimental setup shown in Fig. 1 has been properly designed and built in the Circuit Laboratory of the University of Naples Federico II.
Fig. 1.
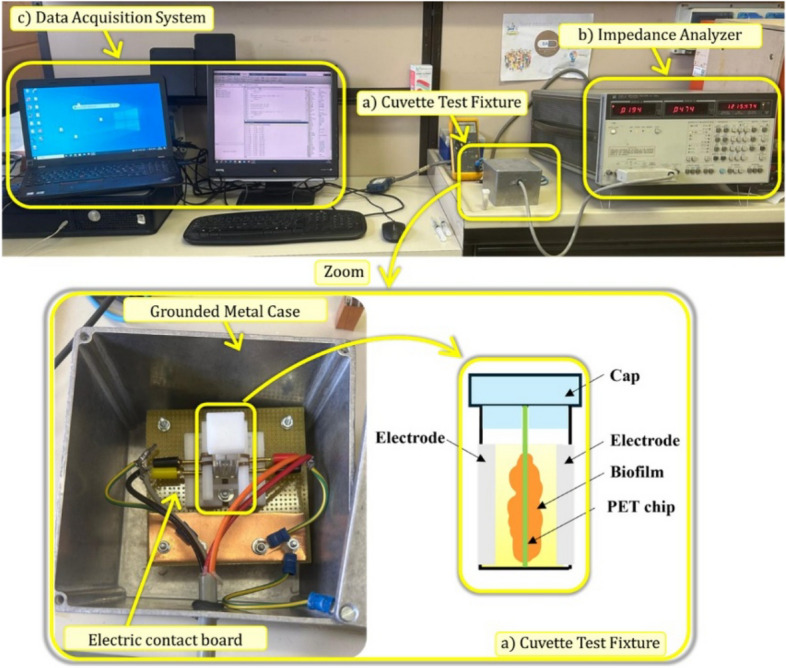
Experimental setup.
Its main elements are: a) Cuvette Test fixture, b) Impedance Analyzer, and c) Data Acquisition System. The Cuvette Test fixture consists of a Gene Pulser/MicroPulser Cuvette (P1652088, Bio-Rad laboratories, Hercules, CA, USA) realized with plane parallel stainless steel electrodes geometry, used to guarantee a uniform electric field. The gap between the two electrodes is 0.4 cm. Between the two electrodes, a 500 μm thick PolyEthylene Terephthalate (PET) chip or slide (rectangular parallelepiped shape) with dimensions of 10 mm × 30 mm (width × length) is inserted upright; such a surface is suitable for biofilm growth according to the procedure described in the following. The proposed Cuvette Test fixture is equipped with: i) electric contact board for the connection with the Impedance Analyzer; ii) a grounded metal case for electromagnetic shielding. Four-terminal-pair measurements were performed using a remote-controlled Impedance Analyzer (HP4192A, Hewlett-Packard, Palo Alto, CA, USA) that is able to apply a sinusoidal voltage with rms value ranging from 5 mV up to 1 V, in the frequency range from 5 Hz up to 13 MHz. Open-ended co-axial probes were used to interface the measuring equipment with the sample cell in all cases. Proper test leads with BNC connector (HP164048A, Hewlett-Packard, Palo Alto, CA, USA) were used as an interface system. The Data Acquisition System consists of a commercial National Instruments USB controller (GPIB-USB-HS, National Instruments, Austin, Texas, USA) that allows to control the entire setup and to back up the experimental data in MATLAB environment (R2024a, Natick, Massachusetts, USA). The proposed experimental setup is then able to remotely control the voltage, the frequency, and the exposure time, which are the main factors affecting biofilm properties (e.g. morphology, initial adhesion, detachment, etc.)15–20.
Bacterial strain
The study was performed using the MRSA reference strain ATCC 43,300. S. aureus strain was grown at 37 °C for 24 h in Brain–Heart Infusion (BHI) broth (Becton Dickinson Diagnostic Systems, Sparks, MD, USA). Aliquots were frozen in BHI 15% glycerol at − 80 °C, until use. The identification was carried out based on its biochemical profile using automatic systems (VITEK2, bioMérieux, Marcy l’Étoile, France) and proteomic profile by MALDI-TOF MS (Bruker Daltonics, Bremen, Germany). Antibiotic susceptibility was evaluated by VITEK2 and disk diffusion method. S. aureus ATCC 43,300 was screened before starting the study, to test its ability to produce biofilm using the spectrophotometric microtiter-plate assay described in27.
Biofilm growth
Bacterial biofilm was grown on the upper surface of sterile PET slides with the dimension of 10 mm × 30 mm × 0.5 mm. S. aureus was cultured onto blood-agar plates at 37 °C under aerobic conditions. After 18–20 h, the strain was subcultured in BHI broth to obtain a 0.5 McFarland suspension (corresponding to approximately 108 CFU/mL). These slides were then immersed in aliquots of bacterial suspension diluted by a factor of 1:100 in fresh media (BHI), supplemented with 1% glucose and incubated in aerobic conditions at 37 °C under static conditions. The medium was replaced with fresh BHI supplemented with 1% glucose every 24 h and biofilm was allowed to grow for 96 h.
Biofilm electrical exposure procedure (BEEP)
The electrical exposure procedure involves two consecutive phases: Compensation Phase (CP) and Test Phase (TP). Both procedures are performed over the entire frequency range considered (10 Hz to 10 MHz). The logarithmic sweep mode with ten frequency steps per decade has been considered not only in the CP (ZERO offset procedure) but also in the TP. The Test Phase starts at the end of the compensation phase and lasts a few minutes. The duration of TP, called Electrical Exposure Time (EET = 2 min), has been obtained by summing up the exposure time associated to each considered frequency. It is worth noting that the exposure time of 2 min corresponds to a typical time interval in which a complete scan of the applied voltage (from 10 Hz up to 10 MHz) is carried out during Electrochemical Impedance Spectroscopy measurements. Moreover, TP was conducted by applying two different rms voltage values (AC analysis): 500 mV and 5 mV (corresponding to 1250 mV/cm and 12.5 mV/cm applied AC electric field over the 0.4 cm distance between the electrodes, respectively). These values were selected based on the potential limit of electrolysis28,29. The experimental campaign was conducted by applying the voltage to the cuvettes, each filled with 1 ml of 0.9% NaCl solution, in which a single slide with 96 h mature S. aureus biofilm was inserted. Specifically, the cuvettes were divided into four sets: the first set corresponding to biofilms exposed for EET1 = 2 min; the second set with biofilms exposed for EET2 = 4 min; the third set to biofilms exposed for EET3 = 6 min; lastly, the fourth set included untreated slides as positive controls. After electrical exposure, all treated and untreated slides were removed from the cuvettes and gently washed with PBS (Phosphate-Buffered Saline). Each assay was performed in triplicate. Evaluation of residual biofilms was performed by various quantitative biological assays and visualized by microscopic confocal acquisition. Moreover, in order to obtain targeted frequency analysis, a preliminary experimental campaign was executed with three distinct Sub-Ranges (SRs), selected within the frequency range that had previously undergone testing: SR1 (10 Hz–1 kHz), SR2 (1 kHz–100 kHz), SR3 (100 kHz–10 MHz). The logarithmic sweep mode with ten frequency steps per decade has been considered. Consequently, the exposure time varies for each frequency sub-ranges under investigation. The cuvettes were divided into four sets for the experimental procedure: the first set included slides subjected to SR1; the second set was exposed to SR2; the third set underwent SR3; the fourth set included treatment-free slides as positive controls. The applied voltage RMS value was determined to be 5 mV. Subsequent to the electrical exposure procedure, all treated and untreated slides were removed from the cuvettes and gently washed with PBS. Each test was performed in triplicate. The biofilm activity (on the slides) was quantified by means of different biological characterization techniques.
Confocal Laser Scanning Microscope (CLSM) biofilm analysis
Biofilms were evaluated using the LIVE/DEAD Bacteria Viability stains (Life Technologies, Monza, Italy), which consist of a mixture of green-fluorescent nucleic acid stain SYTO 9 and red-fluorescent nucleic acid stain Propidium Iodide (PI). The first green-fluorescent dye (SYTO 9) crosses all bacterial membranes and binds to the DNA of both Gram-positive and Gram-negative bacteria. The second dye is red-fluorescent PI that crosses only damaged bacterial membranes (dead bacteria). Stained biofilms on test and controls slides were visualized by CSLM (ZEISS, Arese, Milano, Italy). A 488-nm laser line was used to excite Syto9 and its fluorescent emission was detected in the range [500–540] nm. PI was excited with a 561 nm laser line and its fluorescent emission was detected in the range [600–695] nm. Images from three randomly selected areas were acquired for each support. Sequential optical sections of 1 μm were collected along the z-axis over the complete thickness of the sample.
3-bis(2-methoxy-4-nitro-5-sulfo-phenyl)-2H-tetrazolium-5-carboxanilide (XTT) assay
The XTT assay is used to measure cellular metabolic activity as an indicator of cell viability. This colorimetric assay is based on the reduction of a yellow tetrazolium salt to an orange/red formazan dye by metabolically active cells. XTT cell proliferation Kit II was purchased from Roche Diagnostics. After the treatment, the slides were thoroughly washed with PBS. Each treated and untreated slide was put in a vial filled with XTT solution; all the vials were incubated in the dark for 3 h at 37 °C under static conditions. Absorbance of formazan produced by the reduction of XTT was measured spectrophotometrically at 490 nm using a microtiter plate reader (Bio-Rad). The optical density of each treated slide was normalized to that of the untreated control, which was considered to be 100%.
Crystal Violet assay
The total biomass of the biofilm was analysed using the Crystal Violet (CV) staining method. After the electrical exposure procedure, treated and untreated slides were first washed with PBS to remove non-adherent cells and dried for 45 min at 60 °C. The biofilms were stained by incubation for 20 min with 1% crystal violet solution. After incubation, excess of crystal violet was removed by washing with PBS and then all the slides were treated with absolute ethanol to release the dye from the biofilms. The absorbance was measured at 595 nm by a microplate reader and was related to the amount of biofilm present. The ratios of treated biofilms were normalized to that of the untreated control, which was considered to be 100%.
Colony-forming units (CFUs) assay
The efficacy of BEEP against S. aureus biofilm was assessed by quantifying colony-forming units (CFUs). Untreated control and treated slides were gently washed with PBS to remove non-adherent cells. The slides were subsequently treated with a 0.1% dithiothreitol (DTT) solution and vortexed for 5 min. Serial dilutions of each sample were plated on Mueller–Hinton agar. After incubation at 37 °C for 18–20 h, colony counts were performed. CFU/mL were expressed using exponential notation. The percentage of cellular death was calculated using as [100—(CFUT / CFUC × 100)], where CFUC represents the CFU of the control, and CFUT represents the CFU of the test sample.
Statistical analysis
Experimental data were summarized using mean values and standard deviations. The antibiofilm activity for each EET and different rms voltage values was calculated and expressed as a reduction in biofilm metabolic activity and residual biomass. Colony counts were also reported as mean values and standard deviations. Data were analyzed by using a one-way analysis of variance, followed by Tukey’s post hoc test. This test was used, primarily, to compare: (i) the effect of the electric field at a different electric exposure time (EET1, EET2, and EET3) and (ii) the effect of the electric field at a different rms voltage value (5 mV vs. 500 mV) at the same electrical exposure time. In both cases, a frequency sweep test (frequency range of 10 Hz–10 MHz) was carried out. Furthermore, antibiofilm activity for each frequency sub-range (SR1, SR2, and SR3) was evaluated and expressed as both residual biomass and viable cell reduction. Finally, for statistically significant differences, we performed a post hoc test as a subgroup analysis to highlight the differences between groups. The level of significance (analysis of variance (ANOVA P) was set at ANOVA P < 0.05. The IBM SPSS Statistics for Windows, Version 23.0 (IBM Corp., Armonk, NY, USA) was used for database construction and statistical analysis.
Results
Effects of BEEP at two different voltage values: 5 mV vs. 500 mV
The effect of different amplitude applied voltages (5 mV vs. 500 mV) on S. aureus biofilm was also evaluated through different methods. CV staining evaluates biofilm biomass but does not differentiate between live and dead bacteria within the biofilm. XTT assay and CFU assay assess cell viability and CSLM allows the visual inspection of the biofilms. A 500 mV electrical exposure procedure resulted in a statistically significant reduction in total biomass, metabolic activity, and viable cell count (ANOVA P < 0.05) compared to the corresponding values, obtained by applying a 5 mV electrical exposure procedure at three exposure times. In particular, we observed a reduction in CFU of at least 90% after the application of 500 mV compared to the reduction obtained with an applied voltage of 5 mV at different exposure times (ANOVA P < 0.001). For the reader’s convenience, Table 1 compares the results obtained with the two procedures considered.
Table 1.
Effect of electrical exposure procedures (500 mV vs 5 mV) on 96-h mature S. aureus biofilm at three different EETs: the average percentages of residual metabolic activity and the average percentages of residual biomass were detected with the XTT test and the CV test, respectively.
| EET1 | EET2 | EET3 | |||||||
|---|---|---|---|---|---|---|---|---|---|
| 5 mV | 500 mV | ANOVA P-value | 5 mV | 500 mV | ANOVA P-value | 5 mV | 500 mV | ANOVA P-value | |
| XTT Assay | 89.6 ± 0.21 | 43.3 ± 0.76 | < 0.001 | 88.4 ± 0.34 | 40.2 ± 0.88 | < 0.001 | 42.4 ± 0.21 | 35.3 ± 0.93 | 0.002 |
| CV Assay | 78.9 ± 0.14 | 34.7 ± 1.29 | < 0.001 | 73.9 ± 0.14 | 31.9 ± 1.39 | < 0.001 | 45.9 ± 0.19 | 31.2 ± 0.47 | < 0.001 |
| CFU Counts | 7.22 × 10⁸ ± 0.02 | 7.1 × 10⁷ ± 0.21 | < 0.001 | 7.0 × 10⁸ ± 0.01 | 1.2 × 10⁷ ± 0.04 | < 0.001 | 1.0 × 10⁸ ± 0.02 | 9.7 × 10⁶ ± 0.02 | < 0.001 |
CFU/mL counts after exposure to the electric field were reported.
Effect on the biofilm metabolic activity
The effect of BEEP on biofilm metabolic activity was evaluated using the XTT assay. Compared to the untreated control, electrical exposure at 500 mV resulted in a statistically significant decrease in the metabolic activity of mature S. aureus biofilm for all exposure times (EET1, EET2 and EET3). It is interesting to note that the metabolic activity is influenced both by the exposure time and amplitude of the applied electric field. In fact, at 500 mV, the major effect is observed after the application of BEEP for EET3, which showed a lower residual metabolic activity compared to EET1 (35.3 ± 0.93 vs 43.3 ± 0.76, ANOVA P = 0.138), and to EET2 (35.3 ± 0.93 vs 40.2 ± 0.88, ANOVA P = 0.138). Moreover, differently from the previous experiment, when biofilms were subjected to an electrical procedure at 5 mV, a statistically significant difference in metabolic activity was only obtained for exposure times equal to EET3, detecting an average residual metabolic activity of 42.4%; in the other two cases (EET1 and EET2), the residual metabolic activity detected was not lower than 88%.
Effect on the biofilm biomass
The application of the 500 mV electrical exposure procedure resulted in a significant reduction in residual biofilm biomass compared to controls (ANOVA P < 0.001), as assessed by CV staining (Table 1). A residual biomass lower than 40% is observed when biofilms are treated with the electric field. Specifically, total residual biomass amounted to 34.7% after EET1, 31.9% after EET2 and 31.2% after EET3, without statistically significant differences between EET2 and EET3. Conversely, the application of the 5 mV electrical exposure procedure induced a time-dependent effect, with an average percentage of residual biomass detected of 78.9% after EET1, 73.9% after EET2 and 45.9% after EET3. It is noteworthy that the application of 5 mV for EET3 resulted in a significantly greater reduction compared to EET1 and EET2.
Antibiofilm effect through colony-forming unit counts
The impact of the 500 mV electrical exposure procedure on mature biofilm was assessed by enumerating colony-forming units, as depicted in Table 1. The findings demonstrate, again, that the electric field’s effect is time-dependent, with a decline in viable cell count observed as exposure duration increases (ANOVA P < 0.001). Specifically, the electric field application resulted in a reduction of CFU by at least 92.5% compared to the control after EET1, at least 98.7% after EET2, and at least 98.9% after EET3 (ANOVA P < 0.001). When a 5 mV electrical exposure procedure was applied, no statistically significant differences in the reduction of viable cells were observed after EET1 and EET2 (7.22 × 10⁸ ± 0.02 vs. 7.0 × 10⁸ ± 0.01, ANOVA P = 0.12). The only statistically significant result was obtained for an exposure time of EET3, where the CFU counts are sensibly lower.
Confocal microscopy analysis
To visualize the effect of the electrical exposure procedure on the mature S. aureus biofilms, the untreated and treated biofilms were also stained using the LIVE/DEAD Viability Kit and imaged under a confocal laser scanning microscope. The images obtained after exposure to the 500 mV electric field (Fig. 2) showed that already after 2’ there was a relevant reduction in the biomass adhering to the slide, and the effect was even more evident after 4’ and 6’.
Fig. 2.

Confocal microscopy images of 96-h mature S. aureus preformed biofilm subjected to 500 mV electrical exposure procedures with different exposure times (EET1, EET2 and EET3). The results are compared to the control. In particular: (a) untreated 96-h mature S. aureus biofilm (control); (b) biofilm treated for EET1 time; (c) biofilm treated for EET2 time; (d) biofilm treated for EET3 time.
The images obtained after exposure to the 5 mV electric field (Fig. 3) showed that after 2’ and 4’ the biofilm is slightly modified, still covering the entire surface of the slide but with small areas of lower density. However, after 6’ exposure to the 5 mV electric field, large areas of the slide are not covered by biofilm.
Fig. 3.

Confocal microscopy images of 96-h mature S. aureus preformed biofilm exposed to 5 mV electrical exposure procedures with different exposure times (EET1, EET2 and EET3). The results are compared to the control. In particular: (a) untreated 96-h mature S. aureus biofilm (control); (b) biofilm treated for EET1 time; (c) biofilm treated for EET2 time; (d) biofilm treated for EET3 time.
Effects of a 5 mV BEEP at three different frequency sub-ranges
This section presents the preliminary experimental findings conducted on three distinct frequency sub-ranges, designated as SR1 ([10 Hz to 1 kHz]), SR2 ([1 kHz to 100 kHz]), and SR3 ([100 kHz to 10 MHz]). This analysis wants to explore the extents of bioimpedance spectroscopy for biofilm characterization and diagnosis purposes and aims at identifying a preliminary subrange where the detrimental effect of the electric field is so high to prevent the use of such a technique as a diagnostic tool. For each frequency range, three consecutive 5 mV electrical exposure procedures were considered for each frequency range. As demonstrated in Fig. 4, the frequency range that exhibited a significant decrease in residual bacterial biomass was SR2, which reached percentage values greater than 60%.
Fig. 4.
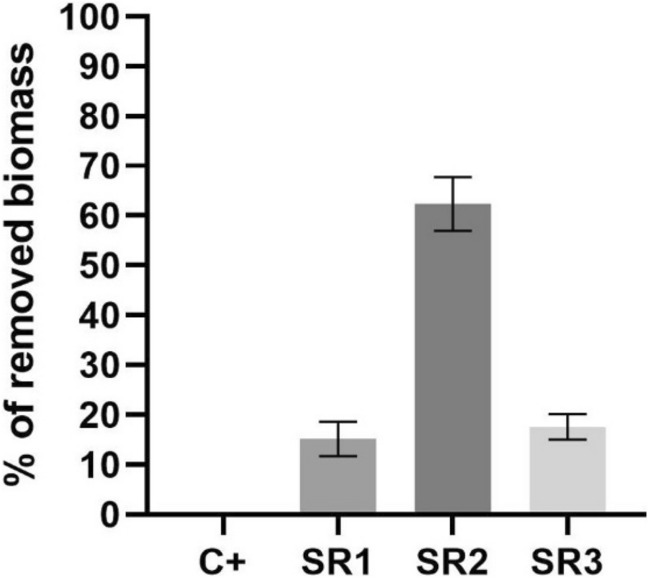
96-h mature S. aureus biofilm biomass quantification using the crystal violet staining method after three consecutive 5 mV electrical exposure procedures, which were conducted on three distinct frequency sub-ranges (SR1, SR2, and SR3). The error bars represent the standard deviation over the replicates of the experiments.
This frequency range exhibited a significantly higher percentage value than the other two (SR1 and SR3). The mean percentage values for SR1, SR2, and SR3 were 15.2 ± 3.42, 62.3 ± 3.42 and 17.57 ± 3.42, respectively. An analysis of variance (ANOVA) was performed, and a P-value less than 0.001 was obtained, indicating a statistically significant difference between the groups. However, no significant differences were observed in the percentage of removed biomass between SR1 and SR3 (15.2 ± 3.42 vs. 17.57 ± 3.42, ANOVA P = 0.65). In addition, the highest percentage of CFU reduction was observed in the same frequency range SR2 compared to the control and lower/higher range of frequencies (Fig. 5).
Fig. 5.
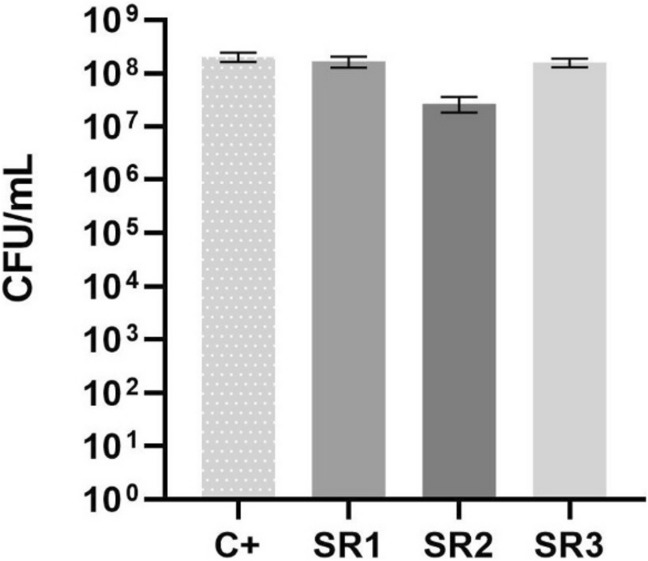
Reduction in viable cells as measured by the colony-forming unit (CFU) assay after three consecutive 5 mV electrical exposure procedures, which were conducted on three distinct frequency sub-ranges (SR1, SR2, and SR3). The error bars represent the standard deviation over the replicates of the experiments.
Discussion
The main finding of this study is that biofilm electrical characterizations (such as EIS), which at a first sight could seem simple non-destructive procedures, are indeed very tricky measurement processes that can cause biofilm modification. In such cases, electrical characterization attempts would be useless since they would alter the properties of the system under test. In this study, the effect of electric fields of different amplitudes (5 mV vs. 500 mV) on mature S. aureus biofilms was evaluated by various techniques that analyze different aspects of microbial communities and together allow a more complete biofilm evaluation. The different techniques used led to convergent results showing that antibiofilm activity can be induced by the electric field itself, depending on the electric field strength and exposure time. The two methods for assessing cell viability showed that exposure of the biofilm to an electric field of 500 mV significantly reduced S. aureus viability already after 2 min, whereas an electric field of 5 mV had a time-dependent effect on the biofilm with a significant viability reduction only after 6’ exposure. When comparing the results obtained with XTT assay and colony counts, CFUs count proved to be more sensitive than metabolic activity assay in detecting residual viability in such a complex system as a biofilm, but this is also described by Premkumar et al.30. Similar results were obtained by assessing the biomass and visualizing the biofilm through CV staining and CSLM, respectively. In fact, CV staining showed that the percentage of biomass removed increased with exposure time up to 54.1% after EET3, under 5 mV voltage application. Conversely, when applying 500 mV, 65.3% of the biofilm biomass was removed already after EET1. The images for control and treated biofilms by CSLM confirmed these results: the presence of areas of biofilm with very low cell density is consistent with the reduction in biomass and viability shown by the other methods suggesting that the reduction in biofilm cell viability caused by the electric field, as a function of amplitude and time of exposure, might be primarily related to biofilm detachment. Summarizing, the observed inhibitory effect obtained by applying a low rms voltage value (5 mV), significantly increased with exposure time and by raising the rms voltage value (5 mV vs. 500 mV). Moreover, the results show that the destructive interaction between the electric field and the biofilm occurred for all three exposure times. Only a low rms voltage (5 mV or lower) can be used for a limited exposure time to avoid significant changes in the system under test. Some of the hypothetical mechanisms responsible of the biofilm reduction include22: i) increased membrane permeability, ii) electrophoretic enhancement of antimicrobial transport, iii) reduction bacterial growth due to electrolytic generation of oxygen, iv) electrochemical generation of potentiating oxidants, v) increased convective transport due to contraction and expansion of the biofilms, vi) increased transport by electroosmosis, vii) physical removal of the biofilm with electrolytically generated bubbles, viii) inhibition of anaerobic electroactive biofilm and ix) morphological alterations. It is worth noting that the biofilm perturbation did not allow us to find the electric field’s characteristics for biofilm sensing. In fact, it is well known that in any measurement process of chemical, mechanical, thermal, or electrical quantities of a given non-living system, to avoid or limit measurement errors, it is imperative to ensure that the measurement process itself is not able to significantly alter the chemical, mechanical, thermal or electrical properties of the non-living system under test. The above considerations are even more valid when dealing with living systems such as bacterial biofilms. To the best of the authors’ knowledge, few research papers on biofilms deal with electrical characterization techniques specifically designed to preserve the integrity of biofilms. Indeed, such techniques are often called non-contact techniques13,14, in the sense that the two electrodes are placed above the surface (glass and/or PET) with biofilms. The electrodes are not in direct contact with the biofilms under test, as it happens with the experimental arrangement considered in this paper. For example, the results reported in13 were obtained with a peak voltage equal to 50 mV, which, with the electrode configuration and the bacteria chosen in13, as reported, allows to avoid irreversible effects on the biofilms under test. However, such a result is not only due to the particular adopted electrode configuration but also to the adopted voltage peak value, which is most likely lower than the unknown threshold voltage value (below which irreversible effects do not occur) for that electrode configuration and for that kind of biofilm. No evidence is given in13 as to what happens by adopting the same electrode configuration and bacterial biofilms but with higher applied voltages. The same considerations apply when taking into account the exposure time and the frequency range, which, together with the applied voltage rms value, are the main electrical parameters that may strongly influence biofilm properties (e.g., morphology, anaerobic electroactive biofilm activity, initial adhesion, detachment, metabolic activity, etc.)15–20. Some results on this topic indicate that the energy of the electrical signals is the primary factor in determining the efficiency of destructive interaction between the electric field and the biofilm15,21. In other words, on one hand, these considerations pose limitations to use electric fields in biofilm identification or diagnostic processes, but, on the other hand, they pave the way to the effectiveness of a biofilm electrical treatment since it is strongly influenced by both the magnitude of the applied electric field and the exposure time. In this context, scientific literature includes many attempts to try to define an optimal solution for an electrical treatment. For instance, Kim et al.21 suggest using an alternating (AC) electric field with a frequency of 10 MHz. However, Caubet et al.20 state there is no reason to believe that the phenomenon is optimal at this frequency. To find possible effective frequencies, it may be necessary to perform a dielectric spectroscopic analysis in a broader range (i.e., from a few Hz up to 10 MHz) and search for relaxation frequencies. However, as confirmed in this work, the performance of a dielectric spectroscopy is not to be intended as a trivial task, since the definition of suitable values of the electric field parameters is imperative not to alter the biofilm under study. In such a context, Wang et al.17 show that the AC electric field at higher frequencies of 1 kHz to 1 MHz only temporarily inhibited the biofilm. In contrast, the lower frequency of 100 Hz reduced the activity more permanently due to fluid convection in the biofilm driven by electrohydrodynamic force. In contrast, the biofilm removal by the very low-frequency AC (1 Hz) electric field was due to electrolysis of the water. The results reported and discussed in the previous sections may provide a basis for stating that, with a few notable exceptions13,14, most of the results reported in the scientific literature on electrical detection methods for bacterial biofilms (such as electrochemical impedance spectroscopy) may not be generally valid. The motivation behind the above statement is that any electrical characterization of bacterial biofilms ultimately consists of applying an electric field to the biofilm itself. Such an application should not induce antibacterial effects capable of killing, detaching, or destroying a small part of the bacterial biofilm under test. If this were to happen, it is clear that the electrical characterization would become a kind of destructive test for the bacterial biofilm. For example, the analysis of the results reported in this paper clearly shows that, concerning the experimental setup adopted and the bacteria considered (96-h mature S. aureus biofilm), a frequency sweep in the range 10 Hz to 10 MHz with an applied voltage rms value equal to 500 mV is not at all suitable for any diagnostic or characterization purposes, since it effectively represents a severe treatment process for the bacterial biofilm under test. It should be noted that the analysis and discussion presented in this paper are only the preliminary, albeit very important, results of a much more complex, accurate, complete and time-consuming research aimed at answering the following questions:
-
i)
The voltage sweep adopted in this paper was carried out in the frequency range [10 Hz, 10 MHz]. Is it possible to identify a narrower frequency range, or even a single frequency tone, where the effects of the electric field application are particularly evident, and the bacterial biofilm is less resistant to the electric field? Is it possible to identify a frequency range or even a single frequency tone where the effects of electric field application are instead negligible? Indeed a very preliminary attempt of analysis on this aspect has been carried out in this paper, as discussed in Section: Results—Effects of a 5 mV BEEP at three different frequency sub-ranges.
-
ii)
What is the effect of the duration (2 min in this paper) of the total voltage sweep?
-
iii)
What is the effect of the shape of the applied voltage? Are periodic square wave or triangular wave or pulse voltages a better/worse choice and why?
-
iv)
Is it reasonable to hypothesize and therefore study the existence, if any, of a kind of electric field resistance effect similar to the antibiotic resistance effect?
-
v)
Is it possible to identify a universal experimental set-up to be adopted for the electrical characterisation of bacterial biofilms, useful for standardisation purposes and indispensable for making fair comparisons between the results obtained by different researchers?
The open questions listed above certainly deserve in-depth and accurate investigation, since, to the best of the authors’ knowledge, no clear and definitive answers can be found in the scientific literature. Voltage and electric field values, frequency ranges, exposure times, voltage waveform shapes (mainly DC or AC) vary widely, conclusions are often unclear and contradictory among them, and fair comparisons are difficult, if not impossible, because no attempt has been made to standardize the experimental arrangements (Methods). Such issues will be the subject of further research, to be presented and discussed in forthcoming papers.
Conclusion
From a diagnostic and monitoring point of view, the biofilm electrical sensing (such as electrochemical impedance spectroscopy) may be a promising solution for the non-invasive detection of biofilm. The key elements that make such an approach an effective prevention strategy for potential infection processes are: rapidity, reliability, ease to integrate into any type of implantable device and not time-consuming. In terms of criticality, biofilm electrical sensing requires a non-destructive interaction between the measurand and the measurement process. The results presented in this paper, carried out on 96-h mature S. aureus biofilm, show that the above condition is far from being met. In order to assess the effects of the interaction between the electric field and the biofilm, a suitable electrical exposure procedure has been developed. It is able to evaluate: i) the effect of different applied rms voltage amplitudes (500 mV vs. 5 mV in this paper) in a wide frequency range from 10 Hz to 10 MHz and ii) the effect of three different electric field exposure times (EET1, EET2 and EET3) for each rms value considered. A significant reduction in residual biofilm biomass and biofilm metabolic activity has been observed, especially in the case of 500 mV applied voltage value. In addition, the interaction between the electric field and the biofilm leads to a lower cell count by increasing the exposure time. Based on the above considerations, it is clear that the relationship between treatment, diagnosis and real-time monitoring of biofilm-associated infections, especially when electric fields are involved, is largely unexplored and unclear, but its investigation may facilitate the design of technological applications to improve the management of infection processes.
Author contributions
M.B. and G.B. conceived the idea, set up the general design of the study and collected the literature data. M.B., S.M., C.P., M.V., M.R.C., E.R., A.G.C., L.C., M.M. and G.B. drafted the manuscript and analysed the data. M.B and C.P. designed the electrical experimental set-up. M.R.C., E.R., M.A. and U.G. performed all the microbiological experiments. M.B., M.V., C.P., M.R.C., S.M., E.R., M.A., U.G., and G.B. contributed to the review process. G.B. and M.V. were the principal investigators.
Funding
This work was supported in part by the Italian Ministero dell’Università e della Ricerca (MUR) in the framework of “PRIN 2022 – “Progetti di Rilevante Interesse Nazionale” under Grant 2022Z8C472, Project title AMPERE “.
Data availability
All data generated or analysed during this study are included in this published article.
Declarations
Competing interests
The authors declare no competing interests.
Footnotes
Publisher’s note
Springer Nature remains neutral with regard to jurisdictional claims in published maps and institutional affiliations.
Contributor Information
M. Balato, Email: marco.balato@unina.it
E. Roscetto, Email: emanuela.roscetto@unina.it
References
- 1.Jamal, M. et al. Bacterial biofilm and associated infections. J Chin Med Assoc.81(1), 7–11 (2018). [DOI] [PubMed] [Google Scholar]
- 2.Ahmed, S. K. et al. Antimicrobial resistance: Impacts, challenges, and future prospects. J. Med. Surg. Public Health.2, 100081 (2024). [Google Scholar]
- 3.Ignacio Barrasa-Villar, J., Aibar-Remón, C., Prieto-Andrés, P., Mareca-Doñate, R. & Moliner-Lahoz, J. Impact on morbidity, mortality, and length of stay of hospital-acquired infections by resistant microorganisms. Clin. Infect. Diseases65, 644–652 (2017). [DOI] [PubMed] [Google Scholar]
- 4.Donlan, R. M. Biofilms: microbial life on surfaces. Emerg. Infect. Dis.8(9), 881–890 (2002). [DOI] [PMC free article] [PubMed] [Google Scholar]
- 5.Prakash, B., et al. “Biofilms: A Survival Strategy of Bacteria.”Current Science, vol. 85, no. 9, 2003, pp. 1299–307. JSTOR, http://www.jstor.org/stable/24108133. Accessed 8 Oct. 2024.B Prakash, BM Veeregowda, G Krishnappa - Current science, 2003.
- 6.Davies, D. Understanding biofilm resistance to antibacterial agents. Nat. Rev. Drug Discov.2, 114–122 (2003). [DOI] [PubMed] [Google Scholar]
- 7.De Vecchi, E., Bortolin, M., Signori, V., Romanò, C. L. & Drago, L. Treatment with Dithiothreitol improves bacterial recovery from tissue samples in osteoarticular and joint infections. J. Arthroplast.31, 2867–2870 (2016). [DOI] [PubMed] [Google Scholar]
- 8.Lazanas, A. C. & Prodromidis, M. I. Electrochemical impedance spectroscopy─a tutorial. ACS Meas. Sci. A10.1021/acsmeasuresciau.2c00070 (2023). [DOI] [PMC free article] [PubMed] [Google Scholar]
- 9.Balato, M. et al. Detecting and monitoring periprosthetic joint infection by using electrical bioimpedance spectroscopy: A preliminary case study. Diagnostics (Basel).12(7), 1680. 10.3390/diagnostics12071680.PMID:35885583;PMCID:PMC9323083 (2022). [DOI] [PMC free article] [PubMed] [Google Scholar]
- 10.Gutiérrez, D., Hidalgo-Cantabrana, C., Rodríguez, A., García, P. & Ruas-Madiedo, P. Monitoring in real time the formation and removal of biofilms from clinical related pathogens using an impedance-based technology. PLoS One.11(10), e0163966. 10.1371/journal.pone.0163966.PMID:27695058;PMCID:PMC5047529 (2016). [DOI] [PMC free article] [PubMed] [Google Scholar]
- 11.Van Duuren, J. B. J. H. et al. Use of single-frequency impedance spectroscopy to characterize the growth dynamics of biofilm formation in pseudomonas aeruginosa. Sci. Rep.7(1), 5223. 10.1038/s41598-017-05273-5.PMID:28701712;PMCID:PMC5507860 (2017). [DOI] [PMC free article] [PubMed] [Google Scholar]
- 12.McGlennen, M., Dieser, M., Foreman, C. M. & Warnat, S. Using electrochemical impedance spectroscopy to study biofilm growth in a 3D-printed flow cell system. Biosens. Bioelectr.: X14, 100326. 10.1016/j.biosx.2023.100326 (2023). [Google Scholar]
- 13.Turick, C. E., Colon-Mercado, H., Bagwell, C. E., Greenway, S. D. & Amoroso, J. W. Non-contact electrochemical evaluation of biofilms. Appl. Sci.2, 389. 10.1007/s42452-020-2081-0 (2020). [Google Scholar]
- 14.Ameer, S. et al. Electrochemical impedance spectroscopy-based sensing of biofilms: A comprehensive review. Biosensors (Basel).13(8), 777. 10.3390/bios13080777.PMID:37622863;PMCID:PMC10452506 (2023). [DOI] [PMC free article] [PubMed] [Google Scholar]
- 15.Shawki, M. M. et al. Revealing detrimental effects of various DC electrical energy conditions on different multidrug resistant bacteria: A comprehensive study. Sci. Rep.14, 17046. 10.1038/s41598-024-66063-4 (2024). [DOI] [PMC free article] [PubMed] [Google Scholar]
- 16.Kunlasubpreedee, P., Tobino, T. & Nakajima, F. Influence of high-frequency, low-voltage alternating electric fields on biofilm development processes of escherichia coli and pseudomonas aeruginosa. Water15, 3055. 10.3390/w15173055 (2023). [Google Scholar]
- 17.Wang, X. et al. Alternating current influences anaerobic electroactive biofilm activity. Environ. Sci. Technol.50(17), 9169–9176. 10.1021/acs.est.6b00813 (2016) (Epub 2016 Aug 12 PMID: 27485403). [DOI] [PubMed] [Google Scholar]
- 18.Costerton, J. W., Ellis, B., Lam, K., Johnson, F. & Khoury, A. E. Mechanism of electrical enhancement of efficacy of antibiotics in killing biofilm bacteria. Antimicrob. Agents Chemother.38, 2803–2809 (1994). [DOI] [PMC free article] [PubMed] [Google Scholar]
- 19.Jass, J., Costerton, J. W. & Lappin-Scott, H. M. The effect of electrical currents and tobramycin on Pseudomonas aeruginosa biofilms. J. Ind. Microbiol.15, 234–242 (1995). [DOI] [PubMed] [Google Scholar]
- 20.Caubet, R. et al. A radio frequency electric current enhances antibiotic efficacy against bacterial biofilms. Antimicrob. Agents Chemother.48, 4662–4664 (2004). [DOI] [PMC free article] [PubMed] [Google Scholar]
- 21.Kim, Y. et al. Effect of electrical energy on the efficacy of biofilm treatment using the bioelectric effect. npj Biofilms Microbiomes1, 15016. 10.1038/npjbiofilms.2015.16 (2015). [DOI] [PMC free article] [PubMed] [Google Scholar]
- 22.Del Pozo, J. L., Rouse, M. S. & Patel, R. Bioelectric effect and bacterial biofilms A systematic review. Int. J. Artif. Organs.31(9), 786–795. 10.1177/039139880803100906 (2008). [DOI] [PMC free article] [PubMed] [Google Scholar]
- 23.Izakovicova, P., Borens, O. & Trampuz, A. Periprosthetic joint infection: Current concepts and outlook. EFORT Open Rev.4(7), 482–494. 10.1302/2058-5241.4.180092.PMID:31423332;PMCID:PMC6667982 (2019). [DOI] [PMC free article] [PubMed] [Google Scholar]
- 24.Patel, R. Periprosthetic joint infection. N Engl. J. Med.388, 251–262. 10.1056/NEJMra2203477 (2023). [DOI] [PubMed] [Google Scholar]
- 25.Peel, T. N. et al. Trial of vancomycin and cefazolin as surgical prophylaxis in arthroplasty. N Engl. J. Med.389, 1488–1498 (2023). [DOI] [PubMed] [Google Scholar]
- 26.Berríos-Torres, S. I. et al. Centers for disease control and prevention guideline for the prevention of surgical site infection, 2017. JAMA Surg.152(8), 784–791. 10.1001/jamasurg.2017.0904 (2017). [DOI] [PubMed] [Google Scholar]
- 27.Stepanović, S. et al. Quantification of biofilm in microtiter plates: Overview of testing conditions and practical recommendations for assessment of biofilm production by Staphylococci. Apmis.115, 891–899. 10.1111/j.1600-0463.2007.apm_630.x (2007). [DOI] [PubMed] [Google Scholar]
- 28.Bockris, J. O. M. & Reddy, A. K. Modern Electrochemistry (Kluwer Acadamic/Plenum Publishers, 2000). [Google Scholar]
- 29.Neagu, C., Jansen, H., Gardeniers, H. & Elwenspoek, M. The electrolysis of water: an actuation principle for MEMS with a big opportunity. Mechatronics10, 571–581 (2000). [Google Scholar]
- 30.Premkumar, A., Nishtala, S. N., Nguyen, J. T., Bostrom, M. P. G. & Carli, A. V. The AAHKS best podium presentation research award: Comparing the efficacy of irrigation solutions on staphylococcal biofilm formed on arthroplasty surfaces. J Arthroplasty.36(7S), S26–S32. 10.1016/j.arth.2021.02.033 (2021) (Epub 2021 Feb 16 PMID: 33750633). [DOI] [PubMed] [Google Scholar]
Associated Data
This section collects any data citations, data availability statements, or supplementary materials included in this article.
Data Availability Statement
All data generated or analysed during this study are included in this published article.