

Abstract
A water-soluble polysaccharide extracted from Gastrodia elata was chemically modified to generate acetylated and carboxymethylated derivatives. Thourshe conditions for the two modification methods were optimized through single factor and response surface analyses. The optimized conditions for acetylation were 3.4 mL of acetic anhydride, a reaction temperature of 63.4 °C, and a reaction duration of 4 h. For carboxymethylation, the optimal modification parameters were 2.2 g of chloroacetic acid, a temperature of 62.3 °C and a NaOH concentration of 2.2 mol/L. The results of chemical analysis and Fourier transform infrared spectroscopy revealed that these modifications were successfully added, although the molecular weights of the derivatives decreased because of slight degradation during the reactions. The antioxidant and immunomodulatory potentials of the polysaccharide derivatives were assayed to delineate the structure-bioactivity correlations. The results revealed that both acetylation and carboxymethylation of GEP-1 augmented its scavenging efficacy against DPPH radicals, hydroxyl radicals, and superoxide anions, surpassing the antioxidant capacity of the unmodified polysaccharide. Furthermore, the modified derivatives demonstrated minimal cytotoxicity against RAW264.7 macrophages and significantly potentiated the secretion of TNF-α and IL-6 by these cells, indicative of a pronounced immunostimulatory response. These findings suggest that chemical modifications can significantly improve the solubility, antioxidant capacity, and immunomodulatory activity of polysaccharides, thereby enhancing their potential for development and application in the utilization of natural polysaccharide resources.
Keywords: Gastrodia elata polysaccharide, Acetylation, Carboxymethylation, Antioxidant activity, Immunomodulatory activity
Subject terms: Chemical biology, Chemical modification
Introduction
Polysaccharides are complex macromolecules formed from long chains of more than ten monosaccharides interconnected by glycosidic bonds, and they are characterized by their high molecular weights1,2. These biomolecules offer a range of benefits, including biodegradability, low toxicity, cost-effectiveness in production, and availability from numerous sources3–5. In response to the increasing demands for advanced applications, a variety of techniques have been developed to modify polysaccharides, expanding their potential applications. Chemical modification, such as carboxymethylation and acetylation, has gained significant attention due to their potential to enhance or impart new bioactivitie6,7. Carboxymethylation involves the introduction of carboxymethyl groups into the polysaccharide backbone, which can alter the solubility, viscosity, and thermal stability of the polymer8. Acetylation, on the other hand, involves the attachment of acetyl groups to the hydroxyl groups of the polysaccharide, which can affect its intermolecular interactions and biological properties9.
Recent studies have demonstrated the promising bioactive properties of carboxymethylated and acetylated polysaccharides. For instance, carboxymethylated cellulose has been shown to exhibit enhanced antioxidant activity, which is crucial for the development of natural antioxidants in food and pharmaceutical applications10,11. Additionally, carboxymethylated chitosan has been found to possess improved antibacterial properties, making it a viable candidate for wound dressing materials12. Similarly, acetylated derivatives of polysaccharides have been investigated for their anti-inflammatory effects. A study by Wang et al. revealed that acetylated polysaccharide can effectively reduce inflammation in vitro, suggesting their potential use in the treatment of inflammatory diseases13. Moreover, acetylated polysaccharide has been explored for its potential in drug delivery systems due to its enhanced biocompatibility and controlled release properties14. The bioactivity of these modified polysaccharides is not only limited to antioxidant, antibacterial, and anti-inflammatory effects but also extends to other areas such as anticoagulant, antitumor, and immunomodulatory activities. For example, acetylated polysaccharide has been reported to exhibit significant antitumor activity, which could be harnessed for the development of novel cancer therapeutics15.
In our previous research, a polysaccharide from Gastrodia elata (GEP-1) was characterized and suggested to exhibit significant immunomodulatory activity16. To date, the chemical modification of polysaccharides from Gastrodia elata has been limited to sulfated derivatives, which have shown notable increases in antitumour effects over unaltered polysaccharides17. This success highlights the potential of further exploration into alternative modifications. Therefore, there is a compelling rationale to further investigate the acetylation and carboxymethylation of Gastrodia elata polysaccharides, as these modifications may reveal their potential for use in additional therapeutic and functional applications.
In this comprehensive study, GEP-1 was subjected to carboxymethylation and acetylation through precise chemical modification techniques. First, the conditions for the modification reactions were optimized. Second, the structural changes in GEP-1 that occurred due to the modifications were carefully characterized, including assessments of molecular weight, monosaccharide composition, and Fourier transform infrared (FT-IR) spectra. Finally, the antioxidant and immunomodulatory capabilities of the modified GEP-1 derivatives were systematically analysed through radical scavenging assays and in a RAW264.7 cell model. The results of this study clarified the impact of chemical modification on the structural integrity, physicochemical properties, and biological activities of polysaccharides from Gastrodia elata and highlighted the potential for value-added applications of Gastrodia elata polysaccharide derivatives in functional foods and the pharmaceutical industry.
Materials and methods
Materials and chemicals
Gastrodia elata were all identified by prof. Xiangyi Liu in Southwest Forestry University, China. And the samples were preserved in our laboratory. Experimental research and field studies on plants (either cultivated or wild), including the collection of plant material, in compliance with relevant institutional, national, and international guidelines and legislation.
The materials were washed, sliced, air-dried, and crushed into a powder before extraction. DEAE-cellulose 52 and Sephadex G-100 were acquired from Sunresin Co., Ltd. (Xian, China). Lipopolysaccharide (LPS) was obtained from Sigma Chemical Co., Ltd. (St. Louis, MO, USA). Dulbecco’s modified eagle medium (DMEM) with 10% FBS and 1% penicillin–streptomycin and phosphate buffered saline (PBS) were from Hyclone La-boratories Inc. Cell counting kit-8 (CCK-8) was purchased from Wuhan Fine Biotech Co., Ltd. (Wuhan, China). Mouse ELISA kits were from Sigma Chemical Co., Ltd. (St. Louis, MO, USA). Isopropanol and other chemicals were attained from iNational Pharma-ceutical Group Co., Ltd. (Shanghai, China).
Isolation and purification of GEP-1
The polysaccharide was extracted based on previous study17,18. In brief, the Gastrodia elata powder were suspended in 60% ethanol and refluxed at 80 °C for 2.5 h to remove the small molecule composition and oligosaccharide. After cooling and filtering, deionized water was added to the residues and refluxed at 100 °C (the oil bath temperature) for 1 h. This process was repeated twice. Two extracts were combined and concentrated, and then fourfold volume of ethanol (95%, v/v) was added. After standing for 12 h at 4 °C, centrifugation (3500×g for 5 min) was performed to get the crude polysaccharides. Finally, the crude GEPs were subsequently separated by DEAE-cellulose-52 and Sephadex™ G-100 columns and eluted by water to get GEP-1.
Synthesis and condition optimization of acetylated GEP-1
Prepared acetylated GEP-1
The acetylation modification reaction has shown in Fig. 1 and the method used in this study was based on previous literature19,20 and the specific modification conditions will be explored in the next step. 200 mg of GEP-1 was taken and added to 20 mL of pyridine and stirred at 60 °C for 30 min to dissolve the polysaccharide completely. Acetic anhydride (Ac2O) was added and stirred magnetically. After completion of the reaction, 250 mL of deionized water was added to the reaction solution and the reaction solution was concentrated by rotary evaporation and the precipitate was added to 90% volume fraction of ethanol and refrigerated overnight. The supernatant was removed to collect the precipitate, which was redissolved with deionized water, and the resulting liquid was concentrated by spin evaporation at a temperature of 60 °C. Acetylated polysaccharide was obtained by dialyzing with purified water in a 4 kDa dialysis bag for 3 days and freeze-drying the solution.
Fig. 1.
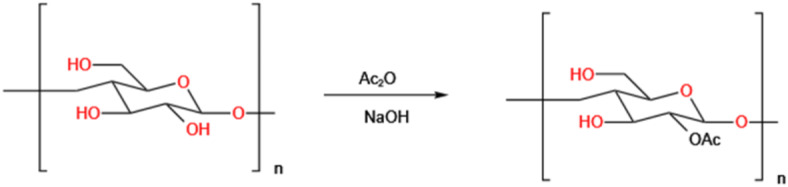
Acetylation reaction equation.
Single-factor experiments for acetylation of GEP-1
The effect of acetic anhydride dosage on substitution degree
With the conditions of reaction time at 4 h, reaction temperature at 60°C,different acetic anhydride dosage (2.5, 5.0, 7.5, 10 and 12.5 mL) were used to assess their specific impact on the degree of acetylation.
-
(2)
The effect of reaction temperature on substitution degree
With the acetic anhydride dosage fixed at 7.5 mL, reaction time at 4 h, the reaction temperature were designed to be 40, 50, 60, 70 and 80 °C for the experiment.
-
(3)
The effect of reaction time on substitution degree
With the acetic anhydride dosage fixed at 7.5 mL, reaction temperature at 60 °C, the reaction time were designed to be 2, 3, 4, 5 and 6 h for the experiment.
Determination of the degree of acetyl substitution
The degree of substitution of the acetyl group was determined by reported method17,18. Approximatively 20 mg of A-GEP was dissolved in 10 mL of NaOH (0.01 mol/L) solution and the mixture was stirred at 50 °C for 2 h to be fully saponified. The indicator was phenolphthalein, and the solution was titrated with HCl (0.1 mol/L) solution until the red color of the liquid disappeared. The original polysaccharide was used as blank group. The degree of substitution (DS) could be calculated using the following formula:
 |
1 |
 |
2 |
V1 is the volume of HCl for blank (ALP-1); V2 is the volume of HCl consumed; C is the concentration of HCl; M is the mass of sample; A is the acetyl content of A-ALP-1.
Synthesis and condition optimization of carboxymethylated GEP-1
Prepared carboxymethylated GEP-1
Carboxymethylation of GEP-1 was obtained based on literature method19 and the reaction equation has shown in Fig. 2. The specific modification conditions will be explored in the next step. The 200 mg of GEP-1 was mixed with 15 mL of isopropanol and stirred vigorously for 30 min at room temperature to dissolve the polysaccharide completely. Carboxymethylation reagent (chloroacetic acid, 5 mL sodium hydroxide and 15 mL of isopropanol) was added and stirred. When the solution was cooled to room temperature, the pH of the solution was adjusted to 7 with 0.5 mol of HCL. The solution was concentrated by spinning and precipitated with 95% ethanol at 4 °C for 12 h. Remove supernatant, and the product was dialyzed (Mw cut off 4 kDa) for 48 h to obtain carboxymethylated polysaccharide.
Fig. 2.

Carboxymethylation reaction equation.
Single-factor experiments for carboxymethylation of GEP-1
The effect of concentration of sodium hydroxide on substitution degree
With the reaction temperature fixed at 60 °C, dosage of chloroacetic acid dosage at 1.89 g, the concentration of sodium hydroxide were designed to be 1, 1.5, 2, 2.5 and 3 mol/L.
-
(2)
The effect of chloroacetic acid dosage on substitution degree
With the reaction temperature fixed at 60 °C, concentration of sodium hydroxide at 2 mol/L, the dosage of chloroacetic acid were designed to be 0.95 g, 1.42 g, 1.89, 2.36 g and 2.83 g.
-
(3)
The effect of reaction temperature on substitution degree
With the acetic anhydride dosage fixed at 7.5 mL, concentration of sodium hydroxide at 2 mol/L, the reaction temperature were designed to be 40, 50, 60, 70, 80 °C.
Determination of the degree of carboxymethyl substitution
The content of carboxymethyl group was determined using the method described in the literature21. Approximatively 10 mg of C-GEP was dissolved in 3 mL of 70% ethanol solution and allowed to stand for 5 min. Then, 50 mL of 0.5 mol/L NaOH solution and 10 mL of ultrapure water were added. The indicator was phenolphthalein, and the solution was titrated with 0.1 mol/L HCl solution until the red color of the liquid disappeared. The original polysaccharide was used as a blank group. The degree of substitution could be calculated using the following formula:
 |
3 |
 |
4 |
C1 is the concentration of NaOH; V1 is volume of NaOH consumed; C2 is the concentration of HCl; V2 is volume of HCl consumed; M is the mass of sample; A is the content of carboxymethyl in the sample.
Response surface experiment for synthesis GEP-1 derivatives
After integrating the findings of the single-factor experiments and the basic principles of the response surface method, this study designed an optimization experiment for the synthesizing GEP-1 derivatives. In acetylation modification, the acetic anhydride dosage, reaction temperature and reaction time were set as independent variables. In carboxymethylation modification, the concentration of sodium hydroxide, dosage of chloroacetic acid and reaction temperature were set as independent variables. The related factors and their levels are detailed in Tables 1 and 2.
Table 1.
Response surface analysis factor design for acetylation.
| Factor | Level | ||
|---|---|---|---|
| Dosage of acetic anhydride (mL) | 5 | 7.5 | 10 |
| Temperature (°C) | 50 | 60 | 70 |
| Reaction time (h) | 3 | 4 | 5 |
Table 2.
Response surface analysis factor design for carboxymethylation.
| Factor | Level | ||
|---|---|---|---|
| Temperature (°C) | 50 | 60 | 70 |
| Dosage of Chloroacetic acid (g) | 1.42 | 1.89 | 2.36 |
| Concentration of Sodium hydroxide (mol/L) | 1.5 | 2 | 2.5 |
Chemical analysis
The total carbohydrate contents of different derivatives of GEP-1 were measured by the phenol‑sulfuric acid method with slight modifications22. The solubility of GEP-1 and its derivatives were determined according to the procedure described previously23. Additionally, the glyoxylate levels were assessed through the sulphuric acid-carbazole technique, and the protein concentration was measured with the Komas Brilliant Blue method.
Monosaccharides analysis
The monosaccharide compositions were analyzed by Ion Chromatography System Thermo ICS5000 (ICS5000, Thermo Fisher Scientific, USA) on a CarboPac PA-20 anion-exchange column (3 by 150 mm; Dionex) using a pulsed amperometric detector (PAD; Dionex ICS 5000 system)24. Briefly, 5 mg of sample was hydrolyzed with 2 M trifluoroacetic acid at 121 °C for 2 h. The sample was dried by nitrogen. Blow dry after adding methanol to the wash, then repeat the methanol and wash 2–3 times. For measurement, the residue was redissolved in deionized water and filtered through a 0.22 m mi-croporous filtering sheet. Fucose, rhamnose, arabinose, galactose, glucose, xylose mannose, fructose, ribose, galacturonic acid, glucuronic acid and mannuronic acid were chosen as standards.
Determination of molecular weight
The monosaccharide compositions of GEP and its derivatives were analyzed by high-performance anion-exchange chromatography (HPAEC) on a CarboPac PA-20 anion-exchange column (3 by 150 mm; Dionex) using a pulsed amperometric detector (PAD; Dionex ICS 5000 system)25. Briefly, 5 mg of the sample was hydrolyzed with 2 M trifluoroacetic acid at 121 °C for 2 h. The sample was dried with nitrogen and blow dried after adding methanol to the wash, then the methanol and wash were repeated two to three times. For measurement, the residue was redissolved in deionized water and filtered through a 0.22 m microporous filtering sheet. Fucose, rhamnose, arabinose, galactose, glucose, xylose mannose, fructose, ribose, galacturonic acid, glucuronic acid and mannuronic acid were chosen as standards.
Fourier-transform infrared (FT-IR) spectroscopy analysis
GEP-1 and its derivatives were mixed with KBr and recorded by a FT-IR spectrophotometer (ALPHA-T, BRUKER Co., DE) in the range of 4000–400 cm−1.
Antioxidant activity
DPPH radical scavenging assay26
2 mL of DPPH-anhydrous (0.1 mg/mL) ethanol solution was added to 1 mL of different concentrations of polysaccharide sample solutions (0.2, 0.4, 0.6, 0.8 and 1.0 mg/mL). The mixed solutions were reacted in a light-proof environment for 40 min and the samples’ absorbance (A0) values were measured at 517 nm. In order to eliminate the error caused by DPPH solution itself, equal volume of anhydrous ethanol was used to replace DPPH solution, and the absorbance A1 was measured. In the blank group experiment, distilled water was used to replace polysaccharide sample solution, and A2 was obtained. VC was used as a positive control group. The DPPH radical clearance rate can be calculated by the following equation.
 |
5 |
A0 represents the absorbance of the sample; A1 represents the absorbance of polysaccharide solution with anhydrous ethanol; A2 represents the absorbance of deionized water with DPPH.
Hydroxyl radical scavenging assay26
1 mL polysaccharide solutions with different concentrations (0.2, 0.4, 0.6, 0.8 and 1.0 mg/mL) were mixed with 1 mL FeSO4 solution (4.5 mmol/L) and 1 mL salicylic acid solution (3 mmol/L), and then stand for 10 min. After that, 1 mL 2.9 mmol/L H2O2 solution was added and reacted in a water bath at 37 °C for 15 min. Absorbance A was measured at 510 nm. In the control group, H2O2 was replaced by equal volume of water; In the blank group, polysaccharide sample solutions were replaced by equal volume water, the other steps were the same as above. VC was used as a positive control group. The scavenging rate of hydroxyl radical was calculated according to equation.
 |
6 |
As represents the absorbance of the sample; Ar represents the absorbance of polysaccharide sample solutions with deionized water; A0 represents the absorbance of deionized water with H2O2.
Superoxide anion scavenging assay26
4.5 mL Tris–HCl buffer (pH8.2, 50 mmol/L) was mixed with 3.9 mL of distilled water, 0.3 mL of (0.2, 0.4, 0.6, 0.8 and 1.0 mg/mL) polysaccharide sample solutions and reacted in a constant temperature water bath at 25 °C and let stand for 20 min, then 0.3 mL of a preheated 45 mmol/L pyrogallol (PR) solution was added at 25 °C and shake quickly. Measure the absorbance of the solution at 325 nm every 30 s for 5 min and calculate the rate of change of absorbance over time. Ascorbic acid (Vc) was added using the same method and tested to serve as a positive control. The superoxide anion radical scavenging rate is calculated according to the following formula:
 |
7 |
A1 represents the rate of change of the absorbance of the sample solution over time; A0 represents the rate of change of the absorbance of the blank solution over time.
Immunomodulatory activity27
Cell culture
The macrophage RAW264.7 cells were cultured in DMEM supplemented with a mixture of 10%(V/V) FBS and 1%(V/V) penicillin–streptomycin in an incubator at 37 °C with 5% CO2. Treatments included control group (CG), lipopolysaccharide group (LPS), GEP-1 and its derivatives. For most experiments, cells were allowed to adhere for 24 h before treatment.
Cell proliferation assay
The proliferation of cells was assessed by CCK-8 assay according to the manufacturer’s instructions. Briefly, cells were diluted to 1 × 10⁴ cells/well in 96-well plates and incubated at 37 °C for 24 h in a 5% CO2 incubator. Polysaccharide samples and LPS (10 μg/mL) were added and incubated at 37 °C for 48 h. At the end of the treatment, 10 μL CCK-8 reagent was added and incubated for 2 h at 37 °C. After incubation the absorbance at 450 nm was measured using a multifunctional microplate meter.
Assay of cytokine secretion
The concentration of RAW 264.7 cells was diluted to 4 × 10⁴ cells/well in 6-well plates and allowed to adhere for 24 h at 37 °C. After pretreatment with the polysaccharide samples or LPS (10 μg/mL) for 48 h, about 1.4 mL of supernatants were collected and stored at − 80 °C. The levels of cytokines including TNF-α and IL-6 secretion in the macrophage culture were estimated through rat enzyme-linked immunosorbent assay (ELISA) kit.
Statistical analysis
Statistical analysis was performed using SPSS 24 software (SPSS Inc., Chicago, USA). Each treatment contains three repetitions, and the average of the three repetitions is taken. Significant differences among treatments were tested with one-way ANOVA at p < 0.05 level. The figures of cellular experiments were drawn with Graphpad prism 8.0 (GraphPad Software, San Diego, California, USA).
Results
Single-factor experimental results
Single-factor acetylation experiments
Dose of acetic anhydride
As shown in Fig. 3A, the degree of substitution rapidly increased with increasing acetic anhydride volume within the range of 2.5–7.5 mL. When the volume of acetic anhydride reached 10 mL, the degree of substitution still slightly increased. However, no significant increase in the degree of substitution was observed when the acetic anhydride volume was increased to 12.5 mL compared with an acetic anhydride volume of 10 mL. Considering all the factors, the optimal volume of acetic anhydride was determined to be 7.5 mL.
-
(2)
Reaction temperature
Fig. 3.
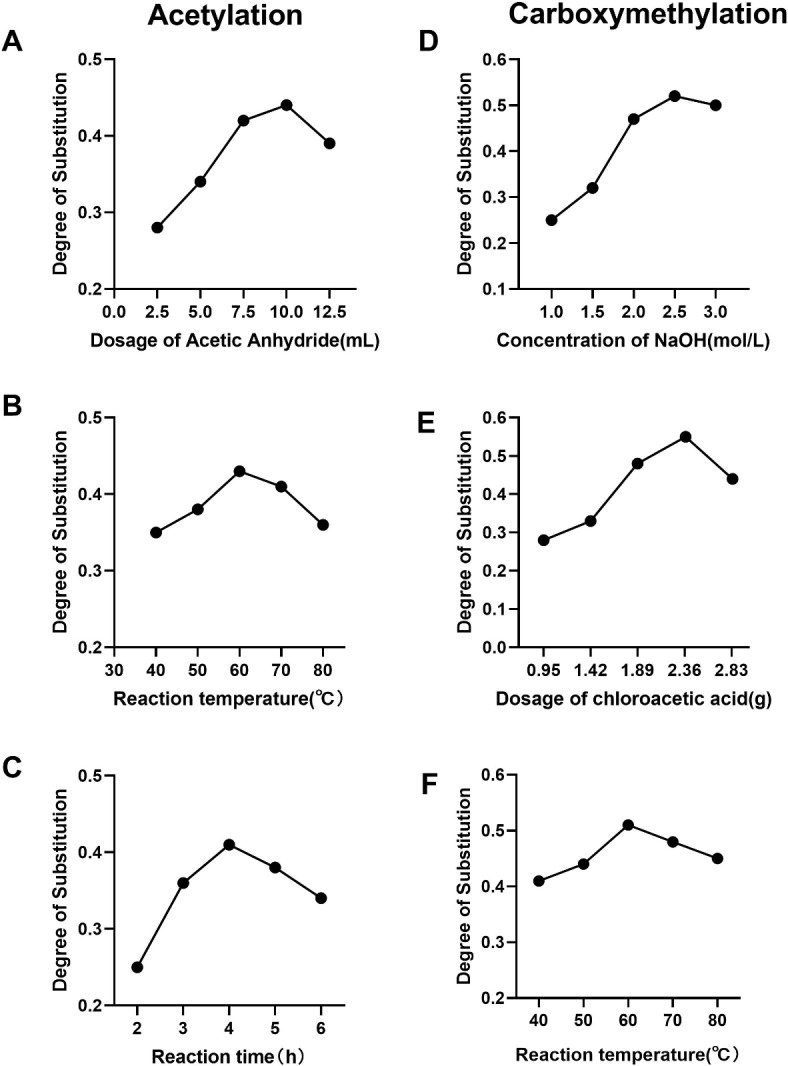
Single-factor experimental results. (A) Effect of the dose of acetic anhydride on the degree of acetylation; (B) effect of the reaction temperature on the degree of acetylation; (C) effect of the reaction time on the degree of acetylation; (D) effect of the concentration of NaOH on the degree of carboxymethylation; (E) effect of the dose of chloroacetic acid on the degree of carboxymethylation; (F) effect of the reaction temperature on the degree of carboxymethylation.
As shown in Fig. 3B, the degree of substitution of the derivative initially sharply increased with increasing temperature and peaked at 60 °C. Reaction temperatures of 70 °C and 80 °C did not result in increases in the degree of substitution, and these temperatures even led to a decrease the degree of substitution. Consequently, the optimal reaction temperature was determined to be 60 °C.
-
(3)
Reaction time
As shown in Fig. 3C, the degree of substitution of the derivative significantly increased when the reaction time was extended from 2 to 4 h. However, when the reaction time exceeded 4 h, there was no further increase in the degree of substitution, and it even decreased. Therefore, the optimal reaction time was determined to be 4 h.
Single-factor carboxymethylation experiments
Concentration of NaOH
As shown in Fig. 3D, the degree of substitution gradually increased with increasing sodium hydroxide concentration in the range of 1–2.5 mol/L, peaking with a concentration of 2.5 mol/L. However, further increasing the sodium hydroxide concentration led to a decrease in the degree of substitution.
-
(2)
Dosage of chloroacetic acid
As illustrated in Fig. 3E, the degree of substitution rapidly increased with increasing dose of chloroacetic acid in the range of 0.95–2.37 g, peaking with a dose of 2.37 g. Beyond this point, increasing the dose of chloroacetic acid led to a decrease in the degree of substitution.
-
(3)
Reaction temperature
As depicted in Fig. 3F, within the range of 40–60 °C, the degree of substitution rapidly increased with increasing temperature, peaking at 60 °C. However, further increasing the temperature resulted in a decrease in the degree of substitution.
Response surface experiments
Response surface analysis of acetylation
Three factors, the dose of acetic anhydride, reaction temperature and time, were selected for further response surface analysis. With Design Expert 13 software, second-order polynomial fitting was performed to construct a mathematical model with the degree of substitution of sample as the response variable. The specific experimental data are detailed in Table 3.
Table 3.
Experimental design for response surface analysis of acetylation.
| Number | Dosage of acetic anhydride (mL) | Temperature (°C) | Reaction time (h) | Degree of substitution |
|---|---|---|---|---|
| A | B | C | ||
| 1 | 5 | 60 | 5 | 0.264 |
| 2 | 7.5 | 60 | 4 | 0.415 |
| 3 | 10 | 60 | 5 | 0.302 |
| 4 | 7.5 | 50 | 5 | 0.263 |
| 5 | 0 | 70 | 5 | 0.326 |
| 6 | 10 | 50 | 4 | 0.326 |
| 7 | 10 | 70 | 4 | 0.365 |
| 8 | 5 | 60 | 3 | 0.257 |
| 9 | 5 | 50 | 4 | 0.249 |
| 10 | 7.5 | 50 | 4 | 0.416 |
| 11 | 7.5 | 50 | 4 | 0.427 |
| 12 | 10 | 50 | 3 | 0.348 |
| 13 | 7.5 | 50 | 4 | 0.426 |
| 14 | 7.5 | 70 | 3 | 0.332 |
| 15 | 7.5 | 50 | 3 | 0.278 |
| 16 | 7.5 | 60 | 4 | 0.415 |
| 17 | 5 | 70 | 4 | 0.352 |
The variance analysis results in Table 4 indicate that the established regression model is statistically significant (F = 109.95, p < 0.0001), and the lack of fit is not significant (F = 4.125, p = 0.1782, p > 0.05), suggesting that the model fits well and is suitable for predicting experimental results. In the model, the first-order terms A and B and the second-order terms (A2), (B2), and (C2) all have a highly significant effect on the degree of substitution on acetylation. Single-factor analysis revealed that the main factors affecting the degree of acetylation were the reaction temperature, acetic anhydride and reaction time. To validate the adequacy of the model equation [Eq. (3)], a verification experiment was conducted under the optimal conditions (within the experimental range): 3.4 mL of acetic anhydride, 63.418 °C temperature and a reaction time of 4 h. The validation results show no significant difference between the experimental (DS = 0.418 ± 0.09, n = 3) and predicted values (DS = 0.428), suggesting that the response model can adequately reflect the anticipated optimization.
 |
8 |
Table 4.
Analysis of variance of the Box–Behnken experiment.
| Source of variation | Sum of squares | Degrees of freedom | Mean square | F value | p value |
|---|---|---|---|---|---|
| Model | 0.065 | 9 | 7.218 × 10⁻³ | 109.95 | < 0.0001 |
| A | 5.995 × 10⁻³ | 1 | 5.995 × 10⁻³ | 91.32 | < 0.0001 |
| B | 8.385 × 10⁻³ | 1 | 8.385 × 10⁻³ | 127.72 | < 0.0001 |
| C | 4.500 × 10⁻⁴ | 1 | 4.500 × 10⁻⁴ | 6.85 | 0.0345 |
| AB | 1.024 × 10⁻³ | 1 | 1.024 × 10⁻³ | 15.60 | 0.0055 |
| AC | 7.023 × 10⁻⁴ | 1 | 7.023 × 10⁻⁴ | 10.70 | 0.0137 |
| BC | 2.025 × 10⁻⁵ | 1 | 2.025 × 10⁻⁵ | 0.31 | 0.5959 |
| A2 | 0.011 | 1 | 0.011 | 172.76 | < 0.0001 |
| B2 | 8.488 × 10⁻³ | 1 | 8.488 × 10⁻³ | 129.30 | < 0.0001 |
| C3 | 0.024 | 1 | 0.024 | 362.21 | < 0.0001 |
| Residual | 4.595 × 10⁻⁴ | 7 | 6.565 × 10⁻⁵ | ||
| Lack of fit | 3.087 × 10⁻⁴ | 3 | 1.029 × 10⁻⁴ | 4.125 | 0.1782 |
| Pure error | 1.508 × 10⁻⁴ | 4 | 3.770 × 10⁻⁵ | ||
| Total | 0.065 | 16 |
The interaction effects of various factors in acetylation experiment are presented in the response surface, as seen in Fig. 4. Specifically, (A) represent the response surface plots for the interaction between dosage of acetic anhydride and temperature, respectively; (B) depicts the response surface plots for the interaction between dosage of acetic anhydride and reaction time; (C) illustrate the response surface plots for the interaction between reaction time and temperature. These plots show the combined effects of different variable combinations on the degree of acetylation. In the response surface plots, the steepness of the slope reflects the significance of each factor’s impact on the experiment. A steeper slope indicates a more significant impact, while a less steep slope suggests a less significant impact.
Fig. 4.

Response surface (3D) showing the effect of the dosage of acetic anhydride, temperature and reaction time on the degree of acetyl substitution.
Response surface analysis of carboxymethylation
The dose of chloroacetic acid, reaction temperature, and concentration of NaOH were identified as key factors for subsequent response surface analysis. With Design Expert 13 software, a quadratic polynomial regression was carried out to establish a mathematical model, where the degree of substitution of sample served as the dependent variable. The detailed experimental data and the corresponding regression equations are presented in Table 5.
Table 5.
Experimental design for response surface analysis of carboxymethylation.
| Number | Temperature (°C) | Dosage of chloroacetic acid (g) | Concentration of NaOH (mol/L) | Degree of substitution |
|---|---|---|---|---|
| A | B | C | ||
| 1 | 60 | 2.36 | 2.5 | 0.494 |
| 2 | 60 | 2.36 | 1.5 | 0.436 |
| 3 | 60 | 1.89 | 2 | 0.577 |
| 4 | 70 | 2.36 | 2 | 0.516 |
| 5 | 60 | 1.42 | 1.5 | 0.263 |
| 6 | 50 | 1.42 | 2 | 0.363 |
| 7 | 70 | 1.42 | 2 | 0.395 |
| 8 | 60 | 1.89 | 2 | 0.575 |
| 9 | 60 | 1.89 | 2 | 0.585 |
| 10 | 50 | 1.89 | 2.5 | 0.443 |
| 11 | 70 | 1.89 | 2.5 | 0.497 |
| 12 | 50 | 2.36 | 2 | 0.482 |
| 13 | 70 | 1.89 | 1.5 | 0.383 |
| 14 | 50 | 1.89 | 1.5 | 0.299 |
| 15 | 60 | 1.89 | 2 | 0.579 |
| 16 | 60 | 1.89 | 2 | 0.566 |
| 17 | 60 | 1.42 | 2.5 | 0.427 |
The analysis of variance presented in Table 6 demonstrates that the constructed regression model is statistically significant (F = 123.61, p < 0.0001), and the lack of fit is not statistically significant (F = 5.65, p = 0.0639, which is greater than 0.05), indicating that the model is a good fit and is appropriate for predicting experimental outcomes. Within the model, the linear terms B and C, as well as the quadratic terms (A2), (B2), and (C2), all strongly influence the degree of substitution during acetylation. Single-factor analysis revealed that the primary factors influencing the degree of substitution in the carboxymethylation process, in descending order of importance, are the concentration of NaOH, the dose of chloroacetic acid, and the reaction temperature. To validate the adequacy of the model equation [Eq. (9)], a verification experiment was conducted under the optimal conditions (within the experimental range): 2.2 g of chloroacetic acid, 62.4 °C and 2.2 mol/L NaOH. The validation results show no significant difference between the experimental (DS = 0.583 ± 0.24, n = 3) and predicted values (DS = 0.590), suggesting that the response model can adequately reflect the anticipated optimization.
 |
9 |
Table 6.
Analysis of variance of the Box–Behnken experiment.
| Source of variation | Sum of squares | Degrees of freedom | Mean square | F Value | p value |
|---|---|---|---|---|---|
| Model | 0.16 | 9 | 0.018 | 123.61 | < 0.0001 |
| A | 5.202 × 10⁻³ | 1 | 5.202 × 10⁻³ | 36.37 | 0.0005 |
| B | 0.029 | 1 | 0.029 | 201.36 | < 0.0001 |
| C | 0.031 | 1 | 0.031 | 204.49 | < 0.0001 |
| AB | 1.000 × 10⁻⁶ | 1 | 1.000 × 10⁻⁶ | 6.992 × 10⁻³ | 0.9357 |
| AC | 2.250 × 10⁻⁴ | 1 | 2.250 × 10⁻⁴ | 1.57 | 0.2500 |
| BC | 2.809 × 10⁻³ | 1 | 2.809 × 10⁻³ | 19.64 | 0.0030 |
| A2 | 0.020 | 1 | 0.020 | 137.93 | < 0.0001 |
| B2 | 0.020 | 1 | 0.020 | 139.95 | < 0.0001 |
| C3 | 0.044 | 1 | 0.044 | 308.99 | < 0.0001 |
| Residual | 1.001 × 10⁻³ | 7 | 1.430 × 10⁻⁴ | ||
| Lack of fit | 8.100 × 10⁻⁴ | 3 | 2.700 × 10⁻⁴ | 5.65 | 0.0639 |
| Pure error | 1.912 × 10⁻⁴ | 4 | 4.780 × 10⁻⁵ | ||
| Total | 0.16 | 16 |
The interaction effects of various factors in carboxymethylation experiment are presented in the response surface, as seen in Fig. 5. Specifically, (A) represent the response surface plots for the interaction between dosage of chloroacetic acid and temperature, respectively; (B) depicts the response surface plots for the interaction between concentration of NaOH and temperature; (C) illustrate the response surface plots for the interaction between dosage of chloroacetic acid and concentration of NaOH. These plots show the combined effects of different variable combinations on the degree of carboxymethylation.
Fig. 5.

Response surface (3D) showing the effect of the dosage of chloroacetic acid, temperature and concentration of NaOH on the degree of carboxymethyl substitution.
Physicochemical features of GEP-1 derivatives
The physicochemical properties of GEP-1 and its derivatives have shown in Table 7. The yields of CGEP and AGEP were 36.26% and 42.0%, respectively, which were similar to those reported in previous studies. However, these results also indicate that more than half of the polysaccharide fractions were broken down or removed during the chemical modification process, which may be related to the reactivity of the chemical modification. The DS of CGEP and AGEP were 0.512 and 0.416, respectively, indicating that the two modification methods successfully introduced the desired groups into the original polysaccharide structure.
Table 7.
Physicochemical properties of polysaccharides.
| GEP-1 | CGEP | AGEP | |
|---|---|---|---|
| Yield (%) | 21.03 | 36.26 | 42.04 |
| Carbohydrate contents (%) | 95.34 | 90.72 | 88.92 |
| Uronic acid (%) | 26.84 | 24.37 | 27.29 |
| Protein (%) | 1.52 | 1.44 | 1.34 |
| DS | – | 0.512 | 0.416 |
| Solubility (mg/mL) | 16.2 | 54.8 | 32.3 |
The total carbohydrate contents of the different samples were as follows: GEP-1 (95.34%) > CGEP (90.72%) > AGEP (88.92%). These results suggest that chemical modifications can affect the content of sugar components in the polysaccharides. AGEP contains more uronic acid than either GEP-1 or CGEP do. This difference in uronic acid content is likely due to the structural alterations caused by the addition of acetyl groups to GEP-1, which lead to an increased concentration of glyoxylate13.
Furthermore, the water solubility of CGEP and AGEP was enhanced in comparison to GEP-1, with a particularly marked improvement observed in the solubility of CGEP, which reached a significantly higher level (54.8 mg/mL).
Monosaccharide composition of GEP-1 derivatives
The monosaccharide composition analysis of GEP-1 and its derivatives is shown in Table 8. The results indicated that the GEP-1 fraction contained arabinose, galactose, glucose and mannose at a molar ratio of 1:2.19:42.04:0.16. The ratios of glucose in the two derivatives slightly changed, possibly because of degradation in the derivatization reaction or the introduction of groups. These results suggested that chemical modification might lead to changes in the ratio of monosaccharides, although the backbone structure remained unchanged.
Table 8.
Monosaccharide composition of polysaccharides.
| Monosaccharide/Sample | GEP-1 (%) | AGEP (%) | CGEP (%) |
|---|---|---|---|
| Ara | 2.189 | 0.37 | 0.00 |
| Gal | 4.791 | 0.92 | 0.36 |
| Glc | 92.035 | 98.23 | 91.72 |
| Man | 0.342 | 0.16 | 0.41 |
HPSEC-MALLS-RID analysis of GEP-1 derivatives
The results of HPSEC-MALLS-RID analysis are shown in Figs. 6 and 7. AGEP contains four polysaccharide components of different molecular weights, which are ranked according to their content: Peak 4 (41.5%) > Peak 2 (33.6%) > Peak 1 (13.9%) > Peak 3 (11.0%), and the average molecular weights were 2.120 kDa, 9.306 kDa, 20.967 kDa and 4.251 kDa, respectively (Table 9).
Fig. 6.
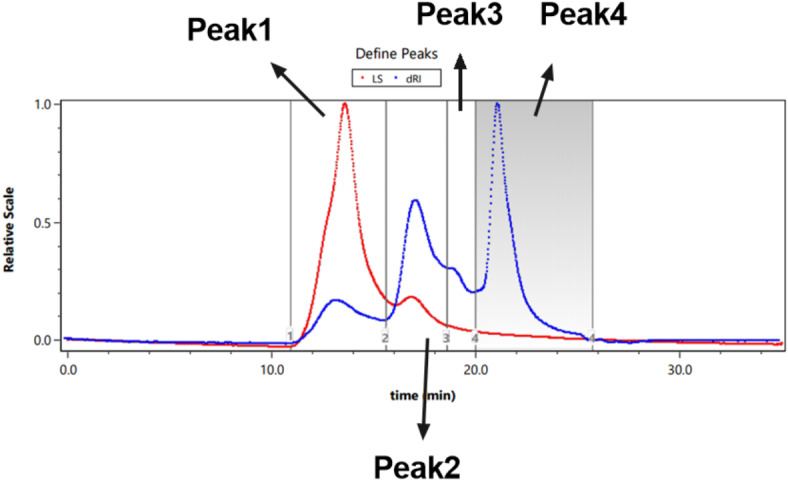
HPSEC-MALLS-RID analysis of AGEP.
Fig. 7.
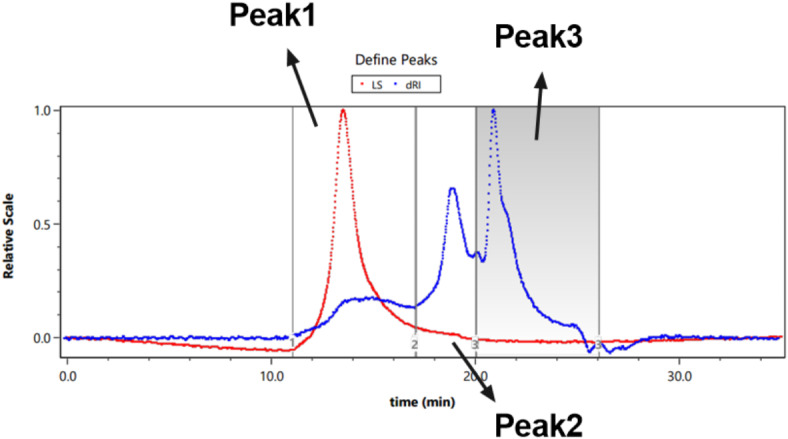
HPSEC-MALLS-RID analysis of CGEP.
Table 9.
Molecular weight determination of AGEP.
| Peak1 | Peak2 | Peak3 | Peak4 | |
|---|---|---|---|---|
| Mass fraction (%) | 13.9 | 33.6 | 11.0 | 41.5 |
| Mn (kDa) | 23.106 (± 1.326%) | 11.242 (± 1.248%) | 4.260 (± 2.052%) | 3.328 (± 3.233%) |
| Mp (kDa) | 30.096 (± 1.092%) | 8.856 (± 1.066%) | 4.236 (± 1.738%) | 1.923 (± 3.124%) |
| Mw (kDa) | 20.967 (± 1.527%) | 9.306 (± 1.241%) | 4.251 (± 2.059%) | 2.120 (± 3.768%) |
| Mw/Mn | 1.102 (± 2.023) | 1.208 (± 1.760%) | 1.002 (± 2.907%) | 1.57 (± 4.965%) |
CGEP contains three polysaccharide components with different molecular weights. The highest content was associated with the Peak 3 component (44.5%), with an average molecular weight of 9.082 kDa. The next fraction was the Peak 2 fraction (33.4%), with an average molecular weight of 21.876 kDa. The lowest content was in the Peak 1 fraction (22.1%), with an average molecular weight of 56.411 kDa (Table 10).
Table 10.
Molecular weight determination of CGEP.
| Peak1 | Peak2 | Peak3 | |
|---|---|---|---|
| Mass fraction | 22.1 | 33.4 | 44.5 |
| Mn (kDa) | 29.289 (± 4.399%) | 15.559 (± 14.444%) | 7.301 (± 44.039%) |
| Mp (kDa) | 51.205(± 2.156%) | 14.078 (± 8.822%) | 7.255 (± 49.440%) |
| Mw (kDa) | 56.411 (± 3.196%) | 21.876 (± 10.398) | 9.082 (± 47.841%) |
| Mw/Mn | 1.926 (± 5.437%) | 1.406 (± 17.798) | 1.244 (± 65.025%) |
FT-IR spectroscopy
As shown in Fig. 8, acetylation and carboxymethylation did not affect the characteristic structure of the polysaccharide. In Fig. 8A, the broad peak at 3417.6 cm1 is due to the stretching vibration of the hydroxyl group, and the absorption peak at 2933.6 cm−1 is correlated with the stretching vibration of C–H. The presence of a pronounced stretching vibration peak at 1749.3 cm−1 is a sign of acetylation, indicating that acetylation was successfully achieved. As shown in Fig. 8B, the characteristic absorption peaks of CGEP are at approximately 1433.0 cm−1 and 1328.9 cm−1, which are the methylene stretching vibration peak and the C–O asymmetric stretching vibration peak, respectively. These findings indicate that the carboxymethylated groups had successfully attached to the polysaccharide.
Fig. 8.
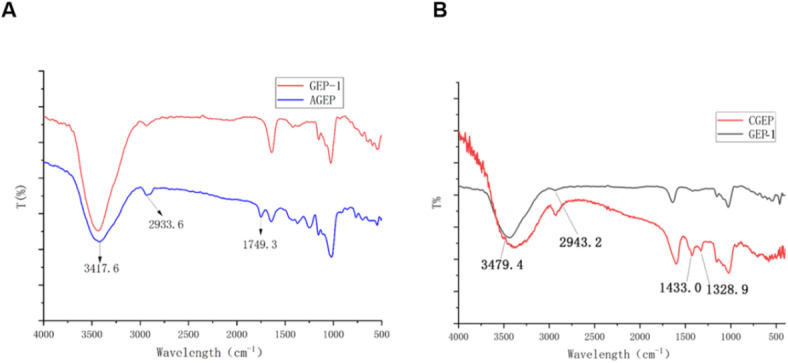
Infrared spectra of GEP and its derivatives.
Antioxidant analysis
To compare the changes in antioxidant activity before and after modification, three scavenging assays, including 1,1-diphenyl-2-picryl-hydrazyl radical (DPPH), hydroxyl radical and superoxide anion scavenging assays, were performed. The results of DPPH removal by GEP-1 and its acetylated and carboxymethylated derivatives are shown in Fig. 9A. Both acetylation and carboxymethylation of GEP-1 increased the capacity for scavenging DPPH radicals, especially at high concentrations, possibly because of the strong hydrogen supply ability generated by hydrogen activation on heterotopic carbon28. The derivatives also demonstrated increased activity for scavenging hydroxyl radicals and superoxide anions in the other two assays (Fig. 9B,C). Although chemical modification increased the free radical scavenging ability of the polysaccharide, a large difference in activity was observed between the control group Vc. The antioxidant capacity of CGEP was superior to that of AGEP in all three experiments, an improvement that may be related to the introduction of carboxymethyl groups, which greatly improved the water solubility of the polysaccharide.
Fig. 9.

Antioxidant activity of GEP and its derivatives. (A–C) represent the DPPH, hydroxyl radical and superoxide anion scavenging assays, respectively.
Cell proliferation and cytokine levels
A cell proliferation assay was performed to detect cytotoxicity induced by AGEP and CGEP at various concentrations and after various incubation times in RAW264.7 cells. As shown in Fig. 10A,B, cell viability was greater in the groups treated with low to moderate concentrations of derivatives than in the control group, and cell viability peaked after treatment with a concentration of 300 µg/mL. Therefore, both derivatives were almost noncytotoxic to RAW264.7 cells. Moreover, the viability of cells treated with AGEP and CGEP for 24 h was greater than that of the other two groups (6 h and 12 h). These two derivatives clearly have the same function as LPS in promoting macrophage viability. Moreover, an incubation time of 24 h and concentrations of 300 µg/mL of AGEP and CGEP were selected for the following experiments.
Fig. 10.

Cytotoxicity (A,B) and immunomodulatory activities (C and D) of GEP-1 derivatives. n = 3, *** represented p < 0.05.
The protein levels of TNF-α and IL-6 were measured by ELISA. As shown in Fig. 10C, compared with the control, GEP-1 and its derivatives induced more TNF-α release by RAW264.7 cells (p < 0.05). The concentrations of TNF-α produced in response to AGEP and CGEP (300 μg/mL) treatment were 146.97 pg/mL and 158.86 pg/mL, respectively, whereas GEP-1 (300 μg/mL) only resulted in 109.19 pg/mL TNF-α production (p < 0.05). As shown in Fig. 10D, all three polysaccharide samples stimulated the production of greater amounts of IL-6 (p < 0.05). The concentration of IL-6 produced by cells treated with CGEP or AGEP was obviously greater than produced by cells treated with GEP-1 (p < 0.05). These results suggested that, compared with the original polysaccharide, the derivatives significantly stimulated the release of TNF-α and IL-6 from RAW 264.7 cells.
Discussion
Currently, chemically modified polysaccharides have been integrated into various sectors, including the biomedical, food, cosmetic, and materials industries, as well as in the research and development of antibacterial agents29,30. These applications highlight significant practical and commercial value of chemically modified polysaccharides31. In this study, the conditions for polysaccharide modification were optimized via the response surface method. Through single-factor experiments, the appropriate ranges of the levels for each influencing factor were determined, and the response surface and data analyses were performed with Design-Expert software. This process helped to adjust the modification conditions accurately to achieve the best substitution results. On the basis of the optimized experimental conditions from response surface analysis, carboxymethylated polysaccharides with a degree of substitution of 0.512 and acetylated polysaccharides with a degree of substitution of 0.416 were successfully prepared.
The structures of GEP-1 and its derivatives were subsequently characterized and compared. The HPSEC-MALLS-RID analysis results indicated that both modified polysaccharides contained multiple components with different molecular weight ranges. This outcome may be related to the cleavage of glycosidic bonds caused by the chemical modification process32,33. The relative molecular weights of the two derivatives were lower than that of the original polysaccharide, a trend that was also observed in other studies. However, some studies have reported an increase in molecular weight after modification, which might be associated with the introduction of modifying groups without cleavage of the original polysaccharide’s glycosidic bonds34,35. The degree of substitution measurements and infrared spectroscopy confirmed the successful incorporation of the modifications into the original polysaccharide without breaking its fundamental structure.
Chemical modification of polysaccharides is an important means of generating new antioxidants and immunomodulatory agents36–39. It is widely believed that the biological activities of polysaccharide derivatives are associated with the presence of hydroxyl groups and the incorporation of substituent groups such as –SH, –COOH, –C–O–, and –NH228,40. These modifications can alter the native structure of polysaccharides; affect factors such as molecular weight, monosaccharide composition, and configuration; and reduce the number of intermolecular and intramolecular hydrogen bonds32,41. In this study, we show that the introduction of acetyl and carboxymethyl groups into the GEP-1 molecule significantly affects its antioxidant and immunomodulatory properties. Additionally, the activities of the AGEP and CGEP derivatives distinctly differed, suggesting that the type of substituent is crucial for the biological activity of these derivatives. Based on the current findings, we propose that the introduction of acetyl and carboxymethyl groups aids in enhancing the water solubility of polysaccharides, thereby facilitating their interaction with biological macromolecules. The improved water solubility is likely due to several factors during the modification process: partial degradation or cleavage that results in a decrease in molecular weight, thereby accelerating the diffusion rate of the molecules; a reduction in the spatial hindrance of the polysaccharide chains, which decreases the propensity of the molecules to aggregate; and alterations in intermolecular forces that increase the polarity of the polysaccharides. To further substantiate these analytical results, we intend to refine our investigations in subsequent studies.
Conclusions
In the present study, a water-soluble polysaccharide (GEP-1) extracted from Gastrodia elata was successfully modified to generate its acetylated and carboxymethylated derivatives. The modification procedures were optimized by integrating single factor experiments with response surface methodology. The optimized conditions for acetylation were 3.4 mL of acetic anhydride, a reaction temperature of 63.418 °C, and a reaction duration of 4 h. For carboxymethylation, the optimal modification parameters were 2.167 g of chloroacetic acid, a temperature of 62.365 °C, and a NaOH concentration of 2.205 mol/L. The successful incorporation of modifications to the compounds was confirmed through chemical analysis and Fourier transform infrared spectroscopy. However, it was observed that the molecular weights of the derivatives slightly diminished due to degradation incurred during the synthetic process. Furthermore, it is found that the modifications significantly enhanced the antioxidant properties of GEP-1, as evidenced by its improved scavenging efficacy against DPPH radicals, hydroxyl radicals, and superoxide anions, outperforming the antioxidant capacity of the unmodified polysaccharide. Additionally, the modified derivatives exhibited minimal cytotoxicity and induced a pronounced immunostimulatory response in RAW264.7 macrophages, as indicated by the significant upregulation of TNF-α and IL-6 secretion. These findings underscore the potential of chemically modified GEP-1 as a promising candidate for the development of natural antioxidants and immunomodulatory agents, with potential applications in the pharmaceutical and biomedical fields.
Acknowledgements
The project was supported by Scientific Research Fund of Education Bureau of Yunnan Province, China (Nos. 2024J0074 and 2024J2078).
Author contributions
H.G.: writing—original draft, performing the experiment, and sorting the data; X.Z.: conceptualization and analysis of validated data; W.Y.: performing the antioxidant activity experiments; F.Z.: assisting in extraction; X.L: reviewing and revising the manuscript; X.L.: funding acquisition, project administration, methodology, and reviewing and revising the manuscript. All authors have read and agreed to the published version of the manuscript.
Data availability
The datasets used and/or analysed during the current study available from the corresponding author on reasonable request.
Declarations
Competing interests
The authors declare no competing interests.
Footnotes
Publisher’s note
Springer Nature remains neutral with regard to jurisdictional claims in published maps and institutional affiliations.
References
- 1.Schepetkin, I. A. et al. Immunomodulatory activity of polysaccharides isolated from Saussureasalicifolia L. and Saussureafrolovii Ledeb. Molecules28, 6655 (2023). [DOI] [PMC free article] [PubMed] [Google Scholar]
- 2.Gao, C. et al. Effects and stress-relieving mechanisms of dark tea polysaccharide in human HaCaT keratinocytes and SZ95 sebocytes. Molecules28, 6128 (2023). [DOI] [PMC free article] [PubMed] [Google Scholar]
- 3.Ozuna-Valencia, K. H. et al. Improving the properties of polysaccharide-based films by incorporation of polyphenols through free radical grafting: A review. Polysaccharides5, 672–697 (2024). [Google Scholar]
- 4.Chakka, V. P. & Zhou, T. Carboxymethylation of polysaccharides: Synthesis and bioactivities. Int. J. Biol. Macromol.165, 2425–2431 (2020). [DOI] [PubMed] [Google Scholar]
- 5.Qiu, H., Tang, W., Tong, X., Ding, K. & Zuo, J. Structure elucidation and sulfated derivatives preparation of two α-d-glucans from Gastrodiaelata bl. and their anti-dengue virus bioactivities. Carbohydr. Res.342, 2230–2236 (2007). [DOI] [PubMed] [Google Scholar]
- 6.Chen, Y. et al. Acetylation and carboxymethylation of the polysaccharide from Ganodermaatrum and their antioxidant and immunomodulating activities. Food Chem.156, 279–288 (2014). [DOI] [PubMed] [Google Scholar]
- 7.Yang, W. & Huang, G. Chemical modification and structural analysis of polysaccharide from solanum tuberdsm. J. Mol. Struct.1285, 135480 (2023). [Google Scholar]
- 8.Zhang, Y. et al. Preparation, characterization, and bioactivity evaluation of oligosaccharides from Atractylodeslancea (thumb.) DC. Carbohydr. Polym.277, 118854 (2022). [DOI] [PubMed] [Google Scholar]
- 9.Ren, Y.-Y. et al. Carboxymethylation and acetylation of the polysaccharide from Cordycepsmilitaris and their α-glucosidase inhibitory activities. Nat. Prod. Res.34, 369–377 (2020). [DOI] [PubMed] [Google Scholar]
- 10.Adel, A., Abou-Youssef, H., El-Gendy, A. & Nada, A. Carboxymethylated cellulose hydrogel; sorption behavior and characterization. Nat. Sci.8, 244–256 (2010). [Google Scholar]
- 11.Xie, L., Shen, M., Wang, Z. & Xie, J. Structure, function and food applications of carboxymethylated polysaccharides: A comprehensive review. Trends Food Sci. Technol.118, 539–557 (2021). [Google Scholar]
- 12.Shariatinia, Z. Carboxymethyl chitosan: Properties and biomedical applications. Int. J. Biol. Macromol.120, 1406–1419 (2018). [DOI] [PubMed] [Google Scholar]
- 13.Wang, X., Zhang, Z., Wu, Y., Sun, X. & Xu, N. Synthesized sulfated and acetylated derivatives of polysaccharide extracted from Gracilariopsislemaneiformis and their potential antioxidant and immunological activity. Int. J. Biol. Macromol.124, 568–572 (2019). [DOI] [PubMed] [Google Scholar]
- 14.Sood, A., Gupta, A. & Agrawal, G. Recent advances in polysaccharides based biomaterials for drug delivery and tissue engineering applications. Carbohydr. Polym. Technol. Appl.2, 100067 (2021). [Google Scholar]
- 15.Li, H. et al. Naturally and chemically acetylated polysaccharides: Structural characteristics, synthesis, activities, and applications in the delivery system: A review. Carbohydr. Polym.313, 120746 (2023). [DOI] [PubMed] [Google Scholar]
- 16.Guan, H. et al. Structural characterization of polysaccharide derived from Gastrodiaelata and its immunostimulatory effect on RAW264.7 cells. Molecules27, 8059 (2022). [DOI] [PMC free article] [PubMed] [Google Scholar]
- 17.Bedini, E., Laezza, A., Parrilli, M. & Iadonisi, A. A review of chemical methods for the selective sulfation and desulfation of polysaccharides. Carbohydr. Polym.174, 1224–1239 (2017). [DOI] [PubMed] [Google Scholar]
- 18.Chen, X.-W., Huang, W.-B., Sun, X.-Y., Xiong, P. & Ouyang, J.-M. Antioxidant activity of sulfated Porphyrayezoensis polysaccharides and their regulating effect on calcium oxalate crystal growth. Mater. Sci. Eng. C128, 112338 (2021). [DOI] [PubMed] [Google Scholar]
- 19.Xue, H. et al. Extraction, purification, structure, modification, and biological activity of traditional Chinese medicine polysaccharides: A review. Front. Nutr.9, 1005181 (2022). [DOI] [PMC free article] [PubMed] [Google Scholar]
- 20.Gao, N. et al. Purification, structural characterization and anticoagulant activities of four sulfated polysaccharides from sea cucumber Holothuriafuscopunctata. Int. J. Biol. Macromol.164, 3421–3428 (2020). [DOI] [PubMed] [Google Scholar]
- 21.Li, N. et al. Structure and anticoagulant property of a sulfated polysaccharide isolated from the green seaweed Monostromaangicava. Carbohydr. Polym.159, 195–206 (2017). [DOI] [PubMed] [Google Scholar]
- 22.Zhang, Q. et al. Structure characterization of two functional polysaccharides from Polygonummultiflorum and its immunomodulatory. Int. J. Biol. Macromol.113, 195–204 (2018). [DOI] [PubMed] [Google Scholar]
- 23.Liu, T. et al. Chemical modification of polysaccharides: A review of synthetic approaches, biological activity and the structure–activity relationship. Molecules28, 6073 (2023). [DOI] [PMC free article] [PubMed] [Google Scholar]
- 24.Xiao, X. et al. Clerodendranthusspicatus (thumb.) water extracts reduce lipid accumulation and oxidative stress in the Caenorhabditiselegans. Int. J. Mol. Sci.25, 9655 (2024). [DOI] [PMC free article] [PubMed] [Google Scholar]
- 25.Zhou, S., Huang, G. & Huang, H. Extraction, derivatization and antioxidant activities of onion polysaccharide. Food Chem.388, 133000 (2022). [DOI] [PubMed] [Google Scholar]
- 26.Yao, H.-Y.-Y., Wang, J.-Q., Yin, J.-Y., Nie, S.-P. & Xie, M.-Y. A review of NMR analysis in polysaccharide structure and conformation: Progress, challenge and perspective. Food Res. Int.143, 110290 (2021). [DOI] [PubMed] [Google Scholar]
- 27.Wang, M. et al. Characterization, antioxidant activity and immunomodulatory activity of polysaccharides from the swollen culms of Zizanialatifolia. Int. J. Biol. Macromol.95, 809–817 (2017). [DOI] [PubMed] [Google Scholar]
- 28.Zhan, Y., An, X., Wang, S., Sun, M. & Zhou, H. Basil polysaccharides: A review on extraction, bioactivities and pharmacological applications. Bioorg. Med. Chem.28, 115179 (2020). [DOI] [PubMed] [Google Scholar]
- 29.Han, Y. et al. Sulfated Cyclocaryapaliurus polysaccharides improve immune function of immunosuppressed mice by modulating intestinal microbiota. Int. J. Biol. Macromol.212, 31–42 (2022). [DOI] [PubMed] [Google Scholar]
- 30.Li, H., Xie, W., Sun, H., Cao, K. & Yang, X. Effect of the structural characterization of the fungal polysaccharides on their immunomodulatory activity. Int. J. Biol. Macromol.164, 3603–3610 (2020). [DOI] [PubMed] [Google Scholar]
- 31.He, P., Zhang, Y. & Li, N. The phytochemistry and pharmacology of medicinal fungi of the genus Phellinus: A review. Food Funct.12, 1856–1881 (2021). [DOI] [PubMed] [Google Scholar]
- 32.Chen, H., Tian, T., Miao, H. & Zhao, Y.-Y. Traditional uses, fermentation, phytochemistry and pharmacology of Phellinuslinteus: A review. Fitoterapia113, 6–26 (2016). [DOI] [PubMed] [Google Scholar]
- 33.Zhang, H., Jiang, F., Li, L., Liu, X. & Yan, J.-K. Recent advances in the bioactive polysaccharides and other key components from Phellinus spp and their pharmacological effects: A review. Int. J. Biol. Macromol.222, 3108–3128 (2022). [DOI] [PubMed] [Google Scholar]
- 34.Leong, Y. K., Yang, F.-C. & Chang, J.-S. Extraction of polysaccharides from edible mushrooms: Emerging technologies and recent advances. Carbohydr. Polym.251, 117006 (2021). [DOI] [PubMed] [Google Scholar]
- 35.Zhang, Q. et al. Structural characterization of extracellular polysaccharides from Phellinusigniarius SH-1 and their therapeutic effects on DSS induced colitis in mice. Int. J. Biol. Macromol.275, 133654 (2024). [DOI] [PubMed] [Google Scholar]
- 36.Boateng, I. D., Guo, Y.-Z. & Yang, X.-M. Extraction, purification, structural characterization, and antitumor effects of water-soluble intracellular polysaccharide (IPSW-1) from Phellinusigniarius mycelia. J. Agric. Food Chem.72, 19721–19732 (2024). [DOI] [PubMed] [Google Scholar]
- 37.Shi, H. et al. Purification and characterization of a novel mixed-linkage α,β-d-glucan from Arcasubcrenata and its immunoregulatory activity. Int. J. Biol. Macromol.182, 207–216 (2021). [DOI] [PubMed] [Google Scholar]
- 38.Gharib, F. A. E. L., Osama, K., Sattar, A. M. A. E. & Ahmed, E. Z. Impact of chlorella vulgaris, Nannochloropsissalina, and Arthrospiraplatensis as bio-stimulants on common bean plant growth, yield and antioxidant capacity. Sci. Rep.14, 1398 (2024). [DOI] [PMC free article] [PubMed] [Google Scholar]
- 39.Zhou, S., Huang, G. & Chen, G. Extraction, structural analysis, derivatization and antioxidant activity of polysaccharide from Chinese yam. Food Chem.361, 130089 (2021). [DOI] [PubMed] [Google Scholar]
- 40.Chen, C. et al. A comparison study on polysaccharides extracted from Fructusmori using different methods: Structural characterization and glucose entrapment. Food Funct.10, 3684–3695 (2019). [DOI] [PubMed] [Google Scholar]
- 41.Huang, Y., Xie, W., Tang, T., Chen, H. & Zhou, X. Structural characteristics, antioxidant and hypoglycemic activities of polysaccharides from Morifructus based on different extraction methods. Front. Nutr.10, 1125831 (2023). [DOI] [PMC free article] [PubMed] [Google Scholar]
Associated Data
This section collects any data citations, data availability statements, or supplementary materials included in this article.
Data Availability Statement
The datasets used and/or analysed during the current study available from the corresponding author on reasonable request.