

Abstract
Cyclin E is essential for progression through the G1 phase of the cell cycle and initiation of DNA replication by interacting with, and activating its catalytic partner, the cyclin-dependent kinase 2 (Cdk2). We found a substantial increase in cyclin E mRNA, accompanied by increased production of cyclin E protein and cyclin E/Cdk2 kinase activity in multiple myeloma and lymphoma cells following irradiation. Cyclin E expression increased early in a time and dose-dependent manner, with a threefold induction reached 8 h following γ-irradiation. Run-on analyses indicated a predominantly transcriptional regulation of cyclin E. Stable overexpression of cyclin E, but not cyclin D1, sensitized IM-9 cells to γ-irradiation-induced apoptosis; in contrast, a dominant-negative Cdk2, prevented apoptosis. Irradiation of cyclin E overexpressing cells led to an enhanced caspase activation and exposure of the phosphatidylserine on the plasma membrane, two key markers of apoptosis, events which were completely abolished in cells expressing a dominant-negative Cdk2. This study identifies cyclin E as a target for activation by ionizing radiation and which plays a functional role in apoptosis of hematopoietic cells.
Keywords: Cyclin E, cyclin dependent kinase 2, apoptosis, ionizing radiation, caspase-3
Introduction
Progression through the eukaryotic cell cycle is controlled by the cyclin dependent kinases (Cdks) (Elledge, 1996). The activity of these Cdks is regulated positively by cyclins, their associated catalytic partners, and negatively by binding of Cdk inhbitors (CKIs). Activation of cyclin-Cdk complexes results in a cascade of protein phosphorylations that ultimately induces cell cycle progression. As these cyclins and Cdks are important components of cell cycle control and cell proliferation, alterations in the expression of the corresponding genes or mutational changes leads to tumorigenesis (Hunter and Pines, 1994).
Cyclin E, one of the G1 cyclins, is a critical regulator of the G1/S transition of the cell cycle and initiation of DNA replication. Cyclin E was identified originally by complementation of a yeast G1 cyclin mutant (Koff et al., 1991; Lew et al., 1991) and it was later shown to be deregulated and overexpressed in several tumors including breast, colon, and prostate carcinomas (Keyomarsi et al., 1995; Sherr, 1996). The cyclin E mRNA levels increase sharply in late G1 followed by accumulation of cyclin E protein levels. The levels of cyclin E and its associated Cdk2 kinase activity reach a maximum at the G1/S boundary (Dulic et al., 1992; Koff et al., 1992; Lew et al., 1991).
While cyclin E complexes phosphorylate the retinoblastoma protein [pRb; (Elledge, 1996; Sherr, 1996)], other substrates must exist during late G1, since inducible expression of cyclin E in fibroblasts accelerates G1/S progression, without affecting the kinetics of pRb phosphorylation (Resnitzky and Reed, 1995). Moreover, unlike the D-type cyclins, cyclin E is essential for cell-cycle progression in pRb-deficient cells (Ohtsubo et al., 1995), and its ectopic expression bypasses pRb-mediated cell cycle arrest (Alevizopoulos et al., 1997; Lukas et al., 1997). Furthermore, cyclin E is required for S phase entry in Drosophila (Duronio et al., 1996). Most importantly, proteins implicated in the initiation of DNA synthesis, such as Cdc6 (Jiang et al., 1999) and NPAT (Zhao et al., 1998) are phosphorylated by cyclin E complexes.
Genotoxic agents, such as ionizing radiation, induce apoptosis in many cell types, most potently in those of hematopoietic origin (Chen et al., 2000; Gong et al., 1999). Apoptosis is frequently associated with proliferating cells, implying the existence of molecules in late G1 and S phase whose activities facilitate execution of the apoptotic process. Two key early cellular events associated with apoptosis are the exposure of the phosphatidylserine on the plasma membrane and activation of the ICE/CED-3 family of cysteine proteases, named caspases. Caspase activation is a critical regulator of the execution phase of apoptosis induced by γ-irradiation, a prototypic genotoxic agent (Chen et al., 2000; Gong et al., 1999). Caspases are synthesized as inactive zymogens which, after proteolytic cleavage, generate active enzymes which then further cleave other caspases, most important of which is caspase 3, as well as critical cellular proteins (Gong et al., 1999).
The regulation of cyclin E by genotoxic agents has not been investigated in hematopoietic cells, as previous studies focused mostly on fibroblasts or epithelial cells. We examined the response of cyclin E to radiation and the possible role of increased cyclin E expression in apoptosis of multiple myeloma and T cell lymphoma cells. We found that increased cyclin E levels appeared early, at a time of activation of key apoptotic markers. Consistent with a role of cyclin E in apoptosis, overexpression of cyclin E, but not cyclin D1, greatly sensitized multiple myeloma cells to radiation, while expression of dnCdk2 blocked this process. Our data indicate that cyclin E is a novel target of radiation with an important role in apoptosis of tumor cells of hematopoietic origin.
Results
Cyclin E protein levels and Cdk2 kinase activity are induced by ionizing radiation in hematopoietic cells
Treatment with ionizing radiation efficiently kills hematopoietic cells, including multiple myeloma (Chen et al., 2000), and T cell lymphoma cell lines (Gong et al., 1999). To determine the role of cell cycle regulators in apoptosis, we examined the levels and activity of several cyclins and their interacting partner Cdks during radiation-induced apoptosis. Immunoblot analysis of IM-9 cells revealed no significant changes in the levels of cyclin A, cyclin D1, Cdk2, or Cdk4. In contrast, cyclin E levels were increased, and therefore our further work focused on its analysis. There were increased levels of cyclin E by 2 h following exposure to 10 Gy γ-irradiation and which reached a threefold increase by 8 h after irradiation (Figure 1a). Cyclin E upregulation was not limited to IM-9 cells, since a similar increase was also observed in the RPMI 8226 multiple myeloma and MOLT-4 T cell lymphoma cells (Figure 1b,c). In contrast, no changes in cyclin E expression were found in several tumor cell lines of epithelial origin following γ-irradiation (data not shown).
Figure 1.
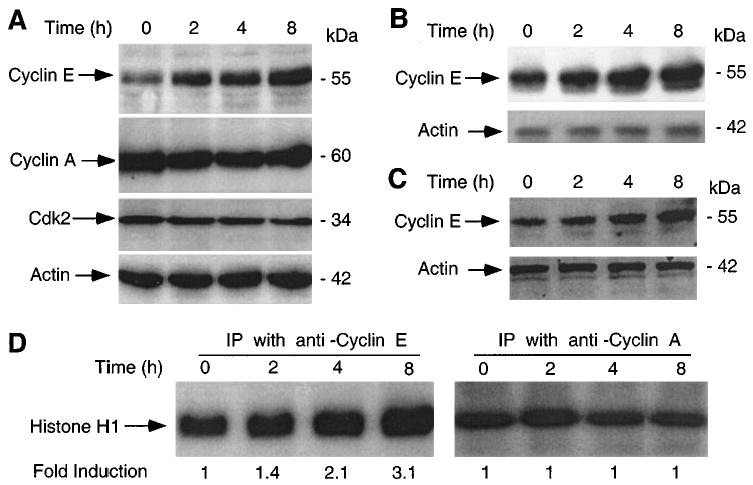
Induction of cyclin E protein following γ-irradiation. (a) IM-9 cells were irradiated (10 Gy), and 20 μg of protein subjected to 12% SDS – PAGE as described in Materials and methods. Immunoblot analyses were done using anti-cyclin E, cyclin A, Cdk2 and β-actin primary antibodies, the corresponding HRP-conjugated secondary antibodies and ECL. Following γ-irradiation, RPMI 8226 (b) and MOLT-4 (c) cells were examined by immunoblotting, as above. (d) The cyclin E- and cyclin A-associated kinase activities were determined in IM-9 cells treated identical as in (a). Proteins (250 μg) were subjected to immunoprecipitation with 0.5 μg anti-cyclin E and cyclin A antibodies. Immunocomplex kinases were assayed using H1 Histone as a substrate
Next, we sought to examine the functional significance of cyclin E induction by determining the cyclin E/Cdk2-associated kinase activity, the best characterized cellular function of cyclin E. There was a significant increase in phosphorylation of the H1 histone substrate, with the cyclin E/Cdk2 kinase activity upregulation starting at 2 h and reaching a threefold induction by 8 h after irradiation (Figure 1d). In contrast, there were no changes in the cyclin A/Cdk2-associated kinase activity. The kinetics of cyclin E-associated kinase activity reflected the increase in cyclin E expression levels, since Cdk2 levels remained constant.
Cyclin E RNA is induced by ionizing radiation
We next sought to determine whether the steady-state levels of cyclin E mRNA reflected the upregulation of cyclin E protein. Northern analyses of IM-9 cellular RNA indicated a low basal level of the 1.6 kb cyclin E transcript in untreated IM-9 cells. Cyclin E RNA levels increased following irradiation in a time and dose-dependent manner. Thus cyclin E RNA started to increase by 2 h and reached a maximum level by 4 h following 20 Gy γ-irradiation, when it showed a threefold induction in irradiated as compared to untreated cells (Figure 2a). The induction of cyclin E was faster at the higher dose, reaching a peak by 2 – 4 h after 20 Gy γ-irradiation, as compared to 8 h required to reach a maximal induction at the lower dose (Figure 2b). The levels of cyclin E RNA returned to their normal, pre-irradiation levels, after 16 and 24 h following 20 and 10 Gy, respectively (Figure 2a,b). This increase was specific to cyclin E since radiation had no effect on the levels of 36B4. In contrast, there was a slight decrease in cyclin A levels (Figure 2a). Overall, the kinetics of cyclin E mRNA and protein induction following irradiation were quite similar, indicating that cyclin E induction by γ-irradiation was likely to be at the mRNA level.
Figure 2.
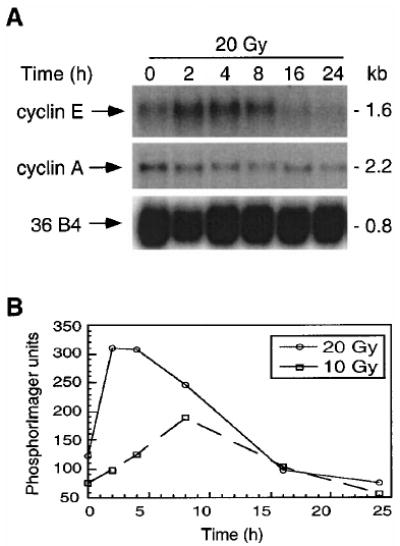
Induction of cyclin E mRNA following γ-irradiation. IM-9 cells were irradiated and RNA isolated as described in Materials and methods. (a) The steady state mRNA expression was analysed by Northern hybridization after 20 μg of total RNA was resolved on a formamide-agarose gel and transferred to a nylon membrane, using probes for cyclin E, cyclin A, and as a control, 36B4. The size of the transcripts, in kb, is indicated on the right. (b) The dose-dependent regulation of cyclin E mRNA levels was determined following 10 or 20 Gy irradiation. The ordinate shows fold induction, representing values obtained by normalizing levels of mRNA to those of untreated cells and to that of 36B4
Transcriptional control of cyclin E by ionizing radiation
In order to study whether radiation induced cyclin E RNA at transcriptional or post-transcriptional levels, IM-9 cells were first irradiated for 8 h to induce cyclin E gene expression and then exposed to actinomycin D, to inhibit further cyclin E RNA synthesis. This treatment led to decreased levels of cyclin E, with a half-life of its RNA of approximately 1.5 h. Similar results were obtained when actinomycin D was added 6 h following irradiation (data not shown). There were no significant differences between irradiated and untreated cells in terms of mRNA stability, suggesting a transcriptional control of cyclin E expression (Figure 3a – b). To further determine whether increased levels of cyclin E RNA are associated with post-transcriptional regulation of the cyclin E transcript, control and irradiated IM-9 cells were exposed to the protein synthesis inhibitor cycloheximide (Figure 3c). There was no significant effect of cycloheximide on cyclin E mRNA expression, indicating that mRNA upregulation did not require de novo protein synthesis.
Figure 3.
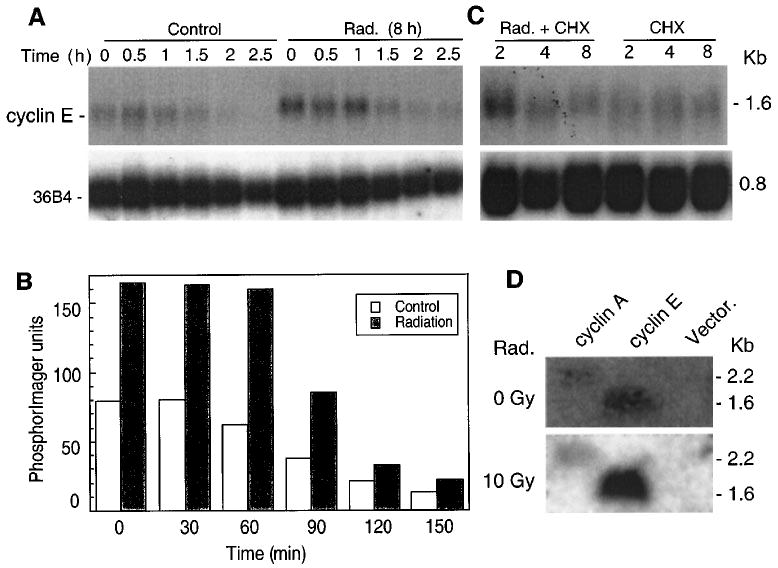
Transcriptional control of cyclin E in γ-irradiation-induced apoptosis. (a) Eight h following 0 and 10 Gy γ-irradiation, cells were further treated with actinomycin D (5 μg/ml) and subjected to Northern analysis as described for Figure 2 to determine mRNA stability. (b) The half-life of cyclin E mRNA was determined following PhosphorImager analyses. (c) Post-transcriptional regulation of cyclin E RNA expression was examined by treating control or irradiated cells with cycloheximide (CHX at 10 μg/ml; added 1 h prior to irradiation) followed by Northern hybridization, (d) Nuclear run-on assays were performed to determine new RNA synthesis. 5 × 10⁷ cells/assay were lysed in 0.1% NP-40 lysis buffer to isolate nuclei, and incubated in reaction buffer at 30°C for 30 min, as described in Materials and methods. After proteinase K digestion, the RNA was extracted and used as a hybridization probe against membranes containing DNA of cyclin E, cyclin A, and pCDNA3 (Vector)
In order to unequivocally establish that transcriptional mechanisms were responsible for the regulation of cyclin E gene expression, we performed run-on assays. A low level of cyclin E gene transcription was detected in untreated IM-9 cells. However, when the IM-9 cells were irradiated for 8 h, cyclin E mRNA was induced approximately threefold (Figure 3d). In contrast, there were no changes in the levels of cyclin A in irradiated, as compared to those of untreated cells. These results clearly indicate that cyclin E expression is regulated mostly at the transcriptional level.
Overexpression of cyclin E sensitizes to, while inactivation of Cdk2 kinase prevents radiation-induced apoptosis
If cyclin E expression had a role in apoptosis, then its overexpression, and not of another G1 cyclin, would be expected to sensitize cells to apoptosis-inducing agents, such as radiation. Conversely, inactivation of the cyclin E by overexpression of a dominant-negative (dn) Cdk2 should prevent the radiation-induced cell death. We examined a pool of IM-9 derived cell clones stably expressing exogenous cyclin E, IM-9 cell clones stably overexpressing exogenous FLAG-tagged cyclin D1, and IM-9 cell clones stably overexpressing exogenous HA-tagged dnCdk2 (Figure 4a – c). The levels of ectopic cyclin E were 2 – 3-fold higher as compared to parental IM-9 cells (Figure 4a), but comparable to that of IM-9 cells following irradiation (Figure 1a). We next examined the IM-9 transfectants by first examining caspase activation, a crucial biochemical event required for apoptosis induced by many agents including γ-irradiation (Chen et al., 2000; Gong et al., 1999). The DEVD-pNA cleavage, representing caspase 3-like activity in cells undergoing apoptosis, started to increase significantly by 4 h following γ-irradiation of IM-9 cells. The caspase activity of cyclin E-over-expressing cells was more than twofold higher compared to parental cells at 4 h following irradiation, with significant differences in activity being maintained up to 20 h (Figure 4d). In contrast, the DEVD-pNA cleavage activity of cells expressing dnCdk2 was not significantly increased up to 20 h, while that of IM-9/cyclin D1 cells was indistinguishable from that of parental cells.
Figure 4.
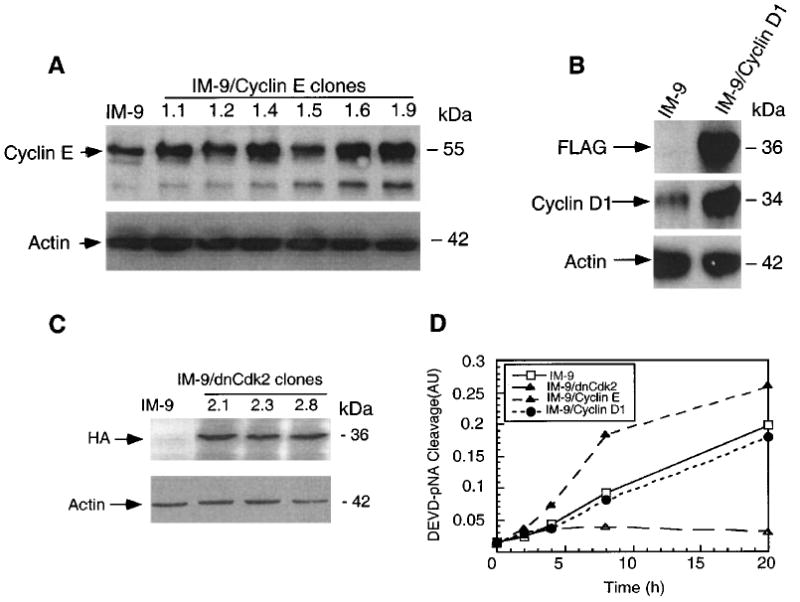
Forced Cyclin E expression sensitizes IM-9 cells to radiation. IM-9, IM-9/cyclinE, IM-9/dnCdk2, and IM-9/cyclin D1 cells were lysed and subjected to SDS – PAGE. Immunoblot analyses were carried out with anti-cyclin E, (a) FLAG, cyclin D1 (b), HA (c) and β-actin antibodies. (d) Protease assays were performed on IM-9 and a pool of cell clones overexpressing cyclin E, dnCdk2, and cyclin D1, using 20 μg cell lysate/well and 0.1 mM Ac-DEVD-pNA as described in Materials and methods. Samples were incubated at 37°C for 60 min and the enzyme catalyzed release of p-nitroanilide (pNA) from the DEVD-pNA substrate determined. Mean values, presented as arbitrary units (AU) are representative of three experiments ± s.d. (n=3)
As a second marker of apoptosis, we also determined phosphatidylserine exposure on the cell membrane following irradiation, using Annexin V-FITC. Membrane changes characteristic of apoptotic cells were present in IM-9 and IM-9/cyclin E cells, with 17 and 79.2%, respectively, being Annexin V-positive by 8 h following γ-irradiation. This sensitization was specific to cyclin E, and not a general effect of any G1 cyclin whose overexpression might lead to a faster transit through the cell cycle, since cyclin D1 overexpression had a cell death kinetics indistinguishable from that of parental IM-9 cells (18.4%, Figure 5a). In contrast, inhibiting cyclin E kinase activity by expressing dnCdk2 in parental IM-9 cells resulted in no changes in the number of Annexin V-positive cells at 8 h (Figure 5a) or 20 h (data not shown) after irradiation.
Figure 5.
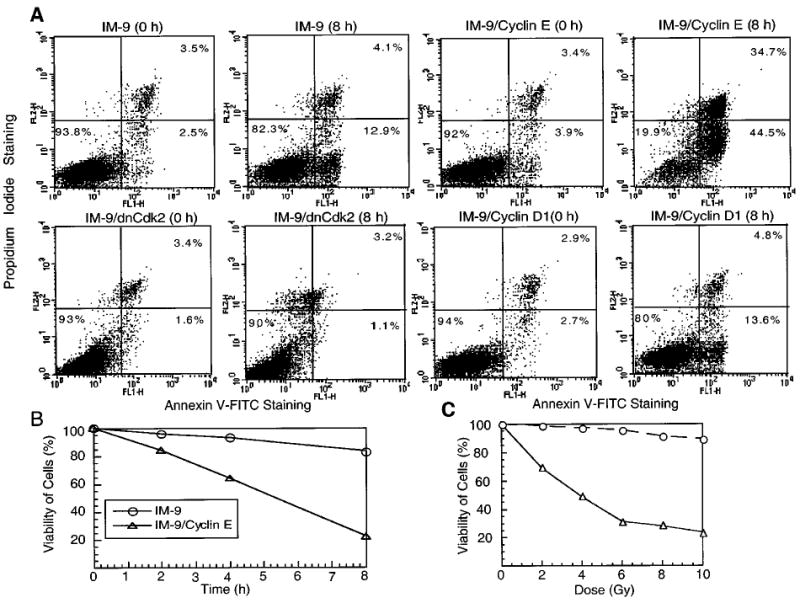
Cyclin E overexpression enhances phosphatidylserine exposure on the plasma membrane. (a) Parental IM-9, IM-9/cyclinE, IM-9/dnCdk2, and IM-9/cyclin D1 cells were stained with Annexin V- FITC and PI at 0 and 8 h following γ-irradiation. Apoptotic cells are represented by the numbers indicating Annexin V positivity (right panels). The upper right panel indicates late-apoptotic or necrotic cells which have become permeable to PI. The data were representative of two separate experiments and displayed after debris were gated out against forward and side scatter. (b) Following 10 Gy γ-irradiation, IM-9 and IM-9/cyclin E cells were stained as in (a). Viable cells, representing Annexin V-negative cells, were normalized to control cells and represented on the ordinate. (c) IM-9/cyclin E cells were subjected to various doses of γ-irradiation and Annexin V-negative cells were represented as in (b)
A time-course experiment showed that 85, 68 and 20.8% of IM-9/cyclin E cells were viable (Annexin V-negative) by 2, 4 and 8 h, respectively following γ-irradiation (Figure 5b). This indicates that the majority of cells overexpressing cyclin E were becoming apoptotic at a time at which only a few parental cells showed similar characteristics. Moreover, from the radiation dose response curve it was clear that the sensitization by cyclin E overexpression was radiation dose-dependent. At 2 and 4 Gy, 25 and 45% of IM-9/cyclin E cells were Annexin V-positive, with no effect on parental cells. At 10 Gy, 80% IM-9/cyclin E cells were Annexin V-positive, as compared to only 10% of parental cells (Figure 5c). These data further demonstrate a direct role of cyclin E in apoptosis of IM-9 cells.
Cyclin E induction is independent of p53 function
We next addressed whether cyclin E induction was dependent on p53 function, since treatment with various genotoxic agents, such as radiation, results in increased p53 protein and apoptosis of hematopoietic cells (Gong et al., 1999). To directly determine whether cyclin E expression was dependent on p53 function, we examined cyclin E expression in IM-9 and derivative cells containing a stably-expressed mutated 135-Val/p53 (dnp53), which renders p53 to act as a dominant-negative molecule by inactivating the function of the endogenous wild-type p53 (Yonish et al., 1991). As expected, the p53 function was abolished in the dnp53-expressing IM-9 cells by two independent functional assays carried out in two independent clones. First, there was no change in the levels of p53 following irradiation of these cells as compared to IM-9 cells in which p53 protein was stabilized (Figure 6a). Moreover, the levels of Bax, a well-known pro-apoptotic transcriptional target of p53, which has been previously reported to be involved in radiation-induced apoptosis (Gong et al., 1999) did not change in cells harboring dnp53, while Bax levels were robustly increased in irradiated IM-9 cells. Cyclin E was induced in cells containing dnp53, similar to the parental IM-9 cells (Figure 6b), and in the closely related multiple myeloma cell line RPMI 8226 (Figure 1c). RPMI 8226 express a mutated p53 (Mazars et al., 1992), the levels of which were not stabilized following irradiation (data not shown).
Figure 6.
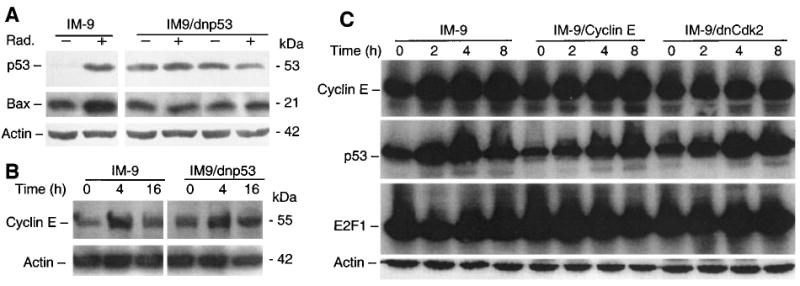
Induction of cyclin E is independent of p53. Parental and dnp53 over-expressing IM-9 cells were irradiated, lysed, and subjected to SDS – PAGE. Immunoblot analyses were carried out to examine expression of p53, Bax (a), and cyclin E (b) in IM-9 and IM-9/dnp53 cells, using the corresponding primary antibodies and, as a control, β-actin. (c) Similar immunoblot analyses were carried out following irradiation of IM-9, IM-9/cyclin E and IM-9/dnCdk2 cells for expression of cyclin E, p53, E2F1, and β-actin
The above results indicate that cyclin E induction by irradiation was independent of p53 function, but did not address whether p53 played a role in cyclin E-induced apoptosis. However, by examining p53 levels in IM-9/cyclin E and IM-9/dnCdk2 cells following irradiation, it is clear that neither cyclin E overexpression, nor inactivating cyclin E kinase significantly effected p53 stabilization (Figure 6c), even though it completely abrogated cyclin E induction and apoptosis. In contrast to p53 modulation, there were no significant changes in the levels of E2F1 following irradiation in any of these IM-9 transfectants.
Discussion
The studies described above identify cyclin E as a novel target of ionizing radiation, and which plays an important role in apoptosis of hematopoietic tumor cell lines, particularly multiple myeloma and T-cell lymphoma. The increase in cyclin E mRNA and protein levels mirrored the appearance of catalytically active cyclin E/Cdk2 complexes, similar to previous observations made in other cell types (Dulic et al., 1992; Koff et al., 1992). In contrast to cyclin E, cyclin A RNA levels were downregulated, consistent with an earlier report in human fibroblasts (Dulic et al., 1994).
We demonstrate that forced, stable expression of cyclin E in hematopoietic cells accelerated and enhanced caspase activation and phosphatidylserine exposure, thus sensitizing these cells to irradiation. This effect was specific to cyclin E as cyclin D1 overexpression had no effect. Most importantly, inactivation of Cdk2 kinase by expression of dnCdk2 protected IM-9 cells from apoptosis following irradiation. As in our study, Cdk2 activation was reported to influence the caspase cascade activation (Gil-Gomez et al., 1998). Importantly, similar observations were made in noncycling developing thymocytes, in which Cdk2 was found to be activated whereas its inhibition completely protected from apoptosis (Hakem et al., 1999). As suggested, the link between cell cycle control and cell death could serve to ensure the presence in dying cells of specific Cdk components, especially cyclins. These findings indicate that inappropriate activation of cyclin E in hematopoietic cells is likely to result in their entry into an abortive cell cycle, leading to apoptosis.
Induction of apoptosis by various stimuli has been shown to require activation of Cdk2 (Levkau et al., 1997; Meikrantz & Schlegel, 1996), while expression of Cdk inhibitors in neurons (Park et al., 1998), or during myocyte differentiation (Wang and Walsh, 1996), prevented apoptosis. However, in contrast to our studies, cyclin A and not cyclin E-dependent kinases have been implicated in apoptosis of these cells. Moreover, conditional cyclin D1, but not cyclin E expression was reported to be involved in apoptosis of rat fibroblasts under serum starvation (Sofer-Levi & Resnitzky, 1996). Finally, deregulated cyclin D1, by overexpression (Coco Martin et al., 1999) or its inactivation (Sauter et al., 1999) also induced apoptosis. Ectopic expression of cyclin D1, however, did not contribute to apoptosis of the hematopoietic cells we have examined, indicating a cell type specificity in the cellular response to the ectopic expression of various cyclins.
It has been reported that cyclin E is a downstream target of E2F1 transcriptional regulation (DeGregori et al., 1995). We have previously shown that constitutive levels of several E2F1 target genes were increased in Rb-deficient fibroblasts (Almasan et al., 1995a). Similarly, cyclin E levels were increased constitutively when Rb has been inactivated by HPV16-E7 oncogene expression in human forskin fibroblasts (Martin et al., 1998). Moreover cyclin E/Cdk2 kinase levels were also induced following genotoxic stress in human colon cancer cells by: (i) fluoropyrimidines in HT29 but not SW620 cells (Lawrence et al., 1996), or (ii) low concentrations of actinomycin D in HPV16-E7-expressing RKO cells (Jones and Munger, 1997). These reports suggest that the transcriptional factor responsible for cyclin E induction might be E2F. However, E2F1 has been recently reported to be upregulated in response to DNA damage in a manner analogous to p53, with its levels being unchanged following DNA damage of epithelial cells with mutated p53 (Blattner et al., 1999). In contrast, we found that cyclin E was upregulated in cells with mutated p53 expressed either endogenously (RPMI 8226), or following stable transfection. Moreover, p53 was induced even in dnCdk2-expressing cells, which lacked any changes in cyclin E expression levels following irradiation. Although further work is required to establish whether E2F plays a role in radiation-induced cyclin E expression, it is quite possible that cyclin E is differentially regulated by mitogens and radiation, particularly in the hematopoietic cell lines we have investigated. Since it has been shown that cyclin E expression can decrease the time it takes cells to complete G1 and enter S phase (Ohtsubo et al., 1995; Resnitzky and Reed, 1995, Mazumder S and Almasan A, unpublished), these findings suggest that inappropriate cellular S phase entry can lead to apoptosis and genetic instability (Almasan et al., 1995b).
In summary, our data indicate that cyclin E is a novel cellular target of radiation, and that its activation plays a functional role in apoptosis of hematopoietic cells, in addition to its reported key regulatory role in the control of the G1 to S phase transition and the initiation of DNA replication. Cyclin E is therefore unique among most proteins in its essential role in three fundamental biological processes. Further investigations into the role of cyclin E in cell death are likely to shed new light on how these events might be also coupled to cell cycle control and proliferation.
Materials and methods
Cells, cell culture and treatments
Human IM-9 and RPMI 8226 multiple myeloma and MOLT-4 T cell lymphoma cells were cultured in RPMI 1640 medium supplemented with 10% fetal bovine serum and antibiotics (GIBCO BRL, Grand Island, NY, USA). Exponentially growing cells were subjected to γ-irradiation (10 Gy unless otherwise specified) as described (Gong et al., 1999) with a 137Cs source emitting at a fixed dose rate of 2.8 Gy/min.
IM-9 cells were transfected with pLXSN-cyclin E, dnCdk2 (Ohtsubo and Roberts, 1993), Flag-cyclin D1 (Alevizopoulos et al., 1997) and pCDNA3, or dnp53 plasmid DNA (a gift from A Gudkov and P Chumakov) and were selected in the presence of 0.8 – 1 mg/ml G418 (GIBCO), except dnp53-containing cells, which were grown with 250 μg/ml hygromycin (Calbiochem, La Jolla, CA, USA). All other chemicals were from Sigma Chemical Co. (St Louis, MO, USA), unless otherwise specified.
Immunoblot analysis and cyclin E-kinase assays
Following 10 or 20 Gy γ-irradiation, 105 cells were collected at different time points and lysed using NP-40 lysis buffer A, containing 150 mm NaCl, 25 mM HEPES pH 7.4, 1% (v/v) NP-40, 1 mm EGTA, EDTA, and PMSF, 10 μg/ml aprotinin, leupeptin, and pepstatin. Ten to twenty μg of cellular protein was resolved on 10% SDS – PAGE and transferred to nitrocellulose membrane (Schleicher and Schull, Keen, NH, USA). Primary antibodies used in immunoblot analysis were from Santa Cruz Biotech [Santa Cruz, CA, USA); cyclin E (C19), cyclin A (H432), Cdk2 (M2), E2F1 (C-20)], Oncogene Research Products [Cambridge, MA, USA; p53 (DO1)], Pharmingen [San Diego, CA, USA; Bax), Babco (Richmond, CA, USA; HA), and Sigma [FLAG (M2), β-actin] with the appropriate IgG-conjugated horseradish peroxidase secondary antibodies (Amersham Pharmacia Biotech, Piscataway, NJ, USA). Immunoreactive bands were detected using enhanced chemiluminescence (ECL; Amersham Pharmacia Biotech) and visualized by autoradiography.
Kinase assays were performed as described (Pagano, 1995). IM-9 cell lysates (250 μg) in 0.1% NP-40 lysis buffer A, supplemented with 1 mm Na3VO4, and 50 mm NaF, were used for immunoprecipitations with 0.5 μg anti- cyclin E or cyclin A antibodies for 2 h at 4°C. Following 1 h incubation with protein A agarose (Amersham Pharmacia Biotech) at 4°C, beads were washed three times with lysis buffer, once with kinase buffer (50 mM HEPES, pH 7.5, 10 mm MgCl2, 1 mm DTT), and were suspended in 30 μl kinase buffer containing 1 μg H1 histone substrate (Calbiochem), 2.5 mM EGTA, 10 mm β-glycerophosphate, 0.1 mm Na3VO4, 1 mm NaF, 20 mm ATP, and 10 μCi of γ-ATP. After incubation for 30 min at 30°C, the reactions were stopped with Lammeli buffer, boiled for 5 min, and resolved on SDS – PAGE. Phosphorylated proteins were visualized by autoradiography.
RNA analyses
RNA was extracted by the Trizol method (Gong et al., 1999) and 20 μg of total RNA was resolved on a formamide-agarose gel and transferred to a nylon membrane (Schleicher and Schuell). Northern blots were hybridized with random primed cDNA probes for cyclin E, cyclin A (Ohtsubo and Roberts, 1993) and 36B4, as described (Almasan et al., 1995a). Autoradiograms were scanned using PhosphorImager Storm 840, and values were calculated with the ImageQuant program (Molecular Dynamics, Sunnyvale, CA, USA).
For the run-on assay, 5 × 10⁷ IM-9 cells were lysed in 0.1% NP-40-buffer to isolate nuclei, then resuspended in 200 μl of glycerol storage buffer and incubated in an equal volume of reaction buffer containing 100 mm KCl, 0.5 mm ATP, GTP and CTP and 100 μCi of α[32P]UTP at 30°C for 30 min (Ausubel et al., 1994). The reaction was terminated by addition of 100 μl of 10 mm Tris-HCl (pH 8.0), 1 mm Na2EDTA, 100 mm NaCl, 20 mm MgCl2, 150 units/ml RNAsin, and 40 μg/ml DNase and incubated at 30°C for 15 min. After proteinase K digestion, the RNA was extracted again. Newly elongated 32P-labeled RNA transcripts were then hybridized to plasmid cDNA inserts for cyclin E, cyclin A, or a control pCDNA3 plasmid by the method of Southern (Ausubel et al., 1994), following fractionation on a 1% TBS-agarose gel. Hybridization was performed with 107 c.p.m. of 32P-labeled RNA/ml of hybridization buffer for 72 h at 42°C. Autoradiography was performed for 3 – 7 days and auto-radiograms were scanned using the PhosphorImager.
Flow cytometry
To detect phosphatidylserine exposure on cell membranes, 2 × 10⁵ IM-9 cells were washed two times with PBS, and then stained with fluorescein isothiocyanate (FITC)-conjugated Annexin V (R & D Systems, Minneapolis, MN, USA). Flow cytometric measurements were performed following treatment with propidium iodide (PI) by bivariate flow cytometry as described (Chen et al., 2000; Gong et al., 1999), using a FACScan, and analysed with CellQuest software (Becton Dickinson, San Jose, CA, USA) on mean values obtained from the cell population from which debris were gated out.
Protease assays
Cells were lysed on ice in NP-40 lysis buffer in the presence of a protease inhibitor cocktail (Gong et al., 1999). The lysates were centrifuged at 13 000 r.p.m. for 12 min at 4°C, and 20 μg of protein was used for cysteine protease assays which also included 0.1 mm acetyl-Asp-Glu-Val-Asp-p-nitroanilide (Ac-DEVD-pNA; Calbiochem). Samples were incubated at 30°C for 1 h, and enzyme-catalyzed release of p-nitroanilide was monitored at 405 nm in a 96-well microtiter plate reader (Spectramax 340, Molecular Devices, Sunnyvale, CA, USA).
Acknowledgments
We would like to thank J Roberts (Fred Hutchinson Cancer Research Center), K Alevizopoulos and B Amati (Swiss Institute for Experimental Cancer Research, IS-REC), A Gudkov and P Chumakov (University of Illinois at Chicago) for various constructs. We also thank Q Chen, G Chen, R Gronostajski and M Hitomi for critical reading of the manuscript and A Raber (Flow Cytometry Core facility) for help with flow cytometry; The FACS Vantage Cell Sorter was funded by the WM Keck Foundation. This work was supported in part by research grants from the US National Institutes of Health (RO1 CA82858 and CA81504).
References
- Alevizopoulos K, Vlach J, Hennecke S, Amati B. EMBO J. 1997;16:5322 – 5333. doi: 10.1093/emboj/16.17.5322. [DOI] [PMC free article] [PubMed] [Google Scholar]
- Almasan A, Linke S, Paulson T, Huang L-C, Wahl GM. Cancer Metast Rev. 1995b;14:59 – 73. doi: 10.1007/BF00690212. [DOI] [PubMed] [Google Scholar]
- Almasan A, Yin Y, Kelly RE, Lee EY, Bradley A, Li W-W, Bertino JR, Wahl GM. Proc Natl Acad Sci USA. 1995a;92:5436 – 5440. doi: 10.1073/pnas.92.12.5436. [DOI] [PMC free article] [PubMed] [Google Scholar]
- Ausubel FM, Brent R, Kingston RE, Moore DD, Seidman JG, Smith JA and Struhl K. (1994). Current Protocols in Molecular Biology Greene Publishing Associates & Wiley-Interscience: New York.
- Blattner C, Sparks A, Lane D. Mol Cell Biol. 1999;19:3704 – 3713. doi: 10.1128/mcb.19.5.3704. [DOI] [PMC free article] [PubMed] [Google Scholar]
- Chen Q, Gong B, Almasan A. Cell Death Diff. 2000;7:227 – 233. doi: 10.1038/sj.cdd.4400629. [DOI] [PMC free article] [PubMed] [Google Scholar]
- Coco Martin JM, Balkenende A, Verschoor T, Lallemand F, Michalides R. Cancer Res. 1999;59:1134 – 1140. [PubMed] [Google Scholar]
- DeGregori J, Kowalik T, Nevins JR. Mol Cell Biol. 1995;15:4215 – 4224. doi: 10.1128/mcb.15.8.4215. [DOI] [PMC free article] [PubMed] [Google Scholar]
- Dulic V, Kaufmann WK, Wilson SJ, Tlsty TD, Lees E, Harper JW, Elledge SJ, Reed SI. Cell. 1994;76:1013 – 1023. doi: 10.1016/0092-8674(94)90379-4. [DOI] [PubMed] [Google Scholar]
- Dulic V, Lees E, Reed SI. Science. 1992;257:1958 – 1961. doi: 10.1126/science.1329201. [DOI] [PubMed] [Google Scholar]
- Duronio RJ, Brook A, Dyson N, O'Farrell PH. Genes Dev. 1996;10:2505 – 2513. doi: 10.1101/gad.10.19.2505. [DOI] [PubMed] [Google Scholar]
- Elledge SJ. Science. 1996;274:1664 – 1672. doi: 10.1126/science.274.5293.1664. [DOI] [PubMed] [Google Scholar]
- Gil-Gomez G, Berns A, Brady HJ. EMBO J. 1998;17:7209 – 7218. doi: 10.1093/emboj/17.24.7209. [DOI] [PMC free article] [PubMed] [Google Scholar]
- Gong B, Chen Q, Endlich B, Mazumder S, Almasan A. Cell Growth Diff. 1999;10:491 – 502. [PubMed] [Google Scholar]
- Hakem A, Sasaki T, Kozieradzki I, Penninger JM. J Exp Med. 1999;189:957 – 968. doi: 10.1084/jem.189.6.957. [DOI] [PMC free article] [PubMed] [Google Scholar]
- Hunter T, Pines J. Cell. 1994;79:573 – 582. doi: 10.1016/0092-8674(94)90543-6. [DOI] [PubMed] [Google Scholar]
- Jiang W, Wells NJ, Hunter T. Proc Natl Acad Sci USA. 1999;96:6193 – 6198. doi: 10.1073/pnas.96.11.6193. [DOI] [PMC free article] [PubMed] [Google Scholar]
- Jones DL, Munger K. J Virol. 1997;71:2905 – 2912. doi: 10.1128/jvi.71.4.2905-2912.1997. [DOI] [PMC free article] [PubMed] [Google Scholar]
- Keyomarsi K, Conte D, Jr, Toyofuku W, Fox MP. Oncogene. 1995;11:941 – 950. [PubMed] [Google Scholar]
- Koff A, Cross F, Fisher A, Schumacher J, Leguellec K, Philippe M, Roberts JM. Cell. 1991;66:1217 – 1228. doi: 10.1016/0092-8674(91)90044-y. [DOI] [PubMed] [Google Scholar]
- Koff A, Giordano A, Desai D, Yamashita K, Harper JW, Elledge S, Nishimoto T, Morgan DO, Franza BR, Roberts JM. Science. 1992;257:1689 – 1694. doi: 10.1126/science.1388288. [DOI] [PubMed] [Google Scholar]
- Lawrence TS, Davis MA, Loney TL. Cancer Res. 1996;56:3203 – 3206. [PubMed] [Google Scholar]
- Levkau B, Koyoma H, Raines EW, Clurman BE, Herren B, Orth K, Roberts JM. Molec Cell. 1997;1:553 – 563. doi: 10.1016/s1097-2765(00)80055-6. [DOI] [PubMed] [Google Scholar]
- Lew DJ, Dulic V, Reed SI. Cell. 1991;66:1197 – 1206. doi: 10.1016/0092-8674(91)90042-w. [DOI] [PubMed] [Google Scholar]
- Lukas J, Herzinger T, Hansen K, Moroni MC, Resnitzky D, Helin K, Reed SI, Bartek J. Genes Dev. 1997;11:1479 – 1492. doi: 10.1101/gad.11.11.1479. [DOI] [PubMed] [Google Scholar]
- Martin LG, Demers GW, Galloway DA. J Virol. 1998;72:975 – 985. doi: 10.1128/jvi.72.2.975-985.1998. [DOI] [PMC free article] [PubMed] [Google Scholar]
- Mazars GR, Portier M, Zhang XG, Jourdan M, Bataille R, Theillet C, Klein B. Oncogene. 1992;7:1015 – 1018. [PubMed] [Google Scholar]
- Meikrantz W, Schlegel R. J Biol Chem. 1996;271:10205 – 10209. doi: 10.1074/jbc.271.17.10205. [DOI] [PubMed] [Google Scholar]
- Ohtsubo M, Roberts JM. Science. 1993;259:1908 – 1912. doi: 10.1126/science.8384376. [DOI] [PubMed] [Google Scholar]
- Ohtsubo M, Theodoras AM, Schumacher J, Roberts JM, Pagano M. Mol Cell Biol. 1995;15:2612 – 2624. doi: 10.1128/mcb.15.5.2612. [DOI] [PMC free article] [PubMed] [Google Scholar]
- Park DS, Morris EJ, Padmanabhan J, Shelanski ML, Geller HM, Greene LA. J Cell Biol. 1998;143:457 – 467. doi: 10.1083/jcb.143.2.457. [DOI] [PMC free article] [PubMed] [Google Scholar]
- Resnitzky D, Reed SI. Mol Cell Biol. 1995;15:3463 – 3469. doi: 10.1128/mcb.15.7.3463. [DOI] [PMC free article] [PubMed] [Google Scholar]
- Sauter ER, Nesbit M, Litwin S, Klein-Szanto AJ, Cheffetz S, Herlyn M. Cancer Res. 1999;59:4876 – 4881. [PubMed] [Google Scholar]
- Sherr CJ. Science. 1996;274:1672 – 1677. doi: 10.1126/science.274.5293.1672. [DOI] [PubMed] [Google Scholar]
- Sofer-Levi Y, Resnitzky D. Oncogene. 1996;13:2431 – 2437. [PubMed] [Google Scholar]
- Wang J, Walsh K. Science. 1996;273:359 – 361. doi: 10.1126/science.273.5273.359. [DOI] [PMC free article] [PubMed] [Google Scholar]
- Yonish RE, Resnitzky D, Lotem J, Sachs L, Kimchi A, Oren M. Nature. 1991;352:345 – 347. doi: 10.1038/352345a0. [DOI] [PubMed] [Google Scholar]
- Zhao J, Dynlacht B, Imai T, Hori T, Harlow E. Genes Dev. 1998;12:456 – 461. doi: 10.1101/gad.12.4.456. [DOI] [PMC free article] [PubMed] [Google Scholar]