

Abstract
Objectives:
This study estimates and compares variation in the probability of child unmet need for mental health care and difficulties accessing care for each state in the United States. Estimates are also generated and compared for three socioeconomic and demographic subgroups nationwide: racial/ethnic group, household income, and insurance type.
Methods:
Using a retrospective, cross-sectional design, this study pooled 2016–2019 National Survey of Children’s Health data. National, state, and subgroup adjusted probabilities of caregiver-reported child unmet need for mental health care and ease of access to mental health care were generated from logistic regression models with marginal post-estimation.
Results:
Adjusted national probabilities of caregiver-reported child unmet mental health need and difficulty in accessing care were 0.21 and 0.46, respectively. State probabilities of unmet need ranged from 0.08 to 0.32. One state was significantly above the national estimate; nine states were below it. State probabilities of difficulty accessing mental health care ranged from 0.28 to 0.57; nine states’ probabilities were significantly below the national estimate and two states were significantly above it. Estimates of unmet mental health need and difficulty accessing care varied more widely across states than across racial or ethnic groups, income groups, insurance groups.
Conclusions:
Geographic inequities in children’s mental health care access persist; in some cases, they are larger than sociodemographic inequities.
Keywords: child mental health, geographic disparities, unmet mental health care need, access to mental health care
Background and Objectives
Approximately 16–20% of children in the United States have a mental health problem,1,2 but only half of these children utilize mental health services in any year.1 Receiving mental health services has been associated with improved academic and community functioning, reduced utilization of out of home psychiatric care, reduced symptom severity, and increased adult employment.3,4 Factors influencing utilization of mental health care or unmet need for care include the type and severity of mental health need, family income levels, type of health coverage (e.g., commercial, public, both public and commercial, or no coverage), racial and ethnic identity of the child or family, and the child’s place of residence.1,5
A 2003 study, drawing on 1998 data from sixteen states, assessed if geographic variation in mental health service use reflected differences in the socioeconomic, demographic, or mental health need characteristics of state populations, independent of state characteristics. They concluded that unmet mental health need actually varied more across state lines than across individual socioeconomic and demographic differences.6
Updating Evidence of the Impacts of State Variation
These findings may not generalize to today’s child mental health system. Two versions of federal mental health parity legislation,7 the Essential Benefit mandate under the Affordable Care Act,8 and wider adoption of Medicaid waiver programs for children with mental health care needs9 all warrant updating these findings. Further, while many federal policies in the last two decades aimed to reduce racial, ethnic, income, and insurance-based health and mental health disparities for children,10 these policies also support state autonomy in implementation to promote innovation11 and address the unique needs of local residents.12 Differences in states’ implementation8,13 has resulted in significantly different mental health access standards, service capacities, and associated provider network adequacies.14,15 These differences have been associated with variation in unmet mental health need for children15,16 and mental health access.14,17 As such, while differences in mental health access across socioeconomic and demographic groups may have narrowed, variation across state lines may have increased.
Nationally, mental health service utilization has increased among youth, though racial and ethnic disparities persist.18 At the state level, a few studies have documented ongoing state variation in caregiver-reported unmet mental health need or mental health service use in children,1,19,20 but estimates for all three studies are generated from a single year of data—which is insufficient to generate accurate state-level estimates.21 In two studies,19,20 data is from 2007, and findings are now over fifteen years old; one of these studies reports state rates only for specific mental health conditions.20 In a more recent study, results are reported in quartiles, without benchmarks against national rates, and do not provide estimates disaggregated by socioeconomic or demographic characteristics with which to compare variation in state estimates.1 Further, these studies examine receipt of mental health treatment22 which does not account for preferences to receive care23—a key dimension in measuring healthcare disparities.24
Both individual sociodemographic characteristics and state policies affect unmet mental health need and access to care.5,16,17 To accurately and precisely target research and system investments to reduce inequalities in mental health care access for children and youth, it is important to understand the relative size of inequalities associated with these characteristics. This study aimed to understand the current scope of state geographic differences in mental health access for children, particularly in comparison to differences across individual sociodemographic characteristics. Among children with a parent reported mental health problem and need for mental health care, we estimated state probabilities that a caregiver will report unmet need for mental health care and difficulties accessing care for their child. Then, we compared variation across states with differences across three sociodemographic characteristics commonly associated with these outcomes: racial/ethnic group, household income, and insurance type.
Methods
Data Source
Using a retrospective, cross-sectional design, this study drew on the National Survey of Children’s Health (NSCH), pooling data from the most recent years unaffected by the COVID-19 pandemic: 2016 through 2019. To enable accurate state level estimates in a usual care context,21 we omitted data from 2020–2022 due to a well-documented increase in mental health need among children25 and decrease in access to mental health care during the pandemic.26 Pooling data from prior to and during COVID-19 would result in estimates that do not accurately reflect system conditions either before or during the pandemic. Though state rates of unmet need and difficulty accessing mental health care likely varied during the COVID-19 pandemic, too, this variation should be examined separately from usual care circumstance.
The NSCH is a publicly available, population-based parent survey conducted by the US Census Bureau on behalf of the US Maternal and Child Health Bureau. Broadly, the NSCH provides information on children’s physical and mental health status, health care access and quality, access to community supports, and the qualities of their social context for non-institutionalized children under age 18 living in the United States. The survey is sampled and weighted to allow for accurate state estimates if a minimum of two years of data are used.21 Additional information about the NSCH methodology, sampling, and weighting procedures are detailed elsewhere27 and comprehensive survey documentation can be at the Data Resource Center for Child and Adolescent Health’s NSCH Survey Methodology website. (Survey response rates for each survey year are included in Appendix A.)
Sample and Measures
The study focused on two outcomes: caregiver-reported unmet need for mental health care and difficulty accessing mental health care. Estimates were generated using the subsample of children identified as having a caregiver-reported mental health problem (n=24,617). These children were identified using an approach described by Bethell and colleagues2 which defines mental health problems using either a caregiver’s report of their child’s receipt of a mental health diagnosis (anxiety, depression, attention-deficit hyperactivity disorder, or behavioral or conduct problems) or caregiver-reported child emotional, behavioral, or developmental problems on the Children with Special Health Care Needs Screener subscale within the NSCH.28 Children with parent-reported mental health problems, whose caregiver also reported a need for mental health care, were included in the final sample (n=12,906) (See Appendix B for sampling process).
Independent Variables.
The primary predictor variable of interest in this study was the child’s state of residence. This was coded as a categorical variable, with 51 levels, each level representing a single state or Washington D.C. The secondary predictor variables included the combined race/ethnicity of the child (Hispanic, Non-Hispanic White [reference], Non-Hispanic Black, and Non-Hispanic Other/Multiracial), family income level (less than 199% of the Federal Poverty Line [FPL], 200–299% FPL, 300–399% FPL, and 400% FPL and above [reference]), and child insurance status and type (private only [reference], public only, public and private, uninsured). For brevity, the term Non-Hispanic will be dropped from here forward. Racial differences among Hispanic children are not captured in the public use dataset.
Dependent Variables.
The first outcome—unmet mental health need—was structured to capture subjective, not-chosen unmet need.22 This definition rests on an individual’s subjective perception of need for care and the need for care going unmet. Thus, in this study, unmet mental health need was measured among children with caregiver-reported mental health problems and was defined as having a caregiver-reported need for mental health care, but not seeing a mental health professional. The second outcome, difficulty accessing mental health care, was measured using a follow-up question for those who reported need for mental health care. This follow-up question was, “How much of a problem (2016–2017)/How difficult (2018–2019) was it to get the mental health treatment or counseling that this child needed?” In 2016 and 2017, the response options were “Not a problem,” “Small problem,” and “Big Problem”; from 2018 forward, the response options were “Not Difficult”, “Somewhat difficult,” “Very difficult,” and “It was not possible to obtain care.” (Appendix B illustrates how these variables were constructed from the survey questionnaire.)
To enable pooling data across all four years, responses were recoded into a binary indicator for any problems/difficulties receiving care versus no problems/difficulties receiving care. (Annual sample sizes for each response are included in Appendix C.) A sensitivity analysis, conducted to assess if this recoding substantially changed study outcomes, found negligible impacts. Further, because unmet need and difficulty accessing mental health care are closely related concepts, we examined a cross-tabulation to ensure that these two outcomes were adequately different to justify separate analyses. Of caregivers reporting any level of difficulty accessing mental health care (n=6,605), 73% reported no unmet mental health need, suggesting that these measures address sufficiently different constructs.
Covariates.
Consistent with other studies using the NSCH,29 covariate selection was based on the combination of Anderson’s Behavioral Model of Health Service Utilization30 with the variables available in the dataset. Predisposing factors included age, coded into three categories, and binary biological sex. Language spoken in the home was included to account for the role of structural barriers and cultural preferences of families. Enabling covariates included gaps in insurance coverage (any in the last 12 months versus no gaps [reference]), caregiver’s education level (less than high school, high school graduate, more than high school [reference]), and family structure (living a two-parent household [reference] or not). To account for variation in need factors, models also included a measure of the child’s impairment in activities of daily living (never affected [reference] or moderately/considerably affected) and a year fixed effect.
Analysis
Univariate and bivariate analyses were conducted to understand the distribution of study variables across the sample. Adjusted odds ratios were estimated for each outcome using logistic regression models. Models included all predictors and covariates (one model per outcome). Estimates were generated from the whole national sample for each covariate. From each adjusted model, marginal post-estimation generated predicted probabilities of the outcome, for the whole national sample, for each of the following strata within the model: each of the fifty states, plus the District of Columbia; four racial/ethnic categories; four family income levels, and four insurance categories. Marginal estimates reflect the average predicted probability of respondents reporting each outcome nationally, allow for direct comparison of the difference in the probability of binary outcome between multiple groups, and are more clear and easy to interpret than odds-ratios.31 Marginal estimates for each stratum were also compared to the national marginal estimate for each outcome, using post-estimation Wald tests to assess the significance of the difference between subgroup estimates and the national estimate. To achieve this, STATA’s test command was used post-estimation to test simple and complex linear hypotheses about model parameters.
To compare variation in outcome estimates across states with variation across the three sociodemographic characteristics (race/ethnicity, income, and insurance), ranges and standard deviations (SDs) were calculated for adjusted marginal estimates for each stratum (e.g., public only, private only, public and private, uninsured) within each characteristic (e.g., insurance type). The range was calculated as the difference between the highest and the lowest stratum estimate within a sociodemographic variable, and the SD was calculated from all estimates for each stratum for each variable. To visually compare the range and distribution of estimates across states with the range and distribution of estimates across socioeconomic and demographic strata, box and whisker plots were generated. These plots illustrate the mean, the first and third quartiles, and the minimum and maximum estimates for each subgroup; they are useful for understanding the distribution of values of a given variable and can be particularly useful in understanding the full range of values, including outliers.32
Analyses were conducted using STATA v.16.1 (StataCorp, College Station, TX) and accounted for the complex survey methodology of the NSCH using survey weighting, stratification, and clustering observations at the state level to generate state and nationally representative results. Missing race/ethnicity, income, and ages in the NSCH are multiply imputed using hotdeck methods prior to public release of the data.33 As missingness was generally low in our study (unmet need and difficulty accessing mental health care were about 0.005%), we used a complete-case approach for analysis. Prior work suggests population representativeness in survey data analyses is retained when missingness is under 10%.34
Results
Sample characteristics for outcome and predictor variables are reported in Table 1 for the whole survey sample and for the analytic subsample of children with parent reported mental health problems. Sample characteristics for control variables are presented in Appendix D and sample predictor characteristics, stratified by the outcome variables, are presented in Appendix E.
Table 1.
Sample Characteristics for Predictor and Outcome Variables
| Full Sample (N=131,774) |
Children with Mental Health Problems Subsample (n = 24,617) |
|||||
|---|---|---|---|---|---|---|
| n | % | Weighted Proportion | n | % | Weighted Proportion | |
| Unmet Mental Health Need | ||||||
| No Need for Mental Health Care | 114,781 | 87.52 | 0.89 | 11,597 | 47.33 | 0.49 |
| No Unmet Mental Health Need | 14,016 | 10.69 | 0.09 | 11,236 | 45.86 | 0.42 |
| Unmet Mental Health Need | 2,354 | 1.79 | 0.02 | 1,670 | 6.82 | 0.09 |
| Difficulty Accessing Care | ||||||
| No Difficulty | 9,408 | 58.75 | 0.56 | 7,062a | 0.55 | 0.52 |
| Any Difficulty | 6,605 | 41.25 | 0.44 | 5,698a | 0.45 | 0.48 |
| Race | ||||||
| White, non-Hispanic | 91,695 | 69.59 | 0.51 | 17,768 | 0.72 | 0.55 |
| Hispanic | 15,148 | 11.5 | 0.25 | 2,673 | 0.11 | 0.21 |
| Black, non-Hispanic | 8,099 | 6.15 | 0.13 | 1,673 | 0.07 | 0.16 |
| Other/multi-racial, non-Hispanic | 16,832 | 12.77 | 0.11 | 2,503 | 0.10 | 0.08 |
| Family Income | ||||||
| 400% FPL or greater | 55,359 | 42.01 | 0.31 | 9,287 | 0.38 | 0.27 |
| 0–199% FPL | 35,681 | 27 | 0.42 | 7,969 | 0.32 | 0.47 |
| 200–299% FPL | 21,058 | 16 | 0.16 | 3,949 | 0.16 | 0.15 |
| 300–399% FPL | 19,676 | 15 | 0.12 | 3,412 | 0.14 | 0.11 |
| Insurance Type | ||||||
| Private Only | 94,135 | 72.51 | 0.58 | 14,866 | 0.61 | 0.49 |
| Public Only | 25,468 | 19.62 | 0.31 | 6,767 | 0.28 | 0.39 |
| Private and public | 4,842 | 3.73 | 0.05 | 1,776 | 0.07 | 0.08 |
| Not insured | 5,385 | 4.15 | 0.06 | 854 | 0.04 | 0.05 |
| State of Residence | ||||||
| AL | 2,455 | 1.86 | 0.01 | 472 | 0.02 | 0.02 |
| AK | 2,361 | 1.79 | 0.00 | 416 | 0.02 | 0.00 |
| AZ | 2,563 | 1.94 | 0.02 | 487 | 0.02 | 0.02 |
| AR | 2,592 | 1.97 | 0.01 | 562 | 0.02 | 0.01 |
| CA | 2,529 | 1.92 | 0.12 | 341 | 0.01 | 0.09 |
| CO | 2,668 | 2.02 | 0.02 | 420 | 0.02 | 0.02 |
| CT | 2,676 | 2.03 | 0.01 | 515 | 0.02 | 0.01 |
| DE | 2,485 | 1.89 | 0.00 | 504 | 0.02 | 0.00 |
| DC | 2,540 | 1.93 | 0.00 | 397 | 0.02 | 0.00 |
| FL | 2,536 | 1.92 | 0.06 | 438 | 0.02 | 0.05 |
| GA | 2,468 | 1.87 | 0.03 | 481 | 0.02 | 0.04 |
| HI | 2,570 | 1.95 | 0.00 | 312 | 0.01 | 0.00 |
| ID | 2,749 | 2.09 | 0.01 | 505 | 0.02 | 0.01 |
| IL | 2,675 | 2.03 | 0.04 | 492 | 0.02 | 0.04 |
| IN | 2,517 | 1.91 | 0.02 | 506 | 0.02 | 0.02 |
| IA | 2,686 | 2.04 | 0.01 | 486 | 0.02 | 0.01 |
| KS | 2,655 | 2.01 | 0.01 | 500 | 0.02 | 0.01 |
| KY | 2,514 | 1.91 | 0.01 | 505 | 0.02 | 0.02 |
| LA | 2,375 | 1.8 | 0.02 | 563 | 0.02 | 0.02 |
| ME | 2,510 | 1.9 | 0.00 | 603 | 0.02 | 0.00 |
| MD | 2,661 | 2.02 | 0.02 | 472 | 0.02 | 0.02 |
| MA | 2,788 | 2.12 | 0.02 | 592 | 0.02 | 0.02 |
| MI | 2,654 | 2.01 | 0.03 | 509 | 0.02 | 0.03 |
| MN | 2,942 | 2.23 | 0.02 | 511 | 0.02 | 0.02 |
| MS | 2,357 | 1.79 | 0.01 | 519 | 0.02 | 0.01 |
| MO | 2,700 | 2.05 | 0.02 | 504 | 0.02 | 0.02 |
| MT | 2,574 | 1.95 | 0.00 | 482 | 0.02 | 0.00 |
| NE | 2,626 | 1.99 | 0.01 | 391 | 0.02 | 0.01 |
| NV | 2,384 | 1.81 | 0.01 | 368 | 0.01 | 0.01 |
| NH | 2,677 | 2.03 | 0.00 | 594 | 0.02 | 0.00 |
| NJ | 2,660 | 2.02 | 0.03 | 418 | 0.02 | 0.02 |
| NM | 2,439 | 1.85 | 0.01 | 461 | 0.02 | 0.01 |
| NY | 2,495 | 1.89 | 0.06 | 427 | 0.02 | 0.05 |
| NC | 2,566 | 1.95 | 0.03 | 527 | 0.02 | 0.03 |
| ND | 2,657 | 2.02 | 0.00 | 469 | 0.02 | 0.00 |
| OH | 2,606 | 1.98 | 0.04 | 488 | 0.02 | 0.04 |
| OK | 2,474 | 1.88 | 0.01 | 501 | 0.02 | 0.01 |
| OR | 2,669 | 2.03 | 0.01 | 486 | 0.02 | 0.01 |
| PA | 2,706 | 2.05 | 0.04 | 468 | 0.02 | 0.03 |
| RI | 2,499 | 1.9 | 0.00 | 535 | 0.02 | 0.00 |
| SC | 2,530 | 1.92 | 0.01 | 513 | 0.02 | 0.02 |
| SD | 2,704 | 2.05 | 0.00 | 395 | 0.02 | 0.00 |
| TN | 2,450 | 1.86 | 0.02 | 466 | 0.02 | 0.02 |
| TX | 2,371 | 1.8 | 0.10 | 426 | 0.02 | 0.10 |
| UT | 2,715 | 2.06 | 0.01 | 515 | 0.02 | 0.01 |
| VT | 2,692 | 2.04 | 0.00 | 551 | 0.02 | 0.00 |
| VA | 2,713 | 2.06 | 0.03 | 505 | 0.02 | 0.03 |
| WA | 2,691 | 2.04 | 0.02 | 515 | 0.02 | 0.02 |
| WV | 2,419 | 1.84 | 0.01 | 537 | 0.02 | 0.01 |
| WI | 2,824 | 2.14 | 0.02 | 522 | 0.02 | 0.02 |
| WY | 2,407 | 1.83 | 0.00 | 445 | 0.02 | 0.00 |
Data Source: National Survey of Children’s Health, 2016–2019
Weighted proportions are weighted to be nationally and state representative
Among children with parent reported mental health problems and need for mental health care
Figure 1 displays the adjusted probabilities (average predicted probability) of children with caregiver-reported unmet mental health need and difficulty accessing mental health care across all fifty states and the District of Columbia (D.C.), comparing them to the adjusted national estimate (16.3%). The adjusted national probability of children with reported mental health problems and need for mental health care experiencing unmet need was 0.21 (CI: 0.18, 0.24). State probabilities range from 0.08 to 0.32 across states. One state was significantly above the national estimate, while nine states were significantly below. The adjusted national probability of children whose caregivers reported difficulty accessing mental health care, among those with reported mental health problems and need for treatment, was 0.46 (CI: 0.42, 0.50). State probabilities ranged from 0.28 to 0.57 across states. Nine state probabilities were significantly below the national estimate, and two state probabilities were significantly higher than the national estimate. Unadjusted and adjusted odds ratios from logistic models are reported in Appendix F and G. Predicted probabilities for each state and racial/ethnic, income and insurance type subgroups are reported in Appendix H and I.
Figure 1. Probabilities of Children with Caregiver-Reported Child Unmet Mental Health Need, and Difficulty Accessing Mental Health Care.

Adjusted Models include caregiver education level, family structure, household language, level of child impairment, gaps in insurance, and year. Point estimates include indicators (lines on either side of point) for 95% confidence intervals; Data Source: National Survey of Children’s Health, 2016–2019; Proportions are weighted to be nationally and state representative; Appendix H, I, and J provide state predicted probabilities and their difference from the national predicted probability. Appendix F and G provide adjusted and unadjusted odds ratios for strata and covariates. a Among children with parent reported mental health problems and need for mental health care; * significant at p<.05; ** significant at p<.01; *** significant at p<.001;
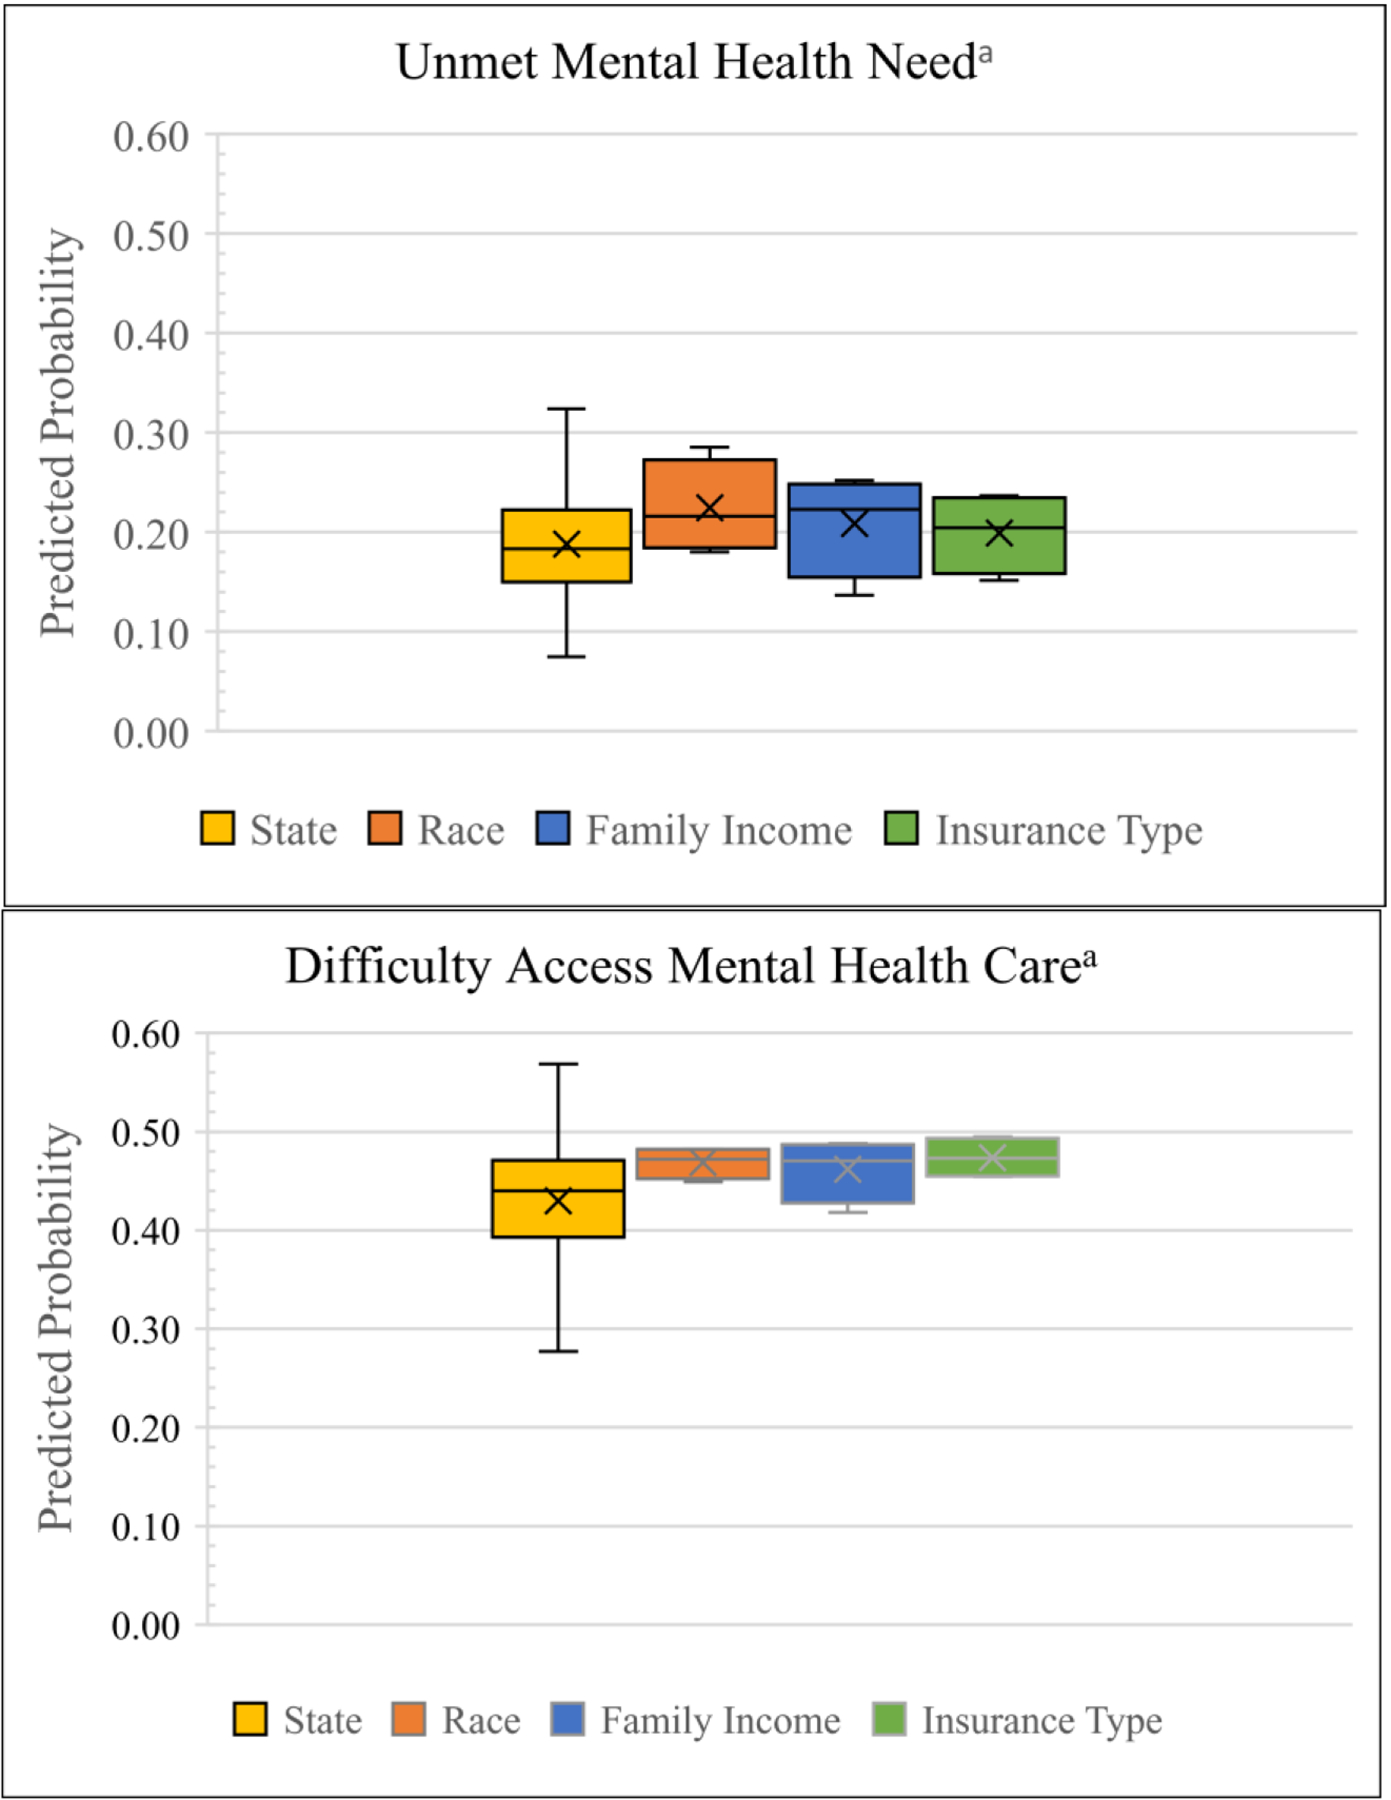
Figure 2 illustrates and contextualizes these estimates by presenting the range and distribution of estimates across states and socioeconomic and demographic strata using box and whisker plots. Appendix J presents the ranges and standard deviations for estimates for outcome across states and strata of race/ethnicity, family income, and health insurance type.) For caregiver-reported unmet mental health need in children with reported mental health problems and need for care, state probabilities varied more widely (0.25 percentage points, SD=0.05) than probabilities across racial/ethnic (0.11, SD=0.05), income (0.12, SD=0.05), or insurance strata (0.09, SD=0.04). The range and standard deviation in estimates across states in caregiver reports of difficulty accessing mental health care were largest (0.29, SD=0.07) and dwarfed ranges and standard deviations across any other demographic group: race/ethnicity (0.03, SD=0.02), income (0.07, SD=0.03), or insurance groups (0.04, SD=0.02).
Figure 2. Box and Whisker Plots of Probabilities of Caregiver-Reported Child Unmet Mental Health Need and Difficulty Accessing Mental Health Care: Comparing State, Socioeconomic and Demographic Subgroups.
Adjusted Models include caregiver education level, family structure, household language, level of child impairment, gaps in insurance, and year
Data Source: National Survey of Children’s Health, 2016–2019
Proportions are weighted to be nationally and state representative; Appendix H, I, and J provide state predicted probabilities and their difference from the national predicted probability. Appendix F and G provide adjusted and unadjusted odds ratios for strata and covariates.a Among children with parent reported mental health problems and need for mental health care
Discussion
Probabilities of unmet mental health need among children and youth, with both parent reported mental health problems and a need for mental health treatment, varied more widely across states than across subgroups based on race/ethnicity, household income, or type of health insurance. However, because standard deviations were similar across all subgroups, this wider variation is likely due to extreme values in a small number of states. Greater inter-state variation was observed in caregiver reports of difficulty accessing mental health care. Broader distribution of values across states and a larger standard deviation across estimates suggests that variation in this outcome across states was less attributable to a small number of states with extreme values.
Importantly, the probability of unmet mental health need for Black children is greater than the national probability by 8 percentage points—a rate that is only equaled by probabilities in one state (New Jersey) and surpassed by only two states (South Carolina and Utah; Appendix G). This suggests that Black children, on average, have a higher probability of having unmet mental health needs than the average child living in any but three states in the U.S. –highlighting ongoing inequities in mental health access for Black children.
However, these findings provide evidence of significant geographic inequities in access to mental health for children. Controlling for a wide range of sociodemographic factors, including insurance type and family income, children living in Connecticut have a significantly lower probability of experiencing unmet mental health needs or difficulty accessing mental health care than children living in nearby New Jersey. Similarly, families living in Oklahoma are less likely to face challenges accessing mental health care than families in neighboring Texas. These inequities, in some cases, are bigger across state lines than across racial/ethnic, income, or insurance coverage differences. Youth in Utah have a 32% probability of having unmet mental health need, while those living a few states north, in Montana, have a 7% probability of experiencing unmet need—a 25 percentage point difference. Children in the most advantaged racial group for mental health access—White children—have a 20% probability of experiencing unmet mental health need, while the least advantaged group has a 29% probability of having unmet need—a 9 percentage point difference. These sizable geographic differences suggest that state of residence may compound risk of unmet need for children with other sociodemographic or clinical disadvantages associated with unmet mental health need.5 Future research should examine the extent to which state of residence moderates the association between unmet mental health needs and sociodemographic or clinical characteristics.
While some geographic variation is not inherently negative, these findings support growing evidence that state-based inequities in mental health access merit further scholarly attention and inquiry. State differences should be examined from a systemic or structural perspective so that successful policy or systemic innovations can be disseminated to other communities. States have autonomy in designing and funding their public mental health, Children’s Health Insurance Program (CHIP), Medicaid benefits and service systems, and in mandating coverage provisions under commercial insurance.35 They primarily govern child welfare, juvenile justice, and education programs too,36 which also provide mental health treatment for children.37 Across all sectors, states authorize the services to be offered, set the financial, clinical, or risk-related criteria children must meet to obtain these services;12,38 states set provider payment rates, enrollment processes,12 and scope of practice laws39 that influence the size and location of provider networks providing those services15 and which may systematically advantage or disadvantage child access to needed mental health care.
While state Medicaid, child welfare, and justice policies have been in existence for decades, these policies and practices have changed significantly over the last twenty years,40 as states seek to reduce out of home care costs by investing more heavily in home and community-based mental health care38 and settle lawsuits.35 Most states have also shifted their Medicaid programs from fee for service payment structures to managed care arrangements.41 Additionally, implementation of the ACA’s Essential Benefit mandate may have prompted some states to expand their mental health benefits under their CHIP, Medicaid, or subsidized commercial plans available for families on the healthcare marketplaces. The effects of resulting child mental health policy and system redesigns may be reflected in the changes observed in child mental health access indicators in some states since 1998 and 2007.
However, comparing our findings to those reported decades ago,19 6 we find that some state differences remain relatively unchanged in spite of significant changes in mental health systems and health policies since that time. Data from 1998 showed that Texas and California had some of the highest rates of unmet mental health need in a sample of sixteen states.6 In 2007, Texas had the highest rate of unmet mental health need and California was among the ten highest rates states.19 While these two states don’t perform quite as poorly on this measure in the current study, our findings rank these states similarly in difficulty accessing mental health care. This comparison suggests that, while policies have continued to evolve and change over the last twenty years, there are likely deeply entrenched policies, processes, or conditions in some states that change minimally over time. This is also consistent with evidence that significant federal and state policy changes, including mental health parity legislation and the Affordable Care Act’s Essential Benefits mandate, has done little to increase access to mental health for children.8,42,43 Research examining structures within states that contribute to inequities across state lines may help to uncover longstanding practices in poorly performing states and identify successful practices for increasing mental health access for children in states with low rates of unmet mental health need.
Limitations
Though this study provides updated evidence regarding rarely documented state variation in children’s access to mental health care, findings in this study cannot be compared directly to findings from prior studies looking at state variation due to differences in data.25,32,36 This study uses cross sectional data and cannot elucidate what state policy, economic, and systemic factors drive findings. This study also relies on caregiver report for all outcome measures rather than clinical assessments of mental health problems or need for services. Further, the measure of mental health service use in this study specified treatment from a mental health professional. Thus, the measure may exclude the small proportion of children or youth who access mental health care through a primary care physician.37 Survey response rates, listed in Appendix A, were also less than 50% for each year. This introduces potential for non-response bias though survey weights help to mitigate this bias.44
Conclusion
Access to mental health care for children is a growing public health concern as pediatric psychiatric hospitalizations, psychiatric emergency room visits, and youth deaths by suicide have been on the rise over the last fifteen years.45 Estimates of state-based differences can alert pediatric healthcare providers to the degree unmet need in their states.46 These providers can play an essential role in reducing unmet mental health need through behavioral health screening, supporting warm hand-offs to referrals, and following up with families about their behavioral health needs.25 Further, while child and family factors influencing access to mental health care have been well established,5 they may be less malleable than laws, regulations, and public investment at the state level. Attending to policy and systemic barriers to mental health care for children will indicate important levers that can lead to widespread improvements in mental health system functioning nationwide.
Supplementary Material
Funding:
Phillip Hughes was partially supported by a National Research Service Award Pre-Doctoral/Post-Doctoral Traineeship from the Agency for Healthcare Research and Quality sponsored by The Cecil G. Sheps Center for Health Services Research, The University of North Carolina at Chapel Hill, Grant No. T32-HS000032. Dr. Graaf was supported in part by the National Institute of Mental Health of the National Institutes of Health under Award Number 1K01MH129991. The content is solely the responsibility of the authors and does not necessarily represent the official views of the National Institutes of Health.
Footnotes
Declarations of interest: The authors have no conflicts of interest relevant to this article to disclose.
References
- 1.Whitney DG, Peterson MD. US national and state-level prevalence of mental health disorders and disparities of mental health care use in children. JAMA Pediatr. 2019;173(4):389–391. doi: 10.1001/jamapediatrics.2018.5399 [DOI] [PMC free article] [PubMed] [Google Scholar]
- 2.Bethell CD, Garner AS, Gombojav N, Blackwell C, Heller L, Mendelson T. Social and Relational Health Risks and Common Mental Health Problems Among US Children. Child Adolesc Psychiatr Clin N Am. 2022;31(1):45–70. doi: 10.1016/j.chc.2021.08.001 [DOI] [PubMed] [Google Scholar]
- 3.Brimblecombe N, Knapp M, Murguia S, et al. The role of youth mental health services in the treatment of young people with serious mental illness: 2-year outcomes and economic implications. Early Interv Psychiatry. 2017;11(5):393–400. doi: 10.1111/eip.12261 [DOI] [PubMed] [Google Scholar]
- 4.Urdapilleta O, Kim G, Wang Y, et al. National Evaluation of the Medicaid Demonstration Waiver Home- and Community-Based Alternatives to Psychiatric Residential Treatment Facilities. Submitted to Disabled and Elderly Health Programs Group Centers for Medicare and Medicaid Services, Contract Number: HHSM-500-2006-00007I, Task Order #2 Final Evaluation Report. IMPAQ International, Inc; 2013. Accessed November 27, 2013. https://www.medicaid.gov/sites/default/files/2019-12/cba-evaluation-final.pdf [Google Scholar]
- 5.Eijgermans DGM, Fang Y, Jansen DEMC, Bramer WM, Raat H, Jansen W Individual and contextual determinants of children’s and adolescents’ mental health care use: A systematic review. Child Youth Serv Rev. 2021;131:106288. doi: 10.1016/j.childyouth.2021.106288 [DOI] [Google Scholar]
- 6.Sturm R, Ringel JS, Andreyeva T. Geographic disparities in children’s mental health care. Pediatrics. 2003;112(4):e308. [DOI] [PubMed] [Google Scholar]
- 7.Bailey BC, Davis TS. Mental health parity legislation: Implications for children and youth with serious emotional disturbance. Soc Work Ment Health. 2012;10(1):12–33. doi: 10.1080/15332985.2011.609776 [DOI] [Google Scholar]
- 8.Grace AM, Noonan KG, Cheng TL, et al. The ACA’s pediatric essential health benefit has resulted in a state-by-state patchwork of coverage with exclusions. Health Aff Proj Hope. 2014;33(12):2136–2143. doi: 10.1377/hlthaff.2014.0743 [DOI] [PMC free article] [PubMed] [Google Scholar]
- 9.Graaf G, Snowden L. The role of Medicaid home and community-based service policies in organizing and financing care for children with severe emotional disturbance. Child Youth Serv Rev. 2017;81:272–283. doi: 10.1016/j.childyouth.2017.08.007 [DOI] [Google Scholar]
- 10.Race Michener J., politics, and the Affordable Care Act. J Health Polit Policy Law. 2020;45(4):547–566. doi: 10.1215/03616878-8255481 [DOI] [PubMed] [Google Scholar]
- 11.Madison K Building a Better Laboratory: The Federal Role in Promoting Health System Experimentation. Pepperdine Law Rev. 2013;41:765. [Google Scholar]
- 12.Graaf G, Snowden L. State strategies for enhancing access and quality in systems of care for youth with complex behavioral health needs. Adm Policy Ment Health Ment Health Serv Res. Published online July 7, 2020. doi: 10.1007/s10488-020-01061-y [DOI] [PubMed] [Google Scholar]
- 13.Laird J, Cozad MJ, Keim-Malpass J, Mack JW, Lindley LC. Variation In State Medicaid Implementation Of The ACA: The Case Of Concurrent Care For Children. Health Aff (Millwood). 2020;39(10):1770–1775. doi: 10.1377/hlthaff.2020.01192 [DOI] [PMC free article] [PubMed] [Google Scholar]
- 14.Hu JC, Cummings JR, Ji X, Wilk AS. Evaluating Medicaid managed care network adequacy standards and associations with specialty care access for children. Health Aff (Millwood). 2023;42(6):759–769. doi: 10.1377/hlthaff.2022.01439 [DOI] [PMC free article] [PubMed] [Google Scholar]
- 15.Thomas KC, Parish SL, Rose RA, Kilany M. Access to care for children with autism in the context of state Medicaid reimbursement. Matern Child Health J. 2012;16(8):1636–1644. doi: 10.1007/s10995-011-0862-1 [DOI] [PubMed] [Google Scholar]
- 16.Graaf G, Snowden L, Keyes L. Medicaid waivers for youth with Severe Emotional Disturbance: Associations with public health coverage, unmet mental health needs & adequacy of health coverage. Community Ment Health J. Published online January 25, 2021. doi: 10.1007/s10597-020-00759-5 [DOI] [PubMed] [Google Scholar]
- 17.So M, McCord RF, Kaminski JW. Policy Levers to Promote Access to and Utilization of Children’s Mental Health Services: A Systematic Review. Adm Policy Ment Health Ment Health Serv Res. 2019;46(3):334–351. doi: 10.1007/s10488-018-00916-9 [DOI] [PMC free article] [PubMed] [Google Scholar]
- 18.Rodgers CRR, Flores MW, Bassey O, Augenblick JM, Cook BL. Racial/ethnic disparity trends in children’s mental health care access and expenditures from 2010–2017: Disparities remain despite sweeping policy reform. J Am Acad Child Adolesc Psychiatry. 2022;61(7):915–925. doi: 10.1016/j.jaac.2021.09.420 [DOI] [PMC free article] [PubMed] [Google Scholar]
- 19.Bethell CD, Kogan MD, Strickland BB, Schor EL, Robertson J, Newacheck PW. A national and state profile of leading health problems and health care quality for US children: key insurance disparities and across-state variations. Acad Pediatr. 2011;11(3 Suppl):S22–33. doi: 10.1016/j.acap.2010.08.011 [DOI] [PubMed] [Google Scholar]
- 20.Ghandour RM, Kogan MD, Blumberg SJ, Jones JR, Perrin JM. Mental Health Conditions Among School-Aged Children: Geographic and Sociodemographic Patterns in Prevalence and Treatment. J Dev Behav Pediatr. 2012;33(1):42. doi: 10.1097/DBP.0b013e31823e18fd [DOI] [PubMed] [Google Scholar]
- 21.2020 National Survey of Children’s Health: Data Users Frequently Asked Questions (FAQs). U.S. Census Bureau; 2021. Accessed January 18, 2024. https://www2.census.gov/programs-surveys/nsch/technical-documentation/methodology/2020-NSCH-FAQs.pdf [Google Scholar]
- 22.Smith S, Connolly S. Re-thinking unmet need for health care: Introducing a dynamic perspective. Health Econ Policy Law. 2020;15(4):440–457. doi: 10.1017/S1744133119000161 [DOI] [PubMed] [Google Scholar]
- 23.Allin S, Grignon M, Le Grand J. Subjective unmet need and utilization of health care services in Canada: What are the equity implications? Soc Sci Med. 2010;70(3):465–472. doi: 10.1016/j.socscimed.2009.10.027 [DOI] [PubMed] [Google Scholar]
- 24.McGuire TG, Alegria M, Cook BL, Wells KB, Zaslavsky AM. Implementing the Institute of Medicine definition of disparities: An application to mental health care. Health Serv Res. 2006;41(5):1979–2005. doi: 10.1111/j.1475-6773.2006.00583.x [DOI] [PMC free article] [PubMed] [Google Scholar]
- 25.Wolf K, Schmitz J. Scoping review: longitudinal effects of the COVID-19 pandemic on child and adolescent mental health. Eur Child Adolesc Psychiatry. Published online April 21, 2023. doi: 10.1007/s00787-023-02206-8 [DOI] [PMC free article] [PubMed] [Google Scholar]
- 26.Gigli KH, Graaf G. Changes in use and access to care for children and youth with special health care needs during the COVID-19 Pandemic. J Pediatr Health Care. Published online September 21, 2022. doi: 10.1016/j.pedhc.2022.09.008 [DOI] [PMC free article] [PubMed] [Google Scholar]
- 27.Ghandour RM, Jones JR, Lebrun-Harris LA, et al. The design and implementation of the 2016 National Survey of Children’s Health. Matern Child Health J. 2018;22(8):1093–1102. doi: 10.1007/s10995-018-2526-x [DOI] [PMC free article] [PubMed] [Google Scholar]
- 28.Bethell CD, Blumberg SJ, Stein REK, Strickland B, Robertson J, Newacheck PW. Taking stock of the CSHCN screener: a review of common questions and current reflections. Acad Pediatr. 2015;15(2):165–176. doi: 10.1016/j.acap.2014.10.003 [DOI] [PMC free article] [PubMed] [Google Scholar]
- 29.Graaf G, Palmer AN. Parent ratings of health insurance adequacy for children with emotional, behavioral, or developmental problems. Acad Pediatr. Published online November 4, 2022. doi: 10.1016/j.acap.2022.10.020 [DOI] [PMC free article] [PubMed] [Google Scholar]
- 30.Andersen RM. Revisiting the behavioral model and access to medical care: does it matter? J Health Soc Behav. 1995;36(1):1–10. doi: 10.2307/2137284 [DOI] [PubMed] [Google Scholar]
- 31.Norton EC, Dowd BE, Garrido MM, Maciejewski ML. Requiem for odds ratios. Health Serv Res. 2024;online ahead of print(n/a). doi: 10.1111/1475-6773.14337 [DOI] [PMC free article] [PubMed] [Google Scholar]
- 32.Nuzzo RL. The Box Plots Alternative for Visualizing Quantitative Data. PM&R. 2016;8(3):268–272. doi: 10.1016/j.pmrj.2016.02.001 [DOI] [PubMed] [Google Scholar]
- 33.National Survey of Children’s Health: Guide to Multiply Imputed Data Analysis. U.S. Census Bureau; 2021.
- 34.Langkamp DL, Lehman A, Lemeshow S. Techniques for handling missing data in secondary analyses of large surveys. Acad Pediatr. 2010;10(3):205–210. doi: 10.1016/j.acap.2010.01.005 [DOI] [PMC free article] [PubMed] [Google Scholar]
- 35.Graaf G, Snowden L. State approaches to funding home and community-based mental health care for non-Medicaid youth: Alternatives to Medicaid Waivers. Adm Policy Ment Health Ment Health Serv Res. 2019;46(4):530–541. doi: 10.1007/s10488-019-00933-2 [DOI] [PubMed] [Google Scholar]
- 36.Karger H, Stoez D. American Social Welfare Policy: A Pluralist Approach. 8th ed. Pearson; 2018. Accessed January 27, 2022. https://www.pearson.com/content/one-dot-com/one-dot-com/us/en/higher-education/program.html [Google Scholar]
- 37.Duong MT, Bruns EJ, Lee K, et al. Rates of mental health service utilization by children and adolescents in schools and other common service settings: A systematic review and meta-analysis. Adm Policy Ment Health Ment Health Serv Res. Published online September 17, 2020. doi: 10.1007/s10488-020-01080-9 [DOI] [PubMed] [Google Scholar]
- 38.Graaf G, Snowden L. Medicaid waiver adoption for youth with complex behavioral health care needs: An analysis of state decision-making. J Disabil Policy Stud. 2020;31(2):87–98. doi: 10.1177/1044207319897058 [DOI] [Google Scholar]
- 39.Hughes PM, McGrath RE, Thomas KC. Evaluating the impact of prescriptive authority for psychologists on the rate of deaths attributed to mental illness. Res Soc Adm Pharm. 2023;19(4):667–672. doi: 10.1016/j.sapharm.2022.12.006 [DOI] [PubMed] [Google Scholar]
- 40.Douglas MD, Bent Weber S, Bass C, et al. Creation of a longitudinal legal data set to support legal epidemiology studies of mental health insurance legislation. Psychiatr Serv. Published online July 29, 2021:appi.ps.202100019. doi: 10.1176/appi.ps.202100019 [DOI] [PubMed] [Google Scholar]
- 41.Constantin J, Wehby GL. Effects of Medicaid Accountable Care Organizations on children’s access to and utilization of health services. Health Serv Res. Published online August 8, 2024. doi: 10.1111/1475-6773.14370 [DOI] [PMC free article] [PubMed] [Google Scholar]
- 42.Keller D, Chamberlain LJ. Children and the Patient Protection and Affordable Care Act: Opportunities and challenges in an evolving system. Acad Pediatr. 2014;14(3):225–233. doi: 10.1016/j.acap.2014.02.004 [DOI] [PubMed] [Google Scholar]
- 43.Sen B, Blackburn J, Morrisey MA, et al. Impact of Mental Health Parity & Addiction Equity Act on costs & utilization in Alabama’s Children’s Health Insurance Program. Acad Pediatr. Published online August 3, 2018. doi: 10.1016/j.acap.2018.07.014 [DOI] [PubMed] [Google Scholar]
- 44.Peterson S Nonresponse Bias Analysis for the 2019 National Survey of Children’s Health. U.S. Census Bureau; 2020. [Google Scholar]
- 45.Curtain S State Suicide Rates among Adolescents and Young Adults Aged 10–24 : United States, 2000–2018. U.S. Department of Health and Human Services; 2020. Accessed August 23, 2023. https://stacks.cdc.gov/view/cdc/93667 [PubMed] [Google Scholar]
- 46.Taylor RM, Minkovitz CS Warm Handoffs for Improving Client Receipt of Services: A Systematic Review. Matern Child Health J. 2021;25(4):528–541. doi: 10.1007/s10995-020-03057-4 [DOI] [PubMed] [Google Scholar]
Associated Data
This section collects any data citations, data availability statements, or supplementary materials included in this article.