

Abstract
The excavation of Chinese pangolin (Manis pentadactyla) is expected to alter habitat heterogeneity and thus affect the functioning and structure of forest ecosystems. In this study, the bioturbation of Chinese pangolin on forest soils in three regions (Heping, Tianjingshan, and Wuqinzhang) across Guangdong province was quantified. Overall, a mean of 2.66 m3·ha−1 and 83.1 m2·ha−1 of burrows and bare mounds, respectively, was excavated by Chinese pangolin; the disturbed soils had significantly lower water content and P, C, available N concentrations, but higher bulk density, pH, and microbial abundance than those undisturbed soils. The unevenness of habitat heterogeneity improvement was mainly ascribed to the stronger soil disturbance caused in resting burrows by pangolins. Patterns of altering habitat heterogeneity were site‐specific, with high‐intensity soil disturbance occurring most in shrubs, meadows, steep habitats at high elevations, and mountain tops in Heping, while in broad‐leaved, coniferous and mixed coniferous and broad‐leaved forests away from human settlements in Tianjingshan and upper mountains at high elevations far away from roads and human settlements in Wuqinzhang. Road networks are the main interference for the burrow distribution in Heping and Wuqinzhang and should be programmed.
Keywords: burrow volume, habitat heterogeneity, Manis pentadactyla, mound coverage area, soil property, soil turnover
In this study, we identified the critical role of Chinese pangolin in altering habitat heterogeneity, by quantifying habitat subsurface space and surface bare patches increased by pangolin burrows. We thus suggested that pangolins may profoundly affect vegetation renewal and animal distribution in forest ecosystems. Measurements like acceleration rejuvenation and conservation reintroduction of the pangolins may cascade to the recovery of habitat quality and even communities.

INTRODUCTION
The destruction of primary forests worldwide leads to habitat fragmentation and subsistence resources loss, cascading to species extinction (Betts et al. 2019; Hansen et al. 2020). Restoration of forest vegetation has been quite successful in China (Tian et al. 2022); however, the declining habitat heterogeneity in secondary and plantation forests is equally worrisome (Gong & Tang 2016). Habitat heterogeneity affects microhabitat abundance and plays vital roles in biodiversity maintenance and faunal community resilience (Davidson et al. 2008; Bravo et al. 2009; Root‐Bernstein & Ebensperger 2012; Suggitt et al. 2018).
“Ecosystem engineers” are animal species that alter habitats through physical modifications (Jones et al. 1994, 1996). The most common “ecosystem engineers” are burrowing animals (Coggan et al. 2018), which can alter habitat heterogeneity by creating underground space and bare soil mounds (Crame & Willig 2005; Báldi 2008; Gooday et al. 2010). The burrowed microhabitats have considerable and semi‐permanent effects on micro‐topography, nutrient availability, and distribution (Davies et al. 2019), which provides multifunctional shelter for other organisms to hide, forage, and breed and for thermal buffering (Bragg et al. 2005; Desbiez & Kluyber 2013; Sun 2022).
The capacity of “ecosystem engineers” to improve habitat heterogeneity is usually identified by quantifying the volume of burrows. For example, European badgers (Meles meles) can dig up 12 m3 of burrows and excavate approximately 0.03 m3·ha−1·year−1 of soils (Coombes & Viles 2015). European bee‐eaters (Merops apiaster) can move approximately 0.00871 m3 of sand during nest construction (Casas‐Criville 2005). Generally, fluid displacement, burrow mold immersion, geometric computation based on morphometric measurements, and mathematical modeling of the burrow shape were used to estimate burrow volume (Kinlaw 1999; Smallwood & Morrison 1999; Whitford & Kay 1999; Bancroft et al. 2004; Bragg et al. 2005; Sawyer et al. 2012; Coombes & Viles 2015; Haussmann 2016). Burrow molds provide more accurate volume and morphometric measurements, which are particularly useful for complex or interconnected burrow systems (Reynolds & Wakkinen 1985). Geometric computations based on morphometric measurements are effective for single or multiple burrows (Eriksson & Eldridge 2014; Coombes & Viles 2015). However, studies assessing the landscape heterogeneity improvement of burrowing engineers are still scarce (Coombes & Viles 2015; Haussmann et al. 2016), although they provide scientific standards for the ecological conservation of these species (Coggan et al. 2018; Davies et al. 2019).
Underground soil piled up mounds have different properties from the surrounding surface soils, such as soil pH, concentration of carbon (C), nitrogen (N), phosphorus (P), and organic matter (Fleming et al. 2013; Mallen‐Cooper et al. 2019; Tania et al. 2020). Bare mounds can increase soil nutrient heterogeneity and have cascading effects on plant succession and animal utilization (Coggan et al. 2018), for example, altering the seed bank, promoting colonization by pioneer species, plant germination, and growth (Whitford & Kay 1999; Bancroft et al. 2005). At the same time, bare mounds provide shelter and thermal refugia for a range of commensal taxa (Warren & Büttner 2008; Fleischer et al. 2013). For example, the mounds created by European mole (Talpa europaea) are oviposition habitats for small copper (Lycaena phlaeas) within central European mesotrophic grasslands (Streitberger et al. 2014). To date, the ecological function and the morphological measurements of burrow mounds are rarely addressed.
Soil disturbances caused by burrowing animals are usually uneven due to the differences in burrow soil turnover mass and burrow distribution (Wu et al. 2004; Desbiez & Kluyber 2013; Halstead et al. 2020). It is essential to quantify not only the total capacity of soil turnovers but also their distribution patterns to evaluate the habitat heterogeneity improvement by burrowing animals (Jouquet et al. 2006; Di Blanco et al. 2020). Meanwhile, the fine‐scale distribution of soil disturbance is the basis for developing operational protection plans (Sharma et al. 2020; Wang et al. 2021; Zhang et al. 2021), which is a gap in ecosystem engineering biology.
The population of Chinese pangolin (Manis pentadactyla) has declined dramatically by up to 90% due to overhunting and habitat fragmentation within the past 40 years (Wu et al. 2002; Yin et al. 2016; Hua et al. 2020). Chinese pangolin is now critically endangered in China and listed as a threatened species by the IUCN (Jiang et al. 2016; Challender et al. 2019) and as a National First‐Class Protected Animal by China (National Forestry and Grassland Administration 2020). They were once widely distributed and are best known as termite predators (Shi 1985; Heath 1992) as well as skilled excavators (Lin 2011). A density of 110.8 burrows·ha−1 was reported in forests of Taiwan province (Lin 2011), implying that pangolin burrows are a key component of habitat heterogeneity within the Chinese pangolin range. However, the effects of pangolins on habitat heterogeneity improvement have been less addressed (Sun et al. 2021); despite that, the properties of pangolin burrows, such as diameter, depth, and density, were frequently documented (Wu et al. 2004; Fan 2005; Lin 2011). The lasting decline in the pangolin population inevitably reduces the total mass of soil turnover, which may considerably affect habitat heterogeneity and biodiversity in forests (Connell 1978; Root‐Bernstein & Ebensperger 2012).
During a multi‐year field investigation (2019–2023), we found that the remnant Chinese pangolin populations in the Guangdong province of southern China are mainly distributed in secondary and plantation forests. In this study, we selected three regions across Guangdong province (forests in Heping, Tianjingshan, and Wuqinzhang) where Chinese pangolins are frequently founded (Sun 2022), collected morphological data from 299 burrows, and calculated their soil turnover capacity at the landscape scale according to the standard procedure (Garkaklis et al. 2004; Casas‐Criville 2005; Valentine et al. 2013). We sampled soils from 103 fresh burrows in the above three regions to analyze the soil property alteration and assess the soil disturbance distribution pattern by pangolin (Kerley et al. 2004; Van Vuren & Ordeñana 2012; Wang et al. 2021). Results are expected to provide a critical understanding of the ecological roles of Chinese pangolin in proving habitat heterogeneity and restoring habitat quality.
MATERIALS AND METHODS
Study site
The investigation was conducted in forests of three regions across Guangdong province, southern China: (1) Wuqinzhang in Huizhou (22.5442°–23.3881°N; 114.5528°–115.4203°S) in December 2020; (2) Heping in Heyuan (24.0833°–24.7°N; 114.6833°–115.2667°S) from January to April 2021; and (3) Tianjingshan in Shaoguan (24.5333°–24.7666°N; 112.5°–113.25°S) from September to November 2020 (Fig. 1). Wuqinzhang is located in southern Guangdong and has a mean annual temperature (MAT) and mean annual precipitation (MAP) of 20°C and 1950 mm, respectively (Li & Wu 1999). Heping is located in east‐central Guangdong and has a MAT and MAP of 19.7°C and 1717.1 mm, respectively (Huang et al. 2019). Tianjingshan is located in northern Guangdong and has a MAT and MAP of 17.7°C and 1705 mm, respectively (Li et al. 2020).
Figure 1.

Burrow distribution of Chinese pangolins in forests of Tianjingshan, Heping, and Wuqinzhang across Guangdong province.
Field investigation
Pangolin burrows were investigated by survey transect covering a distance of 3–5 km. A total of 142 transects (56, 62, and 24 in Heping, Tianjingshan, and Wuqinzhang, respectively) covering a total distance of 685 km were investigated (see Supporting Information 1). Pangolin burrows were searched along each transect, identified according to the specific distinguish methods described in Supporting Information 2 (Lin 2011; Zhang et al. 2021), and in the Heping forest, some burrows were located in burnt areas.
Morphometric measurement and burrow calculation
Mound coverage area was determined by measuring the length of the vertical (A) and horizontal axes (B) parallel to the ground according to the equation: S (mound) = π × A/2 × B/2 (Borchard & Eldridge 2011; Coombes & Viles 2015).
Pangolin burrows usually have a simple structure and regular shape, with oval or round tunnel sections and thus can be regarded as tortuous elliptical columns (Fig. 2). The long (L) and short diameters (S) of the tunnels at the burrow entrance were measured with a long‐arm vernier caliper (Zimmerman 1990; McDonough et al. 2000). Burrow depth (D) was detected by inserting a flexible rod into the burrow bottom (Doonan & Stout 1994; McDonough et al. 2000). Burrow volume (V) was determined by the equation: V (burrow) = π × L/2 × S/2 × D (Sawyer et al. 2012; Eriksson & Eldridge 2014).
Figure 2.

A close‐up of a pangolin burrow, where subterranean soil has been excavated into a mound outside the entrance. Transverse diameter and shaft diameter of these burrows are: (a) 16 and 14 cm; (b) 13 and 12 cm; (c) 17 and 15 cm; (d) 16 and 16 cm; (e) 14 and 11 cm; (f) 14 and 11 cm; (g) 18 and 16 cm. Note: Some of the burrows, such as (e) are located in the burned area.
To maximize the function of healthy/sub‐healthy pangolin populations to improve habitat heterogeneity at the landscape scale, we used burrow density data (Db) recommended by Lin (2011) to determine the total burrow volume (TV) and total mound coverage area (TS) per ha as follows according to Garkaklis et al. (2004), Casas‐Criville (2005), and Valentine et al. (2013):
where V (burrow) is the volume of the pangolin burrow, S (mound) is the mound coverage area, Db is the burrow density, and “i” is the serial number of burrows.
Soil sampling and measurement
Fresh burrows were selected for soil sampling to eliminate the impact on soil properties from environmental factors (sunlight, rainfall etc.; for burrow age identification methods, see Supporting Information 3). Four samples were collected from each burrow: one from the center of the burrow mound (the intersection of the horizontal and vertical axes of a burrow mound) and three from 5 m away from the center where there was no burrow disturbance (control soil) (Gharajehdaghipour et al. 2016). Prior to sampling, mound surface litter and consolidated soil were scraped. A total of 412 soil samples (103 × 4) from 103 pangolin burrows were collected (61 in Heping, 22 in Tianjingshan, and 20 in Wuqinzhang; Table 2). The soils were air‐dried and ground for detecting soil bulk density; water content; soil pH; total C, N, and P and available N [NH4 +, NO3 −]; and microbial biomass C, N, and P concentrations. All analyses were performed according to the standard of Liu et al. (1996).
Table 2.
Burrow size, burrow volume, and mound coverage area
| Location | Minimum | Maximum | Mean | Estimated SD |
|---|---|---|---|---|
| Long diameter (cm) | 8 | 23 | 14.54 | 2.26 |
| Short diameter (cm) | 7 | 23 | 12.79 | 2.38 |
| Horizontal axis (cm) | 30 | 150 | 68.87 | 19.54 |
| Vertical axis (cm) | 47 | 258 | 123.97 | 40.55 |
| Depth (cm) | 20 | 560 | 153.22 | 99.03 |
| V (burrow) (m3) | 0.0025 | 0.116 | 0.024 | 0.017 |
| S (mound) (m2) | 0.13 | 2.98 | 0.75 | 0.46 |
| V (resting burrow) (m3) | 0.0053 | 0.116 | 0.044 | 0.0267 |
| V (foraging burrow) (m3) | 0.0025 | 0.024 | 0.021 | 0.0159 |
| S (resting burrow) (m2) | 0.271 | 2.98 | 0.813 | 0.055 |
| S (foraging burrow) (m2) | 0.13 | 1.16 | 0.667 | 0.008 |
| TV (m3·ha−1) | 2.66 ± 1.88 | |||
| TS (m2·ha−1) | 83.1 ± 51.0 | |||
Burrow microhabitat survey
When the distance between two burrows was less than 20 m, only the first burrow was selected to record microhabitat information (to reduce false duplications of microhabitat data and retain proximity distribution characteristics of pangolin burrows). Pangolin burrows were grouped into foraging and resting burrows (see Supporting Information 4; Wu et al. 2003, 2004; Fan 2005; Dorji 2017). Variables that may affect soil turnover and burrow categories (Bc) (Wu et al. 2003; Bhandari & Chalise 2014; Dorji 2017; Sharma et al. 2020) were recorded or extracted. Environmental variables such as elevation, slope, slope direction, slope position, forest type, and soil type and the distance to the nearest river were recorded. Anthropogenic factors were the distance to the nearest human settlement and the distance to the nearest foot trail (version 10.8, Wu et al. 2003; Katuwal et al. 2017; Dnpwc & Dof 2018; Sharma et al. 2020). Details of the variables are listed in Table 1.
Table 1.
The classification of variables
| Variables | 1 | 2 | 3 | 4 | 5 | 6 | Reference |
|---|---|---|---|---|---|---|---|
| Burrow category | Foraging burrow | Resting burrow | Karawita et al. (2018); Sun et al. (2021) | ||||
| Slope position | Lower | Middle lower | Middle | Middle upper | Upper | Top | Wu et al. (2003); Dnpwc and Dof (2018) |
| Soil type | Yellow soil | Red soil | Black soil | Yellow sandy soil | Red sandy soil | Yellow clay | Sharma et al. (2020) |
| Forest type | Broad‐leaved forest | Coniferous forest | Mixed needle and broad‐leaved forest | Shrub wood | Grassy meadows | Wu et al. (2003, 2004) |
Data analysis
The morphometric data of Chinese pangolin burrows in this study are shown in Table 2. The differences in burrow volume and mound coverage area between resting and foraging burrows were compared (Fig. 3). Because resting burrows are generally deeper than foraging burrows (Wu et al. 2003, 2004; Fan 2005; Dorji 2017), we treated burrow category not only as a covariate affecting soil turnover but also as a response variable for habitat variables in this study. The differences in soil properties (Table S1, Supporting Information) between burrow soils and control soils were compared (Fig. 4).
Figure 3.

The difference of burrow volume and mound coverage area between resting burrows and foraging burrows in three regions.
Figure 4.
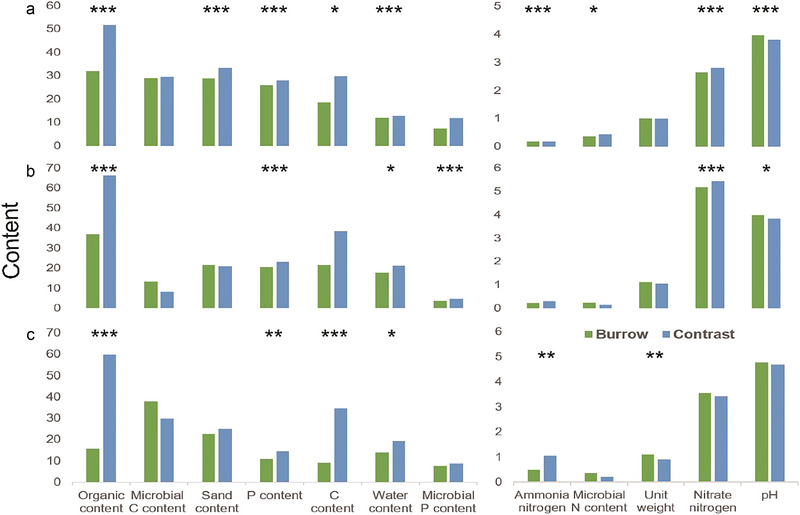
The difference of soil properties between pangolin burrows and control sites (natural habitat) in three regions. A, B, and C refer to Heping, Tianjingshan, and Wuqinzhang regions, respectively. Significant codes: 0.0001 “***,” 0.001 “**,” 0.01 “*,” 0.05 “.,” 0.1 “,” 1; of these indexes, P content has been divided by 10 for visualization purposes.
A structural equation model (SEM) was adapted to reveal the soil turnover distribution pattern by evaluating potential connections between habitat variables and burrow category, burrow volume, and mound coverage area (Fig. 5, Note: The blurred edges of the mounds in many of the burrows in the Tianjingshan region made it impossible to accurately calculate the mound coverage area, so this variable was not included in the model). Linkages between the burrow category and elevation, slope, slope position, slope direction, soil type, forest type, distance to the nearest river, distance to the nearest foot trail, and the distance to the nearest human settlement were determined as shown in Fig. 5. The goodness‐of‐fit for the model was determined from the maximum likelihood chi‐square tests. If P‐value was greater than 0.05, the model fits produced covariance matrices that were not significantly different from the observed covariance matrices (Kumar et al. 2017). Considering that the chi‐square test is influenced by sample size and data distribution, we reported the comparative fit index (CFI), root‐mean‐square error of approximation (RMSEA), and standardized root mean square residuals (SRMR). A good model fit was indicated by CFI > 0.95, RMSEA < 0.05, and SRMR < 0.08 (Rosseel 2012). We utilized Akaike's (AIC, Akaike 1974) and Bayesian information criterion (BIC, Hossain & King 1997) to compare the models with significant fits that determine the model closest to the unknown process that generates the patterns represented by the data (Burnham & Anderson 2002). To validate the specification of the SEM, the bivariate relationships representing the directional causal path in Fig. 5 were assessed using partial regression analysis. All analyses were performed using the “lavaan” package (Rosseel 2012) in R (version 4.1.3).
Figure 5.

Conceptual model of hypothesized relationships showing the direct and indirect effects of habitat and anthropogenic variables on burrow volume and mound coverage area. The diagram should be interpreted as a cascade of effects. The hypothesized cascade is that habitat and anthropogenic variables, elevation (El), slope (Sl), slope direction (Sd), slope position (Sp), soil type (St), forest type (Ft), distance to nearest foot trail (Df), distance to nearest human settlement (Dh), and distance to nearest river (Dr), directly affect burrow category (Bc) and then these nine variables indirectly affect burrow volume (V burrow) and mound coverage area (S mound).
RESULTS
A total of 299 Chinese pangolin burrows (185 in Heping, 60 in Tianjingshan, and 54 in Wuqinzhang) including 259 foraging burrows and 40 resting burrows, were identified in this investigation. The total burrow volume and the total mound coverage were 2.66 ± 1.88 m3·ha−1 (approximately 2.76 ± 1.95 t·ha−1) and 83.1 ± 51.0 m2·ha−1, respectively (Table 2), with a mean value of 0.024 m3 and 0.75 m2, respectively. The total mass of soil turnover and mound coverage area varied significantly across the burrows (P < 0.05). The resting burrows had significantly larger volumes than the foraging ones while both the two types of burrows had similar bare mounds (Fig. 3).
In Heping, there were significant differences in soil properties between the burrow and control soils, with higher available N, pH, and bulk density in the burrow than in the control soil. In Tianjingshan, burrow soils had higher sand content, bulk density, pH, and microbial biomass C and N concentrations than control soils. In Wuqinzhang, burrow soils had higher bulk density, pH, nitrate nitrogen, and microbial biomass C and N (Fig. 4; Table S1, Supporting Information).
In Heping, elevation and slope had significant effects on burrow volume (Fig. 6). Neither the slope direction, slope, nor the distance to the nearest human settlement had significant effects on the burrow category, while elevation, soil type, and distance to the nearest river had direct effects on burrow category and burrow volume. Forest type had the strongest effects on the burrow category (r = 0.617). Furthermore, the burrow category had positive and direct effects on burrow volume (r = 0.493), and burrow volume had positive effects on the mound coverage area (r = 0.553). The direct and indirect standardized path coefficients of the two variables are exhibited in Table 3. The resultant SEM models (χ2 = 2.510, df = 14.000, P = 1.000, CFI = 1.000, SRMR = 0.124, RMSEA = 0.000) had good fit (Fig. 6).
Figure 6.

Structural equation models (SEMs) of three regions. In the final SEM of the Heping, linking distance to nearest foot trail, distance to nearest river, slope position, elevation, soil type, and forest type to burrow category; linking burrow category, distance to nearest human settlement, distance to nearest river, slope, elevation, and soil type to burrow volume; and linking burrow volume to mound coverage area. In the final SEM of the Tianjingshan, linking distance to nearest human settlement, distance to nearest foot trail, distance to nearest river, soil type, and forest type to burrow category; linking burrow category to burrow volume. In the final SEM of the Wuqinzhang, linking distance to nearest human settlement, distance to nearest foot trail, elevation, and slope position to burrow category; linking burrow category, slope position, forest and type to burrow volume; and linking distance to nearest human settlement, distance to nearest foot trail, elevation, and soil type to mound coverage area. Bold lines represent statistically significant paths (P ≤ 0.05). The path coefficients between the variables are plotted on the path. The arrow indicates the direction of regression, and the coefficients are standardized for each causal path.
Table 3.
The path coefficient between variables
| Variables | Dh | Df | Dr | Sl | Sd | Sp | Ft | El | St | BC | V burrow |
|---|---|---|---|---|---|---|---|---|---|---|---|
| Heping Region | |||||||||||
| BC | −0.042 | −0.017 | 0.114 | 0.617 | 0.111 | 0.186 | |||||
| V burrow | −0.104 | −0.021 | −0.068 | 0.165 | 0.056 | 0.304 | 0.221 | 0.158 | 0.493 | ||
| S mound | −0.058 | −0.011 | −0.038 | 0.091 | 0.031 | 0.168 | 0.122 | 0.087 | 0.273 | 0.553 | |
| Tianjingshan Region | |||||||||||
| BC | 0.235 | −0.275 | 0.219 | −0.218 | 0.391 | ||||||
| V burrow | 0.115 | −0.134 | 0.107 | −0.106 | 0.191 | 0.488 | |||||
| Wuqinzhang Region | |||||||||||
| BC | 0.429 | −0.598 | 0.442 | 0.274 | |||||||
| V burrow | 0.198 | −0.276 | −0.041 | 0.283 | 0.127 | 0.462 | |||||
| S mound | −0.182 | 0.092 | −0.011 | 0.078 | −0.338 | −0.315 | 0.127 | 0.274 | |||
Abbreviations of covariates in the table indicate the full names are as follows: El, elevation; Sl, slope; Sd, slope direction; Sp, slope position; St, soil type; Ft, forest type; Df, distance to nearest foot trail; Dh, distance to nearest human settlement; Dr, distance to nearest river; Bc, burrow category; V burrow, burrow volume; S mound, mound coverage area.
In Tianjingshan, slope, slope direction, and slope position had no significant effects on burrow category or volume. Soil type (r = 0.391), distance to the nearest human settlement (r = 0.235), and distance to the nearest river (r = 0.219) showed positive, but the distance to the nearest foot trail (r = −0.275) and forest type (r = −0.218) showed negative effects on the burrow category. The burrow category had the strongest effects on burrow volume (r = 0.488). The resultant SEM models (χ2 = 4.244, df = 4.000, P = 0.374, CFI = 0.992, SRMR = 0.038, RMSEA = 0.032) had a good fit to the data for the purpose variables (Fig. 6).
In Wuqinzhang, slope position and forest type showed direct effects on burrow volume; soil type, distance to the nearest human settlement, and distance to the nearest foot trail had significant and direct effects on mound coverage area. Slope direction, slope, and distance to the nearest river had no significant effects on the burrow category, burrow volume, or mound coverage area. Furthermore, the distance to the nearest foot trail had negative effects on the mound coverage area via burrow category and burrow volume (r = −0.076). Elevation and distance to the nearest human settlement showed indirect effects via burrow category and burrow volume on the mound coverage area (see Table 3). Slope position had direct negative effects (r = −0.245) and positive effects via the burrow category on burrow volume (r = 0.204). Soil type had negative direct effects on the mound coverage area (r = −0.315). The forest type had positive direct effects on burrow volume (r = 0.283). The resultant SEM models (χ2 = 10.279, df = 9.000, P = 0.328, CFI = 0.989, SRMR = 0.027, RMSEA = 0.051) had a good fit with the data for the purpose variables (Fig. 6).
DISCUSSION
Vertical habitat heterogeneity improvement
Pangolins occupy key niches in ecosystems through soil disturbance, rather than just termite predators as traditionally assumed (Wu et al. 2005; Thapa 2013). In this study, we assessed the habitat heterogeneity alteration caused by pangolins for the first time by quantifying the capacity of soil turnover at the landscape scale. The average volume of pangolin burrows (0.024 m3) is relatively small than those of similar‐sized burrowing animals, such as Proteles cristatus (0.672 m3, Richardson 1985), Otocyon megalotis (0.251 m3, Skinner & Smithers 1990), Dasypus novemcinctus (0.0345 m3, Sawyer et al. 2012), and M. meles (12 m3, Coombers & Viles 2015). However, the total soil turnover mass at the landscape scale (2.66 ± 1.88 m3·ha−1) is larger than M. meles (0.03 m3, Coombers & Viles 2015), which is likely due to the strong burrowing ability of pangolins (Lin 2011; Sun et al. 2021) and to the fact that pangolins hardly reuse old burrows (Wu et al. 2004).
We found that burrow digging of pangolins profoundly expanded the underground space thus significantly increasing the habitat vertical heterogeneity, coupled with the multiple resources provided by the burrows' cascading effects on biological community distribution. The results identified the considerable influences on processes and functions and performance of service of pangolins in forest ecosystems. For instance, more than 65 animal species can use pangolin burrows, which provide thermal buffering for at least 40 species (Sun 2022) and food resources (e.g., termites, ants, seeds, small vertebrate prey) and shelter from predators for commensal species (Bragg et al. 2005; Sawyer et al. 2012; Coombes & Viles 2015; Haussmann 2016; Dawson et al. 2019). At the same time, commensal species attracted and concentrated by burrow resource form a complexly structured food web due to their inter‐ and intraspecific relationships (predation, competition, etc.), which contributes to ecosystem stability and resistance (Krause et al. 2003; Thebault & Fontaine 2010; Dawson et al. 2019).
Surficial habitat heterogeneity improvement
Our results showed the excavation by pangolins reduced soil water and sand content, increased soil bulk density, and partially explained the drying and surface compaction phenomenon (reduced permeability) of mounds. However, soil nutrients in the mounds decreased contrary to the results of studies in arid and semi‐arid regions (Bragg et al. 2005; Eldridge et al. 2012; Chapman 2013). This is manifested by a decrease in P, C, and available N concentrations, which may be due to the relatively dry surface of the mounds and the accumulation of less litter and humus (James et al. 2010). The disturbance increased the soil pH and microbial abundance, which was conducive to the availability of soil nutrients utilization by plants and the decomposition of organic and mineral matter (Shen et al. 2021; Serna‐Chavez et al. 2013). Bare mounds also improved surficial habitat heterogeneity, especially for habitats with sparse or monoculture vegetation. For example, the dense Dicranopteris dichotoma in the understory of southern China's forest often hinders shrub or tree regeneration (Yang et al. 2021). The excavation of pangolin burrows can destroy the rooting blanket layer of D. dichotoma and create bare conditions for the invasion and colonization of other species (Wu et al. 2004; Wang et al. 2021). Coupled with the soil properties of the mound, we suggest that the mounds may be conducive to the settlement of pioneer plant species that are drought‐resistant and have low nutrient requirements (e.g., Triadica sebifera (Linnaeus) Small). Thus, pangolin burrow microhabitats may facilitate early successional processes in habitats, which contradicts the notion that ecosystem engineers have a smaller impact in humid and semi‐humid regions (Davies et al. 2019).
Unevenness of habitat heterogeneity improvement by pangolin
Differences in the mass of soil turnover among pangolin burrows determined the unevenness of habitat heterogeneity improvement. Three SEM results showed that soil turnovers in the forests by pangolins were mainly dependent on the burrow category, despite the fact that some environmental variables had direct or indirect effects on them (Table 3). Indicated by volume (0.044 m3 vs. 0.021 m3) and mound coverage area (0.813 m2 vs. 0.667 m2, Table 2), we found that soil disturbance in resting burrows is relatively larger than in foraging burrows. Thus, the unevenness of habitat heterogeneity improvement in pangolins is associated with the distribution of resting burrows.
In addition, patterns of habitat heterogeneity improvement in pangolins varied across the three regions, likely due to the different vegetation structures or human disturbance intensity (Suwal et al. 2020; Tamang et al. 2022). In Heping and Wuqinzhang, a bigger mass of burrow overturn soil was found in grassy meadows (r = 0.304 and r = 0.283), rather than pure forests (e.g. Pinus forests) despite their relatively large area. The grassy meadows were mostly distributed in the hill‐tops with high elevation (r = 0.221; r = 0.127) and slope position (r = 0.056; r = 0.041), which had low plant diversity due to the dense cover of D. dichotoma or D. pedata; the distribution of burrows creates colonized bare ground for other pioneer plant species. However, in Tianjingshan, pangolins overturned more soil in broad‐leaved and coniferous and broad‐leaved mixed forests (r = −0.218); the elevation and slope position thus had no significant effects on soil turnover (Fig. 6). Coniferous forests are basically plantation forests (Cunninghamia lanceolata) with a bare understory. Pangolin burrows significantly increased surficial heterogeneity and provided shelter and foraging resources for organisms. Pangolins preferred to overturn more soils in sandy loam and yellow clay in Heping and Tianjingshan but had no obvious preference in Wuqinzhang (Table 3), which is inconsistent with Bhandari and Chalise (2014) and Sharma et al. (2020) who found that pangolin burrows were mostly distributed in red and brown soils. The possible reason is that sandy loam is soft and easy to dig, especially after rainfall and clay contributes to more solid burrow structure and longer service life.
The distance to the nearest river always affects burrow habitat selection (Wu et al. 2003; Suwal et al. 2020; Waseem et al. 2020) but did not significantly affect soil disturbance by pangolins in this study. The model results showed that pangolins tend to overturn more soil in areas far from human settlements in Tianjingshan and Wuqinzhang. The results are consistent with previous studies (Wu et al. 2003; Bhandari & Chalise 2014; Karawita et al. 2018; Shrestha et al. 2021), which suggested that pangolins prefer to inhabit forested areas rather than human‐disturbed areas. However, we found that resting burrows were frequently close to roads in the Heping and Wuqinzhang, due to the dense road network passing through the core distribution of pangolin. The programing of road networks should be considered in future conservation efforts, since vehicles and pedestrians may affect pangolin activity and increase the probability of discovering burrows.
Implication for pangolin conservation
In this study, we identified the ecological roles of Chinese pangolin in improving habitat heterogeneity and identified that pangolin can profoundly affect vegetation renewal and animal distribution in forest ecosystem. We suggest that the forest lands with dense resting burrows should be strictly protected as the core area pangolin conservation or reintroduction and that the road networks in this area should be carefully programmed to reduce human interference. Furthermore, burrow soil disturbance is more pronounced in areas of higher habitat homogeneity, for habitat heterogeneity improvement, such as meadows at high elevations, or on steep hillsides and mountains in Heping, in coniferous forests far away from human settlements in Tianjingshan, and in the upper mountains at high elevations in Wuqinzhang. Increased conservation efforts to rejuvenate wild populations and attempted reintroductions of pangolins in their historical range would benefit habitat quality and even biome recovery (Scheffers et al. 2014; McGowan et al. 2020), providing opportunities for studying the critical roles of pangolins in forest ecosystems.
CONFLICT OF INTEREST STATEMENT
The authors declare that they have no known competing financial interests or personal relationships that could have appeared to influence the work reported in this paper.
Supporting information
Supporting Information 1 Survey transects of pangolin burrow investigation in three region
Supporting Information 2 The difference between pangolin burrow and non‐pangolin burrows
Supporting Information 3
Supporting Information 4
Table S1 Changes of soil properties
ACKNOWLEDGMENTS
Thanks to Qiu Huangjie for field sampling investigation and data analysis; thanks to Mr. Zhang Yuxin from Chinese Academy of Sciences for modeling; thanks to Dr. Qi jinzhe from Northeast Forestry University for writing editing. This program was supported by the Guangdong Natural Science Foundation (No. 2022A1515010626) and the Forestry Science and Technology Innovation Project of Guangdong (2023KJCX023).
Sun S, Wei S, Dou H et al. (2025). Identifying habitat modification by Chinese pangolin in subtropical forests of southern China. Integrative Zoology 20, 361–375. 10.1111/1749-4877.12862
Contributor Information
Yuanwen KUANG, Email: kuangyw@scbg.ac.cn.
Yan HUA, Email: wildlife530@hotmail.com.
REFERENCES
- Akaike H (1974). A new look at the statistical model identification. IEEE Transactions on Automatic Control 19, 716–723. [Google Scholar]
- Bancroft WJ, Hill D, Roberts D (2004). A new method for calculating volume of excavated burrows: The geomorphic impact of Wedge‐Tailed Shearwater burrows on Rottnest Island. Functional Ecology 18, 752–759. [Google Scholar]
- Bancroft WJ, Roberts JD, Garkaklis MJ (2005). Burrowing sea birds drive decreased diversity and structural complexity, and increased productivity in insular‐vegetation communities. Australian Journal of Botany 53, 231–241. [Google Scholar]
- Betts MG, Wolf C, Pfeifer M et al. (2019). Extinction filters mediate the global effects of habitat fragmentation on animals. Science 366, 1236–1239. [DOI] [PubMed] [Google Scholar]
- Bhandari N, Chalise MK (2014). Habitat and distribution of Chinese pangolin (Manis p entadactyla Linnaeus, 1758) in Nagarjun forest of Shivapuri Nagarjun National Park, Nepal. Nepalese Journal of Zoology 2, 18–25. [Google Scholar]
- Borchard P, Eldridge DJ (2011). The geomorphic signature of bare‐nosed wombats (Vombatus ursinus) and cattle (Bos taurus) in an agricultural riparian ecosystem. Geomorphology 130, 365–373. [Google Scholar]
- Bragg CJ, Donaldson JD, Ryan PG (2005). Density of Cape porcupines in a semi‐arid environment and their impact on soil turnover and related ecosystem processes. Journal of Arid Environments 61, 261–275. [Google Scholar]
- Bravo LG, Belliure J, Rebollo S (2009). European rabbits as ecosystem engineers: Warrens increase lizard density and diversity. Biodiversity and Conservation 18, 869–885. [Google Scholar]
- Burnham KP, Anderson DR (2002). Model Selection and Multimodel Inference: A Practical Information‐Theoretic Approach. Springer Science & Business Media, New York. [Google Scholar]
- Báldi A (2008). Habitat heterogeneity overrides the species–area relationship. Journal of Biogeography 35, 675–681. [Google Scholar]
- Casas‐Criville A (2005). The European bee‐eater (Merops apiaster) as an ecosystem engineer in arid environments. Journal of Arid Environments 60, 227–238. [Google Scholar]
- Challender D, Wu S, Kaspal P et al. (2019). Manis pentadactyla. The IUCN Red List of Threatened Species 2019, eT12764A123585318. [Google Scholar]
- Chapman TF (2013). Relic bilby (Macrotis lagotis) refuge burrows: Assessment of potential contribution to a rangeland restoration program. Rangeland Journal 35, 167–180. [Google Scholar]
- Coggan NV, Hayward MW, Gibb H (2018). A global database and “state of the field” review of research into ecosystem engineering by land animals. Journal of Animal Ecology 87, 974–994. [DOI] [PubMed] [Google Scholar]
- Connell JH (1978). Diversity in tropical rain forests and coral reefs. Science 199, 1302–1310. [DOI] [PubMed] [Google Scholar]
- Coombes MA, Viles HA (2015). Population‐level zoogeomorphology: the case of the Eurasian badger (Meles meles L.). Physical Geography 36, 215–238. [Google Scholar]
- Cramer MJ, Willig MR (2005). Habitat heterogeneity, species diversity and null models. Oikos 108, 209–218. [Google Scholar]
- Davidson AD, Lightfoot DC, McIntyre JL (2008). Engineering rodents create key habitat for lizards. Journal of Arid Environments 72, 2142–2149. [Google Scholar]
- Davies G, Kirkpatrick J, Cameron E, Carver S Johnson C (2019). Ecosystem engineering by digging mammals: effects on soil fertility and condition in Tasmanian temperate woodland. Royal Society Open Science 6, 180621. [DOI] [PMC free article] [PubMed] [Google Scholar]
- Dawson SJ, Broussard L, Adams PJ et al. (2019). An outback oasis: The ecological importance of bilby burrows. Journal of Zoology 308, 149–163. [Google Scholar]
- Desbiez ALJ, Kluyber D (2013). The role of giant armadillos (Priodontes maximus) as physical ecosystem engineers. Biotropica 45, 537–540. [Google Scholar]
- Di Blanco YE, Desbiez ALJ, di Francescantonio D, Di Bitetti M (2020). Excavations of giant armadillos alter environmental conditions and provide new resources for a range of animals. Journal of Zoology 4, 311. [Google Scholar]
- DNPWC & DoF (2018). Pangolin Conservation Action Plan for Nepal (2018–2022). Department of National Parks and Wildlife Conservation and Department of Forests, Kathmandu, Nepal. [Google Scholar]
- Doonan TJ, Stout IJ (1994). Effects of gopher tortoise (Gopherus polyphemus) body size on burrow structure. American Midland Naturalist 131, 273–280. [Google Scholar]
- Dorji D (2017). Distribution, habitat use, threats and conservation of the critically endangered Chinese pangolin (Manis pentadactyla) in Samtse District, Bhutan. Rufford Small Grants, UK (unpublished).
- Eldridge DJ, Koen TB, Killgore A, Huang N, Whitford WG (2012). Animal foraging as a mechanism for sediment movement and soil nutrient development: Evidence from the semi‐arid Australian woodlands and the Chihuahuan Desert. Geomorphology 157–158, 131–141. [Google Scholar]
- Eriksson B, Eldridge D (2014). Surface destabilisation by the invasive burrowing engineer Mus musculus on a sub‐Antarctic island. Geomorphology 223, 61–66. [Google Scholar]
- Fan CY (2005). Burrow habitat of Formosan pangolins (Manis pentadactyla pentadactyla) at Feitsui Reservoir (M.Sc. thesis). "National" Taiwan University, Taipei, Taiwan, China. (In Chinese.) [Google Scholar]
- Fleischer K, Streitberger M, Fartmann T (2013). The importance of disturbance for the conservation of a low‐competitive herb in mesotrophic grasslands. Biologia 68, 398–403. [Google Scholar]
- Fleming PA, Anderson H, Prendergast AS, Bretz MR, Valentine LE, Hardy GES (2013). Is the loss of Australian digging mammals contributing to a deterioration in ecosystem function? Mammal Review 44, 2. [Google Scholar]
- Garkaklis MJ, Bradley JS, Wooller RD (2004). Digging and soil turnover by a mycophagous marsupial. Journal of Arid Environments 56, 569–578. [Google Scholar]
- Gharajehdaghipour T, Roth JD, Fafard PM, Markham JH (2016). Arctic foxes as ecosystem engineers: Increased soil nutrients lead to increased plant productivity on fox dens. Scientific Reports 6, 24020. [DOI] [PMC free article] [PubMed] [Google Scholar]
- Gong Zl, Tang Y (2016). Impacts of reforestation on woody species composition, species diversity and community structure in dry‐hot valley of the Jinsha River, southwestern China. Journal of Mountain Science 13, 2182–2191. [Google Scholar]
- Gooday AJ, Bett BJ, Escobar E et al. (2010). Habitat heterogeneity and its influence on benthic biodiversity in oxygen minimum zones. Marine Ecology 31, 125–147. [Google Scholar]
- Halstead LM, Sutherland DR, Valentine LE, Rendall AR, Coetsee AL, Ritchie EG (2020). Digging up the dirt: Quantifying the effects on soil of a translocated ecosystem engineer. Austral Ecology 45, 97–108. [Google Scholar]
- Hansen MC, Wang L, Song XP et al. (2020). The fate of tropical forest fragments. Science Advance 6, eaax8574. [DOI] [PMC free article] [PubMed] [Google Scholar]
- Haussmann NS (2016). Soil movement by burrowing mammals: A review comparing excavation size and rate to body mass of excavators. Progress Physical Geography 41, 29–45. [Google Scholar]
- Heath ME (1992). Manis pentadactyla . Mammalian Species 414, 1–6. [Google Scholar]
- Hossain MZ, King MI (1997). New information criteria for model selection. In: ESAM97. Conference Proceedings Volume 2: Econometric Theory; 2–4 Jul 1997, Melbourne, Australia. University of Melbourne, Victoria, Australia, pp. 585–612.
- Hua Y, Wei SC, Bao H, Wu SB (2020). Last chance to prevent the extinction of the Chinese pangolin. Oryx 54, 760–761. [Google Scholar]
- Huang S, Cai FC, Xiao ML, Xie YH (2019). Analysis on the climatic characteristics of precipitation in Heping County from 1965 to 2017. Guangdong Water Resources and Hydropower 10, 31–35. (In Chinese.) [Google Scholar]
- James AI, Eldridge DJ, Moseby KE (2010). Foraging pits, litter and plant germination in an arid shrubland. Journal of Arid Environments 74, 516–520. [Google Scholar]
- Jiang ZG, Jiang J, Wang Y, Zhang E, Zhang Y, Li L (2016). Red list of China's vertebrates. Biodivers Science 24, 500–551. (In Chinese.) [Google Scholar]
- Jones CG, Lawton JH, Shachak M (1994). Organisms as ecosystem engineers. Oikos 69, 373–386. [Google Scholar]
- Jones CG, Lawton JH, Shachak M (1996). Positive and negative effects of organisms as physical ecosystem engineers. Ecology 78, 1946–1957. [Google Scholar]
- Jouquet P, Dauber J, Lagerlöf J, Lavelle P (2006). Soil invertebrates as ecosystem engineers: Intended and accidental effects on soil and feedback loops. Applied Soil Ecology 32, 153–164. [Google Scholar]
- Karawita H, Perera P, Gunawardane P, Dayawansa N (2018). Habitat preference and den characterization of Indian Pangolin (Manis crassicaudata) in a tropical lowland forested landscape of southwest Sri Lanka. PLoS ONE 13, e0206082. [DOI] [PMC free article] [PubMed] [Google Scholar]
- Katuwal HB, Sharma HP, Parajuli K (2017). Anthropogenic impacts on the occurrence of the critically endangered Chinese pangolin (Manis pentadactyla) in Nepal. Journal of Mammalogy 98, 1667–1673. [Google Scholar]
- Kerley GI, Whitford WG, Kay FR (2004). Effects of pocket gophers on desert soils and vegetation. Journal of Arid Environments 58, 155–166. [Google Scholar]
- Kinlaw A (1999). A review of burrowing by semi‐fossorial vertebrates in arid environments. Journal of Arid Environments 41, 127–145. [Google Scholar]
- Krause AE, Frank KA, Mason DM, Ulanowicz RE, Taylor WW (2003). Compartments revealed in food‐web structure. Nature 426, 282–285. [DOI] [PubMed] [Google Scholar]
- Kumar P, Thomas S, Shahi C (2017). Linking resource availability and heterogeneity to understorey species diversity through succession in boreal forest of Canada. Journal of Ecology 106, 1266–1276. [Google Scholar]
- Li CM, Wang WX, Fu BX, Xiong L (2020). Characteristics of seasonal variability of climate in the area of Shaoguan. Guangdong Meteorology 6, 10–14. (In Chinese.) [Google Scholar]
- Li ZB, Wu XL (1999). Analysis of climate change characteristics in Huizhou in 44 years. Guangdong Meteorology S1, 58–61. (In Chinese.) [Google Scholar]
- Lin JS (2011). Home range and burrow utilization in Formosan pangolin (Manis pentadactyla pentadactyla) at Luanshan, Taitung (M.Sc. thesis). National Pingtung University of Science and Technology, Pingtung, Taiwan, China. (In Chinese.) [Google Scholar]
- Liu GS, Jiang NH, Zhang LD, Liu ZL (1996). Soil Physical and Chemical Analysis Description of Soil Profiles. Standard Press of China, Beijing. [Google Scholar]
- Mallen‐Cooper M, Nakagawa S, Eldridge DJ (2019). Global meta‐analysis of soil‐disturbing vertebrates reveals strong effects on ecosystem patterns and processes. Global Ecology and Biogeography 28, 661–679. [Google Scholar]
- Mcdonough CM, Delaney MJ, Le PQ, Blackmore MS, Loughry WJ (2000). Burrow characteristics and habitat associations of armadillos in Brazil and the United States of America. Revista De Biologia Tropical 48, 109–120. [Google Scholar]
- McGowan J, Beaumont LJ, Smith RJ et al. (2020). Conservation prioritization can resolve the flagship species conundrum. Nature Communications 11, 994. [DOI] [PMC free article] [PubMed] [Google Scholar]
- National Forestry and Grassland Administration (2020). Announcement of the national forestry and grassland administration (No.12 of 2020).
- Reynolds TD, Wakkinen WL (1985). Characteristics of the burrows of four species of rodents in undisturbed soils in Southeastern Idaho. American Midland Naturalist 118, 245–250. [Google Scholar]
- Richardson PRK (1985). The social behaviour and ecology of the aardwolf, Proteles cristatus (Sparrman, 1783) in relation to its food resources (PhD thesis). University of Oxford, Oxford, UK. [Google Scholar]
- Root‐Bernstein M, Ebensperger LA (2012). Meta‐analysis of the effects of small mammal disturbances on species diversity, richness and plant biomass. Austral Ecology 38, 289–299. [Google Scholar]
- Rosseel Y (2012). lavaan: An R package for structural equation modeling. Journal of Statistical Software 48, 1–36. [Google Scholar]
- Sawyer C, Brinkman D, Walker V, Covington T, Stienstraw E (2012). The zoogeomorphic characteristics of burrows and burrowing by nine‐banded armadillos (Dasypus novemcinctus). Geomorphology 157–158, 122–130. [Google Scholar]
- Scheffers BR, Edwards DP, Diesmos A, Williams SE, Evans TA (2014). Microhabitats reduce animal's exposure to climate extremes. Global Change Biology 20, 495–503. [DOI] [PubMed] [Google Scholar]
- Serna‐Chavez HM, Fierer N, van Bodegom PM (2013). Global drivers and patterns of microbial abundance in soil. Global Ecology and Biogeography 22, 1162–1172. [Google Scholar]
- Sharma HP, Rimal B, Zhang M et al. (2020). Potential distribution of the critically endangered Chinese pangolin (Manis pentadactyla) in different land covers of Nepal: Implications for conservation. Sustainability 12, 1282. [Google Scholar]
- Shen Y, Tian DS, Hou J et al. (2021). Forest soil acidification consistently reduces litter decomposition irrespective of nutrient availability and litter type. Functional Ecology 35, 2753–2762. [Google Scholar]
- Shi YQ (1985). Ant eating habits of pangolins. Wild Animals 28, 11–13. (In Chinese.) [Google Scholar]
- Shrestha A, Bhattarai S, Shrestha B, Koju NP (2021). Factors influencing the habitat choice of pangolins (Manis spp.) in low land of Nepal. Ecology and Evolution 11, 14689–14696. [DOI] [PMC free article] [PubMed] [Google Scholar]
- Skinner JD, Smithers RHN (1990). The Mammals of the Southern African Subregion. University of Pretoria, Pretoria. [Google Scholar]
- Smallwood KS, Morrison ML (1999). Estimating burrow volume and excavation rate of pocket gophers (Geomyidae). Southwestern Naturalist 44, 173–183. [Google Scholar]
- Streitberger M, Rose S, Gabriel H, Fartmann T (2014). The role of a mound‐building ecosystem engineer for a grassland butterfly. Journal of Insect Conservation 18, 745–751. [Google Scholar]
- Suggitt AJ, Wilson RJ, Isaac NJB et al. (2018). Extinction risk from climate change is reduced by microclimatic buffering. Nature Climate Change 8, 713–717. [Google Scholar]
- Sun S (2022). Study on the characteristics of Chinese pangolin burrow and the utilization of commensals for pangolin burrow thermal refuge (M.Sc. thesis). Northeast Forestry University, Haerbin, Heilongjiang. (In Chinese.) [Google Scholar]
- Sun S, Dou HL, Wei SC et al. (2021). A review of the engineering role of burrowing animals: Implication of Chinese pangolin as an ecosystem engineer. Journal of Zoological Research 3, 1–20. [Google Scholar]
- Suwal TL, Thapa A, Gurung S et al. (2020). Predicting the potential distribution and habitat variables associated with pangolins in Nepal. Global Ecology and Conservation 23, e01049. [Google Scholar]
- Tamang S, Sharma HP, Belant JL (2022). Foraging burrow site selection and diet of Chinese pangolins, Chandragiri Municipality, Nepal. Animals: An Open Access Journal from MDPI 12, 2518. [DOI] [PMC free article] [PubMed] [Google Scholar]
- Tania DA, Olivier B, François M, Adeline B, Erick P, Thierry D (2020). Harvester ants as ecological engineers for Mediterranean grassland restoration: Impacts on soil and vegetation. Biological Conservation 245, 108547. [Google Scholar]
- Thapa P (2013). An overview of Chinese pangolin (Manis pentadactyla): Its general biology, status, distribution and conservation threats in Nepal. Initiation 5, 164–170. [Google Scholar]
- Thebault E, Fontaine C (2010). Stability of ecological communities and the architecture of mutualistic and trophic networks. Science 329, 853–856. [DOI] [PubMed] [Google Scholar]
- Tian L, Tao Y, Fu W, Li T, Ren F, Li MY (2022). Dynamic simulation of land use/cover change and assessment of forest ecosystem carbon storage under climate change scenarios in Guangdong Province, China. Remote Sensing 14, 2330. [Google Scholar]
- Valentine LE, Anderson A, Hardy GESJ, Fleming PA (2013). Foraging activity by the southern brown bandicoot (Isoodon obesulus) as a mechanism for soil turnover. Australian Journal of Zoology 60, 419–423. [Google Scholar]
- Van Vuren DH, Ordeñana MA (2012). Factors influencing burrow length and depth of ground‐dwelling squirrels. Journal of Mammalogy 93, 1240–1246. [Google Scholar]
- Wang JW, Wang J, Dou HL et al. (2021). Winter burrow habitat selection of Chinese pangolin on Neilingding Island in Shenzhen city. Chinese Journal of Wildlife 42, 700–705. (In Chinese.) [Google Scholar]
- Warren SD, Büttner R (2008). Active military training areas as refugia for disturbance‐dependent endangered insects. Journal of Insect Conservation 12, 671–676. [Google Scholar]
- Waseem M, Khan B, Mahmood T et al. (2020). Occupancy, habitat suitability and habitat preference of endangered indian pangolin (Manis crassicaudata) in Potohar Plateau and Azad Jammu and Kashmir, Pakistan. Global Ecology and Conservation 23, e01135. [Google Scholar]
- Whitford WG, Kay FR (1999). Biopedturbation by mammals in deserts: A review. Journal of Arid Environments 41, 203–230. [Google Scholar]
- Wu SB, Liu NF, Ma GZ, Xu ZR, Chen H (2003). Habitat selection by Chinese pangolin (Manis pentadactyla) in winter in Dawuling Natural Reserve. Mammalia 67, 493–501. [Google Scholar]
- Wu SB, Ma G, Chen H, Xu ZR, Li YY, Liu NF (2004). A preliminary study on burrow ecology of Manis pentadactyla . Chinese Journal of Applied and Environmental Biology 15, 401–407. (In Chinese.) [PubMed] [Google Scholar]
- Wu SB, Ma GZ, Liao QX, Lu KH (2005). Studies of Conservation Biology on Chinese Pangolin. Chinese Forest Press, Beijing. (In Chinese.) [Google Scholar]
- Wu SB, Ma GZ, Tang M, Chen H, Liu NF (2002). Current situation and conservation strategies of pangolin resources in China. Journal of Natural Resources 17, 0174–0180. (In Chinese.) [Google Scholar]
- Yang L, Huang YH, Lima L et al. (2021) Rethinking the ecosystem functions of Dicranopteris, a widespread genus of ferns. Frontiers in Plant Science 11, 581513. [DOI] [PMC free article] [PubMed] [Google Scholar]
- Yin F, L LL, Meng M (2016). Pangolin trade and protection. Chinese Journal of Wildlife 2, 157–205. (In Chinese.) [Google Scholar]
- Zhang F, Wang W, Mahmood A, Wu S, Li J, Xu N (2021). Observations of Chinese pangolins (Manis pentadactyla) in mainland China. Global Ecology and Conservation 26, e01460. [Google Scholar]
- Zimmerman JW (1990). Burrow characteristics of the nine‐banded armadillo, Dasypus novemcinctus . Southwestern Naturalist 35, 226–227. [Google Scholar]
Associated Data
This section collects any data citations, data availability statements, or supplementary materials included in this article.
Supplementary Materials
Supporting Information 1 Survey transects of pangolin burrow investigation in three region
Supporting Information 2 The difference between pangolin burrow and non‐pangolin burrows
Supporting Information 3
Supporting Information 4
Table S1 Changes of soil properties